There has been a lot of debate over whether or not deflation is good for an economy. The two most important periods of deflation in modern history are the Great Depression and Japan's Lost Decade. These have already been studied in great detail, so I am not going to discuss them here. Many people, such as the folks at Mises.org have pointed out that price deflation was much more common in the 1800's, and did not always result in lower GDP growth. In this blog I will try to examine the relationship b etween yearly changes in the consumer price index (CPI), and yearly changes in real GDP. This data was d ownloaded fromMeasuring Worth. I will attempt to compare and contrast the years from 1790-1913, with years of the post-Federal Reserve era: 1914-2009. First I want to mention that the relationship between CPI and GDP can be seen very cleary, if nominal GDP is used instead of real GDP. But I am n ot going to discuss these graphs because I believe that would be misleading. Ifnominal GDP increases by 3%, but the CPI also increases by 3 %, then we haven't really gained anything in terms ofpurchasing power. So I will stick to real GDP for my analysis. First, here is the modern period shown in Figure 1: A timeline of the yearly percentage changes in both CPI and real GDP, from 1914-2009. -15.00% -10.00% -5.00% 0.00% 5.00% 10.00% 15.00% 20.00% 25.00% 191 0 1920 1930 1940 1950 1960 1970 1980 199 0 2000 201 0 2020 CPI % Change Real GDP % Ch ange Now, we can contrast this with Figure 2, which shows the same data, for 1791-1913: -15.00% -10.00% -5.00% 0.00% 5.00% 10.00% 15.00% 20.00% 25.00% 1780 1800 1820 1840 1860 1880 1900 1920 CPI % Change Real GDP % Change
There has been a lot of debate over whether or not deflation is good for an economy. The two most important
eriods of deflation in modern history are the Great Depression and Japan's Lost Decade. These have already been stu
great detail, so I am not going to discuss them here.
Many people, such as the folks at Mises.org have pointed out that price deflation was much more common in
800's, and did not always result in lower GDP growth. In this blog I will try to examine the relationship between yeahanges in the consumer price index (CPI), and yearly changes in real GDP. This data was downloaded from Measur
Worth. I will attempt to compare and contrast the years from 1790-1913, with years of the post-Federal Reserve era:
914-2009.
First I want to mention that the relationship between CPI and GDP can be seen very cleary, if nominal GDP i
ed instead of real GDP. But I am not going to discuss these graphs because I believe that would be misleading. If
ominal GDP increases by 3%, but the CPI also increases by 3%, then we haven't really gained anything in terms of urchasing power. So I will stick to real GDP for my analysis.
rst, here is the modern period shown in Figure 1: A timeline of the yearly percentage changes in both CPI and realDP, from 1914-2009.
or a quick history lesson, here are some key events which correspond with some of the various peaks and valleys of
ese graphs:
812-1815 - War of 1812
817 - NYSE founded
819 - Panic of 1819 (some other panics can be seen here)861-1865 - American Civil War
873-1879 (approx.) - Depression of 1873–79, AKA the "long depression"
893-1897 - Depression of 1893
907 - The Panic of 1907.913 - Creation of the Federal Reserve
here are a lot of ups and downs here, so rather than trying to squint at these graphs, I have made several scatter plothich allow us to analyze the data more easily.
or each of these plots, I am also going to give the Pearson Coefficient (to 2 decimal places). This is a way of measure degree of correlation between two variables using a scale of -1 to +1. Basically, a value of zero is randomness/no
lationship. A value of +1 is a perfect 45-degree line: "/", and a value of -1 is a 45-degree line going the other directi
".
gure 6: CPI % Change vs Real GDP % Change, 1791-1913
gain we see the exact same degree of correlation in figures 8 and 9, which indicates that these numbers might actuaean something! More inflation (or, less deflation) generally results in higher GDP growth. Although I should point
at the correlation value of 0.13 is not very high.
o illustrate a point that I made earlier, I will post one plot that uses nominal GDP growth instead of real GDP growt
gure 11: CPI % Change vs Nominal GDP % Change, 1791-1913earson = 0.85
-20.00%
-10.00%
0.00%
10.00%
20.00%
30.00%
-20.00
%
-10.00
%
0.00% 10.00% 20.00% 30.00%
CPI % Change
Nominal GDP
% Change
1791-1913
his shows us conclusively that price inflation tends to increase the growth rates of both the CPI and the nominal GDsulting in a much larger degree of correlation than what we saw in the real GDP plots.
verages:
his seems like as good a time as any to throw some numbers at you, so here they are:
verage CPI % change, 1791-1913: 0.23%verage real GDP % change, 1791-1913: 3.85%verage real GDP % change, 1791-1913 (during the 50 inflationary years): 4.64%
verage real GDP % change, 1791-1913 (during the 54 deflationary years): 3.39%
verage real GDP % change, 1791-1913 (during the 18 neutral years): 5.50%
verage CPI % change, 1914-2009: 3.41%
verage real GDP % change, 1914-2009: 3.37%verage real GDP % change, 1914-2009 (during the 82 inflationary years): 4.06%
verage real GDP % change, 1914-2009 (during the 13 deflationary years): -1.18%
verage real GDP % change, 1914-2009 (during the 1 neutral year): 6.05%
able prices seem to be the best possible scenario for high real GDP growth. Inflation is the second-best option, and
eflationary years produce the worst results.
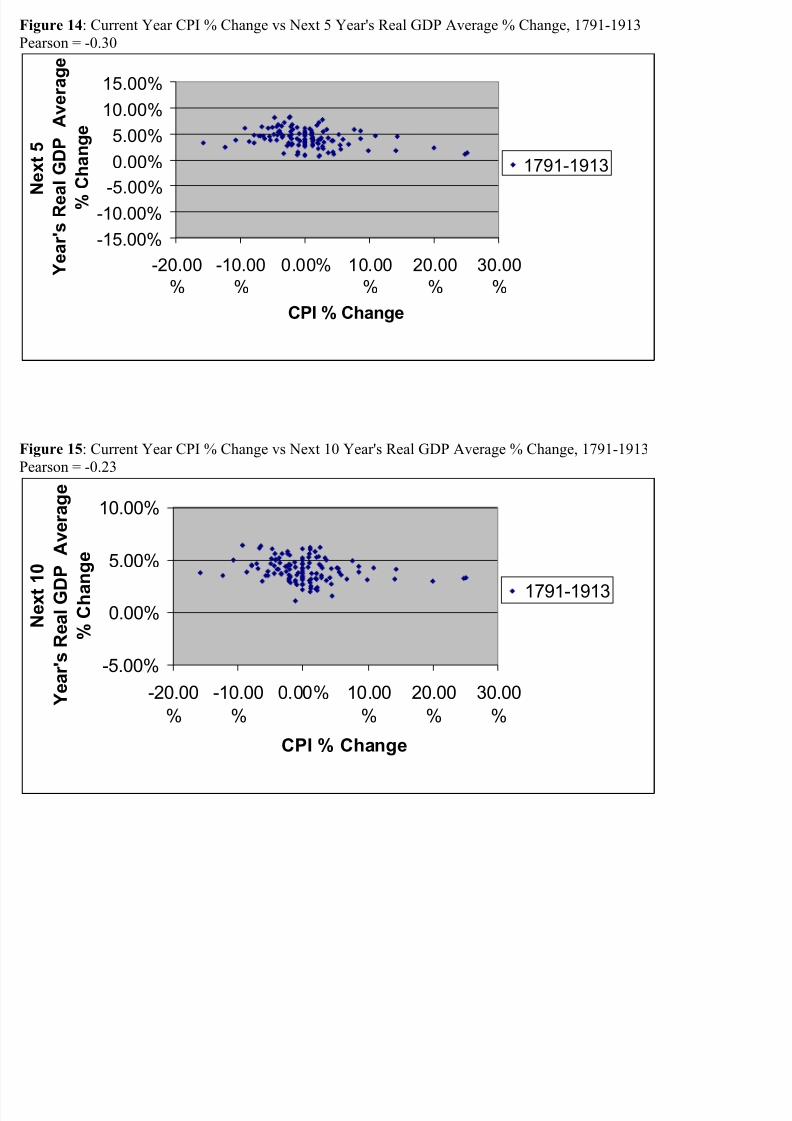
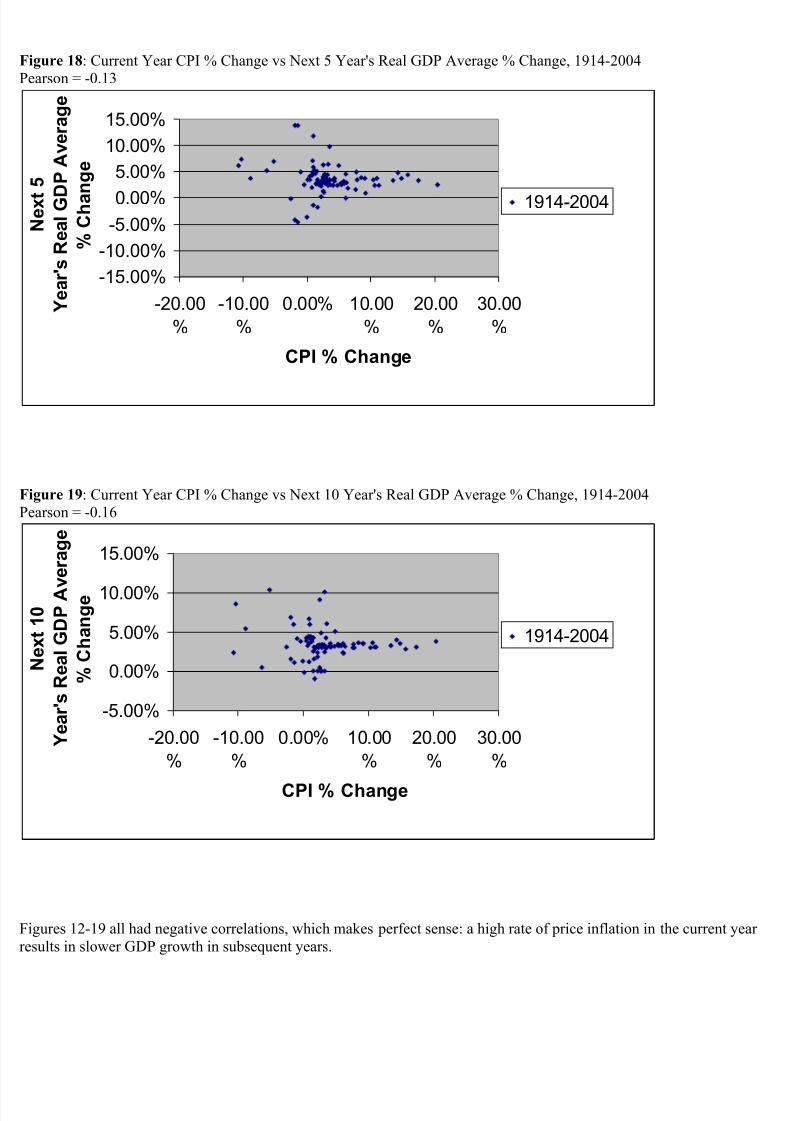
ooking Ahead:
ow, I will examine the effect that inflation has on future GDP growth. Fig. 12 shows the CPI % change for the currear, compared to the real GDP % change for the next year. Fig's 13-15 compare current-year CPI changes to the ave
nnual GDP growth over the next 3, 5, and 10 years:
onclusions:Comparing the two time periods (1790-1913 and 1914-2009), I have not found many fundamental differences
eflation has become much less common since, 1914, but the behavior of the economy seems very similar. In both
eriods, higher inflation generally correlates with higher real GDP growth in that year. Periods of high growth and hiice inflation are generally followed by periods of slower growth, or even negative growth.
Bear in mind that these are just correlations, so if you try to draw conclusions, it leads to a lot of chicken-or-th
gg types of problems. Is GDP influencing the CPI, or is it the other way around? Probably both, and sometimes may
either. Two variables can show a correlation if certain events influence both of those variables in a similar way. Butoesn't mean that the two variables are necessarily influencing each other.
Even when you look at the correlation between current-year inflation and future GDP growth, that still doesn'
ecessarily mean that high inflation is the cause of lower GDP growth in the future. It just illustrates that boom-and-bycles are a real phenomenon; if the economy is growing at a high rate in one year, then it will probably grow at a slo
te over the next few years (and vice versa). In future blogs I'll try to dig deeper and hopefully gain a better