Page 1
Deformation of thin surfacing
under
BS EN 12697 - 22
Final Project Report
Project Ref B557/00 Deformation of thin surfacing under
BS EN 12697 - 22 Page 1 of 29
© Chris Britton Consultancy 2011 25/03/2011
Deformation of thin surfacing under
BS EN 12697 - 22
Final Project Report
Project Ref: B557/00
Page 2
Deformation of thin surfacing
under
BS EN 12697 - 22
Final Project Report
Project Ref B557/00 Deformation of thin surfacing under
BS EN 12697 - 22 Page 2 of 29
© Chris Britton Consultancy 2011 25/03/2011
Version History
Project Ref: B557/00 File Ref: B557 Deformation of Thin Surfacing
Final Report V0.4
V1.0 Draft for comment by
client
C
Roberts
P
Schupke
P
Schupke
P
Schupke
25/3/11
Prepared
By
Checked
By
Reviewed
By
Approved
By
Date
Revision Issue Status
Chris Britton Consultancy
Westbrook Mills
Borough Rd
Godalming
Surrey
GU7 2AZ
email: [email protected]
Phone: +44 (0)1483 528370
Fax: +44 (0)1483 428957
Page 3
Deformation of thin surfacing
under
BS EN 12697 - 22
Final Project Report
Project Ref B557/00 Deformation of thin surfacing under
BS EN 12697 - 22 Page 3 of 29
© Chris Britton Consultancy 2011 25/03/2011
Contents
1 Introduction .................................................................................................................... 4
2 Overview of the Wheel-tracking test methods .................................................................... 4
2.1 BS598-110 wheel-tracking test .................................................................................. 4 2.2 BS EN 12697-22 wheel-tracking tests.......................................................................... 5
3 Current Specifications for thin surfacing ............................................................................. 6
3.1 Design Manual for Roads and Bridges (DMRB) and Specification for Highway Works
(MCHW) ............................................................................................................................. 6 3.2 British Board of Agrément HAPAS Roads and Bridges (BBA HAPAS) Certificates............... 7 3.3 PD 6691:2010 Guidance on the use of BS EN 13108 Bituminous Mixtures – Material
Specifications ...................................................................................................................... 8 4 Literature Review ............................................................................................................ 9
4.1 Implications of implementing the European asphalt test methods ............................... 10 4.2 European Standards for Asphalt............................................................................... 12 4.3 The harmonised European standard test methods for asphalt mixtures ....................... 13 4.4 Additional Information ........................................................................................... 13
5 Laboratory testing ......................................................................................................... 15
5.1 Material samples ................................................................................................... 15 5.2 Testing procedure .................................................................................................. 16 5.3 Test results summary ............................................................................................. 17
6 Discussion of results....................................................................................................... 22
6.1 Wheel-tracking rate................................................................................................ 22 6.2 Maximum rut depth ............................................................................................... 23 6.3 Proposed updates to the specification ...................................................................... 25 6.4 Summary of findings............................................................................................... 26
7 References.................................................................................................................. 28
Page 4
Deformation of thin surfacing
under
BS EN 12697 - 22
Final Project Report
Project Ref B557/00 Deformation of thin surfacing under
BS EN 12697 - 22 Page 4 of 29
© Chris Britton Consultancy 2011 25/03/2011
1 Introduction
The adoption of the European Standards for Asphalt Test Methods has meant the withdrawal of
the British Standards that have traditionally been used to specify the test methods for measuring
Wheel-track rutting and the corresponding acceptable rut rates and rut depths. Chris Britton
Consultancy was requested by the Highways Agency to undertake a research task with the aim
of deriving equivalent values using the European tests compared to the British Standards for
Thin Surfing to allow updating of the current limits given in the Notes for Guidance on the
Specification for Highways Works.
The first stage of this research was to undertake a literature review, to identify if any
comparative studies had already been undertaken to compare the two standards and the
related wheel-tracking test methods and report any conclusions that can be drawn from the
previous research.
2 Overview of the Wheel-tracking test methods
The wheel-tracking test methods vary between the British Standard, BS-598-110, and the
European Standard, BS EN 12697-22. A summary of the test methods is given in the following
two sections.
2.1 BS598-110 wheel-tracking test
BS598-110 uses six material samples, conditioned at the required test temperature for 4-16
hours, and tracked for 45 minutes under a solid rubber tyre of width 50mm and load 520N at a
rate of 21.0±2 cycles per minute. A single measurement point at the centre of the sample is used
to measure the deformation and the change in deformation over the last third of the test is used
to calculate the rate of deformation in mm/h. The total deformation is also measured to provide
the maximum rut depth at the end of the testing cycle.
Page 5
Deformation of thin surfacing
under
BS EN 12697 - 22
Final Project Report
Project Ref B557/00 Deformation of thin surfacing under
BS EN 12697 - 22 Page 5 of 29
© Chris Britton Consultancy 2011 25/03/2011
2.2 BS EN 12697-22 wheel-tracking tests
BS EN 12697-22 has three different test methods, two with the small size device (Procedures A
and B) and one with the large size device. The large size device is used for materials designed for
wheel loads greater than or equal to 13t and therefore we did not consider using this test in this
research task.
Procedure A test method uses six material samples conditioned at the test temperature for 4-24
hours, and tracked for 1,000 cycles under a solid rubber tyre of width 50mm and load 700N at a
rate of 26.5±1 cycles per minute, with the first 5 cycles used for conditioning. A single
measurement point at the centre of the sample is used to calculate the rate of deformation over
the last 300 cycles of the test in µm/cycle, and the total deformation for the maximum rut
depth.
Procedure B test method uses two samples conditioned at the test temperature for at least 1
hour, and tracked for 10,000 cycles under a solid rubber tyre of width 50mm and load 700N at a
rate of 26.5±1 cycles per minute, with the first 5 cycles used for conditioning. The deformation is
measured as the mean of 25 equally spaced measurement points and the wheel-tracking rate is
calculated over the range of 5,000-10,000 cycles in mm/1000 cycles. Under this procedure, the
proportional rut depth, as a percentage of the sample thickness, is calculated rather than the
actual rut depth.
The summaries above show that the BS598-110 and the BS EN 12697-22 Procedure A are similar
test methods. However, BS EN 13108-20 specifies that Procedure A is for use with HRA samples,
whilst Stone Mastic Asphalt and Asphalt Concrete samples should be tested using Procedure B,
which has significant differences to the British Standard.
Page 6
Deformation of thin surfacing
under
BS EN 12697 - 22
Final Project Report
Project Ref B557/00 Deformation of thin surfacing under
BS EN 12697 - 22 Page 6 of 29
© Chris Britton Consultancy 2011 25/03/2011
3 Current Specifications for thin surfacing
3.1 Design Manual for Roads and Bridges (DMRB) and Specification for
Highway Works (MCHW)
The Highways Agency specification for thin surfacing materials on the strategic road network is
set out in HD37/99 (DMRB 7.5.2) and the accompanying Clause 942 of the Specification
(MCHW1) and NG942 Notes for Guidance (MCHW2).
Section 6.3 of HD37/99 states that;
“When used on trunk roads including motorways, proprietary thin wearing course systems shall
have a British Board of Agrément HAPAS Roads and Bridges Certificate appropriate for the site
classification and the level of traffic in commercial vehicles/lane/day.”
The Performance Levels for Thin Surface Course Systems, as set out in Clause 942 (MCHW1), are
not currently based on the test methods in BE EN 12697-22, but instead refer to the
requirements of the HAPAS certificate, specifying that;
“The wheel-tracking levels of the thin surface course system, as recorded on the British Board of
Agrément HAPAS Roads and Bridges Certificate, shall be Level 3 unless otherwise stated in
Appendix 7/1.”
The accompanying Notes for Guidance, NG942 (MCHW2) states that the deformation resistance
of thin surface course systems can be set in terms of the wheel-tracking level stated in the BBA
HAPAS Certificate. The site classifications for Resistance to Permanent Deformation of Thin
Surface Course Systems, to be used to determine the requirements of the BBA HAPAS certificate
are given in Table NG 9/28, with Table NG 9/29 showing the test temperature to use and the
performance requirements. For Level 3 sites, which covers all motorways and dual carriageways
with traffic at design life of over 4001 Commercial vehicles per lane per day, which is likely to be
the majority of the HA strategic network, the current requirements are as follows:
Page 7
Deformation of thin surfacing
under
BS EN 12697 - 22
Final Project Report
Project Ref B557/00 Deformation of thin surfacing under
BS EN 12697 - 22 Page 7 of 29
© Chris Britton Consultancy 2011 25/03/2011
Table 1. Wheel-tracking Levels (Table NG 9/29, NG 942 MCHW2) Level Test
temperature
(°C)
Specimen
thickness
(mm)
Criteria Maximum
wheel-tracking
rate (mm/h)
Maximum rut
depth (mm)
Mean* 5.0 7.0 ≥30
Maximum† 7.5 10.5
Mean* 1/6 x thickness# 7/30 x thickness
#
3 60
<30 Maximum
† 1/4 x thickness
# 7/20 x thickness
#
*Mean = mean result of 6 consecutive determinations on individual specimens
†Maximum = maximum result from 6 consecutive determinations on individual specimens
#Thickness = thickness of specimen tested = nominal depth + thickness of regulating ability
3.2 British Board of Agrément HAPAS Roads and Bridges (BBA HAPAS)
Certificates
Section 3.1 above sets out the requirement for thin surfacing materials to have a BBA HAPAS
certificate meeting the Performance Levels appropriate to the site as specified in NG 942
(MCHW2).
The assessment and certification procedure for BBA HAPAS approval requires, amongst other
tests, laboratory Wheel-tracking testing on a material sample at a BBA approved laboratory. The
Guideline Document for the Assessment and Certification of Thin Surfacing Systems for
Highways (BBA, May 2008) specifies the method of testing to determine the wheel-tracking rate
in Appendix A1, and the required Performance Levels in Appendix B.
Appendix A1, point 6, specifies that for the HAPAS Certification testing, “the test procedure
described in BS 598-110:1998 shall be used”, with the wheel-tracking rate calculated and
reported in accordance with the same specification.
There are four wheel-tracking performance levels for which a thin surfacing material can get
HAPAS certification, and there are given in Table B1 and reproduced below in Table 2. Level 3 is
the level specified for use by the HA in Clause 942 of the Specification (MCHW1) and has the
same performance levels as set out in NG 942 (MCHW2), reproduced in Table 1 above.
Page 8
Deformation of thin surfacing
under
BS EN 12697 - 22
Final Project Report
Project Ref B557/00 Deformation of thin surfacing under
BS EN 12697 - 22 Page 8 of 29
© Chris Britton Consultancy 2011 25/03/2011
Table 2. Wheel-tracking Levels (Table B1 BBA HAPAS, May 2008) Level Test
Temperature
Maximum wheel-tracking in
layers 30mm thick or more
Maximum wheel-tracking in
layers less than 30mm
°C Rate (mm/h)
mean/max
Rut depth
(mm)
mean/max
Rate (mm/h)
mean/max
Rut depth
(mm)
mean/max
3 60 5.0/7.5 7.0/10.5 0.167/0.25 0.233/0.35
2 45 2.0/3.0 4.0/6.0 0.07/0.10 0.133/0.20
1 45 5.0/7.5 7.0/10.5 0.167/0.25 0.233/0.35
0 No requirement
3.3 PD 6691:2010 Guidance on the use of BS EN 13108 Bituminous Mixtures
– Material Specifications
PD 6691:2010 (BSI, 2010) provides guidance as to the use of the BS EN 13180, with Annex D
giving guidance on producing Stone Mastic Asphalt that conforms to BS EN 13108-5. The
guidance document gives the “UK choice for the BS EN 13108-5:2006, 5.9, requirements”.
Although there is no requirement for the Thin Surfacing Materials to conform to the BS EN
13108 standard, due to them being proprietary materials covered by BBA HAPAS certificates,
there are similarities in the materials, and both have the same current wheel-tracking levels
under the BS598-110 tests. Therefore, the comparison of the BS598 levels to the BS EN 13108-5
WTS category is of interest for this task.
BS EN 13108-5:2006, 5.9, gives a selection of categories in Tables 13 and 14 from which the
resistance to deformation of specimens in terms of maximum wheel-tracking slope and
maximum proportional rut depth, when tested using the small size device and Procedure B from
BS EN 12697-22, shall be selected. Table 13 provides a range of 0.03 to 1.00mm per 1000 cycles
for selection as the wheel-tracking slope, with maximum proportional rut depths given in Table
14 with a range of 1.0-5.0%.
Page 9
Deformation of thin surfacing
under
BS EN 12697 - 22
Final Project Report
Project Ref B557/00 Deformation of thin surfacing under
BS EN 12697 - 22 Page 9 of 29
© Chris Britton Consultancy 2011 25/03/2011
Annex D1 of PD6691:2010 provides the UK choice for the wheel-tracking slope and proportional
rut depth, as given in BS EN 13108-5, 5.9. The choices from PD6691:2010 are reproduced below
in Table 3, however there is no rut depth or proportional rut depth selection at this time, only a
rutting rate requirement.
Table 3. UK choice for Wheel-tracking Levels (Reproduced from PD6691:2010, BSI)
Classification Test
Temperature Category WTSAIR
Test Method BS EN 12697-22:2003, small
device procedure B
Requirements when tested to BS
598-110
No. Description
°C Wheel track slope (mm/1000 cycles)
Max rut rate
(mm/hr)
Max rut depth (mm)
1
Moderate to heavily stressed sites requiring high rut resistance
45 WTSAIR 1 2 4
2 Very highly stressed sites requiring very high rut resistance
60 WTSAIR 1 5 7
3 Other sites N/A WTSAIR NR - -
4 Literature Review
A literature search was conducted using the facilities of the TRL library to find any documents
relating to comparative testing of BS598-110 and BS EN 12697-22.
The results of the literature search were very limited, with only three relevant documents
returned. These documents were:
• European Standards for Asphalt, JB Bullock, Quarry Management (p17-18,21-22,25-27),
QMJ Publishing Ltd, 2008-01.
• Implications of implementing the European asphalt test methods, JC Nicholls et al, TRL
Report (TRL656), Transport Research Laboratory (TRL), Wokingham, Berkshire, 2006.
• The harmonised European standard test methods for asphalt mixtures, JC Nicholls, TRL
Report (TRL461), Transport Research Laboratory (TRL), Wokingham, Berkshire, 2000.
Page 10
Deformation of thin surfacing
under
BS EN 12697 - 22
Final Project Report
Project Ref B557/00 Deformation of thin surfacing under
BS EN 12697 - 22 Page 10 of 29
© Chris Britton Consultancy 2011 25/03/2011
4.1 Implications of implementing the European asphalt test methods
The most significant of the documents listed above is the TRL Report, TRL656. The report was
commissioned by the HA to investigate the implications of the changes from the British Standard
to the harmonised European Standard on all asphalt test methods called up in the clauses in the
900 Series of the 2002 version of the SHW (MCHW 1). The wheel-tracking test is one of the tests
investigated.
The report initially classifies the existing and replacement test methods into one of three
categories as follows:
1. Identical (having no significant differences and, therefore, assumed to produce the same
value as the result).
2. Related (having differences that can be compared theoretically in order to derive the
value for one test from the other).
3. Distinct (having no theoretical equivalence and, therefore, requiring testing to compare
the values obtained from the two tests).
On this basis, the wheel-tracking rate and depth test was classified as Distinct indicating there
was no equivalence between the tests.
As part of the report, some comparative tests were carried out on four different material mixes:
DBM; SMA and two HRA mixes. All four materials were tested using the BS598-110 method as
well as BS EN 12697-22 Procedures A and B with the results summarised in the document, as
well as being reported in PD 6692:2006.
The report suggested revisions to the numerical values in the then current requirements by
using the mean of the ratios between the new and old parameters, multiplied by the current
limiting value. The ratios calculated, and the proposed wheel-tracking levels for Asphalt
Concrete/SMA/Thin Surfacing and HRA, originally in Tables 5.3, 5.4 and 5.5 of TRL656
respectively, as reproduced below.
Page 11
Deformation of thin surfacing
under
BS EN 12697 - 22
Final Project Report
Project Ref B557/00 Deformation of thin surfacing under
BS EN 12697 - 22 Page 11 of 29
© Chris Britton Consultancy 2011 25/03/2011
Table 4. TRL Report 656 Table 5.3 - Calculation of revised limiting values
Table 5. TRL Report 656 Table 5.4 – Proposed wheel-tracking levels for asphalt concrete, thin surfacing and Stone Mastic Asphalt
Page 12
Deformation of thin surfacing
under
BS EN 12697 - 22
Final Project Report
Project Ref B557/00 Deformation of thin surfacing under
BS EN 12697 - 22 Page 12 of 29
© Chris Britton Consultancy 2011 25/03/2011
Table 6. TRL Report 656 Table 5.5 – Proposed wheel-tracking levels for Hot Rolled Asphalt
The report concludes that although revised levels have been proposed, there is uncertainty in
the precision of the results due to the size of the variation in the ratios calculated.
The report also comments that ‘the universality of the relationship between the rut depth and
proportional rut depth for asphalt concrete (including DBM) and stone mastic asphalt is
doubtful’. This is due to the fact that the BS measure of rut depth assumes deformation is
independent of sample thickness, whilst proportional rut depth assumes deformation is directly
proportional to the sample thickness, both of which cannot be true. Therefore, any relationship
can only be valid for a limited range of slab thicknesses.
4.2 European Standards for Asphalt
The article, European Standards for Asphalt, examines the differences between the Eurpoean
and Brisitsh Sandards, investigiating the differences in the specifications and the testing
methods within them. No comparative testing was conducted as part of the article.
The article highlights the differences between the BS598-110 and BS12697-22 wheel-tracking
tests, and the formats for reporting the results. Only a small reference is made to wheel-
tracking, with the suggestion made that testing under both standards should continue until
sufficient data is available to allow correlations between the two test methods.
Page 13
Deformation of thin surfacing
under
BS EN 12697 - 22
Final Project Report
Project Ref B557/00 Deformation of thin surfacing under
BS EN 12697 - 22 Page 13 of 29
© Chris Britton Consultancy 2011 25/03/2011
4.3 The harmonised European standard test methods for asphalt mixtures
TRL Report TRL461 was published in 2000 and was a review of the proposals for the European
tests. TRL Report, TRL656, which is also included in this review, is the more recent report
covering the tests that were actually included in the final European specifications, and considers
the differences and implications of the changes. Therefore, this report is effectively superseded
by TRL656, covered in Section 3.1.
4.4 Additional Information
Alongside the results of the literature review, work conducted by the County Surveyors’ Society
and MPA , comparing the wheel-tracking test methods for HRA of both the BS598-110 and BS EN
12697-22 Procedure A test methods was also reviewed.
The work highlights both the similarities in the test equipment as well as the key differences,
namely, the difference in applied load, and the difference in number and frequency of passes,
and states that these differences affect the declared output test result, resulting in a need for a
comparison between the old and new methods.
The results of the study were some recommended categories for the specification of recipe,
design and performance-related HRA mixtures. These results are reproduced below in Table 7.
No comparative testing was conducted as part of the work, as the test methods were thought to
be similar enough to not require comparative results. Therefore, a comparison of industry data
for stability and BS EN 12697-22 wheel-tracking tests was used to derive the guidance, the
results of which have now been incorporated into PD6691:2010 (BSI, 2010) as the recommended
UK specification choices from BS EN 13108-4 .
Page 14
Deformation of thin surfacing
under
BS EN 12697 - 22
Final Project Report
Project Ref B557/00 Deformation of thin surfacing under
BS EN 12697 - 22 Page 14 of 29
© Chris Britton Consultancy 2011 25/03/2011
Table 7. CSS Report, March 2010 – Recommended Categories for Hot Rolled Asphalt
TEST METHOD: BS EN 12697-22, small device, procedure A, conditioning in air.
CATEGORY
(from BS EN 13108-4, Tables 11 & 12)
MIXTURE TYPE* TEST TEMPERATURE
WTSAair†
MAXIMUM WHEEL-TRACKING RATE
(µm / cycle)
RdAair
MAXIMUM RUT DEPTH (mm)
Recipe: lightly stressed / other sites
45°C WTRAairNR
RdAairNR
Stability / Design: moderate to heavily stressed sites
45°C WTSAair7,0†
RdAair5,0
Performance-related designs: very heavily stressed sites
60°C WTSAair15,0†
RdAair7,0
*For pavement designs for single axle loads less than 13 tonnes. † The Categories found in BS EN 13108 Part 4 Table 11 erroneously refer to WTSAair (this relates to Procedure B) but in order to strictly conform with EN13108-4, the declared category will need to be in that format. The relevant output result from BS EN 12697-22, small device, procedure A, conditioning in air is expressed as: WTR(Aair). Clients may therefore see examples of both, or mixed, nomenclatures on certificates and test reports until Amendments to Part 4 can be confirmed. In addition, an error identified in the test method for the tyre load factor (corrected to 14,0 from 10,4) will require some historic test results (i.e. before the date of this advice) to be recalculated.
Page 15
Deformation of thin surfacing
under
BS EN 12697 - 22
Final Project Report
Project Ref B557/00 Deformation of thin surfacing under
BS EN 12697 - 22 Page 15 of 29
© Chris Britton Consultancy 2011 25/03/2011
5 Laboratory testing
5.1 Material samples
In line with the Clause 942.7 of the Specification (MCHW1) only samples of thin surfacing
materials approved to BBA HAPAS Level 3 for wheel-tracking levels, were selected as, these are
likely to be the most commonly used materials on the HA network.
Balfour Beatty Major Civil Engineering group identified five resurfacing sites throughout England
that were using appropriately approved thin surfacing materials and that were prepared to
supply 100kg samples of material for use in the comparative tests. The construction sites took
the material samples at the time of laying on site, and stored them ready for collection and
delivery to the testing laboratory.
In total five sites supplied three different thin surfacing materials but due to the limited budget
for testing, only material from four sites was used for the laboratory testing. Throughout the
report, the site materials are referred to as Samples 1-4, to maintain the anonymity of the
specific proprietary materials used.
The BBA HAPAS certificate number for each material was obtained and the wheel-tracking
results for each sample, in accordance with the BBA HAPAS testing procedure, were reviewed to
see the expected range of results. The results show that all three materials acquired for the
comparative testing exhibit wheel-tracking rates and rut depths well below the permitted Level
3 threshold values with the range of wheel-tracking rates reported being 0.3-1.5mm/h and the
maximum ruts ranging from 0.8 to 2.6mm. Therefore, the material samples were unlikely to
produce results close to the threshold values, when samples are prepared as per the BBA HAPAS
certificate guidelines, for purposes of devising new comparative threshold values using the BS
EN 12697-22 test procedure.s .
Page 16
Deformation of thin surfacing
under
BS EN 12697 - 22
Final Project Report
Project Ref B557/00 Deformation of thin surfacing under
BS EN 12697 - 22 Page 16 of 29
© Chris Britton Consultancy 2011 25/03/2011
5.2 Testing procedure
All laboratory testing was carried out by the UKAS accredited laboratory, Surrey County Council
Material Laboratory. Six sample slabs were constructed from each site material, with materials
compacted in accordance with BS EN 12697-33 to produce 50mm thick slabs. The 50mm slab
thickness was chosen as this is the maximum laying thickness permitted by the material
manufacturers and has the greatest chance of rutting uniformly, avoiding stone on stone contact
in the samples preventing ruts forming. The use of the slab specimens allowed wheel-tracking
tests to be conducted on the same sample to both standards, BS 598-110 and BS EN 12697-22.
Although the BBA HAPAS specification sets out in Appendix A1 that for the purposes of
certification, cored samples must be used, laboratory prepared samples can be used for
comparative studies, as is the case with this task. Because individual cored samples are more
likely to exhibit differences in the material and compaction than the laboratory prepared slabs,
for the purpose of this study the laboratory slabs were used to allow both test methods to be
conducted on one sample ensuring maximum uniformity of the material samples when
comparing the test results.
Information about each material, in particular target air void content was obtained from the
material suppliers to allow samples to be made to the same specification as used to meet the
BBA HAPAS test requirements.
The results published with the BBA HAPAS certificates, as noted in Section 5.1 above, showed
that the thin surfacing materials displayed wheel-tracking characteristics well below the
threshold levels set out in the HAPAS guidance for Level 3 requirements. Therefore, in order to
try and force a range of results, including some closer to the HAPAS Level 3 threshold values for
BS 598-110 rutting rate and maximum rut values, the target air void content was varied for each
sample. The first sample from each material was compacted as per the materials supplier’s
guidelines with subsequent samples at increased void contents to allow for more rutting. This
procedure was followed for all three materials selected, but where the same material was
supplied from two different sites, one set of samples was tested as per BS598-110, with all six
samples constructed to the same specification. The purpose of this was to follow the BS598-110
specification procedure to allow a comparison between the natural scatter in the results from
test methods and the scatter achieved through varying the air void content.
Page 17
Deformation of thin surfacing
under
BS EN 12697 - 22
Final Project Report
Project Ref B557/00 Deformation of thin surfacing under
BS EN 12697 - 22 Page 17 of 29
© Chris Britton Consultancy 2011 25/03/2011
5.3 Test results summary
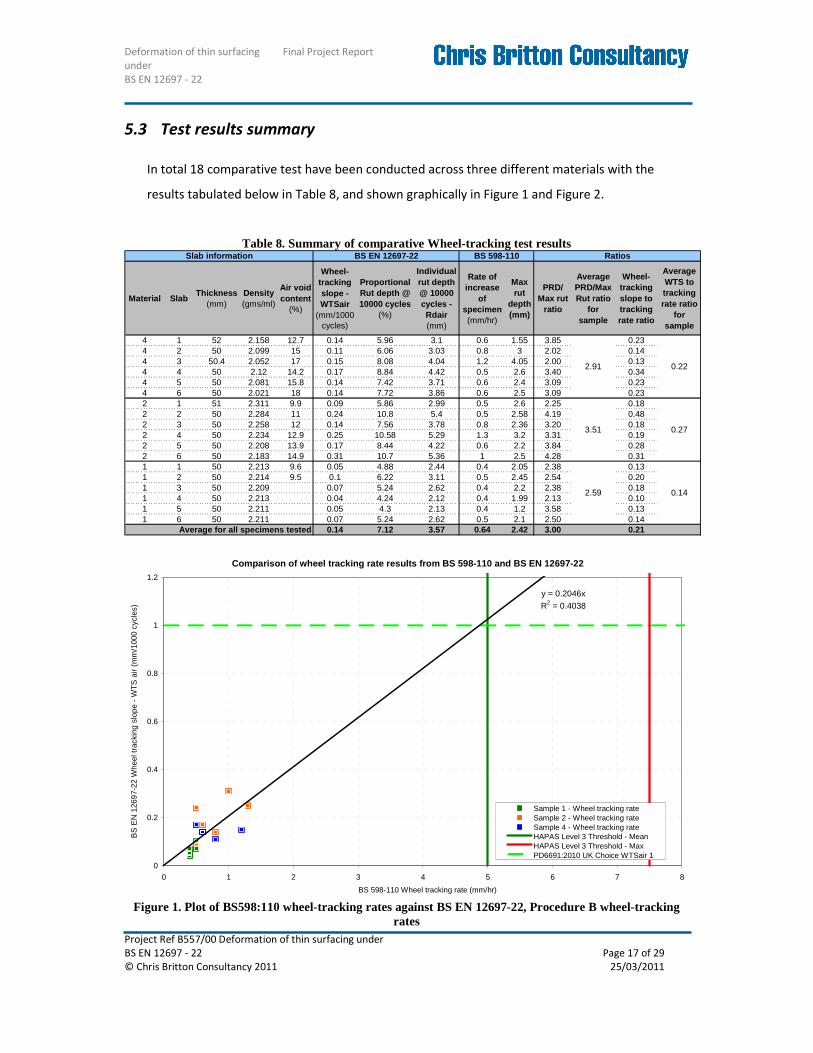
In total 18 comparative test have been conducted across three different materials with the
results tabulated below in Table 8, and shown graphically in Figure 1 and Figure 2.
Table 8. Summary of comparative Wheel-tracking test results
Material SlabThickness
(mm)Density (gms/ml)
Air void content
(%)
Wheel-tracking slope - WTSair
(mm/1000 cycles)
Proportional Rut depth @ 10000 cycles
(%)
Individual rut depth @ 10000 cycles - Rdair (mm)
Rate of increase
of specimen (mm/hr)
Max rut
depth (mm)
PRD/ Max rut
ratio
Average PRD/Max Rut ratio
for sample
Wheel-tracking slope to tracking rate ratio
Average WTS to tracking rate ratio
for sample
4 1 52 2.158 12.7 0.14 5.96 3.1 0.6 1.55 3.85 0.234 2 50 2.099 15 0.11 6.06 3.03 0.8 3 2.02 0.144 3 50.4 2.052 17 0.15 8.08 4.04 1.2 4.05 2.00 0.134 4 50 2.12 14.2 0.17 8.84 4.42 0.5 2.6 3.40 0.344 5 50 2.081 15.8 0.14 7.42 3.71 0.6 2.4 3.09 0.234 6 50 2.021 18 0.14 7.72 3.86 0.6 2.5 3.09 0.232 1 51 2.311 9.9 0.09 5.86 2.99 0.5 2.6 2.25 0.182 2 50 2.284 11 0.24 10.8 5.4 0.5 2.58 4.19 0.482 3 50 2.258 12 0.14 7.56 3.78 0.8 2.36 3.20 0.182 4 50 2.234 12.9 0.25 10.58 5.29 1.3 3.2 3.31 0.192 5 50 2.208 13.9 0.17 8.44 4.22 0.6 2.2 3.84 0.282 6 50 2.183 14.9 0.31 10.7 5.36 1 2.5 4.28 0.311 1 50 2.213 9.6 0.05 4.88 2.44 0.4 2.05 2.38 0.131 2 50 2.214 9.5 0.1 6.22 3.11 0.5 2.45 2.54 0.201 3 50 2.209 0.07 5.24 2.62 0.4 2.2 2.38 0.181 4 50 2.213 0.04 4.24 2.12 0.4 1.99 2.13 0.101 5 50 2.211 0.05 4.3 2.13 0.4 1.2 3.58 0.131 6 50 2.211 0.07 5.24 2.62 0.5 2.1 2.50 0.14
0.14 7.12 3.57 0.64 2.42 3.00 0.21
Slab information
Average for all specimens tested
2.91 0.22
3.51 0.27
BS EN 12697-22 BS 598-110 Ratios
2.59 0.14
Comparison of wheel tracking rate results from BS 598-110 and BS EN 12697-22
y = 0.2046x
R2 = 0.4038
0
0.2
0.4
0.6
0.8
1
1.2
0 1 2 3 4 5 6 7 8
BS 598-110 Wheel tracking rate (mm/hr)
BS
EN
126
97-2
2 W
heel
trac
king
slo
pe -
WT
S a
ir (m
m/1
000
cycl
es)
Sample 1 - Wheel tracking rateSample 2 - Wheel tracking rateSample 4 - Wheel tracking rateHAPAS Level 3 Threshold - MeanHAPAS Level 3 Threshold - MaxPD6691:2010 UK Choice WTSair 1
Figure 1. Plot of BS598:110 wheel-tracking rates against BS EN 12697-22, Procedure B wheel-tracking
rates
Page 18
Deformation of thin surfacing
under
BS EN 12697 - 22
Final Project Report
Project Ref B557/00 Deformation of thin surfacing under
BS EN 12697 - 22 Page 18 of 29
© Chris Britton Consultancy 2011 25/03/2011
Comparison of rut depth results from BS 598-110 and BS EN 12697-22
y = 2.879x
R2 = 0.1805
0
2
4
6
8
10
12
0 1 2 3 4 5 6 7 8 9 10 11 12
BS 598-110 Max rut depth (mm)
BS
EN
126
97-2
2 P
ropo
rtio
nal R
ut D
epth
@ 1
0000
cyc
les
(%)
Sample 1 - Rut depth
Sample 2 - Rut depth
Sample 4 - Rut depth
HAPAS Level 3 Threshold - Mean
HAPAS Level 3 Threshold - Max
Figure 2. Plot of BS598:110 rut depth against BS EN 12697-22, Procedure B proportional rut depth
The graphs clearly show that, even with the increased air void contents introduced into Samples
2 and 4, the wheel-tracking rates and maximum rut measurements recorded under the BS 598-
110 test procedure are considerably below the threshold set for BBA HAPAS Level 3 approval.
Figure 1 also shows that the corresponding results under the BS EN 12697-22 test procedure are
also well below the requirement set out in PD6691:2010 for Stone Mastic Asphalt.
However, the trend line of all the results from all samples, when forced through zero, shows the
data fitting the current standards with the BS 598-110 threshold of 5mm/hr correlating
approximately with the BS EN 12697-22 wheel-tracking slope of 1mm/1000 cycles.
The results suggest that the current rut rate level set for thin surfacing materials in the BBA
HAPAS approval scheme is easily achieved by the materials tested and by a range of other thin
surfacing materials based upon the test results reported on the BBA HAPAS certificates. The
majority of the BBA HAPAS approved thin surfacing materials whose certificates were reviewed
for this project show the reported rut rate measurement often below 1mm/h with maximum
rutting below 3mm, which is considerably below the current required targets for the materials.
Page 19
Deformation of thin surfacing
under
BS EN 12697 - 22
Final Project Report
Project Ref B557/00 Deformation of thin surfacing under
BS EN 12697 - 22 Page 19 of 29
© Chris Britton Consultancy 2011 25/03/2011
A further observation from the tests is that although the increased air void contents does
increase the maximum rut depth, the change in rutting rate is much less pronounced. The test
results suggest that increased air voids result in deeper ruts being formed within the first 10% of
the testing period, with relatively little change throughout the remainder of the test. Due to the
reporting methodology of the rutting rates for both the BS 598-110 and the BS EN 12697-22, the
rutting produced in the samples during the first part of the test is not included when calculating
the rutting rate for the reporting of the results. As summarised in Section 2.1, the BS598-110
test method calculates the rutting rate over the last third of the test (15 minutes).
The plots of rut depth against time shown in Figure 3 show that between 30 and 45 minutes the
increase in rut is relatively slow, compared to the early stages. The plots for Slab 2 and Slab 3
show that although Slab 3 ends up with 1mm more rutting than Slab 2, between 5 minutes and
45 minutes the total rut in both cases only increases by approximately 1mm. The difference
between the two samples after 5 minutes of testing is 1mm, which is the same as it is at the end
of the test period so there is little difference in the rutting rate, despite a significant difference in
the total rut.
The characteristic is not so pronounced in the BS EN test method, as can be seen in Figure 4.
However, due to the conditioning cycles the specimens start with a different level of rutting at
zero passes, with similar gradients in the measured range of 10,000 to 20,000 passes.
The outcome of this relatively small change in the wheel-tracking rate is that although the
maximum rut depth increased significantly with increasing air voids, although still not close to
the limit permitted under the BBA HAPAS specification, the wheel-tracking rate remained
relatively unaffected and still well below the permitted levels.
Page 20
Deformation of thin surfacing
under
BS EN 12697 - 22
Final Project Report
Project Ref B557/00 Deformation of thin surfacing under
BS EN 12697 - 22 Page 20 of 29
© Chris Britton Consultancy 2011 25/03/2011
Slab 1 (13% air void content)
Slab 2 (15% air void content)
Slab 3 (17% air void content)
Figure 3. BS598-110 rut depth with time plots for Sample 4
Page 21
Deformation of thin surfacing
under
BS EN 12697 - 22
Final Project Report
Project Ref B557/00 Deformation of thin surfacing under
BS EN 12697 - 22 Page 21 of 29
© Chris Britton Consultancy 2011 25/03/2011
Slab 1 (13% air void content)
Slab 2 (15% air void content)
Slab 3 (17% air void content)
Figure 4. BS EN 12697-22 rut depth with passes plots for Sample 4
Page 22
Deformation of thin surfacing
under
BS EN 12697 - 22
Final Project Report
Project Ref B557/00 Deformation of thin surfacing under
BS EN 12697 - 22 Page 22 of 29
© Chris Britton Consultancy 2011 25/03/2011
6 Discussion of results
The objective of this research task was to establish a correlation between the wheel-tracking
test results of the old and new standards, BS 598-110 and BS EN 12697-22 respectively. There
are two outputs reported for each of the tests. For the BS598-110 testing, the outputs are the
rate of increase of rutting (mm/hr) and maximum rut depth (mm). The newer BS EN 12697 test
also has two results, for wheel-tracking slope (WTSAIR - mm/1000 cycles) and proportional rut
depth (PRDAIR - mm).
6.1 Wheel-tracking rate
The results of the testing suggests that there could be a correlation developed between the
wheel-tracking rates measured under the existing BS59-110 test methodology and those
measured under the BS EN 12697-22 methodology. Although there are differences in the test
procedures, including increased wheel load, increased number of cycles and increased
measurement points, the basic principles are the same, which therefore allows for a correlation
of the results.
The results of the testing suggests a linear correlation of wheel-tracking rates can be developed
for the two different test methods. A linear trend line was applied to the comparative test
results, as shown in Figure 1, and forced through the origin on the assumption that a material
that showed no rut under the BS598-110 test would also not rut under the BS EN 12697-22 test.
The trend line gives a correlation factor of 0.20, compared to the ratio of the results being 0.21,
for conversion of the BS598-110 results to the BS EN 12697-22 Procedure B results. The current
recommendations in PD6691:2010 for the specification of SMA materials suggests a wheel-
tracking category of WTSAIR 1, which is allowing a wheel-tracking slope of up to 1mm/1000 cycles.
When comparing this to the existing requirements based upon the BS598-110 methodology,
where a wheel-tracking rate of 5mm/hr is specified, both in the HAPAS specification and the
MCSHW1, and using the trend line correlation factor given above, 5mm/hr equates to
1.00mm/1000 cycles, or 1.05mm/1000cycles based on the ratio. This seems to support the work
that was carried out to specify the BS EN 13108-5 categories.
However both the laboratory test results and the review of the BBA HAPAS certificates for a
wider range of materials suggest that all of the thin surfacing materials reviewed produce wheel-
Page 23
Deformation of thin surfacing
under
BS EN 12697 - 22
Final Project Report
Project Ref B557/00 Deformation of thin surfacing under
BS EN 12697 - 22 Page 23 of 29
© Chris Britton Consultancy 2011 25/03/2011
tracking test results considerably below the 5mm/hr (or 1mm/1000 cycle) specification
requirement. The laboratory test results show wheel-tracking rates for all specimens at or below
1.3mm/hr (0.31mm/1000 cycles).
The current requirements in NG942 (MCHW1), and the BBA HAPAS specification are set at
values originally based upon research conducted by TRL that led to a relationship between
laboratory wheel-tracking rate and trafficking of HRA for the deformation to be less than 0.5mm
per annum. These same HRA specification figures have been applied to the SMA/Thin surfacing
materials which, although likely to perform better than HRA in terms of resistance to
deformation, will perform differently throughout the materials life. It is recommended that more
research, similar to that carried out on HRA by TRL, should be conducted on the thin surfacing
materials widely used on the HA strategic network to allow refinement of the thresholds more
appropriate to the these types of material.
6.2 Maximum rut depth
The methods for reporting rut depth are considerably different between the two test methods.
Although ultimately both are based upon the maximum rut measurement at the end of the
testing cycle, there is a significant difference in the way the rut is reported, as well as a likely
difference in the level of rutting due to the increased wheel load and number of testing cycles
under the newer BS EN 12697-22 test method.
BS598-110 reports directly the maximum rut measured at the end of the testing cycle, in mm.
The BS EN 12697-22 Procedure B testing method requires the same measurement of maximum
rut at the end of the 10,000 cycles, but importantly this is then converted to a Proportional Rut
Depth (PRDAIR), making the result dependant on the thickness of the sample tested.
All of the laboratory testing was conducted upon 50mm thick laboratory prepared slab
specimens. For the uniform thickness tested, the ratio of BS EN 12697-22 proportional rut depth
to BS598-110 maximum rut depth is 3.0, which if applied to the BBA HAPAS Level 3 requirements
would give a maximum Proportional Rut Depth (PRDAIR) of 21/31.5% (mean/max individual).
The samples used in the laboratory tests showed a range of proportional rut depths of 4.9-
10.8% with an average value of 7.6%. The results from the testing are not necessarily
Page 24
Deformation of thin surfacing
under
BS EN 12697 - 22
Final Project Report
Project Ref B557/00 Deformation of thin surfacing under
BS EN 12697 - 22 Page 24 of 29
© Chris Britton Consultancy 2011 25/03/2011
representative of how the materials would perform in real circumstances, as the air void content
of some samples were deliberately adjusted with the aim of producing rutting levels closer to
the limits of the existing specification. However, reviewing the BBA HAPAS certificates of a range
of Level 3 approved thin surfacing materials shows a range of BS598-110 Maximum Rut values
from 0.8mm to 4.6mm, which on the assumption that the samples are 40mm thick would give a
Proportional Rut Depth range of 2-11.5%.
The current guidance in the specification of SMA materials in the UK in accordance with BS EN
131085-5, as published in PD6691:2010 (BSI, 2010) has not made a recommendation for a
category of Proportional Rut Depth (PRDAIR) and has only recommended a wheel-tracking slope
category. Although the BS EN 13108-5 is not a requirement for thin surfacing materials, it is
interesting that Table 14 of the document, which gives the specification options for maximum
proportion rut depth, only allows a maximum of 5% proportional rut for SMA materials. This
would appear to be excessively restrictive.
As all laboratory testing was conducted on 50mm thick slab samples, effectively the sample
thickness has no bearing on the results obtained, and therefore the proportional aspect of the
BS EN 12697-22 rut calculation is negated in this study. The comparison of results is effectively a
comparison of the final measured rutting levels under each test, albeit with the proportional
calculation adding a factor of two to the measured ruts on the 50mm samples. Therefore, the
effect of sample thickness on maximum rut depth could not be assessed and the correlation
produced is only valid for samples of 50mm. Further research is required to determine over
what range of thickness values the relationship between maximum rut depth and proportional
rut depth is valid and to determine the impact of sample thickness on maximum rut depth.
During the literature review the results of work by TRL, reported in TRL Report TRL656
concluded that creating a universal relationship between rut depth and proportional rut depth
would not be possible as the two methods have conflicting assumptions on the importance of
the sample thickness in relation to deformation.
The research conducted by TRL, covered in Section 4.1, used ratios derived from laboratory
testing undertaken for the report to calculate proposed wheel-tracking levels for asphalt
Page 25
Deformation of thin surfacing
under
BS EN 12697 - 22
Final Project Report
Project Ref B557/00 Deformation of thin surfacing under
BS EN 12697 - 22 Page 25 of 29
© Chris Britton Consultancy 2011 25/03/2011
concrete, thin surfacing and Stone Mastic Asphalt, Table 5. The values proposed for the
Mean/Maximum proportional rut depth figures for Level 3 requirements were 35/50%. These
are considerably higher than calculated from the results of this task. However, it was noted that
the TRL testing was conducted on SMA, and not Thin Surfacing, and the overall rut depths
measured were consistently higher than those measured in this task.
6.3 Proposed updates to the specification
Applying the ratios calculated in Table 8 to the current specification levels gives the results
shown in Table 9 below.
Table 9. Current wheel-tracking specification as given in NG942
Level Test Temperature
Specimen thickness Criteria
Maximum wheel tracking
rate
Maximum rut depth
(°C) (mm) (mm/hr) (mm) Mean 5 7
≥30 Maximum 7.5 10.5
Mean 1/6 x thickness# 7/30 x
thickness# 3 60
<30 Maximum 1/4 x thickness# 7/20 x
thickness# Mean 2 4
≥30 Maximum 3 6
Mean 1/15 x thickness#
2/15 x thickness#
2 45 <30
Maximum 1/10 x thickness# 1/5 x thickness#
Mean 5 7 ≥30
Maximum 7.5 10.5
Mean 1/6 x thickness# 7/30 x thickness#
1 45 <30
Maximum 1/4 x thickness# 7/20 x thickness#
Page 26
Deformation of thin surfacing
under
BS EN 12697 - 22
Final Project Report
Project Ref B557/00 Deformation of thin surfacing under
BS EN 12697 - 22 Page 26 of 29
© Chris Britton Consultancy 2011 25/03/2011
Table 10. Proposed wheel-tracking specification based on test result ratios
Level Test Temperature
Specimen thickness Criteria Maximum wheel
tracking rate
Maximum proportional
rut depth
(°C) (mm) (mm/1000 cycles) (%) Mean 1.1 21.0
≥30 Maximum 1.6 31.5
Mean 11/300 x
thickness# 21.0 3 60
<30 Maximum 4/75 x thickness# 31.5
Mean 0.4 12.0 ≥30
Maximum 0.6 18.0 Mean 1/60 x thickness# 12.0
2 45 <30
Maximum 1/50 x thickness# 18.0 Mean 1.1 21.0
≥30 Maximum 1.6 31.5
Mean 11/300 x
thickness# 21.0 1 45
<30 Maximum 4/75 x thickness# 31.5
The relationship between the two standards was calculated using Level 3 materials and a test
temperature of 60°C. Therefore, the relationship may be different for the Level 1 and 2 test
procedures.
As the new rutting measurement is Proportional Rut Depth, there will be no need to apply a
thickness weighting to samples less than 30mm. However, testing in this research was limited to
50mm samples and the validity of the relationship for rutting and proportional rut depth on
thinner samples was not verified.
6.4 Summary of findings
In summary, the key conclusions and observations from the research are:
• A literature review found that little research has been published comparing the results
of the BS598-110 and BS EN 12697-22 results.
• Research conducted by the County Surveyors Society comparing industry data on
stability and BS EN 12697-22 wheel-tracking results has been incorporated into the
published UK guidance on the specification of HRA in PD6691:2010 (BSI, 2010).
• TRL research in TRL Report TRL656 proposed ratios to convert BS598-110 wheel-tracking
results to BS EN 12697-22 wheel-tracking results. The proposed ratios for Asphalt
Concrete, Thin Surfacing and Stone Mastic Asphalt materials were 0.133 for wheel-
Page 27
Deformation of thin surfacing
under
BS EN 12697 - 22
Final Project Report
Project Ref B557/00 Deformation of thin surfacing under
BS EN 12697 - 22 Page 27 of 29
© Chris Britton Consultancy 2011 25/03/2011
tracking rates and 4.8 for rutting depths. However, the testing was conducted on DBM
and SMA samples and not proprietary thin surfacings.
• A correlation between the BS 598-110 and BS EN 12697-22 wheel-tracking rates results
has been carried out and a ratio of 0.21 found between the results.
• A correlation between the BS 598-110 maximum rut depth and BS EN 12697-22
proportional rut depth results has been carried out and a ratio of 3.00 found between
the results.
• The ratios have been used to proposed revised specification values for the wheel-
tracking and rut depth thresholds.
• Further research is required to determine the effect of specimen thickness on rutting,
and therefore the validity of the proportional rut depth correlation to samples at
thicknesses less than 50mm.
• Laboratory testing was only conducted on 50mm thick specimens of BBA HAPAS Level 3
approved thin surfacing materials, tested at 60°C, and therefore further research is
needed to determine the validity of the correlations for Level 1 and 2 materials tested at
45°C.
• The current levels of wheel-tracking for thin surfacing materials specified in NG942
(MCHW1) and the BBA HAPAS specification are the same as those used for HRA, based
upon research correlating laboratory wheel-tracking to trafficking. The test results and
HAPAS certificates for materials reviewed suggest that the thin surfacing materials
perform considerably better than required, even when produced with increased air void
contents to those specified by the manufacturer, and therefore it is recommended
research is carried out to determine thresholds more appropriate to the materials.
Page 28
Deformation of thin surfacing
under
BS EN 12697 - 22
Final Project Report
Project Ref B557/00 Deformation of thin surfacing under
BS EN 12697 - 22 Page 28 of 29
© Chris Britton Consultancy 2011 25/03/2011
7 References
British Board of Agrément (2008). Guidelines Document for the assessment and Certification of
Thin Sufacing Systems for Highways. Watford: British Board of Agrément.
British Standards Institution (1998). Sampling and examintation of bituminous mixtures
for roads and other paved areas; Part 110, Methods of test for the determination of
wheel-tracking rate of cores of bituminous wearing courses. BS 598: Part 110: 1998.
London: British Standards Institution.
British Standards Institution (2010). Guidance on the use of BS EN 13108 Bituminous
Mixtures – Material specifications. PD 6691:2010. London: British Standards Institution.
British Standards Institution (2006). Guidance on the use of BS EN 12697 “Bituminous
Mixtures – Test methods for hot mix asphalt”. PD 6692:2006. London: British Standards
Institution.
Comité Européen De Normalisation (2007). Bituminous Mixtures – Test methods for hot
mix asphalt – Part 22: Wheel Tracking. BS EN 12697-22:2003+A1. London: British
Standards Institution.
Comité Européen De Normalisation (2007). Bituminous Mixtures – Test methods for hot
mix asphalt – Part 33: Specimen prepared by roller compactor. BS EN 12697-33:2003+A1.
London: British Standards Institution.
Comité Européen De Normalisation (2010). Bituminous Mixtures – Materials
Specifications – Part 4: Hot Rolled Asphalt. BS EN 13108-4:2006. London: British
Standards Institution.
Comité Européen De Normalisation (2008). Bituminous Mixtures – Materials
Specifications – Part 5: Stone Mastic Asphalt. BS EN 13108-5:2006. London: British
Standards Institution.
County Surveyors Society/MPA (2010). Guidance on Specifying Hot Rolled Asphalt (Surface
Course) to BS EN 13108 Part 4. County Surveyors Society/MPA
Page 29
Deformation of thin surfacing
under
BS EN 12697 - 22
Final Project Report
Project Ref B557/00 Deformation of thin surfacing under
BS EN 12697 - 22 Page 29 of 29
© Chris Britton Consultancy 2011 25/03/2011
The Highways Agency, Scottish Development Department, The National Assembly for
Wales and the Department for Regional Development Northern Ireland (MCHW1).
Manual of Contract Documents for Highway Works – Volume 1: Specification for
Highway Works. London: The Stationery Office.
The Highways Agency, Scottish Development Department, The National Assembly for
Wales and the Department for Regional Development Northern Ireland (MCHW2).
Manual of Contract Documents for Highway Works – Volume 2: Notes for Guidance on
the Specification for Highway Works. London: The Stationery Office.
The Highways Agency, Scottish Development Department, The National Assembly for
Wales and the Department for Regional Development Northern Ireland (DMRB 7.5.2).
Design Manual for Roads and Bridges – HD37/99: Bituminous Surfacing Materials and
Techniques. London: The Stationery Office.
Bullock, JB (2008). European Standards for Asphalt, Quarry Management (p17-18,21-
22,25-27), QMJ Publishing Ltd.
Hunter, RN (2000). Asphalt in Road Construction. London: Thomas Telford Ltd
Nicholls, JC et al. (2006) Implications of implementing the European asphalt test methods.
TRL Report TRL656. Wokingham: TRL.
Nicholls, JC (2000). The harmonised European standard test methods for asphalt mixtures. TRL
Report TRL461. Wokingham: TRL.