27
Defra Air Quality Update Janet Dixon Science Policy Unit Air and Environment Quality Division
Defra Air Quality Update
Janet DixonScience Policy UnitAir and Environment Quality Division

Latest developments
• Europe:• New Directive on ambient air quality• Monitoring Network reorganisation
• National:• Indicators • Air Quality Expert Group
• Local:• Air quality performance indicator• Local air quality management• Air quality grantAir Quality Information Archive
Europe
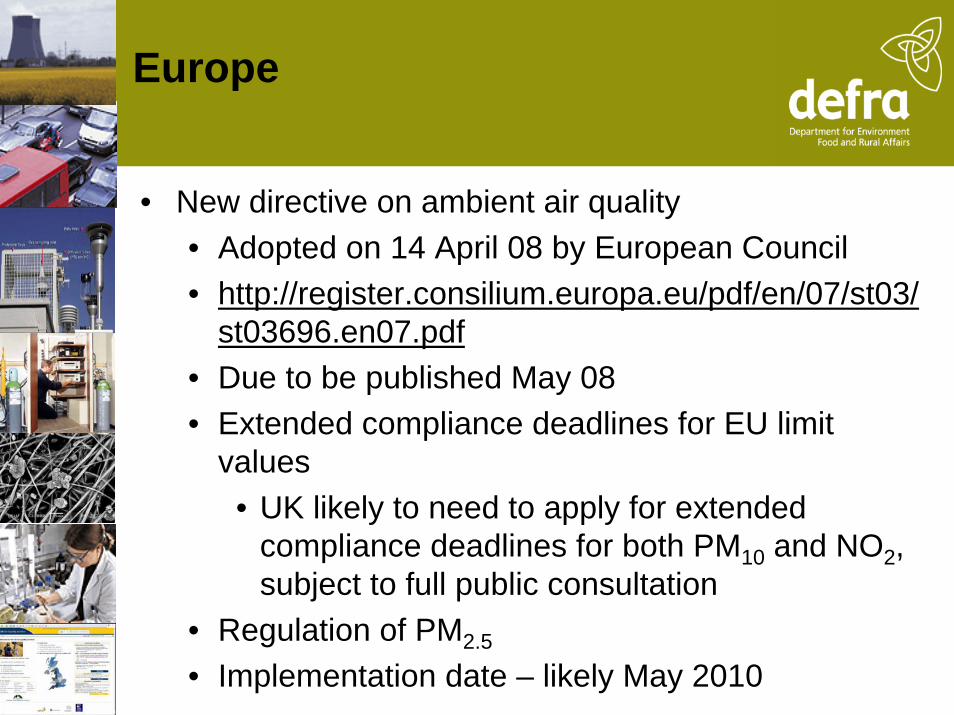
• New directive on ambient air quality• Adopted on 14 April 08 by European Council• http://register.consilium.europa.eu/pdf/en/07/st03/
st03696.en07.pdf• Due to be published May 08• Extended compliance deadlines for EU limit
values• UK likely to need to apply for extended
compliance deadlines for both PM10 and NO2,subject to full public consultation
• Regulation of PM2.5
• Implementation date – likely May 2010
Europe: New AQ Directive
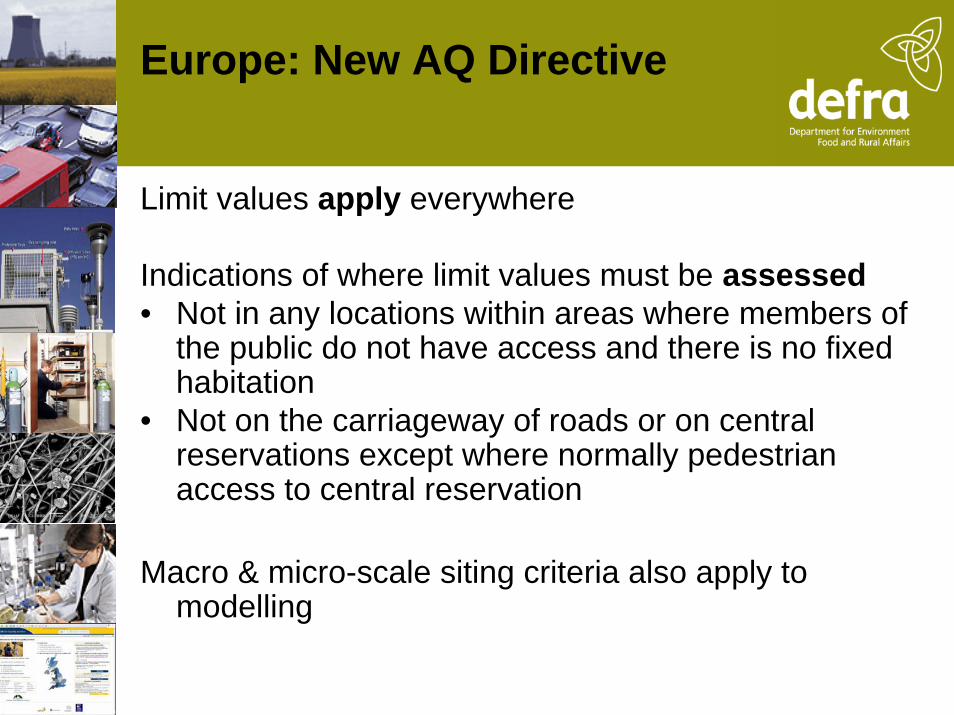
Limit values apply everywhere
Indications of where limit values must be assessed• Not in any locations within areas where members of
the public do not have access and there is no fixed habitation
• Not on the carriageway of roads or on central reservations except where normally pedestrian access to central reservation
Macro & micro-scale siting criteria also apply to modelling
Europe: New AQ Directive
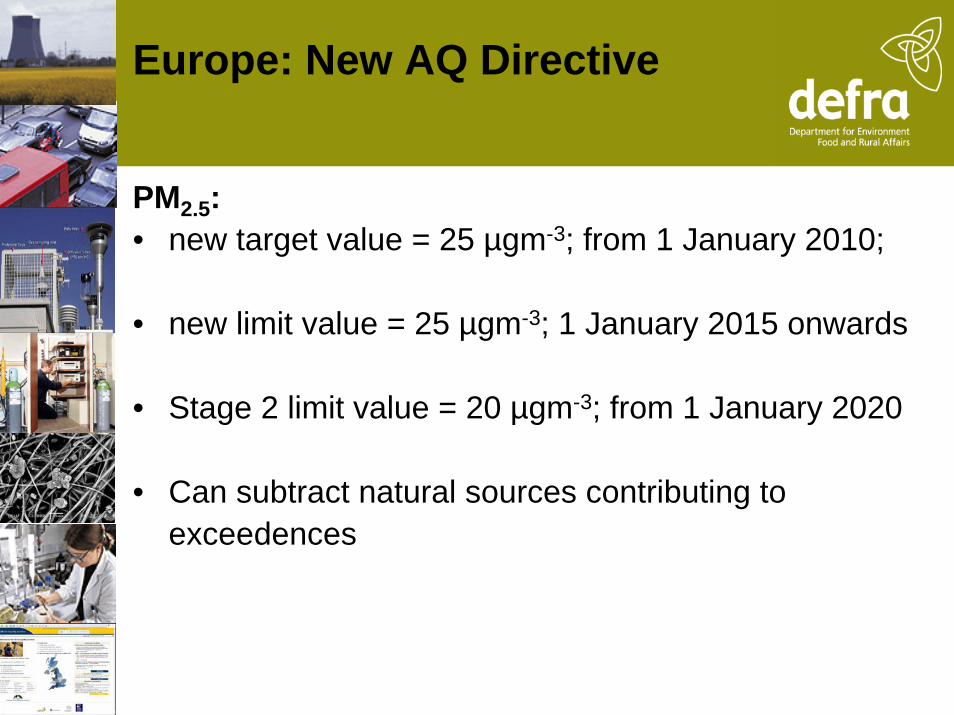
PM2.5:• new target value = 25 µgm-3; from 1 January 2010;
• new limit value = 25 µgm-3; 1 January 2015 onwards
• Stage 2 limit value = 20 µgm-3; from 1 January 2020
• Can subtract natural sources contributing to exceedences

Europe: New AQ Directive
PM2.5:• non-mandatory Exposure Reduction Target at urban
background on a sliding scale (0-20%) dependent on initial concentration in 2010 concentrations by 2020
• New Exposure Concentration Obligation - 20 µgm-3
from 1 January 2015 onwards
• UK likely to require 15% reduction• Reference concentrations – 3 year average of 2008-2010
& 2018-2020• Urban background monitoring where > 100,000 population• Monitoring in place from 1 January 2008 or 2009
Europe: MonitoringNew AQ Directive proposal
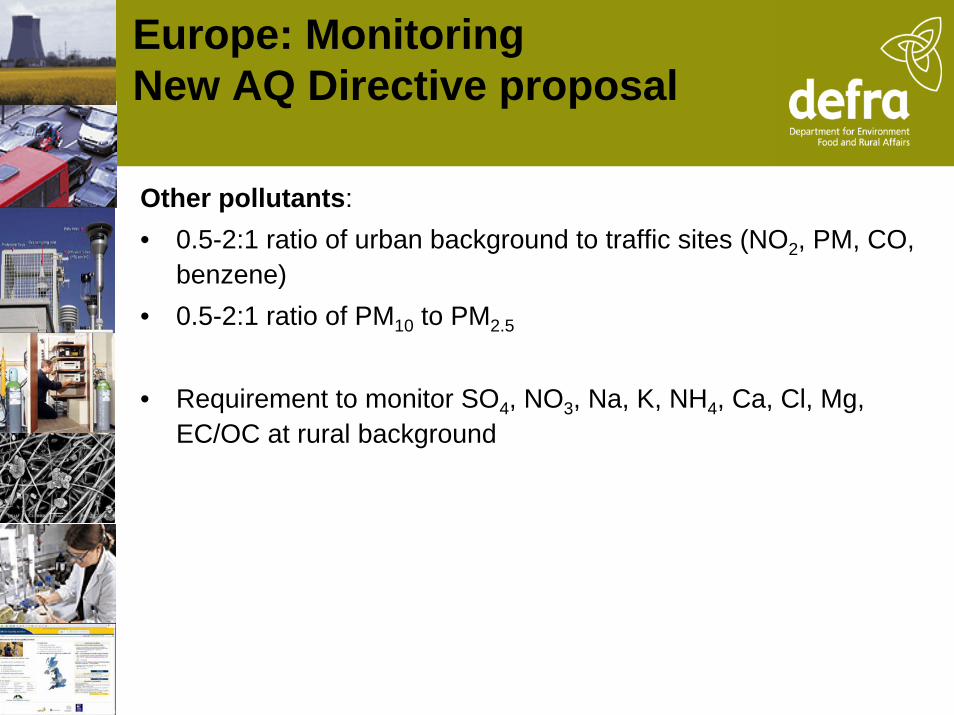
Other pollutants:• 0.5-2:1 ratio of urban background to traffic sites (NO2, PM, CO,
benzene)• 0.5-2:1 ratio of PM10 to PM2.5
• Requirement to monitor SO4, NO3, Na, K, NH4, Ca, Cl, Mg, EC/OC at rural background
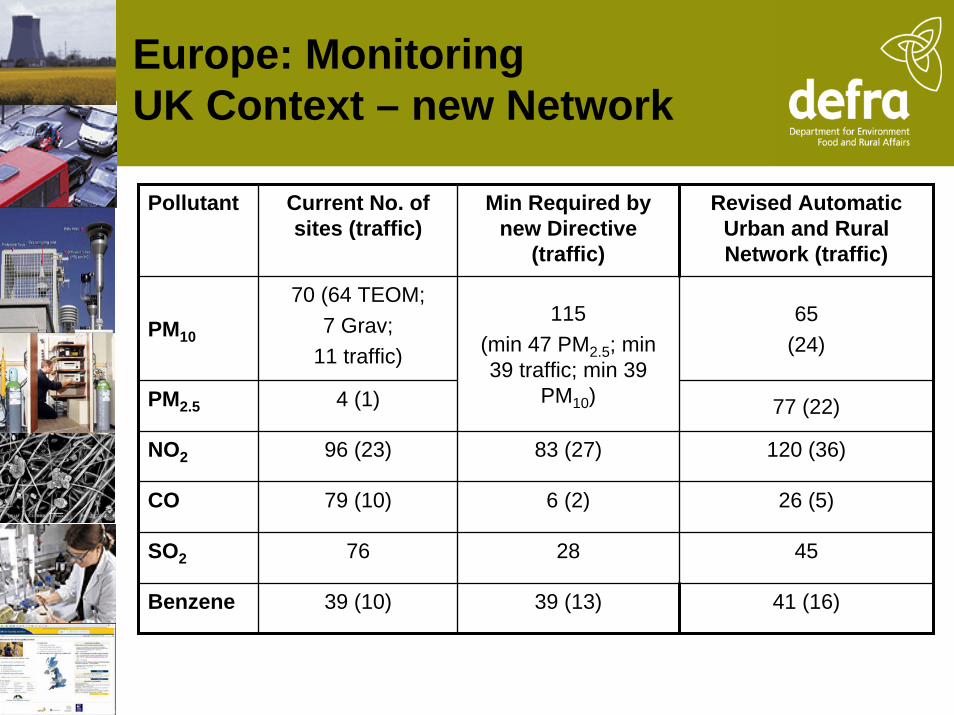
Europe: MonitoringUK Context – new Network
Pollutant Current No. of sites (traffic)
Min Required by new Directive
(traffic)
70 (64 TEOM; 7 Grav;
11 traffic)
PM2.5 4 (1)
115 (min 47 PM2.5; min 39 traffic; min 39
PM10) 77 (22)
83 (27)
6 (2)
28
39 (13)
96 (23)
79 (10)
76
39 (10)
PM10
NO2
CO
SO2
Benzene
Revised Automatic Urban and Rural Network (traffic)
65 (24)
120 (36)
26 (5)
45
41 (16)
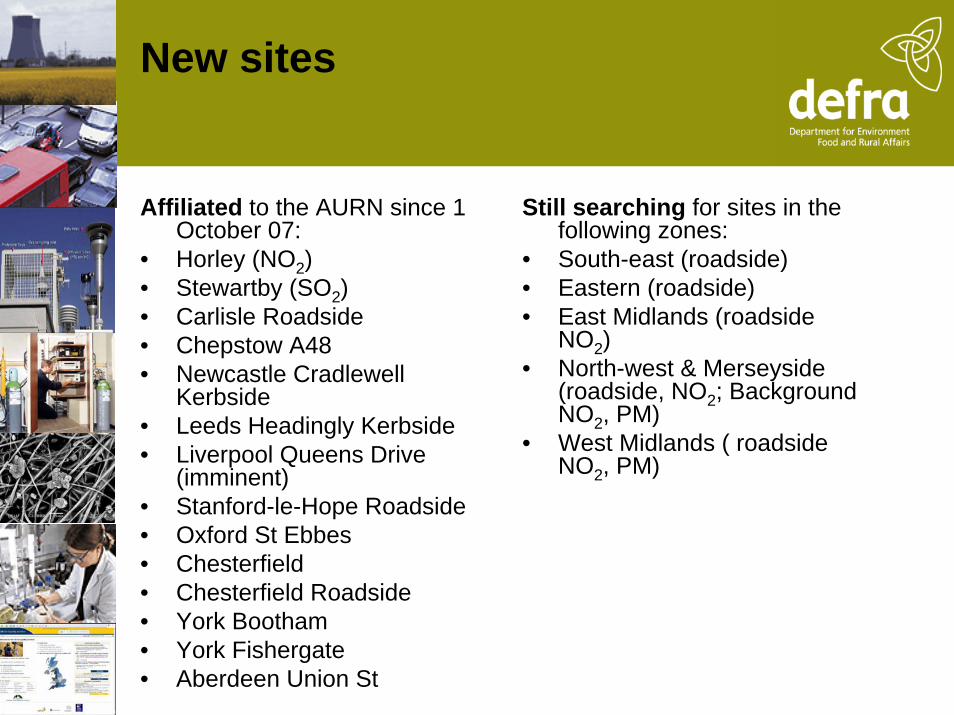
New sites
Still searching for sites in the following zones:
• South-east (roadside)• Eastern (roadside)• East Midlands (roadside
NO2)• North-west & Merseyside
(roadside, NO2; Background NO2, PM)
• West Midlands ( roadside NO2, PM)
Affiliated to the AURN since 1 October 07:
• Horley (NO2)• Stewartby (SO2)• Carlisle Roadside• Chepstow A48• Newcastle Cradlewell
Kerbside• Leeds Headingly Kerbside• Liverpool Queens Drive
(imminent)• Stanford-le-Hope Roadside• Oxford St Ebbes• Chesterfield• Chesterfield Roadside• York Bootham• York Fishergate• Aberdeen Union St
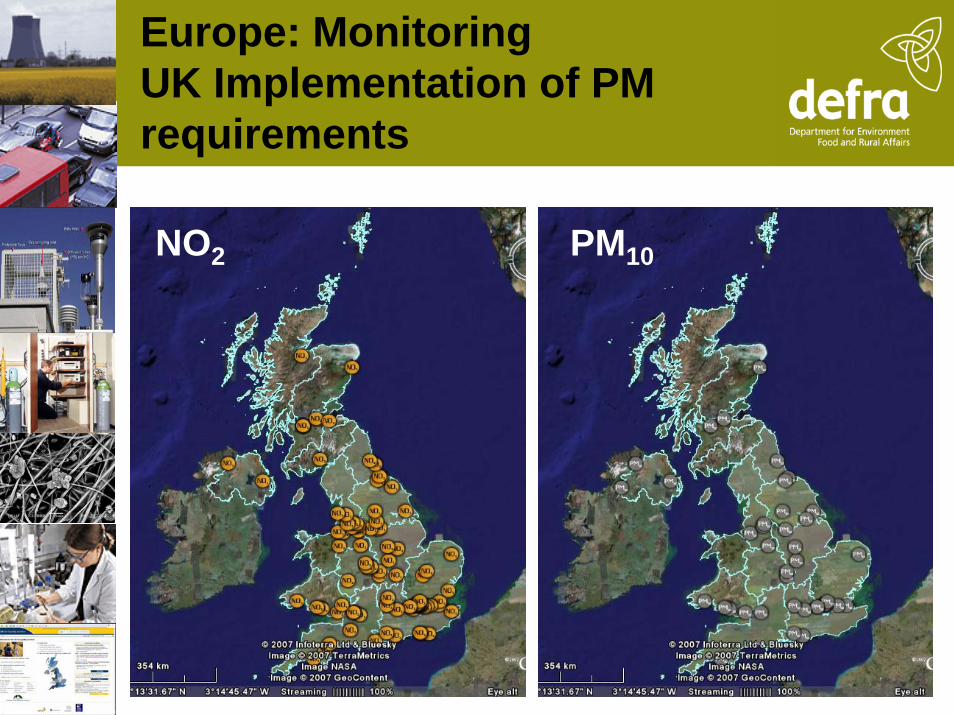
Europe: MonitoringUK Implementation of PM requirements
NO2 PM10
Europe: Monitoring4th Daughter Directive
• PAHs, arsenic, cadmium, mercury, nickel• target values for PAHs (as B[a]P 1 ng/m3), Arsenic (6 ng/m3),
Cadmium (5 ng/m3), and Nickel (20 ng/m3)• PAHs - replaced all 19 of the current samplers with the PM10
reference method (Digitel HiVols) and requires 14 new sites• Heavy metals - 17 current sites – relocating some existing sites
and require 11 new sites• Many of new sites are co-located PAH and heavy metals• Deposition monitoring – heavy metals and PAH at Auchencorth
Moss and Harwell

PAH network
New sites• Auchencorth Moss Site • Ballymena Site • Derry Site • Glasgow Site • Harwell Site • London Marylebone Rd• Lynemouth (Alcan Lynemouth downwind) • Manchester• Middlesbrough• Newport/Rhondda• Port Talbot upwind• South Hiendley (Monckton downwind)• Royston (Monckton upwind)• Santon (Corus Scunthorpe downwind)
Old sites continuing• Birmingham • Bolsover• Brent• Bromley• Cardiff 2• Edinburgh• Glasgow• Hove• Kinlochleven• Leeds 2• Lisburn• Newcastle• Newport (StJulian’s)• Port Talbot• Scunthorpe• Liverpool Speke• High Muffles• Hazelrigg• Stoke Ferry

Heavy Metals Network
• Sites closed:• Leeds• Glasgow• Newcastle• Brent
• New sites Opened to date:• Morriston - INCO upwind• Coedgwilym Cemetery –
INCO downwind• Belfast Centre• Port Talbot AURN• Sheffield Centre• Scunthorpe Town – Corus
upwind• Santon – Corus downwind
• Sites Planned:• Redcar ex-AURN - Corus
downwind• Nunthorpe - Corus upwind –
investigating site locations
• Cardiff Rumney - CELSA steel works downwind;
• Chadwell St Mary - Britannia Metals downwind
• Bean Primary School -Britannia Metals upwind
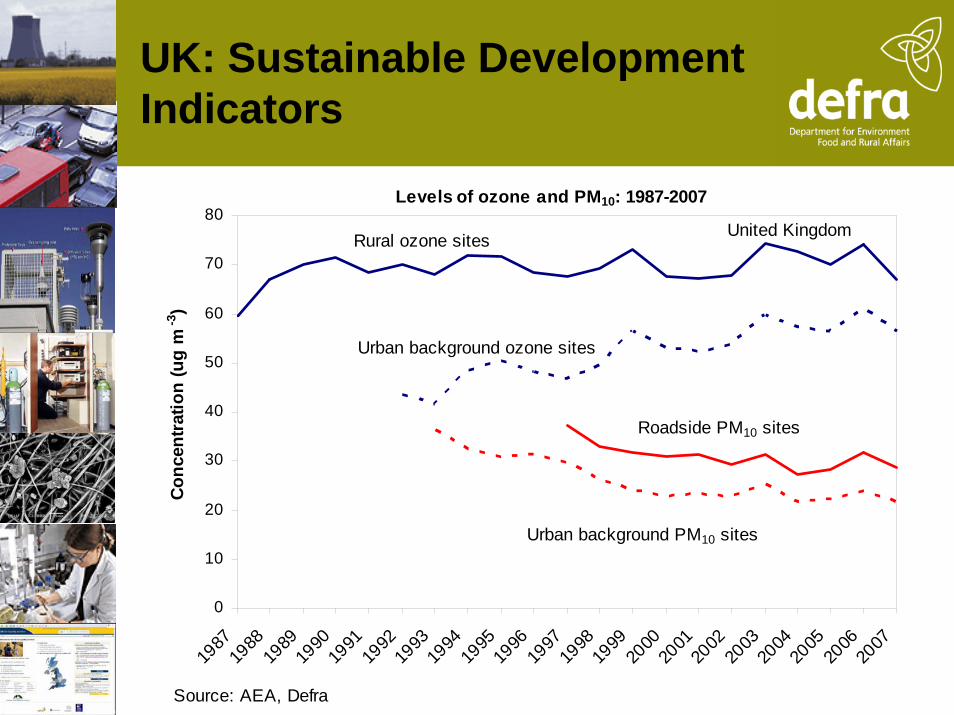
UK: Sustainable Development Indicators
0
10
20
30
40
50
60
70
80
1987
1988
1989
1990
1991
1992
1993
1994
1995
1996
1997
1998
1999
2000
2001
2002
2003
2004
2005
2006
2007
Con
cent
ratio
n (u
g m
-3)
Rural ozone sites
Urban background ozone sites
Roadside PM10 sites
Urban background PM10 sites
Levels of ozone and PM10: 1987-2007
United Kingdom
Source: AEA, Defra

UK: Sustainable Development Indicators
0
10
20
30
40
50
60
70
1987
1988
1989
1990
1991
1992
1993
1994
1995
1996
1997
1998
1999
2000
2001
2002
2003
2004
2005
2006
2007
Day
sDays when air pollution is moderate or higher: 1987-2007
United Kingdom
Urban sites
Rural sites
Source: AEA, Defra

UK: Progress with Objectives – (England only)
0
50
100
150
200
250
300
350
Benzene 2003 Runni ng
A nnual +
B enzene 2010 Annual
(Engl and, Wal es)
B enzo a P yr ene 2010
A nnual *
1,3-butadi ene 2003
Runni ng A nnual
CO 2003 8-Hour Lead 2004 Annual Lead 2008 Annual NO2 2005 1-Hour NO2 2005 Annual O3 2005 Dai l y M ax 8-
Hour
P M 10 2004 24-hour P M 10 2004 A nnual SO2 2005 15-mi nute SO2 2004 1-hour SO2 2004 24-hour
Obj ect i ve * in absen ce of 2 0 0 7 dat a dat a f r om 2 0 0 6 has been pr esen t ed
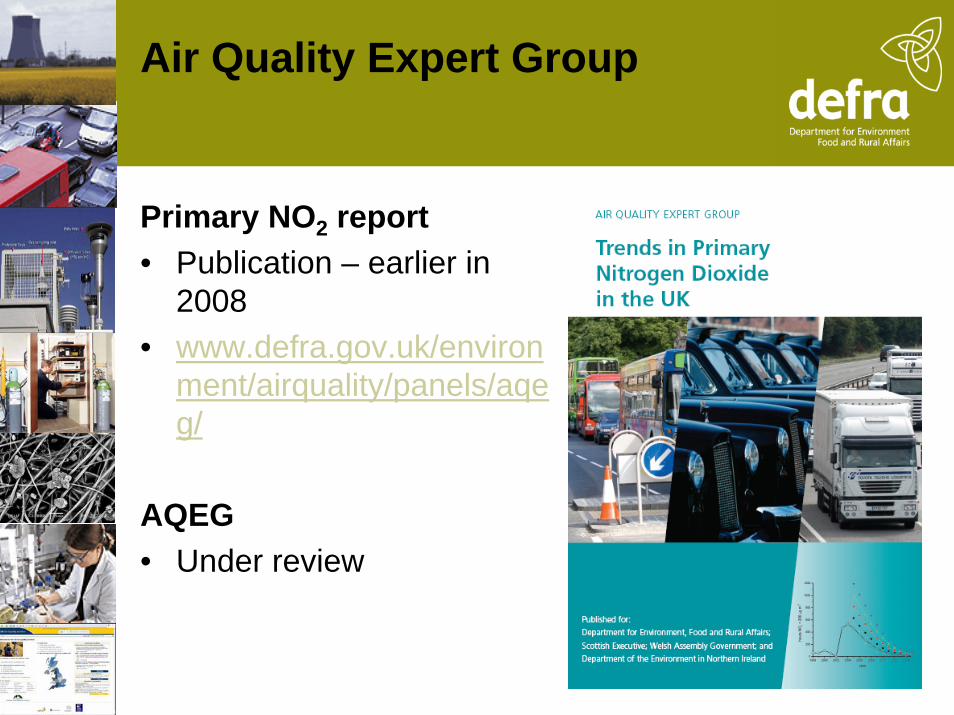
Air Quality Expert Group
Primary NO2 report• Publication – earlier in
2008• www.defra.gov.uk/environ
ment/airquality/panels/aqeg/
AQEG• Under review

Local: Performance Indicator
Air quality performance indicator• New Performance Framework published on 11 October 07-
www.communities.gov.uk/publications/localgovernment/nationalindicator
• Each local authority to report against a set of 198 indicators• Local Area Agreements NI 194 - Level of air quality – reduction in NOx and PM10
emissions through local authority’s estate and operations• Emissions tool – Excel spreadsheet• Calculates emissions of CO2, NOx and PM10
• Emissions tool available via www.defra.gov.uk/environment/airquality/index.htm
• Should be pulling together the data required now – don’t leave it until early 2009!

Local: Local Air Quality Management (LAQM)
• LAQM guidance under revision before 4th round of review and assessment
• Policy and Technical Guidance updates• Consultation – next month• Final version available late 2008• Web-based reporting for USAs and Progress
Reports• Evaluations of last round of LAQM process and
support available at www.defra.gov.uk/environment/airquality/local/eval/index.htm

Contents of Technical Guidance
• Source based rather than by pollutant• PM10/PM2.5; KCL VCM (+ web tool); • Difficult modelling; • NOx:NO2; primary NO2;• Vehicle emission factors; • Updated background maps split by source; • biomass; • exposure reduction;• congestion; non-exhaust emissions; shipping;
rail; near kerbside and height adjustments; nomograms
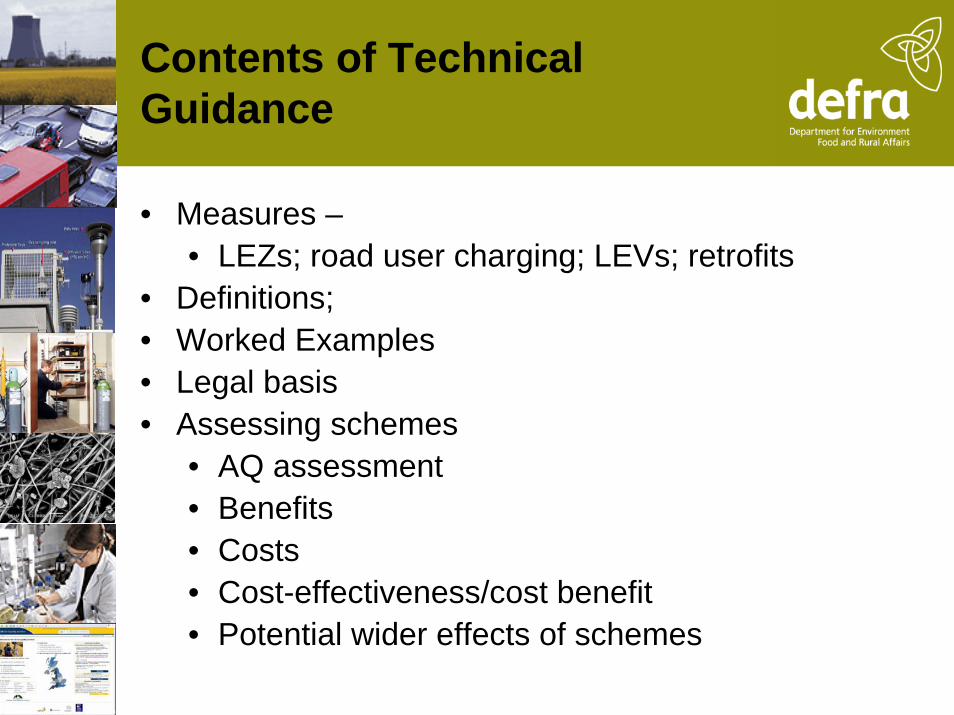
Contents of Technical Guidance
• Measures –• LEZs; road user charging; LEVs; retrofits
• Definitions;• Worked Examples• Legal basis• Assessing schemes
• AQ assessment• Benefits• Costs• Cost-effectiveness/cost benefit• Potential wider effects of schemes
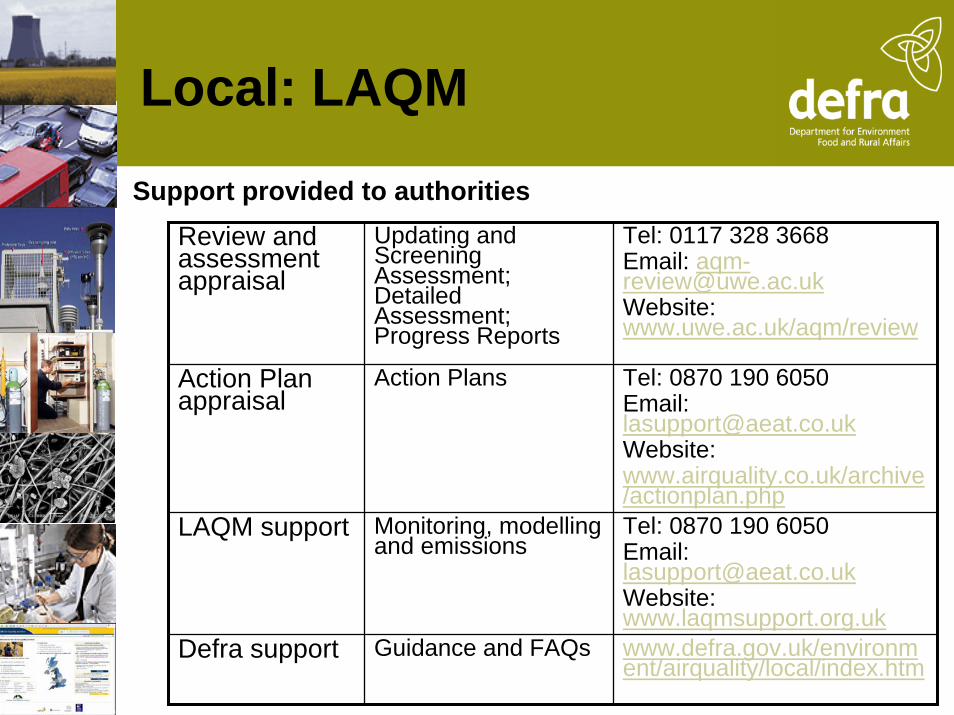
Local: LAQM
Support provided to authoritiesReview and assessment appraisal
Updating and Screening Assessment; Detailed Assessment; Progress Reports
Tel: 0117 328 3668Email: [email protected]: www.uwe.ac.uk/aqm/review
Action Plan appraisal
Action Plans Tel: 0870 190 6050Email: [email protected]: www.airquality.co.uk/archive/actionplan.php
LAQM support Monitoring, modelling and emissions
Tel: 0870 190 6050Email: [email protected]: www.laqmsupport.org.uk
Defra support Guidance and FAQs www.defra.gov.uk/environment/airquality/local/index.htm

Local: AQ grant
• Local authorities invited to submit grant applications• Allocation of £2.36m• Bids of £8.3m
• Bids currently being assessed against priority criteria
• Any grant offered does not have to be spent in the current financial year
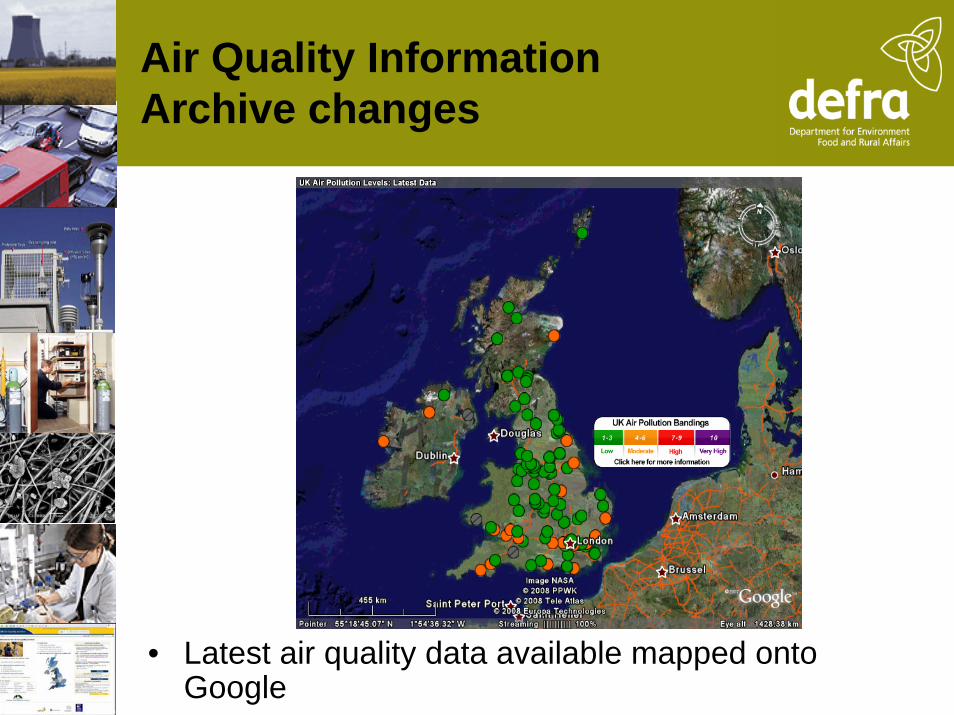
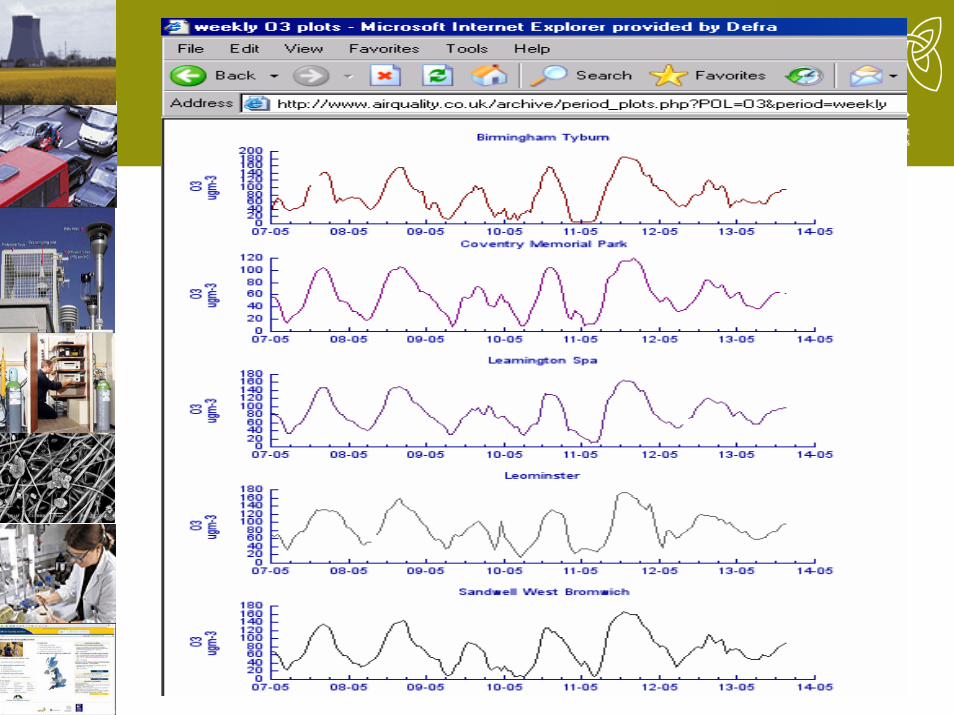
Air Quality Information Archive changes
• Latest air quality data available mapped onto Google
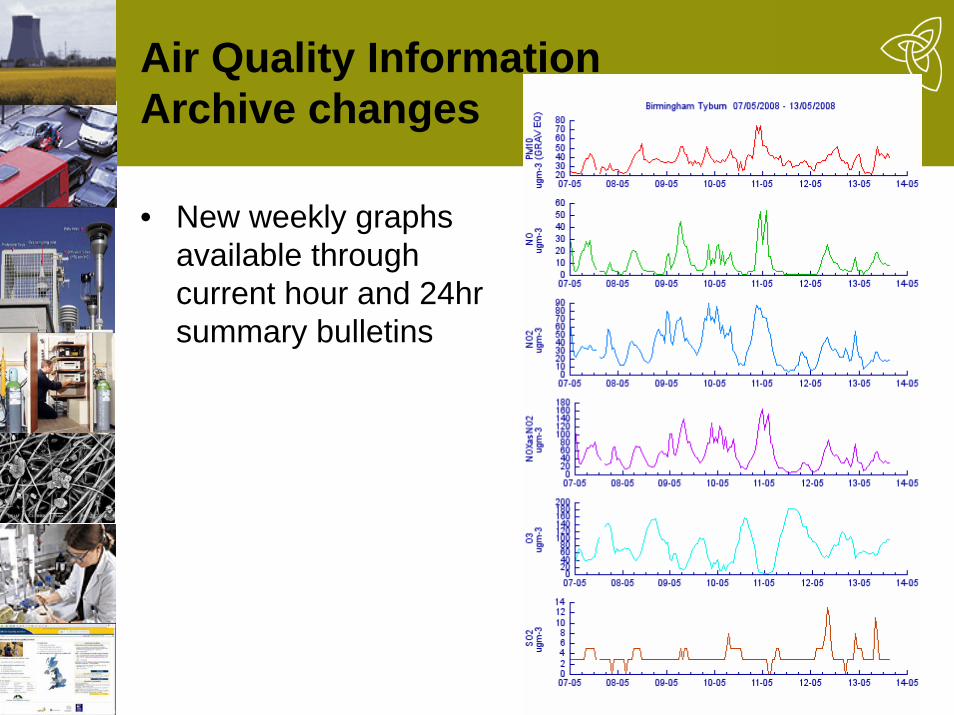
Air Quality Information Archive changes
• New weekly graphs available through current hour and 24hr summary bulletins