Defying Gravity: How Long Will Japanese Government Bond Prices Remain High? Takeo Hoshi (UCSD, NBER, and TCER) and Takatoshi Ito (University of Tokyo, NBER, and TCER) http://www.nber.org/papers/w18287 For presentation at Banca D’Italia conference December 18, 2012 June 24, 2012 1 Japanese Debt Crisis
Transcript
Defying Gravity: How Long Will Japanese Government Bond
Prices Remain High?
Takeo Hoshi (UCSD, NBER, and TCER) and
Takatoshi Ito (University of Tokyo, NBER, and TCER) http://www.nber.org/papers/w18287
For presentation at Banca D’Italia conference
December 18, 2012
June 24, 2012 1 Japanese Debt Crisis
Questions
1. Recent economic research shows the Japanese fiscal situation is not sustainable, but why do JGBs prices remain high, defying gravity?
2. What are the factors that make defying gravity?
3. Will JGBs continue to defy gravity? How long?
4. If not, what will be a trigger for change?
5. How will the crisis (if it happens) look like?
June 24, 2012 2 Japanese Debt Crisis
Answers — in advance 1. High debt-to-GDP ratio with low JGB yields, supported by:
– Large private sector domestic savings with home bias
– And the expectation of future fiscal consolidation before the government debt reaches the ceiling of private sector domestic savings
2. Favorable conditions do not last long as the private saving rate continues to decline as a result of aging and population decline
3. A debt crisis will happen at latest when the government debt reaches the ceiling of private sector saving
4. A debt crisis will happen earlier when the expectation changes 1. How to finance the reconstruction after the earthquake/tsunami
disaster can be critical
5. When the crisis happens, the government will be forced to respond with fiscal austerity
June 24, 2012 Japanese Debt Crisis 3
Major assumptions on simulation
• Tax-GDP ratio – Constant at 30% (Alternative, if gradually raised to 46% by
2029)
• Government expenditures excluding interest payments – Doi-Hoshi projections
• Real Interest rate on JGP: – Growth rate + premium
• Household saving-GDP ratio: – gradual decline from +3% in 2010 to -3% in 2040
• GDP growth rate (demographic decomposition): – Labor productivity growth (1.05% (low scenario) or 2.09% (high
scenario)
• Corporate saving rate: – The balance will not change from 2010
June 24, 2012 Japanese Debt Crisis 4
Summary
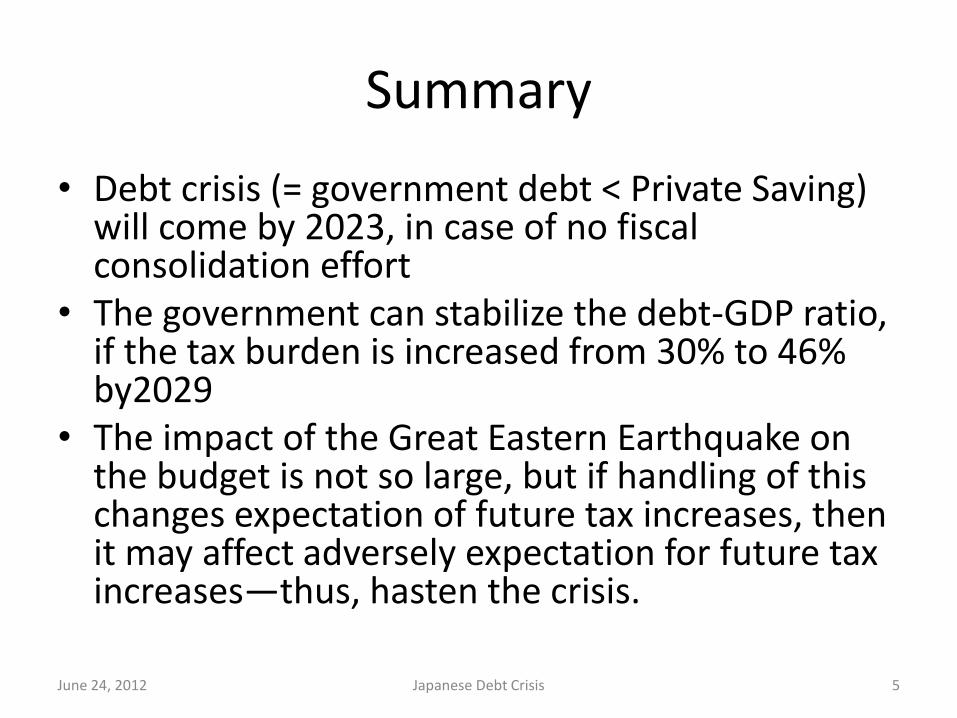
• Debt crisis (= government debt < Private Saving) will come by 2023, in case of no fiscal consolidation effort
• The government can stabilize the debt-GDP ratio, if the tax burden is increased from 30% to 46% by2029
• The impact of the Great Eastern Earthquake on the budget is not so large, but if handling of this changes expectation of future tax increases, then it may affect adversely expectation for future tax increases—thus, hasten the crisis.
June 24, 2012 Japanese Debt Crisis 5
Facts
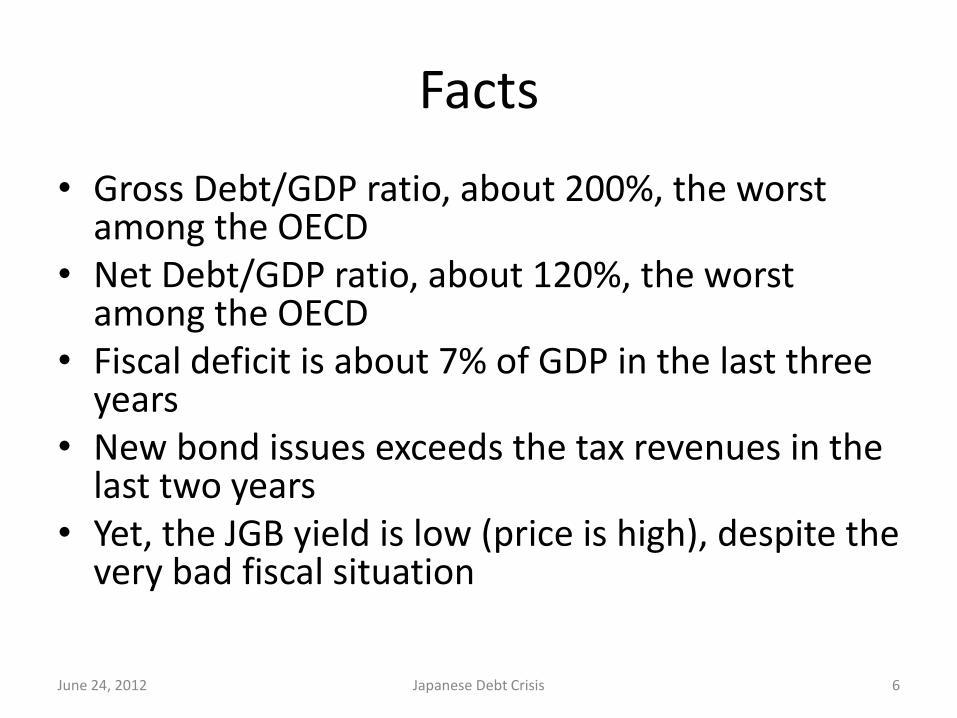
• Gross Debt/GDP ratio, about 200%, the worst among the OECD
• Net Debt/GDP ratio, about 120%, the worst among the OECD
• Fiscal deficit is about 7% of GDP in the last three years
• New bond issues exceeds the tax revenues in the last two years
• Yet, the JGB yield is low (price is high), despite the very bad fiscal situation
General government financial balances Surplus (+) or deficit (-) as a per cent of nominal GDP
Source: OECD Economic Outlook 91 database.
Recent Empirical Studies
June 24, 2012 Japanese Debt Crisis 10
• Broda and Weinstein (2005), Doi (2009), Doi, Hoshi and Okimoto (2011)
• Imrohoroğlu and Sudo (2011), Hosono and Sakuragawa (2011)
• Doi and Ihori (2009), Ito (2011), Ito, Watanabe and Yabu (2011)
• Ostry et al. (2010), Gagnon (2011), IMF (2011)
• All of them shows the Japanese fiscal situation is unsustainable
June 24, 2012 Japanese Debt Crisis 11
Table 1. Different concepts of Government liabilities
(Trillion yen)ratio toGDP
(Trillion yen)ratio toGDP
(Trillion yen)ratio toGDP
Longterm Liability of National Government Longterm Liability of National Government National Government LiabilitiesJGB 636.3 JGB 668.0 JGB (+) 559Zaito Bonds 118.2 Zaito Bonds (**) Not included Zaito Bonds Not includedOthers(*) 59.1 Others (*) 24.0 Others (*) 63
Financing Bills (**) 110.8 Financing Bills (**) Not included Financing Bills and Discount Bonds(+) 149Government guarantee 44.7 Government Guarantee Not included Government Guarantee (**) 54
Total 969.1 202% Local, Long-term liabilities 200.0 Local liabilities 183
GDP(2010) 479.0 Total 892.0 186% Liabilities in Social Security Fund 15
Total 1 ,023 214%
National and Local Government Longtermliability (to be redeemed by mainly futuretaxes)
Source: Ministry of Finance(2011), Government LiabilitiyManagement Report 2011, p.86http://www.mof.go.jp/jgbs/publication/debt_management_report/2011/index.htm (in Japanese)
(*) Borrowings for accounts to be distributed to localgovernments (Kofu tax), about 34 trillion yen, iscategorized in the local liabilities instead of Nationalgovernment liabilities
(**) Zaito bonds are not included because they are intheory repaid from income from government investment;Financing bills are not incuded because they are short-term, and also they are backed by assets (foreignreserves); and gouarantee is not included because theyare only contingent liabilities.
General Government Gross Liability (National Accountconcept)
Source: Ministry of Finance(2011), Government LiabilitiyManagement Report 2011, p.86http://www.mof.go.jp/jgbs/publication/debt_management_report/2011/index.htm (in Japanese)
(+) Short-term discount bonds are excluded from JGB and includedin Financing bills and discount bonds
(*) Others include borrowings for accounts to be distributed to localgovernments (Kofu tax), about 34 trillion yen.
(**) Government guarantee includes liabilities at the public agencies(Dokuritsu Gyosei Hojin)
Forecast for March2012
End of March 2010
(*) Others includes government bonds that areissues as capital of public entities (Kofu Kokusai)and borrowings
National Liabilities: JGB, Borrowings andGuarantees as reported to IMF
(**) Financing Bills are issued primarily to fund theforeign reserves that are held in the special accountof the government. They are rolled over every 3months, and considered to be short-term liabilitiesthat have assets, that is foreign reserves, to matchthe liabilities. FBs should be excluded from long-term liabilities, and from "net" government liabilities.
(Source) The Ministry of Finance, homepagehttp://www.mof.go.jp/english/jgbs/reference/gbb/e2303.html
At the end of March2011
File: JGBRiskFigTab*.xlsx
As the amount of JGBs increased, the yield stayed low (or fell). Why?
– Traditionally, high private sector domestic savings
– Home bias of Japanese investors
– And the expectation of fiscal consolidation in the near future to make the fiscal policy sustainable
• Reasons why it would not continue forever
– High private sector domestic savings will not continue forever; there is absolute ceiling
– When the expectation (fiscal consolidation happens before the government debt reaches the ceiling of domestic private sector savings) changes, a crisis may happen earlier
June 24, 2012 Japanese Debt Crisis 14
2005 March 2006 March 2007 March 2008 March 2009 March 2010 March
Table 4. History: Demographic Dividend in the past
June 24, 2012 Japanese Debt Crisis 24
ΔrGDP = ΔPOP + Δ (wPOP)/(POP) + Δ (rGDP/wPOP)
1955-1970 9.70% 1.00% 1.03% 7.77%
1971-1980 4.46% 1.22% 0.01% 3.46%
1981-1990 4.64% 0.55% 0.21% 3.75%
1991-2000 1.19% 0.27% 0.09% 1.16%
2001-2010 0.75% 0.02% -0.49% 1.34%
But demography turns against growth in the future, due to the low and declining fertility rate and the lengthening longevity
June 24, 2012 Japanese Debt Crisis 25
7.500 6.800
6.300
0
2.000
4.000
6.000
8.000
10.000
12.000
14.000
2011 2021 2031
(10 thousand) Population Projection
75歳以上
65~74歳
20~64歳
0~19歳
▼7 mil. workers ▼5 mil.
Workers
Net Financial Assets
• Net financial assets of private sector =
Net financial assets of the household sector – Value of shares and other equities held by the household sector + Cash, deposits, government bonds, and public corporation bonds held by the private nonfinancial sector
June 24, 2012 Japanese Debt Crisis 26
Debt dynamics and the ceiling of private sector financial assets
• Government debt:
• Private sector financial assets
– Max operator, to distinguish the two cases
• If a>b, {a-b} is added to a(t+1),
• If a<b, then net liability {a-b} will not be added to a(t+1)
• Ceiling;
June 24, 2012 Japanese Debt Crisis 27
1
1
1
tt t t t
t
rb b g
1
1max( ,0)
1
tt t t t t
t
ra b a b s
1 1 1 1( )t t t t tB B S A B
1 1
11
t tt
t
s ab
Three Alternative Assumptions on the Future Interest Rates
R1: Interest rate stays at the level of 2010 (1.3%) as long as the growth rate does not exceed that level. When the growth rate exceeds 1.3%, the interest rate is equal to the growth rate.
rt = max (ηt , 1.3%) R2: Interest rate starts at 1.3%. For every 1% increase in the
debt to GDP ratio over its level in 2010, the interest rate increases by 2 basis points (0.02%). Tokuoka (2010)
rt = 1.3% + 0.02*(bt-1.53) R3: Interest rate starts at 1.3%. For every 1% increase in the
debt to GDP ratio over its level in 2010, the interest rate increases by 3.5 basis points (0.035%). Gagnon (2010)
rt = 1.3% + 0.035*(bt-1.53)
June 24, 2012 Japanese Debt Crisis 28
Figure 5. Government Debt and Private Sector Financial Assets: 2010-2040 (2% GDP Growth)
June 24, 2012 Japanese Debt Crisis 29
150%
200%
250%
300%
350%
400%
450%
500%
20
10
20
11
20
12
20
13
20
14
20
15
20
16
20
17
20
18
20
19
20
20
20
21
20
22
20
23
20
24
20
25
20
26
20
27
20
28
20
29
20
30
20
31
20
32
20
33
20
34
20
35
20
36
20
37
20
38
20
39
20
40
Debt1
Debt2
Debt3
MaxDebt1
MaxDebt2
MaxDebt3
Table 5. Implication of 2% growth which is often used in government forecasts
June 24, 2012 Japanese Debt Crisis 30
ΔrGDP = ΔPOP + Δ(wPOP)/(POP) + Δ(rGDP/wPOP)
2011-2020 2.00% -0.35% -0.65% 3.00%
2021-2030 2.00% -0.63% -0.13% 2.76%
2031-2040 2.00% -0.86% -0.76% 3.62%
2041-2050 2.00% -1.05% -0.49% 3.53%
Government forecasts Implies Unrealistic per-worker
productivity growth
Table 6. Growth per worker productivity at 1.05% to future
June 24, 2012 Japanese Debt Crisis 31
File: DemographyJapan.xlsx
Notes: Authors’ calculation. Each row does not exactly add up as the equation suggests, due to approximation in ten-year average growth rates . ⊿POP and ⊿(wPOP/POP) are calculated from forecasts of IPSS, then ⊿(rGDP/wPOP) is assumed to be 1.05%, which was the average of 1994-2010. ⊿rGDP was derived from the identity; Data Source: GDP from Cabinet Office, Japan for GDP ; and population from National Institute of Population and Social Security Research (IPSS)
⊿rGDP = ⊿POP + ⊿(wPOP /POP) + ⊿(rGDP /wPOP)
2011-20 -0.04% -0.31% -0.77% 1.05%
2021-30 0.27% -0.62% -0.15% 1.05%
2031-40 -0.47% -0.83% -0.68% 1.05%
2041-50 -0.45% -0.99% -0.50% 1.05%
Figure 6. Government Debt and Private Sector Financial Assets: 2010-2040 (1.05% GDP per worker growth)
June 24, 2012 Japanese Debt Crisis 32
150%
250%
350%
450%
550%
650%
750%
850%
20
10
20
11
20
12
20
13
20
14
20
15
20
16
20
17
20
18
20
19
20
20
20
21
20
22
20
23
20
24
20
25
20
26
20
27
20
28
20
29
20
30
20
31
20
32
20
33
20
34
20
35
20
36
20
37
20
38
20
39
20
40
Debt/GDP
Debt2
Debt3
MaxDebt1
MaxDebt2
MaxDebt3
Table 7. Per-worker labor productivity increase of 2.09%
June 24, 2012 Japanese Debt Crisis 33
File: DemographyJapan.xlsx
⊿rGDP = ⊿POP + ⊿(wPOP /POP) + ⊿(rGDP /wPOP)
2011-20 0.98% -0.31% -0.77% 2.09%
2021-30 1.30% -0.62% -0.15% 2.09%
2031-40 0.55% -0.83% -0.68% 2.09%
2041-50 0.57% -0.99% -0.50% 2.09%
Notes: Authors’ calculation. Each row does not exactly add up as the equation suggests, due to approximation in ten-year average growth rates . ⊿POP and ⊿(wPOP/POP) are calculated from forecasts of IPSS, then ⊿(rGDP/wPOP) is assumed to be 2.09%, which was the average of 2001-2007. ⊿rGDP was derived from the identity; Data Source: GDP from Cabinet Office, Japan for GDP ; and population from National Institute of Population and Social Security Research (IPSS)
Figure 7. Government Debt and Private Sector Financial Assets: 2010-2040 (2.09% GDP per worker growth)
June 24, 2012 Japanese Debt Crisis 34
150%
250%
350%
450%
550%
650%
750%
850%
20
10
20
11
20
12
20
13
20
14
20
15
20
16
20
17
20
18
20
19
20
20
20
21
20
22
20
23
20
24
20
25
20
26
20
27
20
28
20
29
20
30
20
31
20
32
20
33
20
34
20
35
20
36
20
37
20
38
20
39
20
40
Debt/GDP
Debt2
Debt3
MaxDebt1
MaxDebt2
MaxDebt3
Expectation of future fiscal consolidation
• We show the existence of an expected path of future tax rates that eventually stabilize the debt to GDP ratio
• If the market currently has such expectation, the absence of crisis for JGB is understandable
• If the expectation changes (and this often happens suddenly and unexpectedly), this will result in a crisis
June 24, 2012 Japanese Debt Crisis 35
Figure 8. Sustainable Tax Policy under Each Interest Rate Assumption
Figure 9. Debt/GDP Ratio with Sustainable Tax Policy
June 24, 2012 Japanese Debt Crisis 37
140%
160%
180%
200%
220%
240%
260%
280%
2010 2020 2030 2040 2050 2060 2070 2080 2090 2100
Debt/GDP (R1)
Debt/GDP (R2)
Debt/GDP (R3)
Figure 10. Debt to MaxDebt Ratio with Sustainable Tax Policy
June 24, 2012 Japanese Debt Crisis 38
30%
40%
50%
60%
70%
80%
90%
100%
20
10
20
11
20
12
20
13
20
14
20
15
20
16
20
17
20
18
20
19
20
20
20
21
20
22
20
23
20
24
20
25
20
26
20
27
20
28
20
29
20
30
20
31
20
32
20
33
20
34
20
35
20
36
20
37
20
38
20
39
20
40
20
41
20
42
20
43
20
44
20
45
20
46
20
47
20
48
20
49
20
50
R1
R2
R3
Potential triggers of a crisis
1. Downgrading by credit rating agencies
2. Political shock (failure to pass a tax hike bill, reducing FILP purchase of JGBs)
3. Contagion from foreign countries experiencing sovereign debt crises
4. High energy prices (expectation of future monetary tightening or future inflation)
June 24, 2012 Japanese Debt Crisis 39
Downgrading is not likely to be a trigger
• Downgradings by credit rating agencies have been happening already
June 24, 2012 Japanese Debt Crisis 40
Table 8. Credit rating history
June 24, 2012 Japanese Debt Crisis 41
Will credit rating “Downgrade” become a trigger for a higher interest rate? --Not really, at least from the past experiences (See Figures 14-16) 1) Downgrades tend to be followed by lowering of the JGB interest rate 2) However, upgrade lowers the JGB rate more than downgrades
Moody's S&P Fitch
Change to Change to Change to
1993 5/3 Aaa
1998 7/23 Watch (-)
11/17 Aa1
2000 2/17 Watch (-) 6/29 AA+
9/8 Aa2
2001 9/6 Watch (-) 2/22 AA+ 11/26 AA
12/4 Aa3 11/27 AA
2002 2/13 Watch (-) 4/15 AA- 11/21 AA-
5/31 A2(*)
2007 7/4 Watch (+) 4/22 AA
10/11 A1
2008 6/30 Aa3
2009 5/18 Aa2
2011 8/24 Aa3 1/27 AA-
2012 5/22 A+
(*) 2-notch downgrade
June 24, 2012 Japanese Debt Crisis 42
Figure 11. Japan's Sovereign Ratings
Moody's
S&P
Fitch
Aaa / AAA
Aa1 / AA+
Aa2/ AA
Aa3 / AA-
A1 / A+
A2 / A
A3 / A-
Figure 12. Event Analysis, downgrade on JGB rate
June 24, 2012 43 Japanese Debt Crisis
-0,2
-0,15
-0,1
-0,05
0
0,05
panel 1 JGB interest rate(SP, downgrades)
-0,15-0,1
-0,050
0,050,1
0,15
panel 2 JGB interest rate(Moodys. downgrade
and negative watch)
-0,15-0,1
-0,050
0,050,1
0,15
t-1
50
t-7
5
t-2
5
t-5
t-1
t+1
t+5
t+2
5
t+7
5
t+1
50
panel 3. JGB interest rate(Moodys,
including upgrades)
Yen/Dollar rate reaction to downgrade
June 24, 2012 Japanese Debt Crisis 44
-4
-3
-2
-1
0
1
2
3
Panel 4. Yen/Dollar rate(SP, downgrades)
-2
-1,5
-1
-0,5
0
0,5
Panel 5. Yen/Dollar rate(Moodys,
downgrade and negative watch)
-2-10123
Panel 6. Yen/Dollar rate(Moodys,
including upgrades)
Nikkei 225 reaction to downgrades
June 24, 2012 Japanese Debt Crisis 45
-20
-15
-10
-5
0
5
Panel 7. Nikkei 225 stock prices(SP,
downgrade)
-15
-10
-5
0
5
Panel 8. Nikkei 225 stock prices(Moodys,
downgrade and negative watch)
-6
-4
-2
0
2
4
Panel 9. Nikkei 225 stock prices(Moodys, including upgrades)
Figure 13. JGB CDS wkly 2003-2011
0
20
40
60
80
100
120
20
03
/02
/01
20
03
/05
/01
20
03
/08
/01
20
03
/11
/01
20
04
/02
/01
20
04
/05
/01
20
04
/08
/01
20
04
/11
/01
20
05
/02
/01
20
05
/05
/01
20
05
/08
/01
20
05
/11
/01
20
06
/02
/01
20
06
/05
/01
20
06
/08
/01
20
06
/11
/01
20
07
/02
/01
20
07
/05
/01
20
07
/08
/01
20
07
/11
/01
20
08
/02
/01
20
08
/05
/01
20
08
/08
/01
20
08
/11
/01
20
09
/02
/01
20
09
/05
/01
20
09
/08
/01
20
09
/11
/01
20
10
/02
/01
20
10
/05
/01
20
10
/08
/01
20
10
/11
/01
20
11
/02
/01
20
11
/05
/01
JGB CDS weekly USD SR 5YR
June 24, 2012 46 Japanese Debt Crisis
Earthquake/Tsunami of March 2011
June 24, 2012 Japanese Debt Crisis 47
• Total property cost is estimated to be 3% to 5% of GDP
• The government issued Reconstruction Bonds of 11.6 trillion yen (2.4% of GDP) in fiscal 2011 and plans to issue 12.7 trillion yen (2.6% of GDP) in fiscal 2012
– These additional bond issues have only small impact
• We consider potential delay of tax increase (from 2012 to 2017)
– The additional delay can have substantial impact
• Cost of nuclear decommissioning is estimated to be substantial. We add 1% of GDP to government expenditure for fiscal 2012, 2013, 2014, 2015
– Combined with delay, this would be fatal
Figure 14. Debt to MaxDebt ratio with reconstruction expenditures
June 24, 2012 Japanese Debt Crisis 48
40%
50%
60%
70%
80%
90%
100%
20
10
20
11
20
12
20
13
20
14
20
15
20
16
20
17
20
18
20
19
20
20
20
21
20
22
20
23
20
24
20
25
20
26
20
27
20
28
20
29
20
30
20
31
20
32
20
33
20
34
20
35
20
36
20
37
20
38
20
39
20
40
20
41
20
42
20
43
20
44
20
45
20
46
20
47
20
48
20
49
20
50
With DelayedTax Increase
WithReconstructionExpenses
Sustainable
Figure 15. Debt to MaxDebt ratio with reconstruction and nuclear cleanup expenses


![[Superpartituras.com.Br] Defying Gravity](https://static.documents.pub/doc/80x56/55cf9241550346f57b94f8c3/superpartiturascombr-defying-gravity.jpg)


