This is a repository copy of Degenerative inter-vertebral disc disease osteochondrosis intervertebralis in Europe: prevalence, geographic variation and radiological correlates in men and women aged 50 and over. White Rose Research Online URL for this paper: http://eprints.whiterose.ac.uk/120926/ Version: Accepted Version Article: Armbrecht, G., Felsenberg, D., Ganswindt, M. et al. (26 more authors) (2017) Degenerative inter-vertebral disc disease osteochondrosis intervertebralis in Europe: prevalence, geographic variation and radiological correlates in men and women aged 50 and over. Rheumatology, 56 (7). ISSN 1462-0324 https://doi.org/10.1093/rheumatology/kex040 [email protected]https://eprints.whiterose.ac.uk/ Reuse Unless indicated otherwise, fulltext items are protected by copyright with all rights reserved. The copyright exception in section 29 of the Copyright, Designs and Patents Act 1988 allows the making of a single copy solely for the purpose of non-commercial research or private study within the limits of fair dealing. The publisher or other rights-holder may allow further reproduction and re-use of this version - refer to the White Rose Research Online record for this item. Where records identify the publisher as the copyright holder, users can verify any specific terms of use on the publisher’s website. Takedown If you consider content in White Rose Research Online to be in breach of UK law, please notify us by emailing [email protected] including the URL of the record and the reason for the withdrawal request.
Transcript
This is a repository copy of Degenerative inter-vertebral disc disease osteochondrosis intervertebralis in Europe: prevalence, geographic variation and radiological correlates in men and women aged 50 and over.
White Rose Research Online URL for this paper:http://eprints.whiterose.ac.uk/120926/
Version: Accepted Version
Article:
Armbrecht, G., Felsenberg, D., Ganswindt, M. et al. (26 more authors) (2017) Degenerative inter-vertebral disc disease osteochondrosis intervertebralis in Europe: prevalence, geographic variation and radiological correlates in men and women aged 50 and over. Rheumatology, 56 (7). ISSN 1462-0324
Unless indicated otherwise, fulltext items are protected by copyright with all rights reserved. The copyright exception in section 29 of the Copyright, Designs and Patents Act 1988 allows the making of a single copy solely for the purpose of non-commercial research or private study within the limits of fair dealing. The publisher or other rights-holder may allow further reproduction and re-use of this version - refer to the White Rose Research Online record for this item. Where records identify the publisher as the copyright holder, users can verify any specific terms of use on the publisher’s website.
Takedown
If you consider content in White Rose Research Online to be in breach of UK law, please notify us by emailing [email protected] including the URL of the record and the reason for the withdrawal request.
Degenerative Inter-Vertebral Disc Disease (Osteochondrosis Intervertebralis) in Europe: Prevalence, Geographic Variation, and Radiological Correlates in Men and Women Aged 50 and Over
Gabriele Armbrecht 1, Dieter Felsenberg 1, Melanie Ganswindt 1, Mark Lunt 2,3, Stephen K Kaptoge 2,4, Klaus Abendroth 5, Antonio Aroso Dias 6, Ashok K Bhalla 7, Jorge Cannata Andia 8, Jan Dequeker 9, Richard Eastell 10, Krysztoff Hoszowski 11, George Lyritis 12, Pavol Masaryk 13, Joyce van Meurs 14, Tomasz Miazgowski 15, Ranuccio Nuti 16, Gyula Poór 17, Inga Redlund-Johnell 18, David M Reid 19, Helmut Schatz 20, Christopher J Todd 4,21, Anthony D Woolf 22, Fernando Rivadeneira 14, Muhammad K Javaid 23, Cyrus Cooper 23,24, Alan J Silman 3,23,‡, Terence W O’ Neill3, and Jonathan Reeve 2,23,‡ On behalf of the joint European Vertebral Osteoporosis Study (EVOS) and European Prospective Osteoporosis Study (EPOS) Groups 衞
1Department of Radiology and Nuclear Medicine, Free University, Berlin, Germany 2University Department of Medicine, Cambridge, CB2 0QQ U.K 3NIHR Musculoskeletal Biomedical Research Unit, Manchester Academic Health Science Centre, Manchester, & Arthritis Research UK Centre for Epidemiology, Manchester, U.K 4Department of Public Health and Primary Care, Strangeways Research Laboratory, Cambridge, CB1 8RN U.K 5Klinik fur Innere Medezin IV Jena Germany 6Hospital de San Joao, Oporto, Portugal 7Royal National Hospital for Rheumatic Diseases, Bath, U.K. 8Asturias General Hospital, Oviedo, Spain 9University Hospital, Leuven, Belgium 10Department of Human Metabolism, University of Sheffield, Sheffield, UK 11PKP Hospital, Warsaw, Poland 12Laboratory for the Research of Musculoskeletal System, University of Athens,
*Address for correspondence: Dr J Reeve, NIHR Musculo-skeletal Biomedical Research Unit, Botnar Research Centre & Institute of Musculoskeletal Sciences, Nuffield Department of Orthopaedics, Rheumatology and Musculoskeletal Sciences, Windmill Road, Oxford, OX3 7LD, U.K. [email protected] (no fax).‡EVOS & EPOS Project Co-ordinators.衞Principal Investigators of the centres participating in both the EVOS and EPOS Study Groups: Aberdeen UK - Reid DM; Athens, Greece – Lyritis G; Bath UK - Bhalla AK; Berlin, Germany – Felsenberg D, Banzer D, Reisinger W; Bochum, Germany - Schatz H; Budapest Hungary - Poor G; Cambridgeshire UK -Todd CJ; Erfurt, Germany – Kragl G; Graz, Austria – Weber K; Harrow UK - Reeve J; Heidelberg, Germany Scheidt-Nave C; Jena, Germany - Abendroth K; Leuven Belgium - Dequeker J; Lyon France - Delmas PD†; Lubeck, Germany – Raspe H; Malmo, Sweden - Johnell O,†; Manchester UK - O’ Neill TW; Moscow Russia – Benevolenskaya L; Oporto, Portugal - Aroso A; Oviedo Spain - Cannata J; Piestany Slovakia - Masaryk P; Prague, Czech Republic – Havelka S,†; Rotterdam Netherlands – Pols H; Siena Italy - Nuti R; Szczecin Poland - Miazgowski T; Truro UK - Woolf AD; Warsaw Poland - Hoszowski K; Yaroslavl Russia – Yershova O; Zagreb Croatia – Jajic I,†.†Deceased
Conflict of Interest Statement:Gabriele Armbrecht MD, Dieter Felsenberg MD, Melanie Ganswindt MD, Mark Lunt PhD, Stephen K Kaptoge PhD, Klaus Abendroth MD, Antonio Aroso Dias MD, Ashok K Bhalla MD, Jorge Cannata Andia MD, Jan Dequeker MD, Richard Eastell MD, Krysztoff Hoszowski MD, George Lyritis MD, Pavol Masaryk MD, Joyce van Meurs PhD, Tomasz Miazgowski MD, Ranuccio Nuti MD, Gyula Poor MD, Inga Redlund-Johnell MD, David M Reid MD, Helmut Schatz MD, Christopher J Todd PhD, Anthony D Woolf MD, Fernando Rivadeneira MD, Muhammed K Javaid MD, Cyrus Cooper MD, Alan J Silman MD, Terence W O’ Neill MD and Jonathan Reeve DM all declare that they have no conflict of interest.No commercial organization financed this study.
Europe PMC Funders GroupAuthor ManuscriptRheumatology (Oxford). Author manuscript; available in PMC 2017 September 04.
Published in final edited form as:Rheumatology (Oxford). 2017 July 1; 56(7): 1189–1199. doi:10.1093/rheumatology/kex040.
Europe P
MC
Funders A
uthor Manuscripts
Europe P
MC
Funders A
uthor Manuscripts
Athens, Greece 13Institute of Rheumatic Diseases, Piestany, Slovakia 14Department of Epidemiology and Department of Internal Medicine, Erasmus University, Rotterdam, Netherlands 15Depts of Medicine & Hypertension, Pomeranian Medical University, Szczecin, Poland 16Institute of Clinical Medicine, University of Siena, Siena, Italy 17National Institute of Rheumatology and Physiotherapy, Semmelweis University, Budapest, Hungary 18Depts Orthopaedics and Radiology, Malmö General Hospital Sweden 19School of Medicine and Dentistry, University of Aberdeen, U.K. 20Med Klinik & Polyklinik Bochum, Germany 21School of Health Sciences, The University of Manchester, Oxford Road, Manchester, M13 9PL U.K. 22Royal Cornwall Hospital, Truro U.K. 23NIHR Musculo-skeletal Biomedical Research Unit, Nuffield Department of Orthopaedics, Rheumatology and Musculoskeletal Sciences, Windmill Road, Oxford, OX3 7LD, U.K. 24MRC Lifecourse Epidemiology Unit, Southampton SO16 6YD, UK
Abstract
Objectives— To assess the prevalence across Europe of radiological indices of degenerative
inter-vertebral disc disease (DDD); and to quantify their associations with, age, sex, physical
anthropometry, areal bone mineral density (aBMD) and change in aBMD with time.
Methods— In the population-based European Prospective Osteoporosis Study 27 age-stratified
samples of men and women from across the continent aged 50+ had standardized lateral
radiographs of the lumbar and thoracic spine to evaluate the severity of DDD, using the Kellgren-
Lawrence (KL) scale. Measurements of anterior, mid-body and posterior vertebral heights on all
assessed vertebrae from T4 to L4 were used to generate indices of end-plate curvature.
Results— Images from 10,132 participants (56% female, mean age 63.9 years) passed quality
checks. Overall, 47% of men and women had DDD grade 3 or more in the lumbar spine and 36%
in both thoracic and lumbar spine. Risk ratios for DDD grades 3 and 4, adjusted for age and
anthropometric determinants, varied across a three-fold range between centres, yet prevalences
were highly correlated in men and women. DDD was associated with flattened, non-ovoid inter-
vertebral disc spaces. KL grade 4 and loss of inter-vertebral disc space were associated with higher
spine aBMD.
Discussion— KL Grades 3 and 4 are often used clinically to categorise radiological DDD.
Highly variable European prevalences of radiologically-defined DDD Grades 3+ along with the
large effects of age may have growing and geographically unequal health and economic impacts as
the population ages. These data encourage further studies of potential genetic and environmental
causes.
Introduction
Degenerative inter-vertebral disc disease (DDD - osteochondrosis intervertebralis) has been
studied in single populations in the lumbar and cervical spine for several decades (1–4). We
aimed to compare the impact of DDD across Europe because its prevalence in the middle-
aged and elderly has not been previously compared between geographically distinct
Caucasian populations.
Armbrecht et al. Page 2
Rheumatology (Oxford). Author manuscript; available in PMC 2017 September 04.
Europe P
MC
Funders A
uthor Manuscripts
Europe P
MC
Funders A
uthor Manuscripts
Europe is genetically diverse and its people experience a wide range of environmental and
lifestyle exposures. Genetic factors are likely to play an important role in the aetiology of
arthritis of synovial joints (5–8); also occupation is clearly associated with some types of
arthritis (9). Since genetic aspects of risk (10) and susceptibility to inflammation (11) have
also been specifically linked to DDD, as well as other geographically variable risk factors
such as body mass (4) it is timely to contrast the impact of DDD in different communities.
This has now been resourced through data provided by a previous study of osteoporotic
vertebral fracture.
The main objective of this paper is to describe variations in population prevalences of DDD
across Europe and their relationship to age. The study of DDD within an osteoporosis study
that has recently been used to describe the prevalence of Scheuermann’ s disease across
Europe (12) provided additional opportunities. A large subset of participants had
measurements of areal bone mineral density (aBMD) of the lumbar spine and hip, enabling
the association of aBMD and its changes with different grades of DDD to be studied in a
sizeable sub-population. The data allowed us to assess associations of DDD with
geometrical profiles or shapes of vertebral bodies, as reflected in their vertebral height
measurements. Finally, statistical associations between the three conditions - prevalent
osteoporotic vertebral fracture, Scheuermann’ s Disease and DDD – have been studied at the
population level.
Participants & Methods
All participants were from the European Vertebral Osteoporosis Study (EVOS) (13) and
each gave informed consent according to the Declaration of Helsinki. In 1990-6, men and
women were recruited from population-based registers in 36 centres across Europe to study
vertebral fracture. Stratified sampling was used with the aim of recruiting equal numbers of
men and women in each of six 5-year age-bands: 50-54 years, 55-59 years, 60-64 years,
65-69 years, 70-74 years and 75 years and older. All those consenting had baseline lumbar
and spinal radiographs, according to a standardised protocol (14); the breathing technique
was used to obscure overlying lung shadows. An interviewer administered a lifestyle
questionnaire and measured height and weight (15). The study was continued as an
incidence vertebral fracture study: the European Prospective Osteoporosis Study (EPOS).
Repeat spinal radiographs were obtained a mean of 3.8 years after baseline (14, 16) but one
centre suffered a partial loss of their second radiographs in the post. Bone mineral density
was measured in as many centres as could obtain funding (17). After digitizing the images,
the identification of vertebral fractures in the thoracic and lumbar spine from T4 to L4 was
undertaken in Berlin.
The Berlin imaging centre then re-read as many vertebral images as were of adequate quality
for Scheuermann’ s disease and degenerative disc disease (DDD). For acceptability we used
the reproducible reading of a Kellgren-Lawrence (KL) score for both lumbar and thoracic
vertebrae, according to pre-defined criteria established in the centre for image analysis.
Armbrecht et al. Page 3
Rheumatology (Oxford). Author manuscript; available in PMC 2017 September 04.
Europe P
MC
Funders A
uthor Manuscripts
Europe P
MC
Funders A
uthor Manuscripts
Radiographs
In Germany funding was available for a senior radiographer to train each centre radiographer
to obtain consistency of imaging technique. The non-German centres sent a subset of early,
exemplary films to Berlin where the second author provided feedback to the centre
radiographers with the same aim in view. Three vertebral height measurements were made
on each vertebral body from T4 to L4 (n=13): anterior, mid-body and posterior (16) – see
Fig 1. From these vertebral height measurements, general aspects of vertebral shape were
calculated separately for the thoracic and lumbar vertebrae by subtracting the mid vertebral
height from the mean of the anterior and posterior heights for each vertebra and then
averaging the results regionally as an Index of End-Plate Concavity (IEPC – Fig 1). Clinical
diagnoses including Forestier’ s disease were also recorded at the time the vertebral heights
were measured according to the methods used in the clinical department (Table 1). Prevalent
vertebral deformities were identified using the McCloskey-Kanis algorithm (18). However,
to allow optimisation of vertebral height and other data by using side-by-side reading of
paired images participants with an incident morphometric vertebral fracture were excluded
(88 women and 41 men).
A fourth reader (MG) was trained to evaluate each set of images for Scheuermann’ s Disease
(12) and to score the lumbar and thoracic images separately for disc degeneration based on
the paired EVOS and EPOS images, using the Kellgren-Lawrence (KL) scale (5 gradations
from 0 to 4) according to generally agreed criteria (Table 1). Low image quality led to
further exclusion of 996 male and 832 female participants (14.7% overall). Each inter-
vertebral disc space from T4 through L4 was graded for loss of height (yes/no) and
degenerative vertebral deformities were enumerated referring to an atlas (19).
To avoid reader “drift” over time in the categorisation of images, a random subset of 10
radiographs from every 500 cases evaluated was contemporaneously analysed blind by the
first author and results compared. Discrepancies were resolved in open discussion involving
at least 2 other Study Radiologists. A decade later, a reproducibility study was done in which
100 randomly selected participants’ images, half with Scheuermann’ s disease, were
submitted blind to the first author and their KL scores compared with those originally
obtained (12).
Areal Bone Mineral Density (aBMD) and Change in aBMD
In 21 centres, participants had bone densitometry performed at baseline or during the follow-
up period. Eleven centres measured a BMD at the spine (L2-L4) and the hip, 2 measured
only the spine and 8 only the hip. Change in a BMD was measured in 1438 participants by
acquiring an a BMD measurement at the time of each radiograph.
The densitometers were pencil beam dual-energy X-ray absorptiometry (DXA) machines
made by Lunar, Hologic or Norland and were cross-calibrated using the European Spine
Phantom (20) prior to data analysis.
Armbrecht et al. Page 4
Rheumatology (Oxford). Author manuscript; available in PMC 2017 September 04.
Europe P
MC
Funders A
uthor Manuscripts
Europe P
MC
Funders A
uthor Manuscripts
Statistical Analysis of determinants of KL grade
To minimise bias, we restricted our analysis to data from the 27 centres providing 70% or
more fully readable paired interval radiographic images. Our primary DDD outcome was the
ordinal KL score. Numbers of inter-vertebral discs of reduced height and numbers of
deformed vertebrae were also studied as ordinal outcomes. Data for men and women were
analysed separately only when sex-adjusted analyses were considered inappropriate as
suggested by a statistically significant interaction with sex. The KL score recorded was
assessed separately for the thoracic and lumbar regions, being the highest for the region
concerned; and was treated as an ordinal outcome on a scale of 1-4 (no participant was
graded zero). Other outcomes/correlates were treated as binary if appropriate, including the
presence or absence of vertebral fractures; but anthropometry, DXA a BMD, IEPC and other
potential determinants of DDD were retained as continuous variables when measured as
such. Generalised ordinal logistic regression modelling (21), adjusting for age, sex, an age-
sex interaction term, and postulated correlates including geographical centre, nested within
four European regions “North (Scandinavia), South, East and West” (defined by the then
recently dismantled iron curtain, the Baltic sea and the Pyrenees and Alps); clinical
diagnoses; and measured radiographic features including IEPC and aBMD (22). In light of
odds ratios (ORs) over-estimating relative risks (RRs) when outcomes are common, we
transformed ORs into RRs in relation to a stated comparator to aid valid interpretation as
previously advocated (23).
In view of the partial availability of aBMD data, aBMD was excluded from the first round of
multivariable modelling. The other significant determinants (including interactions with sex
and centre) were entered into multivariable ordinal logistical regression models. Beginning
with interaction terms, non-significant variables were removed in increasing order of
significance until all remaining variables were significant at p<0.01.
Centre-specific risk coefficients were derived from the Logistic model for KL grade with
continuous variables (age, height, weight) set to mean values across the sample and absence
of other categorical diagnoses was assumed. These risk coefficients were correlated with
those for Scheuermann’ s disease (12).
When used as outcomes in linear regression models, lumbar and femoral neck (FN) a BMD
were log-transformed (24) to achieve normally distributed residuals. These models included
all significant interaction terms with sex. aBMD changes were annualised and made an
outcome variable to investigate the ongoing and contrasting effects of DDD on lumbar and
femoral aBMD. Annual rate of change in aBMD was also made an outcome variable to
investigate the contrasting associations of KL score and other correlates on lumbar and
femoral neck aBMD.
Results
Participants
From the 27 included centres, there remained 10,132 participants (5652 female), aged 50 to
over 75 years in whom all vertebral levels were evaluated. KL score readability was only
marginally associated with BMI (the participants with unreadable radiographs had a mean
Armbrecht et al. Page 5
Rheumatology (Oxford). Author manuscript; available in PMC 2017 September 04.
Europe P
MC
Funders A
uthor Manuscripts
Europe P
MC
Funders A
uthor Manuscripts
BMI 0.4 units lower than those with readable images, p=0.009). The mean ages of the
evaluated participants were 64.6 years (men) and 63.7 years (women). Descriptive statistics
of radiological abnormalities found are listed in Table 1. The 4,480 men had an average +/-
1SD height of 1.71 +/- 0.07 m and weight of 79.2 +/- 11.7 Kg; the 82% of men with neither
vertebral fractures, Scheuermann’ s nor Forestier’ s were on average 0.5 years younger than
the mean. The women had an average height of 1.59 +/- 0.06 m. and weight of 68.4 +/- 11.9
Kg. The 80% of women with neither vertebral fractures, Scheuermann’ s nor Forestier’ s were
on average 0.8 years younger than the mean. The agreement measured by Cohen’ s kappa (っ)
at the individual level between lumbar and thoracic KL scores in those with both readings
was 0.185 (SE 0.008) with significant asymmetry (p< 0.00001) due to a tendency towards
higher thoracic readings.
Reproducibility of DDD assessment
In the lumbar spine, the two readers read 65% of radiographs identically for KL grade and
Cohen’ s kappa (っ) was 0.42. In 2% the KL scores differed by more than one grade. In the
thoracic spine, 58% of readings concurred, っ was 0.38 and in 1% the KL scores differed by
more than one grade. There was significant asymmetry of disagreement (for the lumbar
spine and thoracic spine respectively: Bowker ば2 19.0 and 19.6; p both<0.005). This
reflected a tendency for the original readings to be graded 3, at the expense of both grades 2
and 4, with a higher likelihood than in the blinded second readings.
Kellgren-Lawrence (KL) Scores: Crude Prevalences According to Clinical Diagnosis
Fig 2 shows the un-adjusted prevalences of the four KL grades in men and women combined
for the thoracic spine, grouped according to the clustering of radiologically diagnosed
clinical conditions. Shown separately are subjects with a vertebral fracture anywhere in the
T4-L4 region, subjects with Scheuermann’ s disease, subjects with Forestier’ s disease and
the majority of subjects that had none of these diagnosed. In the lumbar spine only, a
positive identification of Scheuermann’ s disease had no significant effect on KL score
(p=0.3); however all other combinations of diagnoses increased KL score significantly
(p<0.001).
KL Scores for Lumbar Spine
Prevalences by Grade
In the lumbar spine, 3% of male participants had a KL score of 1, 42% had a score of 2, 48%
a score of 3 and 7% a score of 4. In women the equivalent percentages were 4%, 55%, 40%
and 1% (ば2=316, p<0.0001 for sex difference).
Associations of lumbar KL scores 3 & 4 with Age, Weight, Height and Geographic Centre
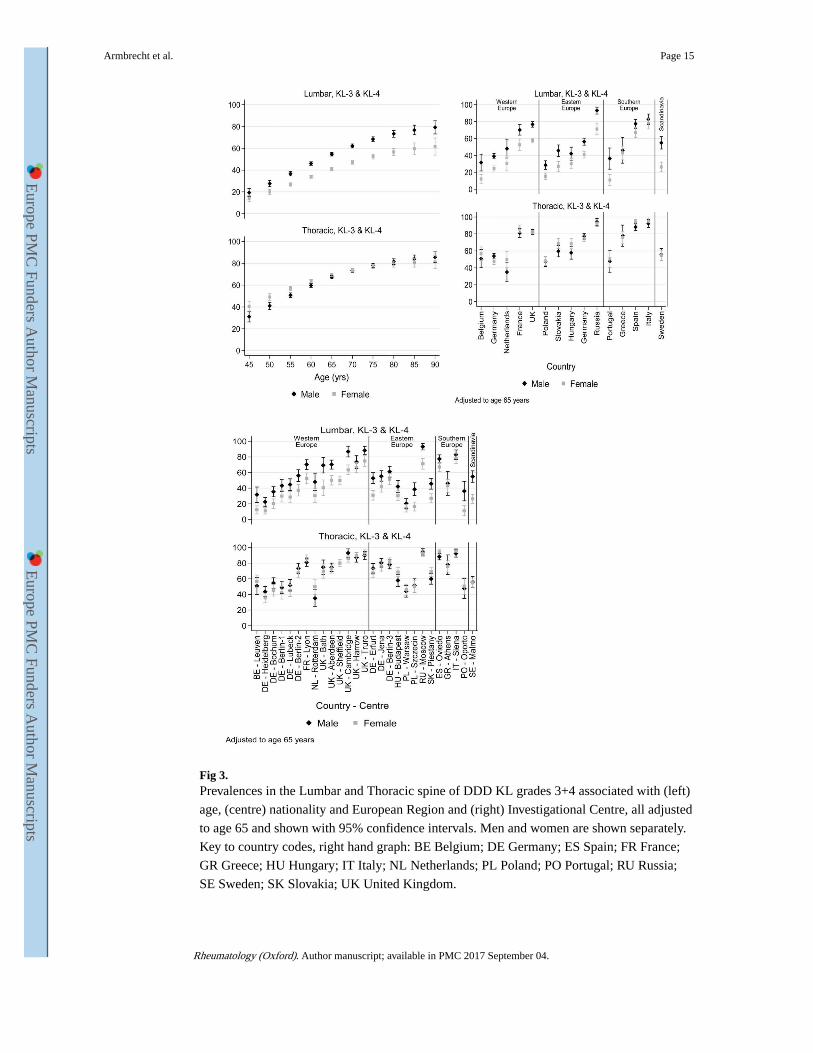
Fig 3 shows the large variations in prevalence of a KL score of 3 or 4 by age, country and
investigational centre adjusted for age and sex.
The multivariable adjusted associations of age, body weight, index of vertebral shape
(lumbar IEPC) and sex with Lumbar KL score, after adjusting for centre, are shown in Table
Armbrecht et al. Page 6
Rheumatology (Oxford). Author manuscript; available in PMC 2017 September 04.
Europe P
MC
Funders A
uthor Manuscripts
Europe P
MC
Funders A
uthor Manuscripts
2, (for all p<0.0001). The large independent effect of geographic centre (ば2 = 1,344,
p<0.0001) did not diminish the anthropometric associations.
KL Scores for Thoracic Spine
Prevalences by Grade
In the thoracic spine, less than 1% of male subjects overall had a KL score of 1, 32% had a
score of 2, 43% a score of 3 and 24% a score of 4. In women the equivalent percentages
were <1%, 31%, 57% and 12% (ば2=294, p<0.0001 for sex difference). Fig 3 shows the
much greater similarity between men and women in adjusted prevalences of a KL score of
3+ compared to the lumbar spine, with prevalences in the thoracic spine generally exceeding
those in the lumbar spine.
Associations of thoracic KL scores 3 & 4 with Age, Weight, Height and geographic Centre
The associations of age, body weight, thoracic vertebral shape (IEPC) and sex with Thoracic
KL score are also shown in Table 2, all being highly significant. Again, the large
independent effect of geographic centre (ば2 = 805, p<0.0001) did not diminish the
anthropometric effects.
When the results for men and women were modelled separately, their centre-specific risk
coefficients for K-L score, both lumbar and thoracic, were highly correlated (Spearman’ s な = 0.88, p<0.0001) and there were no statistically significant interactions between sex and
centre to suggest that any centre-dependent effect influenced differently the impact of DDD
in the lumbar or thoracic spine in men and women.
Correlates of DDD KL Grade 4
When KL grade 4 was the outcome variable, geographical centre was no longer an important
statistical determinant. The effects of the other significant correlates of KL grade derived
from the multivariate models are shown separately in Table 2 for KL grade 4 alone.
DDD Grades 3+4 and Scheuermann’ s disease
There was no statistical correlation at centre level between the prevalence of Scheuermann’ s
(as defined by Armbrecht et al (12)) and the centre-specific risk coefficients for KL grade
3+4 in the Lumbar spine (Spearman’ s な = 0.09, NS).
Degenerative Deformities and Reduced Disc Spaces
Fig 4 shows the distributions of numbers of degenerative deformities and reduced disc
spaces per participant recorded in our population. Because these phenomena contributed to
KL score grading, ordinal logistic models for predicting numbers of deformities and reduced
disc spaces respectively were reviewed that contained the same independent variables as
found in the models for KL score to see if they could illuminate aspects of the KL score
results. In each case, the determinants that were significantly associated with KL score were
also significantly associated with numbers of reduced disc spaces and numbers of deformed
vertebrae.
Armbrecht et al. Page 7
Rheumatology (Oxford). Author manuscript; available in PMC 2017 September 04.
Europe P
MC
Funders A
uthor Manuscripts
Europe P
MC
Funders A
uthor Manuscripts
Areal Bone Mineral Density
After accounting for the more rapid decline in aBMD with age in women, the following
radiological variables also had significant associations with L2-4 aBMD at p<0.0001:
increasing lumbar (L1-4) KL score (an 8.6% increase for each increment in K-L score);
reduced joint spaces in the L2-4 region (range 0-3) - a 10.0% increase per affected joint
space; and for each enumerated radiological vertebral fracture there was an additional 3.5%
reduction in aBMD independently of the other effects. In contrast, for femoral neck aBMD
the effect of reduced joint space(s) was not statistically significant. The effects of the other
three variables remained statistically significant at p<0.0001: but the effect of K-L score at
the femur was considerably smaller - a 2.6% increase in aBMD per unit increase in K-L
score; while the effects of lumbar IEPC and number of enumerated fractures were similar to
those for aBMD at L2-L4.
Areal Bone Mineral Density Change with Time
There was a statistical contrast in the participants with two interval L2-L4 a BMD
measurements. In those with the maximum K-L score of 4 (46 men, 7 women among 1438
participants), a BMD in L2-L4 increased by approximately 1% per annum more, after
adjusting for sex and its interaction with age, (p=0.024) when compared to those with lower
K-L scores. There was no significant association of K-L score with femoral neck aBMD
change. The association of K-L score 4 with increased L2-L4 a BMD was reduced by about
a fifth after adjusting for investigational centre and body weight (p=0.063).
Discussion
A Kellgren-Lawrence (KL) score of at least 2 in both lumbar and thoracic spine was
practically universal. While this was predictable (1, 2, 4, 25, 26), we have also made novel
observations (27). The most surprising finding is that KL Grade 3+ has a highly variable
geographical prevalence, with a three - fold range of variation in prevalence between centres,
while geographical risk varies similarly in men and women. The severest (KL grade 4)
lumbar disc degeneration was associated with increased bone mineral density in the lumbar
spine. The positive associations of age and weight with increased KL grade were largely in
line with expectations; but the much larger differences in lumbar than thoracic KL scores
between the sexes is unexplained by our data. Finally, several features of disc degeneration
are associated with vertebral body shape. We cannot demonstrate whether this is cause or
effect, but it poses potentially answerable questions concerning the possible role of inter-
vertebral disc anatomy in the development of future degenerative disease of the spine.
To our knowledge, this is the first multi-centre study of DDD prevalence with
standardization of techniques to span an entire continent. So the marked but unexplained
geographic variations in the prevalence of DDD poses intriguing questions. We do not have
histories that might have pointed to occupation as an explanatory risk factor (9). The nesting
of investigational centre within European regions resulted in one regional effect: a
significantly increasing gradient from North to South in KL score. This gradient only partly
explained the inter-country variation. Geographic analysis may help in the future planning of
Armbrecht et al. Page 8
Rheumatology (Oxford). Author manuscript; available in PMC 2017 September 04.
Europe P
MC
Funders A
uthor Manuscripts
Europe P
MC
Funders A
uthor Manuscripts
health services, but these results also demand fresh thought concerning potential causes of
the wide variations in degenerative disc disease between European counties.
Although computed tomography and magnetic resonance imaging are contributing to the
understanding of osteoarthritis of the facet joints (27) and disc degeneration, for
documenting the structural correlates of DDD the old technology of plane radiographs
retains advantages. Benneker et al found that for staging DDD, plane radiography performed
better than MRI (3). The standardisation of techniques, the duplication of images with
reductions in risks of misinterpretation added further advantages.
The choice made to record the highest KL score in a region was driven by the need to
evaluate Scheuermann’ s disease in Europe (12). We also recorded loss of intervertebral disc
height and degenerative vertebral body deformities, all features found in DDD, at the
individual disc level. Goode et al recommend they should all be documented since their
associations with demographic and clinical features differ (2). Fujiwara et al reported that
disc degeneration precedes and is correlated with facet joint osteoarthritis (28). That loss of
disc space was associated with increased aBMD confirms the finding of the Rotterdam and
UK Twins studies (29, 30). Increases in aBMD may be attributable partly to development of
osteophytes and end plate sclerosis, since these could not be excluded from the region of
interest with the early version software available at the time of study.
There was strong statistical evidence that vertebral shape was associated with the K-L grade
of OA. Flat inter-vertebral discs inferred to have similar thicknesses anteriorly, posteriorly
and centrally were associated with increased odds of DDD in contrast to “lozenge-shaped”
inter-vertebral discs. By analogy, since locally more extreme mechanical loading conditions
near the acetabular edge are associated with the development of OA in the hip joint (31),
lozenge-shaped discs might deliver a less extreme range of loading forces in bending.
Alternatively, flattened discs might be a consequence rather than a contributing cause of
degeneration. More lozenge-shaped inter-vertebral discs were also associated with lower
bone mineral density at both spine and hip. It has long been of interest that OA and
osteoporosis appear to be inversely correlated in populations (7).
The high correlation between men and women of geographic prevalences of KL scores
suggests possible common genetic or environmental risk factors, while as expected men
were substantially more likely to suffer lumbar KL grade 4 than women. Loss of one or
more inter-vertebral disc space independently of KL score was associated with higher
baseline aBMD of the lumbar spine though not the hip and was also associated with female
sex; there was an approximately 1 SD higher a BMD for each reduced disc space between
L1 and L4 making this a large effect. Prior loss of disc space was not independently
associated with progressive increase in aBMD in those with two aBMD measurements. In
women studied after menopause, increasing a BMD in one or more vertebrae was associated
with growing irregularities in vertebral outline in the DXA image (32). Other statistical
correlates of L2-4 a BMD change include investigational centre and body weight (26).
Our study has strengths. It was population-based and used standardised approaches in
design, conduct and analysis. The reading of images by a single trained radiologist seemed
Armbrecht et al. Page 9
Rheumatology (Oxford). Author manuscript; available in PMC 2017 September 04.
Europe P
MC
Funders A
uthor Manuscripts
Europe P
MC
Funders A
uthor Manuscripts
mandatory, because not to do so leads to confounding by inter-rater variation (4, 33). To
avoid “drift” in scoring the images over time, a contemporary re-reading of a minority of
images was done by a senior radiologist with consensual resolution of differences. This was
no guarantee against a possibly gradual, consensual shift in gradings over the next decade,
may be reflected in the greater allocation to grades 2 and 4 at the expense of Grade 3 seen in
the reproducibility substudy. It is possible that variation in survey methods between centres
may have led to variation in data quality. The effect of this would be to dilute the strength of
any observed associations towards no association. Variations in image quality, differences in
response rates or small deviations in techniques for obtaining radiographs between centres
would increase the statistical modelling effects attributed to between centre variations. It
seems unlikely that it would have altered our findings concerning gender comparisons.
In the majority of participants, aBMD was assessed at the time of the baseline survey. There
was no evidence that the timing of the aBMD measurements influenced the results (17).
Finally, our data were obtained from a 98%+ caucasian group of participants.
In conclusion, we have undertaken a large-scale population-based survey of the prevalences
of inter-vertebral disc disease in the lumbar and thoracic spine, which with osteoporosis and
Scheuermann’ s disease account for the bulk of radiologically identified spinal pathology in
older subjects. We demonstrated three-fold variations between centres in prevalence of inter-
vertebral disc degeneration (DDD), in distinct contrast to vertebral osteoporosis, which was
less variable between populations (13). DDD was confirmed to be inversely associated with
osteoporosis (7) and positively associated with a BMD. Vertebral body and hence inter-
vertebral disc shape was raised as a possible contributor to its development. With the high
prevalences demonstrated, this study highlights the great vulnerability of the vertebral
column to age-related degenerative change – and also the variable impact on populations of
these changes. These findings need to be related to the clinical and social impact of
degenerative disease of the spine in our aging population. In part this seems to require the
development of new investigational approaches at the population level; but our own
measures (34, 35) of the clinical impact of this and other major diseases of the spine –
osteoporosis and Scheuermann’ s disease - will also help establish the level of personal
impact associated with spinal disorders and their severity.
Acknowledgements
The acquisition of the images for this study was financially supported by a European Union Concerted Action Grant under Biomed-1 (BMH1CT920182), and also EU grants C1PDCT925102, ERBC1PDCT 930105 & 940229. The central co-ordination for the data acquisition phase was also supported by the UK Arthritis Research Campaign, the Medical Research Council (G9321536), the UK National Osteoporosis Society and the European Foundation for Osteoporosis and Bone Disease. The EU’ s PECO program linked to BIOMED 1 funded in part the participation of the Budapest, Warsaw, Prague, Piestany, Szczecin and Moscow centres. The central radiological evaluation for vertebral fracture was sponsored by the Bundesministerium fur Forschung and Technologie, Germany. The radiological evaluations for other radiological aspects of this study was undertaken as part of a PhD studentship (to MG) and otherwise it was undertaken without external financial support. JR, CC and KJ acknowledge the support of the NIHR to the Biomedical Research Unit in Musculoskeletal Disease at the Botnar Research Centre, Oxford. TON and ML acknowledge the support of the NIHR to the Manchester Musculoskeletal Biomedical Research Unit, Manchester. Individual centres acknowledge the receipt of locally acquired support for their data collection. We thank the thousands of individuals who took part in the study and the many other individuals who helped access our population samples.
Armbrecht et al. Page 10
Rheumatology (Oxford). Author manuscript; available in PMC 2017 September 04.
Europe P
MC
Funders A
uthor Manuscripts
Europe P
MC
Funders A
uthor Manuscripts
References
1. Muraki S, Oka H, Akune T, Mabuchi A, En-Yo Y, Yoshida M, et al. Prevalence of radiographic lumbar spondylosis and its association with low back pain in elderly subjects of population-based cohorts: the ROAD study. Ann Rheum Dis. 2009; 68(9):1401–1406. [PubMed: 18718988]
2. Goode AP, Marshall SW, Renner JB, Carey TS, Kraus VB, Irwin DE, et al. Lumbar spine radiographic features and demographic, clinical, and radiographic knee, hip, and hand osteoarthritis. Arthritis Care Res (Hoboken). 2012; 64(10):1536–1544. [PubMed: 22556059]
3. Benneker LM, Heini PF, Anderson SE, Alini M, Ito K. Correlation of radiographic and MRI parameters to morphological and biochemical assessment of intervertebral disc degeneration. European Spine Journal. 2005; 14(1):27–35. [PubMed: 15723249]
4. Kellgren JH, Lawrence JS. Osteo-Arthrosis and Disk Degeneration in an Urban Population. Ann Rheum Dis. 1958; 17:388–397. [PubMed: 13606727]
5. Spector TD, MacGregor AJ. Risk factors for osteoarthritis: genetics. Osteoarthritis Cartilage. 2004; 12(Suppl A):39–44.
6. Rodriguez-Fontenla C, Calaza M, E E, Valdes AM, Arden N, Blanco FJ, et al. Assessment of osteoarthritis candidate genes in a meta-analysis of 9 genome-wide association studies. Arthritis Rheumatol. 2014; 66(4):940–949. [PubMed: 24757145]
7. Dequeker J, Aerssens J, Luyten FP. Osteoarthritis and osteoporosis: clinical and research evidence of inverse relationship. Aging Clin Exp Res. 2003; 15(5):426–439. [PubMed: 14703009]
8. Williams FM, Popham M, Hart DJ, de Schepper E, Bierma-Zeinstra S, Hofman A, et al. GDF5 single-nucleotide polymorphism rs143383 is associated with lumbar disc degeneration in Northern European women. Arthritis Rheum. 2011; 63(3):708–712. [PubMed: 21360499]
9. Croft P, Coggon D, Cruddas M, Cooper C. Osteoarthritis of the hip: an occupational disease in farmers. BMJ. 1992; 304:1269–1272. [PubMed: 1606427]
10. Battié MC, Videman T, Kaprio J, Gibbons LE, Gill K, Manninen H, et al. The Twin Spine Study: contributions to a changing view of disc degeneration. Spine J. 2009; 9(1):47–59. [PubMed: 19111259]
11. Molinos M, Almeida CR, Caldeira J, Cunha C, Gonçalves RM, Barbosa MA. Inflammation in intervertebral disc degeneration and regeneration. J R Soc Interface. 2015:20141191. [PubMed: 25673296]
12. Armbrecht G, Felsenberg D, Ganswindt M, Lunt M, Kaptoge SK, Abendroth K, et al. Vertebral Scheuermann's Disease in Europe: Prevalence, Geographical Variation and Radiological Correlates in Men and Women Aged 50 and Over. Osteoporosis International. 2015 in press.
13. O'Neill TW, Felsenberg D, Varlow J, Cooper C, Kanis JA, Silman AJ, et al. The Prevalence of Vertebral Deformity in European Men and Women: The European Vertebral Osteoporosis Study. Journal of Bone and Mineral Research. 1996; 11(7):1010–1017. [PubMed: 8797123]
14. Felsenberg D, Wieland E, Gowin W, Armbrecht G, Bolze X, Khorassani A, et al. Morphometrische Analyse von Rontgenbildern der Wirbelsaule zur Diagnose einer osteoporotischen Fraktur. Medizinische Klinik. 1998; 93(suppl 2):26–30. [PubMed: 9564154]
15. O'Neill TW, Cooper C, Algra D, Pols HAP, Agnusdei D, Dequeker J, et al. Design and Development of a Questionnaire for use in a Multicentre Study of Vertebral Osteoporosis in Europe: The European Vertebral Osteoporosis Study (EVOS). Rheumatology in Europe. 1995; 24(2):75–81.
16. Felsenberg D, Silman AJ, Lunt M, Armbrecht G, Ismail AA, Finn JD, et al. Incidence of vertebral fractures in Europe: results from the European Prospective Osteoporosis Study (EPOS). Journal of Bone & Mineral Research. 2002; 17(4):716–724. [PubMed: 11918229]
17. O’ Neill TW, Lunt M, Silman AJ, Felsenberg D, Benevolenskaya LI, Bhalla AK, et al. The Relationship between Bone Density and Incident Vertebral Fracture in Men and Women. Journal of Bone & Mineral Research. 2002; 17(12):2214–2221. [PubMed: 12469915]
18. McCloskey EV, Spector TD, Eyres KS, Fern ED, O'Rourke N, Wasikaran S, et al. The assessment of vertebral deformity: a method for use in population studies and clinical trials. Osteoporosis International. 1993; 3(3):138–147. [PubMed: 8481590]
Armbrecht et al. Page 11
Rheumatology (Oxford). Author manuscript; available in PMC 2017 September 04.
Europe P
MC
Funders A
uthor Manuscripts
Europe P
MC
Funders A
uthor Manuscripts
19. Genant, HK., Jergas, M., van Nuijk, C. Chapter 25: "Atlas: the normal and the aging spine". Vertebral Fracture in Osteoporosis. San Francico: Osteoporosis Research Group; 1995.
20. Kalender WA, Felsenberg D, Genant HK, Fischer M, Dequeker J, Reeve J. The European Spine Phantom - a tool for standardization and quality control in spinal bone mineral measurements by DXA and QCT. European Journal of Radiology. 1995; 20:83–92. [PubMed: 7588873]
21. Williams R. Generalized Ordered Logit/Partial Proportional Odds Models for Ordinal Dependent Variables. The Stata Journal. 2006; 6(1):58–82.
22. Lunt M, Felsenberg D, Reeve J, Benevolenskaya L, Cannata J, Dequeker J, et al. Bone Density Variation and its Effects on Risk of Vertebral Deformity in Men and Women studied in 13 European Centres: the EVOS Study. Journal of Bone & Mineral Research. 1997; 12(11):1883–1894. [PubMed: 9383693]
23. Grant RL. Converting an odds ratio to a range of plausible relative risks for better communication of research findings. British Medical Journal. 2014; 348:f7450. [PubMed: 24464277]
24. Lunt M, Felsenberg D, Adams J, Benevolenskaya L, Cannata J, Dequeker J, et al. Population-based geographic variations in DXA bone density in Europe: the EVOS study. Osteoporosis International. 1997; 7(3):175–189. [PubMed: 9205628]
25. Kalichman L, Li L, Kim DH, Guermazi A, Berkin V, O'Donnell CJ, et al. Facet joint osteoarthritis and low back pain in the community-based population. Spine (Phila Pa 1976). 2008; 33(23):2560–2565. [PubMed: 18923337]
26. Lawrence, JS. Chapter 5: Osteoarthrosis. Rheumatism in populations. London: W Heinemann; 1977. p. 98-155.
27. Varlotta GP, Lefkowitz TR, Schweitzer M, Errico TJ, Spivak J, Bendo JA, et al. The lumbar facet joint: a review of current knowledge: part 1: anatomy, biomechanics, and grading. Skeletal Radiol. 2011; 40(1):13–23. [PubMed: 20625896]
28. Fujiwara A, Tamai K, Yamato M, An HS, Yoshida H, Saotome K, et al. The relationship between facet joint osteoarthritis and disc degeneration of the lumbar spine: an MRI study. Eur Spine J. 1999; 8(5):396–401. [PubMed: 10552323]
29. Livshits G, Ermakov S, Popham M, Macgregor AJ, Sambrook PN, Spector TD, et al. Evidence that bone mineral density plays a role in degenerative disc disease: the UK Twin Spine study. Ann Rheum Dis. 2010; 69(12):2012–2016.
30. Castaño-Betancourt MC, Oei L, Rivadeneira F, de Schepper EI, Hofman A, Bierma-Zeinstra S, et al. Association of lumbar disc degeneration with osteoporotic fractures; the Rotterdam study and meta-analysis from systematic review. Bone. 2013; 57(1):284–289. [PubMed: 23958823]
31. Nicholls AS, Kiran A, Pollard TC, Hart DJ, Arden CP, Spector T, et al. The association between hip morphology parameters and nineteen-year risk of end-stage osteoarthritis of the hip: a nested case-control study. Arthritis Rheum. 2011; 63(11):3392–3400. [PubMed: 21739424]
32. Reeve J, Abraham R, Walton J, Russell LJ, Wardley-Smith B, Mitchell A. Increasing "bone" mineral density after menopause in individual lumbar vertebrae as a marker for degenerative disease: a pilot study for the effects of body composition and diet. Journal of Rheumatology. 2004; 31(10):1986–1992. [PubMed: 15468364]
33. Kellgren JH, Lawrence JS. Radiological Assessment of Osteo-Arthrosis. Ann Rheum Dis. 1957; 16(4):494–502. [PubMed: 13498604]
34. Matthis C, Weber U, O'Neill TW, Raspe H, the European Vertebral Osteoporosis Study Group. Health impact associated with vertebral deformities: Results from the European Vertebral Osteoporosis Study (EVOS). Osteoporosis International. 1998; 8(4):364–372. [PubMed: 10024907]
35. Cockerill W, Ismail AA, Cooper C, Matthis C, Raspe H, Silman AJ, et al. Does location of deformity within the spine influence back pain and disability? Annals of the Rheumatic Diseases. 2000; 59:368–371. [PubMed: 10784519]
Armbrecht et al. Page 12
Rheumatology (Oxford). Author manuscript; available in PMC 2017 September 04.
Europe P
MC
Funders A
uthor Manuscripts
Europe P
MC
Funders A
uthor Manuscripts
Fig 1. Diagram to show how the Index of End-Plate Concavity (IEPC) is calculated for a single
vertebra. Individual vertebral height measurements were made as described in O’ Neill et al
and as shown diagrammatically by the arrows (14). Thoracic and Lumbar IEPC values were,
for the purposes of this paper, calculated by averaging the individual IEPC values for the 9
thoracic and 4 lumbar vertebrae respectively.
Armbrecht et al. Page 13
Rheumatology (Oxford). Author manuscript; available in PMC 2017 September 04.
Europe P
MC
Funders A
uthor Manuscripts
Europe P
MC
Funders A
uthor Manuscripts
Fig 2. Combinations of radiological diagnoses and distributions of K-L scores across 4 grades in
the Lumbar and Thoracic spine. Combinations of KL scores add up to 100% (ordinate
scale). Note that no subject scored zero on the K-L score. Represented are: subjects with a
vertebral fracture; subjects with Scheuermann’ s disease; subjects with Forestier’ s disease;
and subjects with none of these diagnoses and all combinations.
Armbrecht et al. Page 14
Rheumatology (Oxford). Author manuscript; available in PMC 2017 September 04.
Europe P
MC
Funders A
uthor Manuscripts
Europe P
MC
Funders A
uthor Manuscripts
Fig 3. Prevalences in the Lumbar and Thoracic spine of DDD KL grades 3+4 associated with (left)
age, (centre) nationality and European Region and (right) Investigational Centre, all adjusted
to age 65 and shown with 95% confidence intervals. Men and women are shown separately.
Key to country codes, right hand graph: BE Belgium; DE Germany; ES Spain; FR France;
GR Greece; HU Hungary; IT Italy; NL Netherlands; PL Poland; PO Portugal; RU Russia;
SE Sweden; SK Slovakia; UK United Kingdom.
Armbrecht et al. Page 15
Rheumatology (Oxford). Author manuscript; available in PMC 2017 September 04.
Europe P
MC
Funders A
uthor Manuscripts
Europe P
MC
Funders A
uthor Manuscripts
Fig 4. left: distribution of numbers (y axis) of degenerative vertebral deformities per vertebral
column (13 vertebrae evaluated) in this population. It can be seen that 85% of subjects were
unaffected by degenerative vertebral deformities. right: distribution of numbers of inter-
vertebral discs of reduced height per vertebral column. The percentages show the
proportions of the population in each category.
Armbrecht et al. Page 16
Rheumatology (Oxford). Author manuscript; available in PMC 2017 September 04.
Europe P
MC
Funders A
uthor Manuscripts
Europe P
MC
Funders A
uthor Manuscripts
Europe P
MC
Funders A
uthor Manuscripts
Europe P
MC
Funders A
uthor Manuscripts
Armbrecht et al. Page 17
Table 1Numbers of Subjects Affected by Radiological Diagnoses Studied
Disease & Radiological Category Numbers of participants affected
Clinical Definition or Literature Reference. NB the grade assigned was the highest grade observed in the region
DDD: Kellgren-Lawrence (KL) Grade 0 0/0* no degenerative changes
DDD: KL Grade 1 (minimal) 379/60* minimal anterior osteophyte formation, no reduction of inter-vertebral disc height and no vertebral end plate sclerosis
DDD: KL Grade 2 (mild) 5281/3450* definite anterior osteophyte formation; subtle or no reduction in inter-vertebral disc height (<25%); just recognisable sclerosis of the endplates
DDD: KL Grade 3 (moderate) 4087/4904* definite anterior osteophyte formation; moderate narrowing of the disc space (25-75%);definite sclerosis of the endplates and osteophyte sclerosis.
DDD: KL Grade 4 (severe) 385/1718* large and multiple large osteophyte ; severe narrowing of the disc space (>75%); sclerosis of the endplates with irregularities.
Incident osteoporotic fracture 243** See (15) NB qualitative definition as reported there, but prior to exclusions based on specific quality criteria reported in that paper.
Degenerative Deformity 169 Clinical reading
Traumatic Deformity 13 Clinical reading
Scheuermann’ s Disease 962 For diagnostic criteria used see (13)
Forestier’ s disease 180 Clinical reading
Other Diagnoses 77*** Clinical reading
*Male and female combined: For KL Grading, Lumbar followed by Thoracic.
**these subjects were censored from the present study due to an event having a major effect on risk of osteoarthritic change
***Other diagnoses included osteomalacia, Cupid’ s Bow deformity, Epiphysiolysis and Genetic Malformation
Rheumatology (Oxford). Author manuscript; available in PMC 2017 September 04.
Europe P
MC
Funders A
uthor Manuscripts
Europe P
MC
Funders A
uthor Manuscripts
Armbrecht et al. Page 18
Table 2
Correlates of DDD severity
Site, KL grading, and variable OR (95% CI) Prev* RR (95% CI)
Scheuermann’ s disease (yes vs no) 0.72 (0.58, 0.91) 0.16 0.76 (0.62, 0.92)
*Prev denotes the representative baseline risk used in transforming odds ratio estimates to relative risk estimates, defined as the expected risk for a
65 year old with average levels of continuous variables or in reference category (i.e. female sex or absence of categorical risk factor).
Rheumatology (Oxford). Author manuscript; available in PMC 2017 September 04.