52
Dehydrogenation by Heterogeneous Catalysts Daniel E. Resasco School of Chemical Engineering and Materials Science University of Oklahoma Encyclopedia of Catalysis January, 2000
Dehydrogenation by Heterogeneous Catalysts
Daniel E. Resasco
School of Chemical Engineering and Materials Science
University of Oklahoma
Encyclopedia of Catalysis
January, 2000
1
1. INTRODUCTION
Catalytic dehydrogenation of alkanes is an endothermic reaction, which occurs
with an increase in the number of moles and can be represented by the expression
Alkane ! Olefin + Hydrogen
This reaction cannot be carried out thermally because it is highly unfavorable
compared to the cracking of the hydrocarbon, since the C-C bond strength (about 246
kJ/mol) is much lower than that of the C-H bond (about 363 kJ/mol). However, in the
presence of a suitable catalyst, dehydrogenation can be carried out with minimal C-C
bond rupture. The strong C-H bond is a closed-shell σ orbital that can be activated by
oxide or metal catalysts. Oxides can activate the C-H bond via hydrogen abstraction
because they can form O-H bonds, which can have strengths comparable to that of the C-
H bond. By contrast, metals cannot accomplish the hydrogen abstraction because the M-
H bonds are much weaker than the C-H bond. However, the sum of the M-H and M-C
bond strengths can exceed the C-H bond strength, making the process thermodynamically
possible. In this case, the reaction is thought to proceed via a three centered transition
state, which can be described as a metal atom inserting into the C-H bond. The C-H bond
bridges across the metal atom until it breaks, followed by the formation of the
corresponding M-H and M-C bonds.1 Therefore, dehydrogenation of alkanes can be
carried out on oxides as well as on metal catalysts. In fact, both types of dehydrogenation
catalysts are typically found in a number of important industrial applications.
Catalytic dehydrogenation is employed in the production of propylene and
isobutylene from propane and isobutane, in the production of C6 to C19 mono-olefins from
the corresponding normal alkanes, and of styrene from ethylbenzene. In this
2
contribution, the chemistry involved in these reactions will be discussed, with particular
emphasis on the effects of catalyst structure and composition on the catalytic properties.
2. THERMODYNAMIC EQUILIBRIUM LIMITATIONS
The dehydrogenation reactions are thermodynamically favored at high
temperatures and low pressures. The equilibrium conversion can be readily calculated by
the expression:
Kp = x ( h + x ) P (1)
(1 – x ) (1+ i + h + x )
where Kp is the equilibrium constant, x the equilibrium conversion, i and h the
number of moles of inerts and hydrogen, per mole of alkane in the feed, respectively.
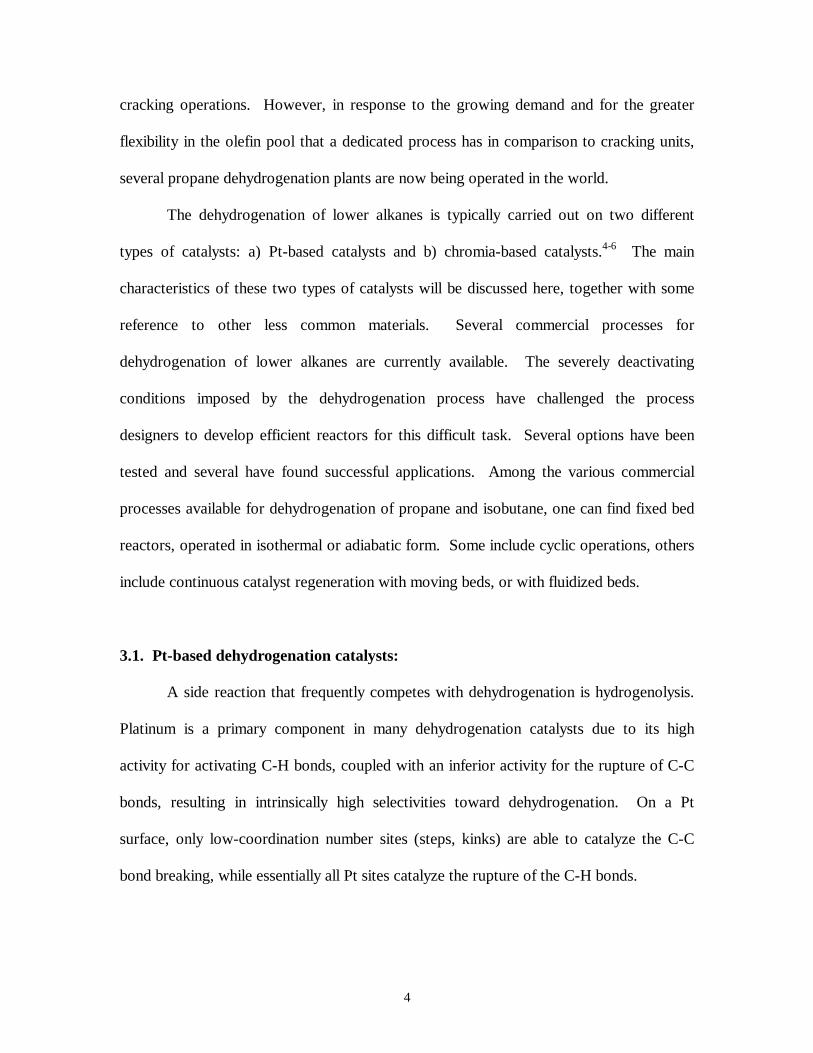
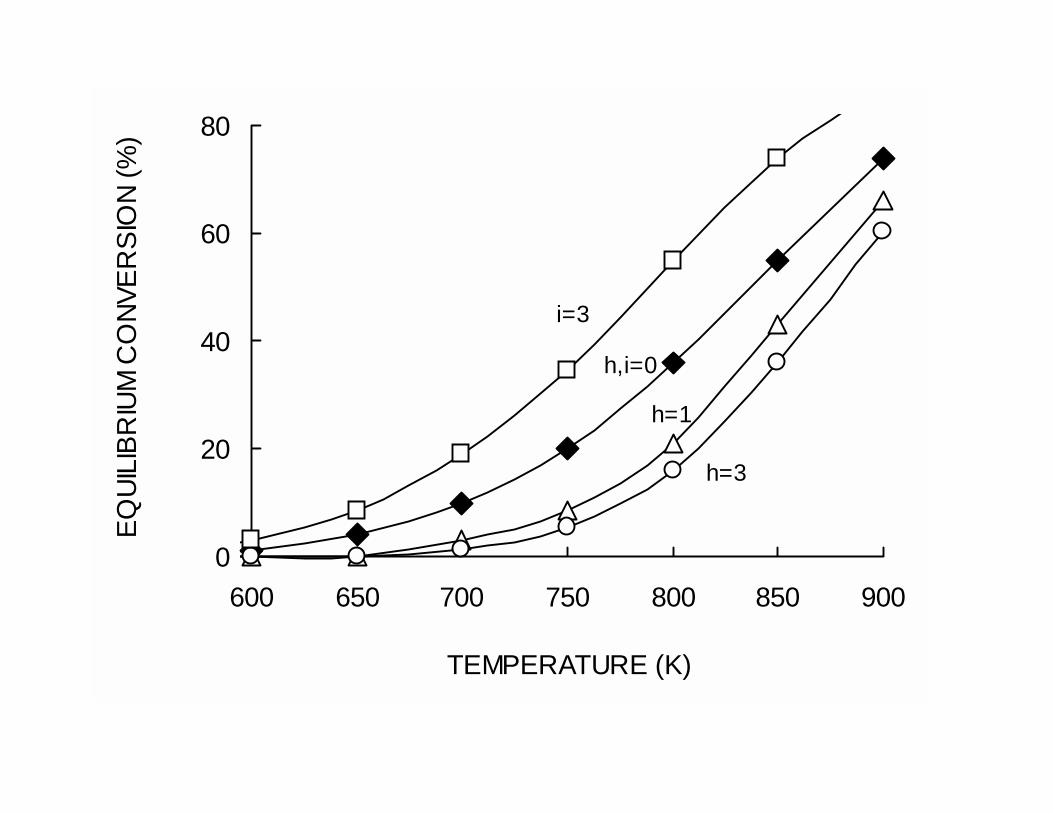
The equilibrium conversion for the dehydrogenation of propane as a function of
temperature is illustrated in Fig. 1 for typical hydrogen/alkane (h) and inert/alkane (i)
feed ratios. In some industrial operations, part of the hydrogen produced is recycled to
inhibit the formation of coke on the catalyst. However, at a given temperature, the
equilibrium conversion decreases with the hydrogen/alkane feed ratio. For example,
under typical dehydrogenation conditions (550ºC, 1 atm) the equilibrium conversion
decreases from about 44 % to 25 % when the H2/alkane ratio increases from 0 to 3.
Therefore, the hydrogen/alkane feed ratio is a compromise between coke suppression and
conversion. Contrarily, when inerts, such as steam or nitrogen, are added to the feed the
equilibrium is benefited. For example, if the inert/alkane ratio is increased from 0 to 3 at
550ºC and 1 atm, the equilibrium conversion increases from 44 % to 64 %.
3
3. CATALYTIC DEHYDROGENATION OF ISOBUTANE AND
PROPANE
The catalytic dehydrogenation of isobutane and propane are important reactions
used commercially for the production of isobutylene and propylene, respectively. One of
the major applications of isobutylene is as a feedstock in the manufacture of methyl
tertiary butyl ether (MTBE). In the United States, MTBE has been used in relatively low
concentrations as an octane booster in gasoline for more than 25 years. However, since
1992, it has been used in high concentrations in a large number of cities, to meet
requirements of the Clean Air Act in the oxygenated and reformulated gasolines. In
those cases, up to about 15 % MTBE is added to gasoline to allow more complete
combustion and reduce emissions of carbon monoxide (CO) and volatile organic
compounds (VOC). In recent years, objections to potential health effects of MTBE
caused by water contamination have arisen, which may have an impact on the MTBE
demand.2 However, demand for polyisobutylene, and polybutenes in general, is in
continuous growth. Thus, the needs for C4 olefin production will probably remain high.
C4 olefins are mainly produced from FCC (about 50 %) and steam cracking (21 %).
However, in some industrial operations, it is necessary to have increased flexibility in the
olefin supply and so, production of a single specific alkene is sometimes required. In
those cases, the direct catalytic dehydrogenation is the ideal solution. Propylene is an
important basic chemical building block for plastics and resins. Its worldwide demand
has steadily grown for the last 15 years and it is projected that, in the coming years,
demand growth for propylene will be equal to or even higher than that for ethylene.3
Similar to isobutylene, propylene can be produced as a by-product from FCC and steam
4
cracking operations. However, in response to the growing demand and for the greater
flexibility in the olefin pool that a dedicated process has in comparison to cracking units,
several propane dehydrogenation plants are now being operated in the world.
The dehydrogenation of lower alkanes is typically carried out on two different
types of catalysts: a) Pt-based catalysts and b) chromia-based catalysts.4-6 The main
characteristics of these two types of catalysts will be discussed here, together with some
reference to other less common materials. Several commercial processes for
dehydrogenation of lower alkanes are currently available. The severely deactivating
conditions imposed by the dehydrogenation process have challenged the process
designers to develop efficient reactors for this difficult task. Several options have been
tested and several have found successful applications. Among the various commercial
processes available for dehydrogenation of propane and isobutane, one can find fixed bed
reactors, operated in isothermal or adiabatic form. Some include cyclic operations, others
include continuous catalyst regeneration with moving beds, or with fluidized beds.
3.1. Pt-based dehydrogenation catalysts:
A side reaction that frequently competes with dehydrogenation is hydrogenolysis.
Platinum is a primary component in many dehydrogenation catalysts due to its high
activity for activating C-H bonds, coupled with an inferior activity for the rupture of C-C
bonds, resulting in intrinsically high selectivities toward dehydrogenation. On a Pt
surface, only low-coordination number sites (steps, kinks) are able to catalyze the C-C
bond breaking, while essentially all Pt sites catalyze the rupture of the C-H bonds.
5
Another undesired side reaction that competes with dehydrogenation is coke
formation. Since both, hydrogenolysis and coke formation, are more sensitive to the
support structure than dehydrogenation, any impurity or inactive species on the surface
may act as a site diluent and should increase the selectivity toward dehydrogenation.
This effect is well documented and has been observed in a number of bimetallic
systems.7, 8 In addition to the dilution of sites, other more subtle factors may play a role
in altering the activity of the Pt surface. For example, significant differences in the
magnitude of these effects have been detected in a series of Pt catalysts promoted by the
addition of different metals, which are themselves inactive, such as Sn, In, Pb, and Cu,
but can alter the properties of Pt.9 It was found that the promoting effect among these
metals was highest from the addition of Sn and lowest from Cu. In fact, Sn has been the
preferred promoter for most Pt dehydrogenation catalysts.10, 11 In section 3.1.2, we
discuss the effects of Sn in greater detail.
3.1.1. Reaction Mechanism and Kinetics on Pt Catalysts
The isobutane dehydrogenation on Pt-based catalysts has generally been
described by the following set of reaction steps:
(A) C4H10 + 2 * ⇔ C4H9* + H *
(B) C4H9* + 2 * ⇔ C4H8** + H *
(C) C4H8** ⇔ C4H8 + 2 *
(D) H2 + 2 * ⇔ 2 H*
Cortright et al.12 have conducted deuterium tracing studies under reaction
conditions, which showed a much larger extent of deuterium in the isobutylene product
6
than in the isobutane. Also, it was seen that the small fraction of isobutane that contained
deuterium was fully deuterated, indicating that the dissociative adsorption of isobutane is
slow compared to the exchange of hydrogen/deuterium in the adsorbed isobutyl species.
These results support the hypothesis that step (A) is the slowest step and are in line with
earlier observations that show that as the hydrogen pressure increases, the
dehydrogenation rate decreases as a result of the competition of hydrogen and the alkane
for adsorption sites.13 Accordingly, the following rate expression should represent the
kinetics
rD = kA θ*2 [ PiC4H10 - ( P iC4H8 PH2 ) / Keq ] (2)
where rD is the net dehydrogenation rate, kA is the rate constant for the
dissociative adsorption of isobutane (step A), Keq is the overall equilibrium constant for
isobutane dehydrogenation, and θ*
is the fraction of sites free of adsorbed species. The
isobutane coverage under reaction conditions is practically negligible12 and the fraction
of free sites can be determined from a expression derived from the assumption that the
only species on the surface are hydrogen and isobutylene, which are in equilibrium with
the gas phase. Accordingly the expression for the fraction of free sites can be expressed
as:
θ* =
+++−+
−C
HiCHDHDHD
HiC
C
KPPKPKPK
PK 84
222
84
82114
(3)
where KC and KD are the equilibrium constants for isobutylene desorption (step C)
and hydrogen adsorption (step D) , respectively. Combining equations (2) and (3)
excellent fits have been obtained on a number of reaction data over a wide range of
7
temperatures, concentrations, and catalysts.14 All the fitting parameters thus obtained had
physical meaning and were used to compare thermodynamic functions on different
catalysts. This kinetic expression clearly explains the reaction orders obtained on most
previous studies, i.e., first order dependence with respect to the alkane and negative half
to zeroth order dependence in hydrogen.9, 13
3.1.2. Addition of Sn to Pt as a promoter for activity, selectivity, and catalyst life
The addition of Sn has important beneficial effects on the catalytic properties of
Pt for the dehydrogenation of lower alkanes. First of all, and as mentioned above, it
increases the selectivity towards dehydrogenation by inhibiting hydrogenolysis.
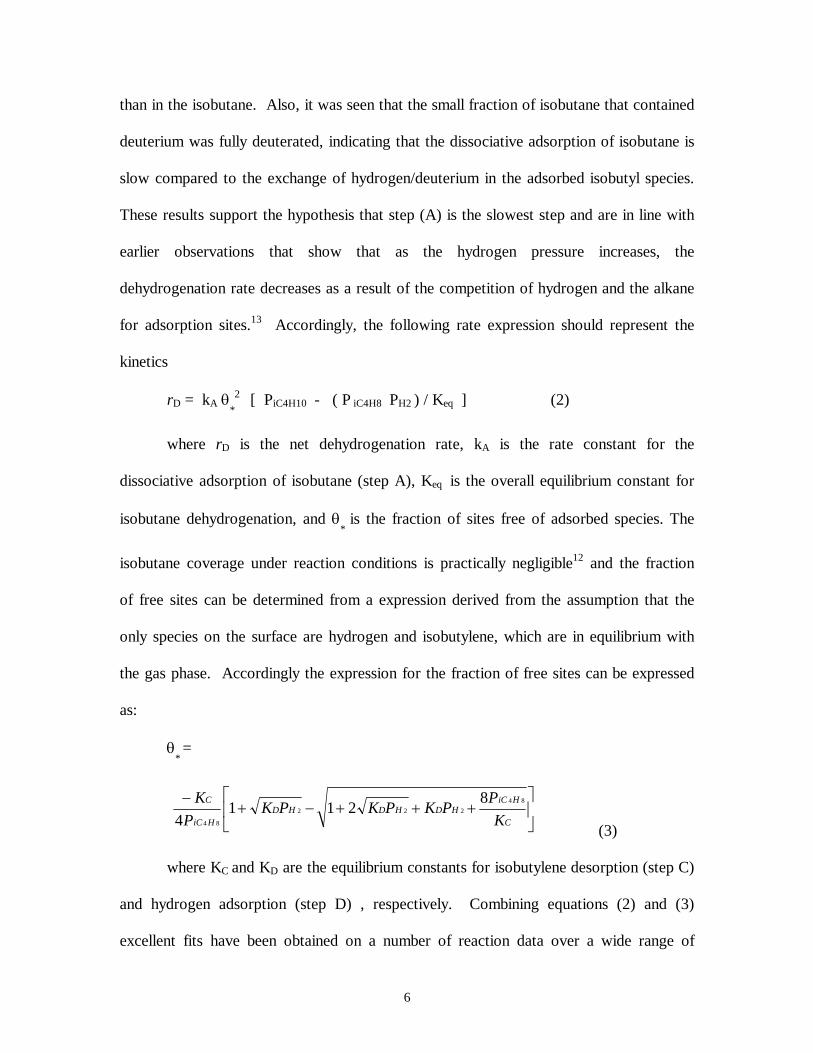
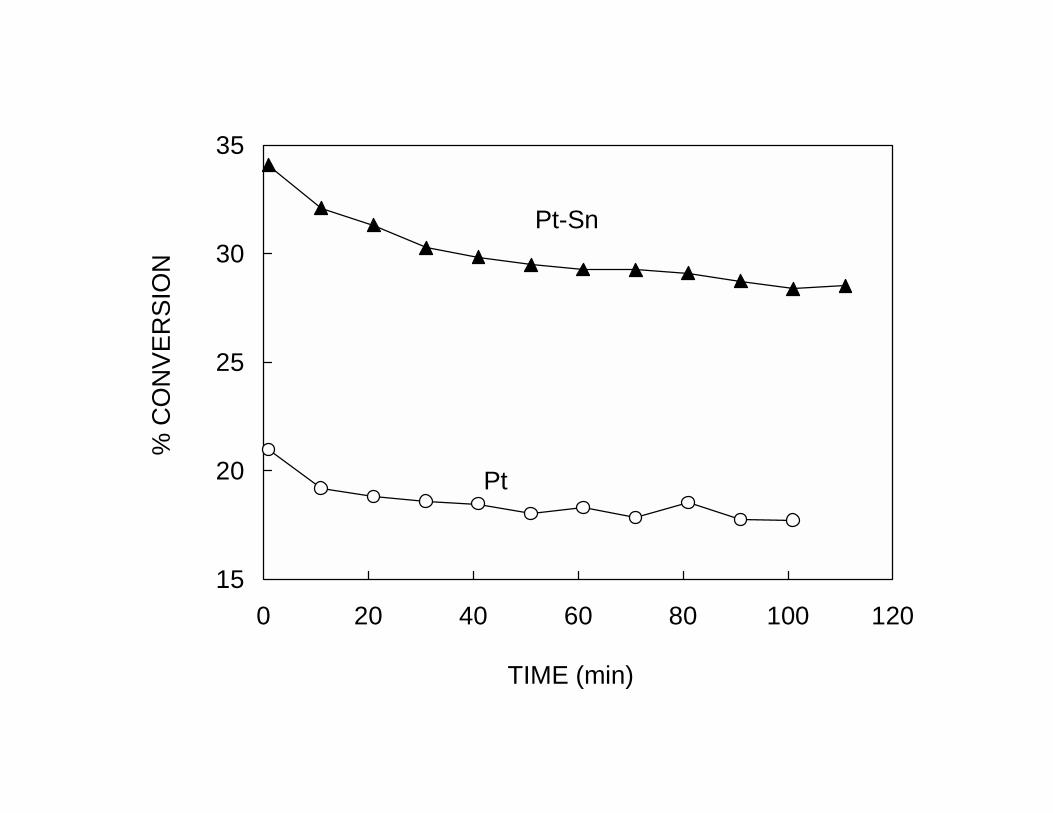
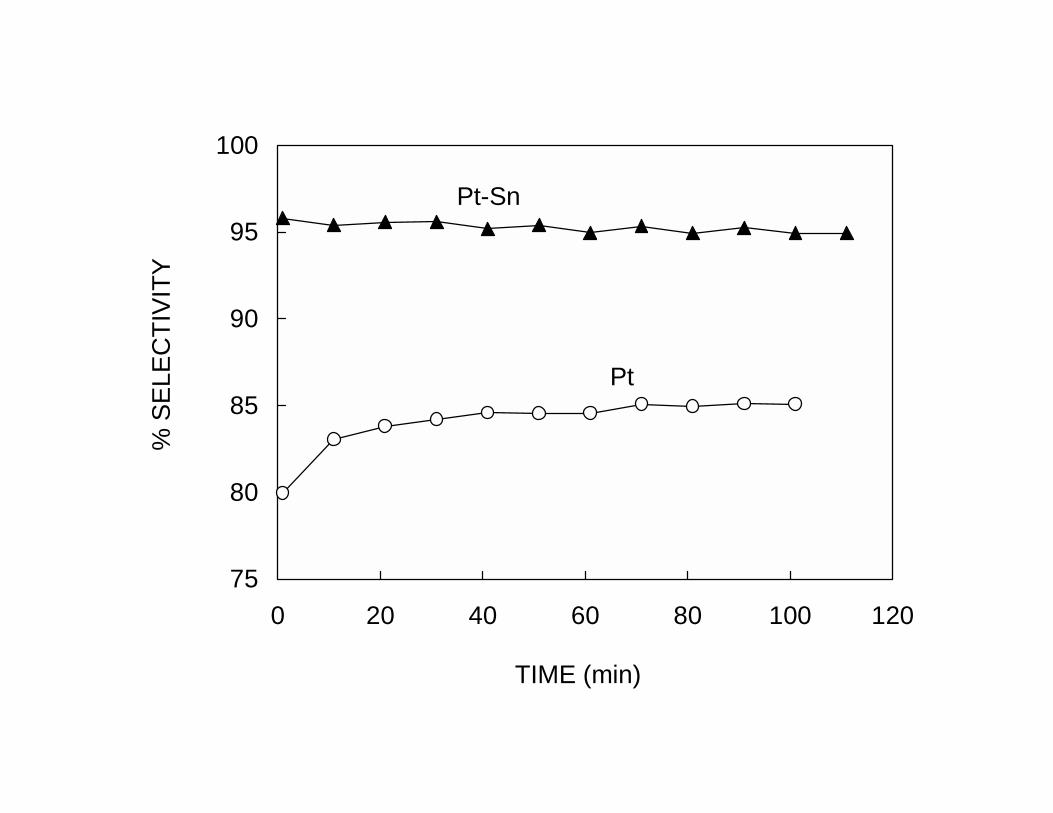
Similarly, the addition of Sn has a profound effect on the catalyst life. The Pt-Sn catalyst
retains a much higher activity than the pure Pt catalyst. The enhancement in selectivity
and stability, clearly illustrated in Fig. 2a and 2b, can be explained in geometric terms by
the dilution of Pt ensembles by Sn. As described above, this dilution greatly reduces the
activity towards reactions that require a large ensemble of Pt atoms to constitute the
active sites, such as hydrogenolysis and coking. Also, the increase in selectivity of the
pure Pt sample with time on stream shown in Fig. 2b can be explained by the same
geometric arguments. The carbon deposited during the reaction plays the role of an
inactive species that inhibits undesired reactions, including coking. This explanation
accounts for two observations on the pure Pt catalyst. Both, the selectivity and the
stability of the catalyst improve as a function of time on stream as the number of large
ensembles is reduced by the presence of carbon. On the pure Pt catalyst the initial
deactivation is very fast. Thus, it is difficult to measure the true initial activity of
unpromoted Pt and determine whether the initial dehydrogenation rate on Pt is higher or
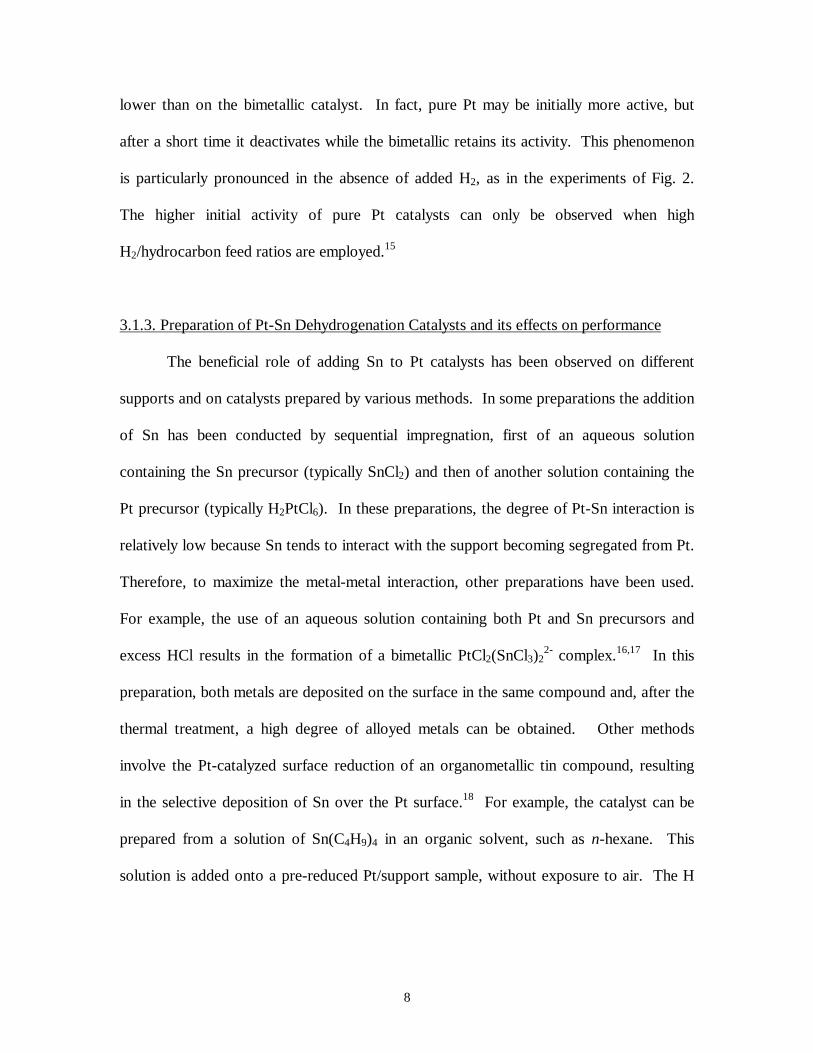
8
lower than on the bimetallic catalyst. In fact, pure Pt may be initially more active, but
after a short time it deactivates while the bimetallic retains its activity. This phenomenon
is particularly pronounced in the absence of added H2, as in the experiments of Fig. 2.
The higher initial activity of pure Pt catalysts can only be observed when high
H2/hydrocarbon feed ratios are employed.15
3.1.3. Preparation of Pt-Sn Dehydrogenation Catalysts and its effects on performance
The beneficial role of adding Sn to Pt catalysts has been observed on different
supports and on catalysts prepared by various methods. In some preparations the addition
of Sn has been conducted by sequential impregnation, first of an aqueous solution
containing the Sn precursor (typically SnCl2) and then of another solution containing the
Pt precursor (typically H2PtCl6). In these preparations, the degree of Pt-Sn interaction is
relatively low because Sn tends to interact with the support becoming segregated from Pt.
Therefore, to maximize the metal-metal interaction, other preparations have been used.
For example, the use of an aqueous solution containing both Pt and Sn precursors and
excess HCl results in the formation of a bimetallic PtCl2(SnCl3)22- complex.16,17 In this
preparation, both metals are deposited on the surface in the same compound and, after the
thermal treatment, a high degree of alloyed metals can be obtained. Other methods
involve the Pt-catalyzed surface reduction of an organometallic tin compound, resulting
in the selective deposition of Sn over the Pt surface.18 For example, the catalyst can be
prepared from a solution of Sn(C4H9)4 in an organic solvent, such as n-hexane. This
solution is added onto a pre-reduced Pt/support sample, without exposure to air. The H
9
that remains adsorbed on Pt is responsible for the reduction of the Sn(C4H9)4 , causing the
selective deposition over the metal.19
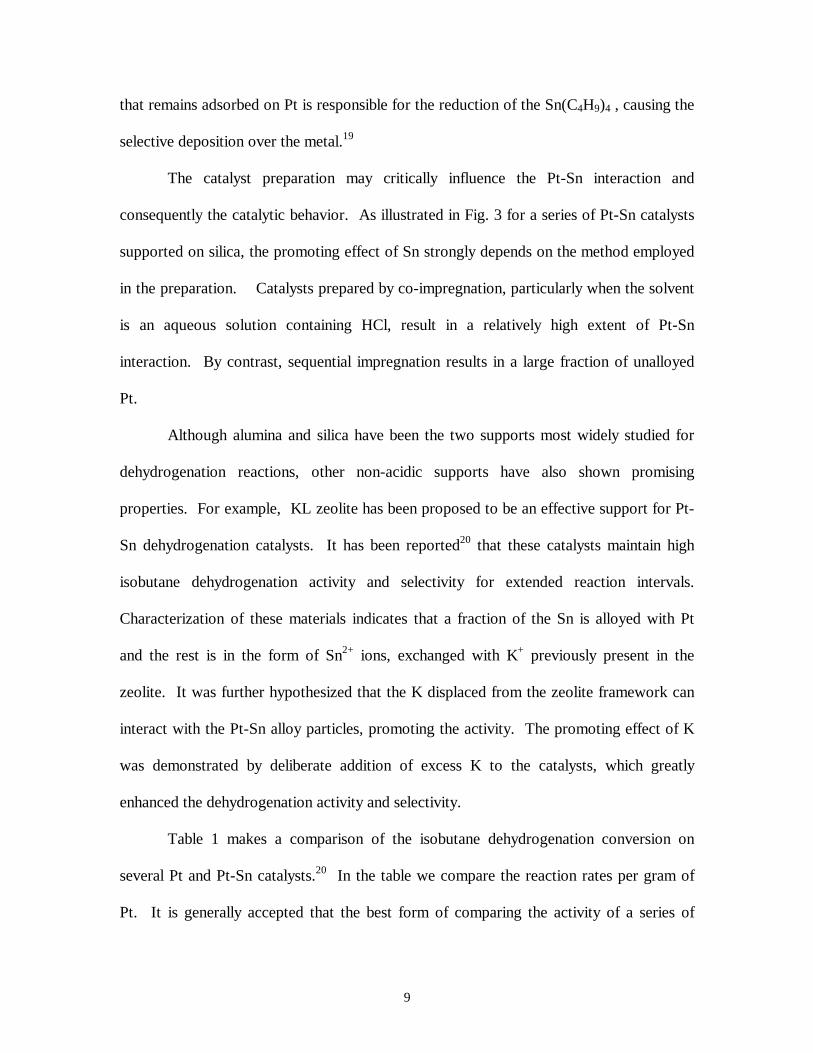
The catalyst preparation may critically influence the Pt-Sn interaction and
consequently the catalytic behavior. As illustrated in Fig. 3 for a series of Pt-Sn catalysts
supported on silica, the promoting effect of Sn strongly depends on the method employed
in the preparation. Catalysts prepared by co-impregnation, particularly when the solvent
is an aqueous solution containing HCl, result in a relatively high extent of Pt-Sn
interaction. By contrast, sequential impregnation results in a large fraction of unalloyed
Pt.
Although alumina and silica have been the two supports most widely studied for
dehydrogenation reactions, other non-acidic supports have also shown promising
properties. For example, KL zeolite has been proposed to be an effective support for Pt-
Sn dehydrogenation catalysts. It has been reported20 that these catalysts maintain high
isobutane dehydrogenation activity and selectivity for extended reaction intervals.
Characterization of these materials indicates that a fraction of the Sn is alloyed with Pt
and the rest is in the form of Sn2+ ions, exchanged with K+ previously present in the
zeolite. It was further hypothesized that the K displaced from the zeolite framework can
interact with the Pt-Sn alloy particles, promoting the activity. The promoting effect of K
was demonstrated by deliberate addition of excess K to the catalysts, which greatly
enhanced the dehydrogenation activity and selectivity.
Table 1 makes a comparison of the isobutane dehydrogenation conversion on
several Pt and Pt-Sn catalysts.20 In the table we compare the reaction rates per gram of
Pt. It is generally accepted that the best form of comparing the activity of a series of
10
catalysts is in terms of turnover frequency (TOF), based on the number of sites as
measured by hydrogen chemisorption. However, when Pt-Sn alloys and unalloyed Pt
phases co-exist, the TOF may be misleading. The chemisorptive capacity of Pt is greatly
changed when it is alloyed with Sn. For example, it has been shown that the heat of CO
adsorption drops from Pt to PtSn alloy by as much as 20 kJ/mol.21 This energy difference
causes significant changes in the adsorption equilibrium constants at 298 K and,
consequently, in the observed adsorption capacity. In recent work,22 it was observed that
the CO adsorption capacity of Pt-Sn/SiO2 dropped to zero after 1 hour at 500ºC on
isobutane stream. However, the catalyst was almost as active for dehydrogenation as at
the beginning of the reaction. The reason for this apparent discrepancy is that the
unalloyed Pt is rapidly covered by coke, while the Pt-Sn alloys remain more or less free
of coke. Since alloyed Pt does not adsorb significant amounts of CO the CO/Pt measured
on the fresh catalyst was mainly due to the fraction of unalloyed Pt, which after a while
contributes little to the activity. The situation is very similar for the chemisorption of
hydrogen. Verbeek and Sachtler23 have shown that Pt-Sn alloys adsorb very little
hydrogen and have ascribed this decrease to a lowering of the heat of adsorption.
Microcalorimetry studies24 have shown that, even though the addition of Sn resulted in a
large decrease in the saturation adsorption coverages for H or CO, the heats of adsorption
at zero coverage on Pt:Sn samples were similar to those on pure Pt. However, it must be
noted that these SiO2-supported samples were prepared by sequential impregnation and,
as shown below, this technique leads to a large fraction of unalloyed Pt, which may be
responsible for the measured high heats of adsorption. For changes in the initial heats of
adsorption to be seen, the majority of Pt needs to be alloyed with Sn. In fact, when
11
higher Sn concentrations were used in those studies,24 the heats of adsorption at zero
coverage decreased significantly, in agreement with the idea mentioned above. Only at
very high H2/hydrocarbon ratios, at which the deactivation is less pronounced, the TOF
values for Pt and Pt-Sn catalysts are normally found to be similar. It is generally
observed that the initial deactivation increases with the amount of unalloyed Pt, then the
unalloyed Pt in the sample is not related to the catalytic activity. However, CO and H2
chemisorption primarily occurs on the unalloyed Pt. Therefore, for bimetallic Pt-Sn
catalysts, we prefer to report rates per total Pt.
A different methodology to estimate TOF has been proposed by Rajeshwer et al.25
These authors propose that hydrogen/oxygen titration on Pt-Sn alloys is an activated
process and, as a result, the hydrogen titration of preadsorbed oxygen conducted at room
temperature only reflects the exposed fraction of unalloyed Pt, but that conducted at
150ºC titrates both alloyed and unalloyed Pt. As a result, the difference between the two
uptakes reflects the exposed fraction of alloyed Pt. This is an interesting method,
although the possibility of hydrogen spillover onto the support,26 may lead to
overestimation of the density of alloyed Pt. To rule out this possibility, Rajeshwer et al.
conducted measurements on physical mixtures of monometallic Pt and Sn catalysts,
which showed the same uptake as the monometallic Pt catalyst. However, values of H/Pt
uptake ratios much greater than one have sometimes been observed, which is hard to
explain without invoking spillover onto the support or, as suggested by some authors,
hydrogen uptake by dissolution in the bulk of the Pt-Sn alloys. 23
12
3.1.4. Structure and Composition of Pt-Sn Catalysts
The assessment of Pt dispersion on monometallic catalysts and quantification of
its exposed sites is well established and can be readily accomplished by standard
techniques such as hydrogen chemisorption, electron microscopy, or EXAFS. As
described in the previous section, the same task is much less straightforward with
bimetallic Pt-Sn catalysts. Pt and Sn are able to form a number of ordered Pt-Sn alloys,
such as PtSn, PtSn2, PtSn4, Pt2Sn3, and Pt3Sn.27
However, the formation of alloys like these on high-surface-area supports
strongly depends on the nature of the support, thermal treatments, impregnation method,
anions present, etc. In addition, the chemisorptive properties of these alloys are less
understood than those of pure Pt. Another fundamental question related to these systems
is the oxidation state of Sn under reaction conditions. Upon reduction, tin may remain in
the SnII or SnIV forms or may get reduced to the metallic Sn0 state and form PtxSny alloys.
Pt-Sn alloys are more easily formed when the support interacts only weakly with
the Pt and Sn, such as in the case of silica-supported catalysts. One of the techniques
commonly employed to determine the oxidation state of supported metals and identify
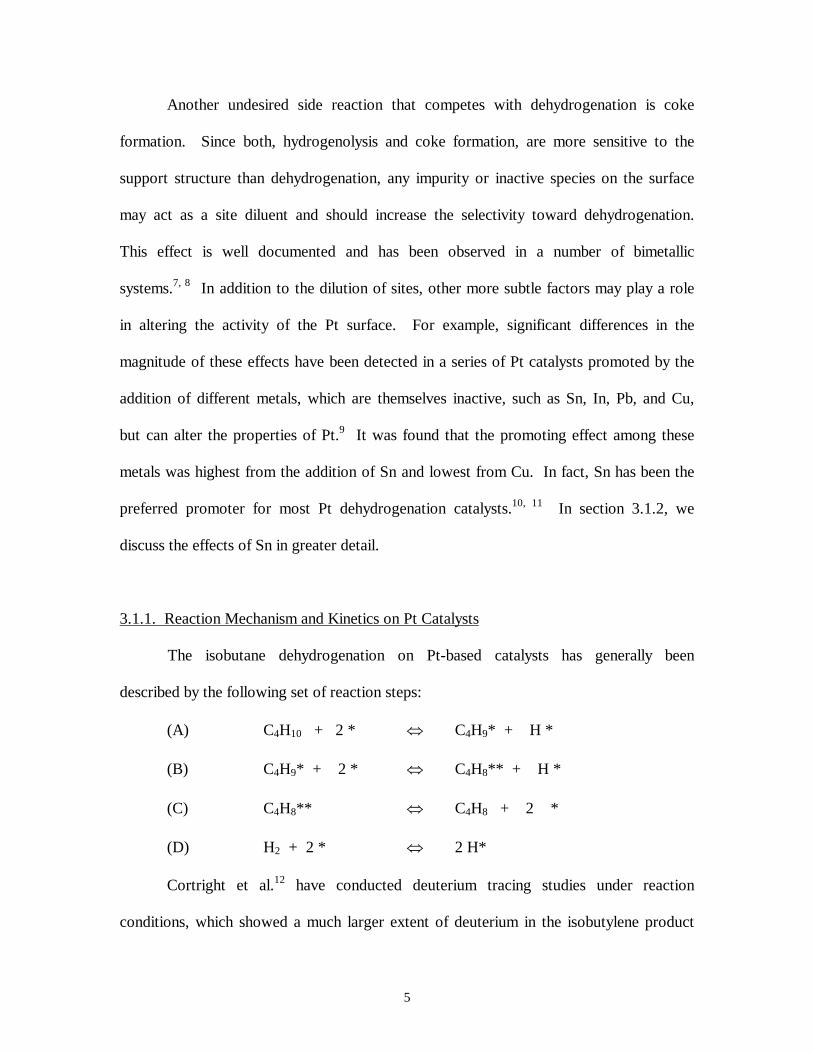
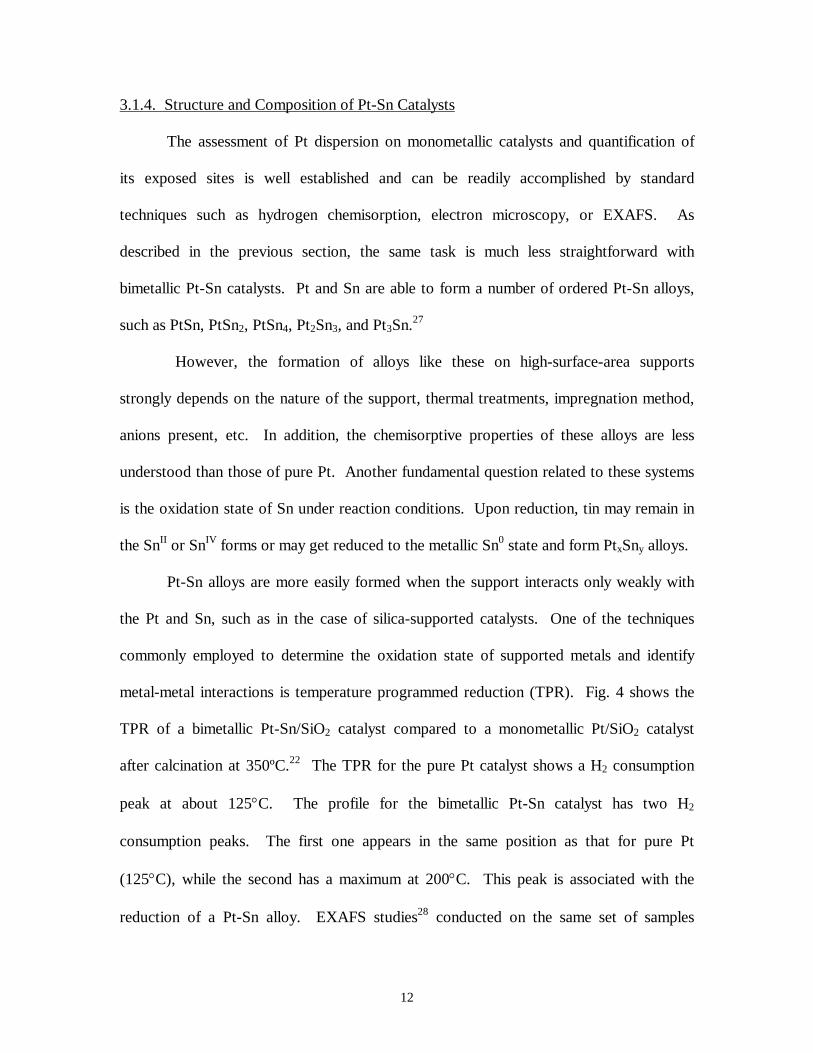
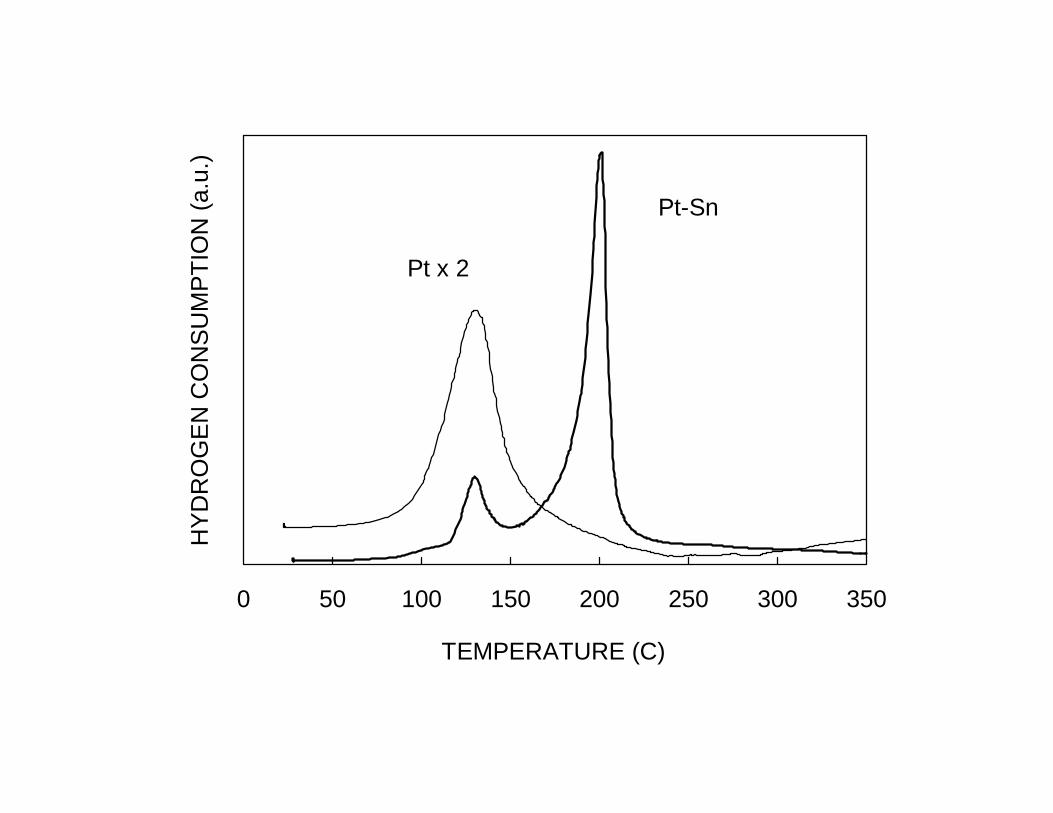
metal-metal interactions is temperature programmed reduction (TPR). Fig. 4 shows the
TPR of a bimetallic Pt-Sn/SiO2 catalyst compared to a monometallic Pt/SiO2 catalyst
after calcination at 350ºC.22 The TPR for the pure Pt catalyst shows a H2 consumption
peak at about 125°C. The profile for the bimetallic Pt-Sn catalyst has two H2
consumption peaks. The first one appears in the same position as that for pure Pt
(125°C), while the second has a maximum at 200°C. This peak is associated with the
reduction of a Pt-Sn alloy. EXAFS studies28 conducted on the same set of samples
13
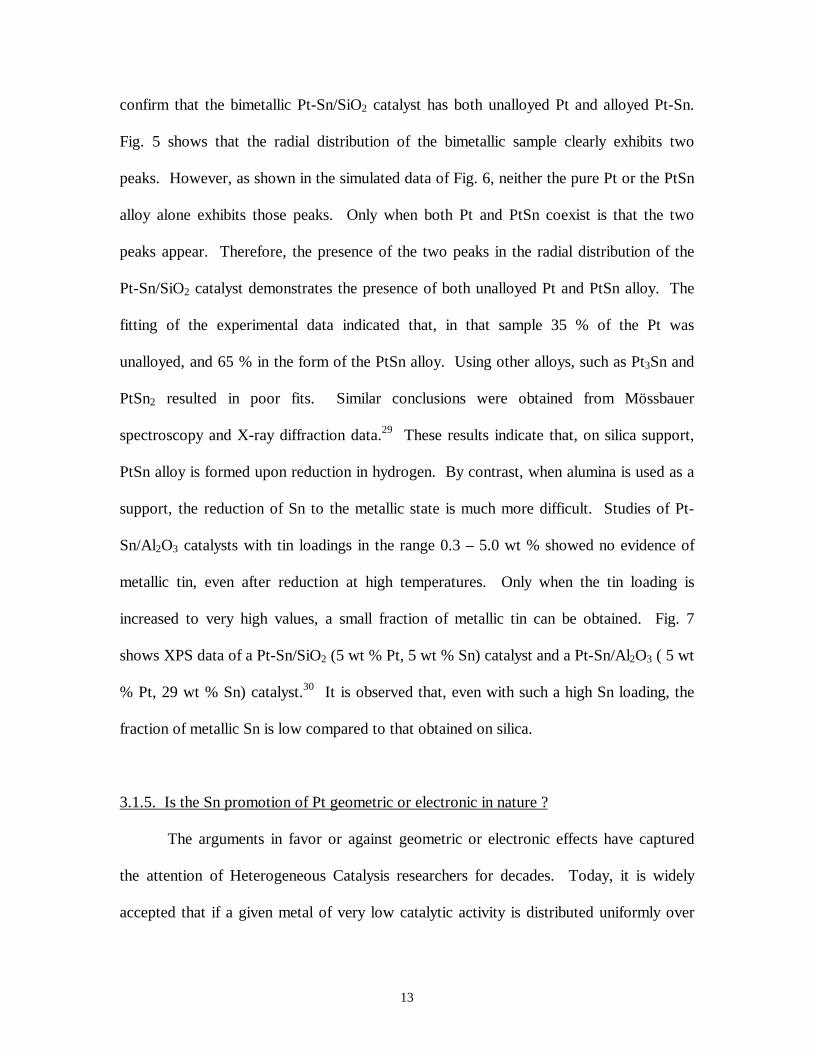
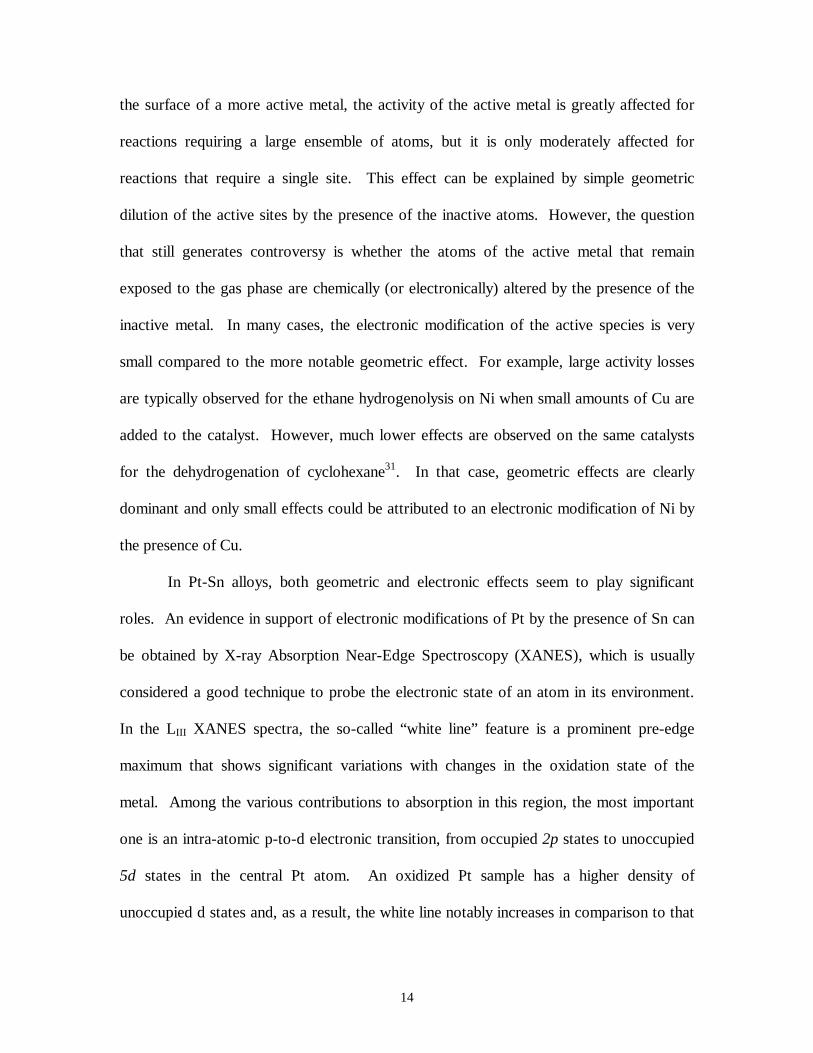
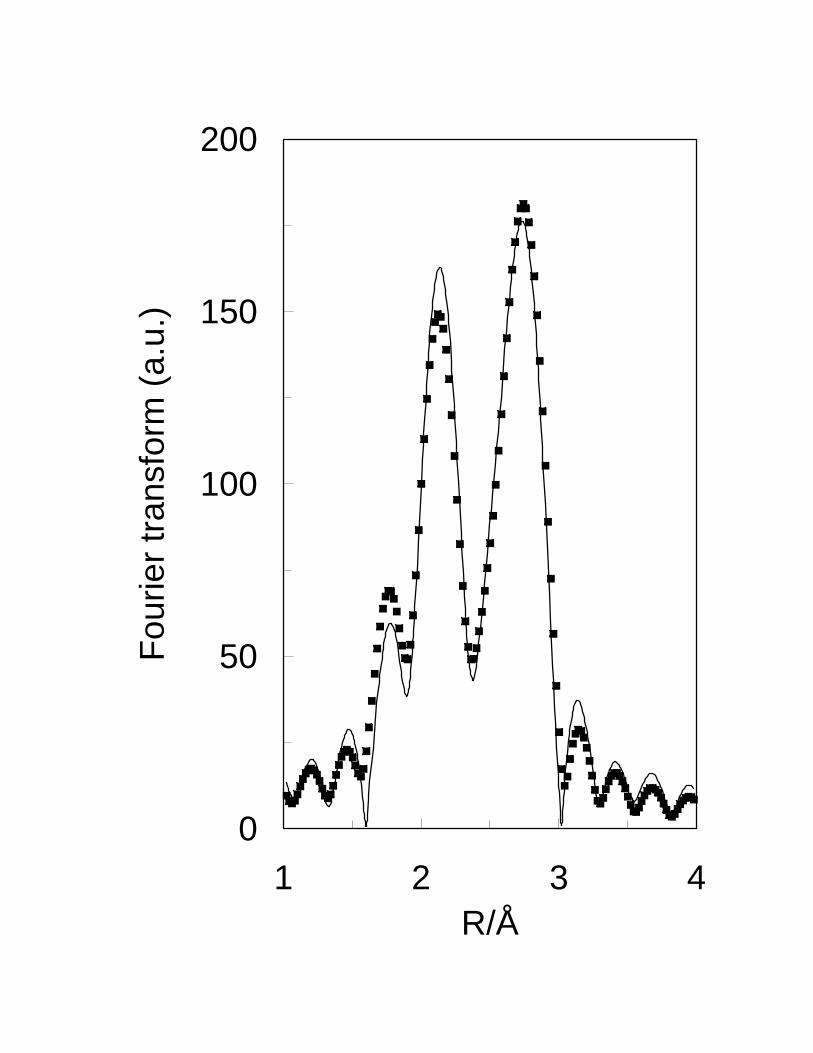
confirm that the bimetallic Pt-Sn/SiO2 catalyst has both unalloyed Pt and alloyed Pt-Sn.
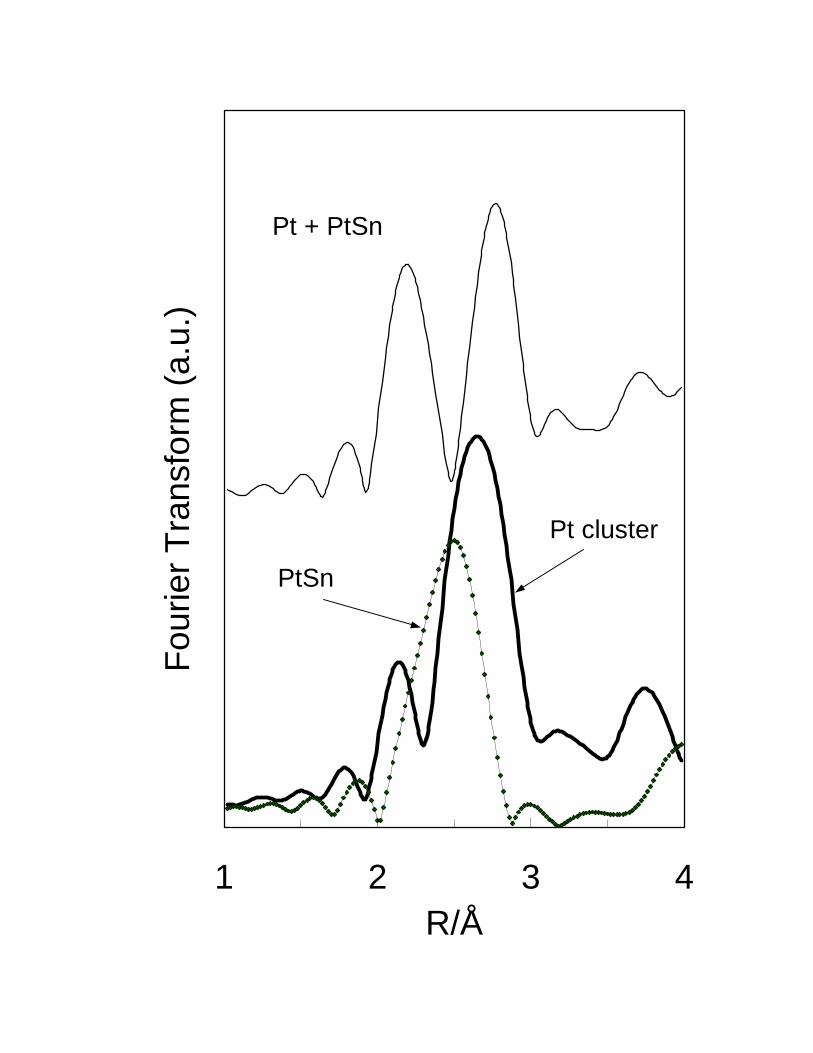
Fig. 5 shows that the radial distribution of the bimetallic sample clearly exhibits two
peaks. However, as shown in the simulated data of Fig. 6, neither the pure Pt or the PtSn
alloy alone exhibits those peaks. Only when both Pt and PtSn coexist is that the two
peaks appear. Therefore, the presence of the two peaks in the radial distribution of the
Pt-Sn/SiO2 catalyst demonstrates the presence of both unalloyed Pt and PtSn alloy. The
fitting of the experimental data indicated that, in that sample 35 % of the Pt was
unalloyed, and 65 % in the form of the PtSn alloy. Using other alloys, such as Pt3Sn and
PtSn2 resulted in poor fits. Similar conclusions were obtained from Mössbauer
spectroscopy and X-ray diffraction data.29 These results indicate that, on silica support,
PtSn alloy is formed upon reduction in hydrogen. By contrast, when alumina is used as a
support, the reduction of Sn to the metallic state is much more difficult. Studies of Pt-
Sn/Al2O3 catalysts with tin loadings in the range 0.3 – 5.0 wt % showed no evidence of
metallic tin, even after reduction at high temperatures. Only when the tin loading is
increased to very high values, a small fraction of metallic tin can be obtained. Fig. 7
shows XPS data of a Pt-Sn/SiO2 (5 wt % Pt, 5 wt % Sn) catalyst and a Pt-Sn/Al2O3 ( 5 wt
% Pt, 29 wt % Sn) catalyst.30 It is observed that, even with such a high Sn loading, the
fraction of metallic Sn is low compared to that obtained on silica.
3.1.5. Is the Sn promotion of Pt geometric or electronic in nature ?
The arguments in favor or against geometric or electronic effects have captured
the attention of Heterogeneous Catalysis researchers for decades. Today, it is widely
accepted that if a given metal of very low catalytic activity is distributed uniformly over
14
the surface of a more active metal, the activity of the active metal is greatly affected for
reactions requiring a large ensemble of atoms, but it is only moderately affected for
reactions that require a single site. This effect can be explained by simple geometric
dilution of the active sites by the presence of the inactive atoms. However, the question
that still generates controversy is whether the atoms of the active metal that remain
exposed to the gas phase are chemically (or electronically) altered by the presence of the
inactive metal. In many cases, the electronic modification of the active species is very
small compared to the more notable geometric effect. For example, large activity losses
are typically observed for the ethane hydrogenolysis on Ni when small amounts of Cu are
added to the catalyst. However, much lower effects are observed on the same catalysts
for the dehydrogenation of cyclohexane31. In that case, geometric effects are clearly
dominant and only small effects could be attributed to an electronic modification of Ni by
the presence of Cu.
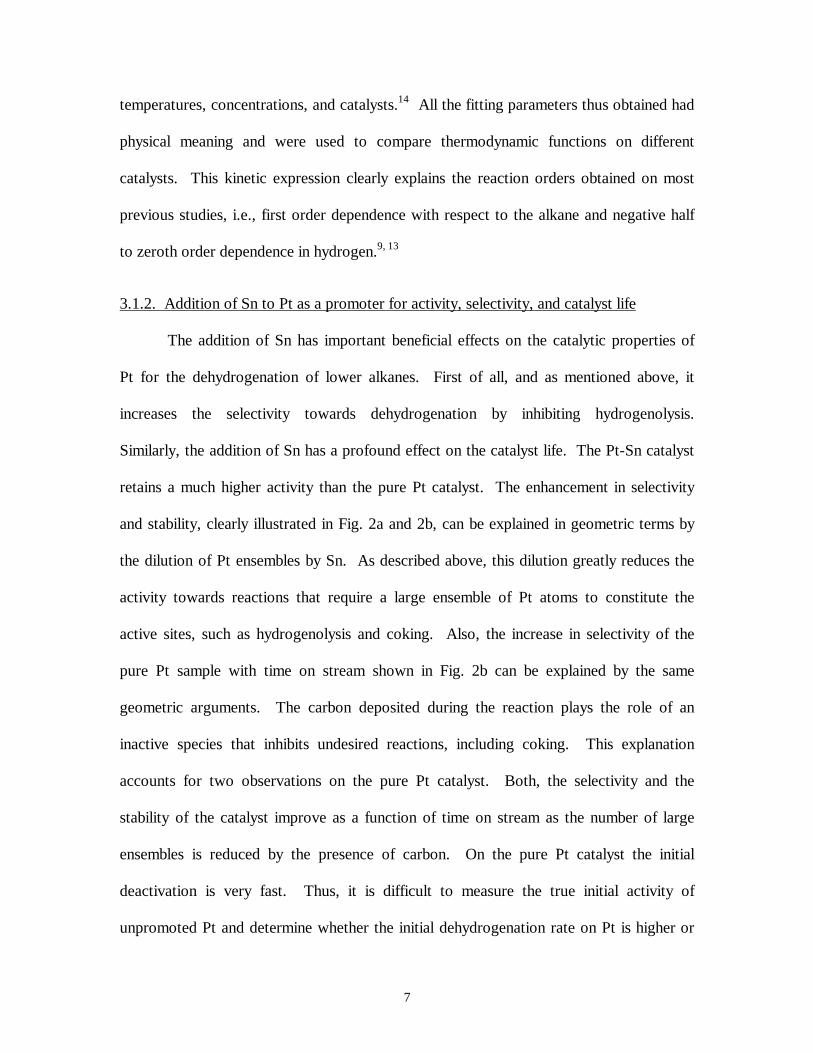
In Pt-Sn alloys, both geometric and electronic effects seem to play significant
roles. An evidence in support of electronic modifications of Pt by the presence of Sn can
be obtained by X-ray Absorption Near-Edge Spectroscopy (XANES), which is usually
considered a good technique to probe the electronic state of an atom in its environment.
In the LIII XANES spectra, the so-called “white line” feature is a prominent pre-edge
maximum that shows significant variations with changes in the oxidation state of the
metal. Among the various contributions to absorption in this region, the most important
one is an intra-atomic p-to-d electronic transition, from occupied 2p states to unoccupied
5d states in the central Pt atom. An oxidized Pt sample has a higher density of
unoccupied d states and, as a result, the white line notably increases in comparison to that
15
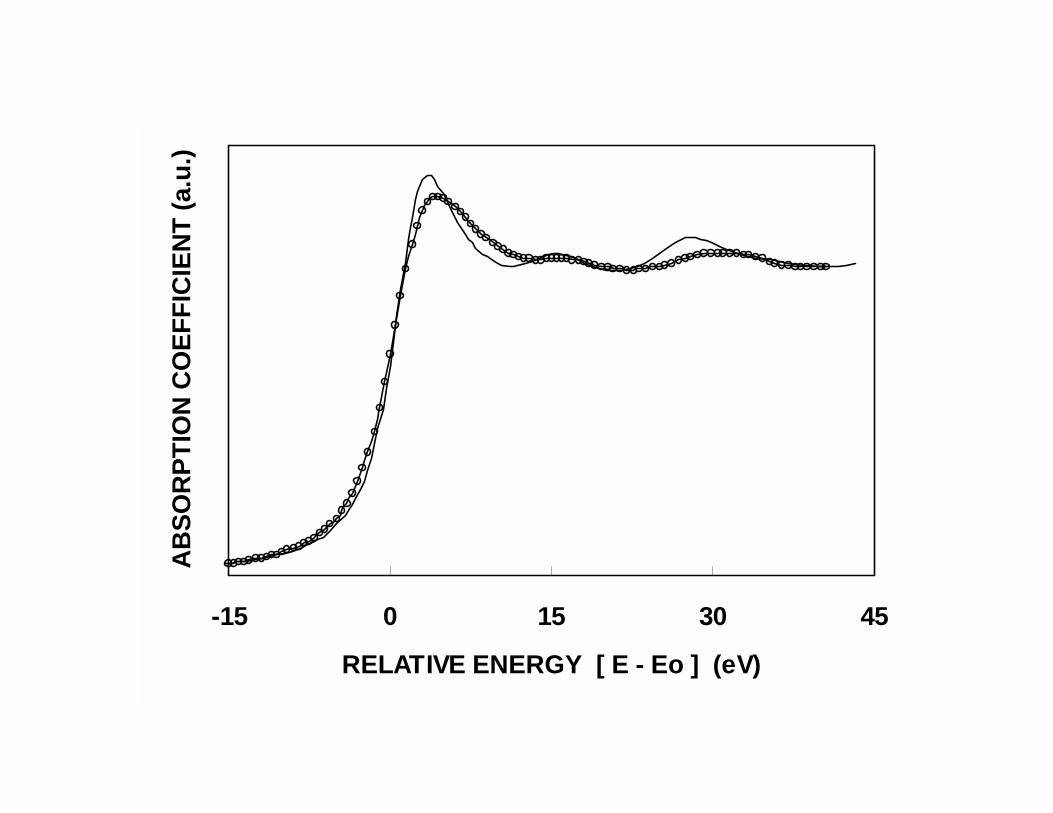
of the metallic Pt. Accordingly, an alteration of the Pt LIII edge shape caused by addition
of Sn would indicate an electronic modification of Pt, caused by the presence of Sn. This
alteration has, in fact, been reported in several papers, and it is illustrated in Fig. 8. The
reduction in the of the white line intensity has been taken by some authors as an
indication of a decrease in the density of unoccupied d states in Pt, which means that an
electron transfer occurs from Sn to Pt. Other authors32 have postulated that the
intermetallic interaction may involve sp orbitals. The Pt-Sn bonding in Pt3Sn alloys
would involve the occupied Sn 5p and the unoccupied Pt 6sp. The resulting donation of p
electrons from Sn to Pt would only have an indirect effect on the d states of Pt.
Recent quantum chemical calculations support these results and show that Sn
donates electrons to both 6sp and 5d orbitals. These calculations used density functional
theory (DFT) and were conducted for two types of Pt and Pt-Sn clusters. In the first type,
19 Pt atoms were constrained in three layers of an FCC-like crystal configuration,
keeping a fixed interatomic distance of 2.77Å. To study the effect of Sn, three Pt atoms
were replaced in the corners of the top layer. These two clusters were called Pt19 and
Pt16Sn3, respectively. In the second type of cluster, the distribution of 10 Pt atoms was
optimized for energy minimization, letting the interatomic distances relax from the bulk
value of 2.77Å. Here, the effect of Sn was evaluated by replacing four Pt atoms by Sn
atoms, three at the corners of the top layer, and one at the bottom. Table 2 summarizes
the Mulliken electron population of the 6s, 6p, and 5d orbitals in three top Pt atoms for
the four different clusters. A clear increase in electron population is observed in both the
6sp and 5d orbitals when Sn is added in the cluster, indicating an electron donation from
Sn to Pt.
16
Even when electronic interactions do occur, they may not necessarily have
significant effects on the catalytic properties. The analysis of the nature and energetics of
adsorption of certain adsorbates may help determine whether electronic effects have
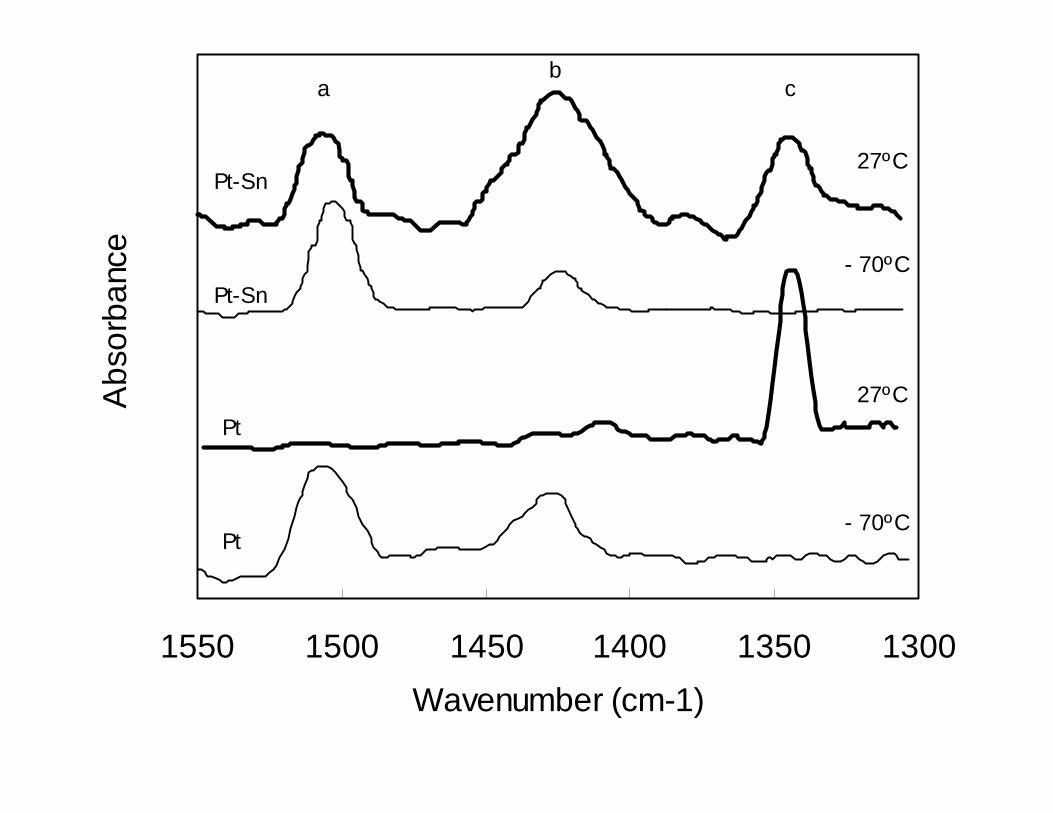
important influences in catalysis. For example, in the Pt-Sn system, the adsorption of
ethylene has been a sensitive probe that has provided important information.33 It is
known that on pure platinum, ethylene can adsorb in different forms. At low
temperatures, π-bonded ethylene and di-σ bonded ethylene species can be observed.
However, as the temperature is increased above room temperature, an ethylidyne species
appears. The evolution of these species as a function of temperature can be examined in
the following IR and microcalorimetry experiments. As shown in the IR spectra in Fig.
9, when the adsorption of ethylene is conducted on a Pt/SiO2 catalyst at –70ºC, two bands
are typically observed at 1506 and 1428 cm-1. These bands are due to π-bonded ethylene
and di-σ-bonded ethylene, respectively. Under these conditions, the measured initial heat
of adsorption is 125 kJ/mol. By contrast, when the temperature is increased to room
temperature (25ºC), the bands at 1506 and 1428 cm-1 almost completely disappear and a
new band at 1342 cm-1 dominates the spectrum. This band is due to ethylidyne. At this
temperature, the initial heat of adsorption increases to 157 kJ/mol, consistent with a
stronger interaction of the ethylidyne species with the surface. A different behavior is
observed on the Pt-Sn/SiO2 catalyst. For this catalyst, the same two bands at 1506 and
1428 cm-1 are observed at low temperatures, but they do not disappear when the
temperature is increased to 27ºC. At this temperature, the transformation of π-bonded
ethylene and di-σ-bonded ethylene species to ethylidyne is much less pronounced on the
bimetallic catalyst than on the pure Pt catalyst. Then, not only the bands corresponding
17
to π-bonded ethylene and di-σ-bonded ethylene species are more intense, but also the
band corresponding to ethylidyne is significantly weaker than on pure Pt. As mentioned
above, it is possible that a significant fraction of Pt remains as unalloyed Pt. Therefore,
the small ethylidyne band observed on the Pt-Sn catalyst may in fact be due to adsorption
sites on the small Pt fraction that is not alloyed with Sn. The microcalorimetric data on
the Pt-Sn catalysts are also consistent with the IR data. The observed heat of adsorption
at room temperature was only 135 kJ/mole, much lower than on pure Pt, which was 157
kJ/mol. The observed hindrance in the ability of Pt to form the ethylidyne surface species
when Sn is added could just be due to a geometric blockage by Sn of the 3-fold Pt sites
necessary to stabilize the ethylidyne species. In fact, that may certainly occur. However,
the DFT quantum chemical calculations have shown that, even when Sn is not occupying
the 3-fold Pt sites, it may exert an electronic effect that prevents the stabilization of
ethylidyne. The calculated changes in energy, per mole adsorbed, when π-bonded
ethylene, di-σ-bonded ethylene, or ethylidyne species form on Pt and Pt-Sn clusters are
summarized in Table 3. It is observed that the addition of Sn weakens the interaction of
ethylene with Pt for all three species. However, the effect is most pronounced for the
ethylidyne species. On the Pt-Sn clusters, very small, if any, exothermicity is predicted
by these calculations for the adsorption on the 3-fold Pt sites. Moreover, the Mulliken
population analysis suggests that the formation of ethylidyne species on Pt involves
electron donation from ethylidyne to the 6sp orbitals on Pt, accompanied by back-
donation from the 5d orbitals to the adsorbate. This analysis further shows that the
increased electronic population in Pt as a result of the addition of Sn, causes a more
repulsive interaction for the formation of ethylidyne than for the formation of π-bonded
18
ethylene or di-σ-bonded ethylene. Therefore, it seems that when Sn is added to Pt, both
geometric and electronic effects contribute to inhibit the stabilization of ethylidyne on the
surface.
3.1.6. Catalyst Deactivation and Regeneration
The major cause of catalyst deactivation in dehydrogenation processes is carbon
deposition. The high temperatures and low pressures necessary to achieve high
equilibrium conversions are conducive to the rapid formation of coke. The use of
promoters and the operating conditions, e.g., temperature and H2/alkane ratio, are
parameters that can be adjusted to modify the rate and extent of carbon deposition.
A typical kinetics expression that describes the rate of carbon formation has the
form:
rC = k1 PiC4H8 – k-1 PH2 C (4)
(1 + Ka PiC4H8 + Kb PH1/2 + KcC )
where P iC4H8 and PH are the partial pressures of olefin and hydrogen, respectively,
C is the concentration of carbon on the surface, and k1, k-1, Ka, and Kb temperature-
dependent parameters that are a function of the catalyst. Here it is important to note that
the expression predicts a strong inhibition of coke formation by both a negative term in
the numerator, which reflects the elimination of carbonaceous deposits by hydrogenation
and a term in the denominator that result from the competition for adsorption sites. The
expression also predicts that the rate of coke formation is expected to be higher initially,
when the amount of carbon on the surface is low. Both trends are in fact observed
experimentally. What is important to discuss is that the concentration at which the
19
carbon on the surface begins to inhibit further deposition is a strong function of the
catalyst composition. For example, while on a Pt/Al2O3 catalyst, the rate of formation
starts slowing down at a carbon content of about 2 wt % C, on a bimetallic Pt-Sn/Al2O3
catalyst the coking rate remains unchanged up to about 7 wt % C.
Due to the substantial formation of coke, lower alkane dehydrogenation catalysts
require frequent regenerations. Different regeneration procedures have been tested, the
most common ones involving oxygen, but other alternative, or complementary methods
involve treatment in chlorine, steam or sulfur-containing streams.34 The most obvious
effect of the regeneration treatment with oxygen is the burning of the carbonaceous
deposits. It is generally accepted that two distinct coke burning processes occur as a
function of temperatures. Oxidation of carbonaceous deposits is a catalytic process that
is greatly accelerated by Pt, or other metals typically used in dehydrogenation reactions.
Therefore, the oxidation of coke in contact with (or in the close vicinity of ) the metal
particles can readily occur at relatively low temperatures. By contrast, the coke deposited
on the support, away from the metal particles, can only be oxidized at high temperatures
because it requires the spillover of activated oxygen from the metal onto the support.
The two oxidation regions can be clearly demonstrated by the temperature
programmed oxidation (TPO) technique. When the support is alumina two distinct
oxidation peaks are clearly observed, one at about 450°C and another above 500°C. A
clear demonstration that the one at the lower temperature is associated with the metal was
conducted on Pt and Pt-Sn catalysts.35 Both, the dehydrogenation activity and hydrogen
chemisorption capacity were completely restored after a partial oxidation of the coke
deposits at 450°C. These results clearly demonstrate that the coke removed by high
20
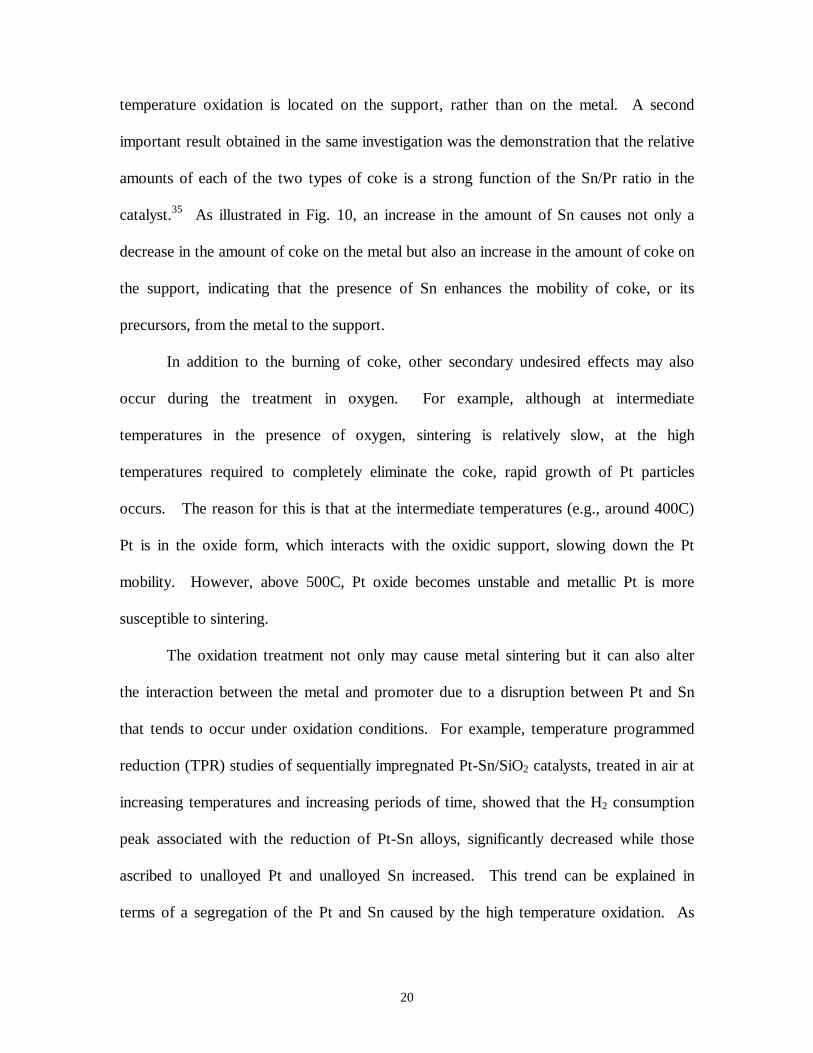
temperature oxidation is located on the support, rather than on the metal. A second
important result obtained in the same investigation was the demonstration that the relative
amounts of each of the two types of coke is a strong function of the Sn/Pr ratio in the
catalyst.35 As illustrated in Fig. 10, an increase in the amount of Sn causes not only a
decrease in the amount of coke on the metal but also an increase in the amount of coke on
the support, indicating that the presence of Sn enhances the mobility of coke, or its
precursors, from the metal to the support.
In addition to the burning of coke, other secondary undesired effects may also
occur during the treatment in oxygen. For example, although at intermediate
temperatures in the presence of oxygen, sintering is relatively slow, at the high
temperatures required to completely eliminate the coke, rapid growth of Pt particles
occurs. The reason for this is that at the intermediate temperatures (e.g., around 400C)
Pt is in the oxide form, which interacts with the oxidic support, slowing down the Pt
mobility. However, above 500C, Pt oxide becomes unstable and metallic Pt is more
susceptible to sintering.
The oxidation treatment not only may cause metal sintering but it can also alter
the interaction between the metal and promoter due to a disruption between Pt and Sn
that tends to occur under oxidation conditions. For example, temperature programmed
reduction (TPR) studies of sequentially impregnated Pt-Sn/SiO2 catalysts, treated in air at
increasing temperatures and increasing periods of time, showed that the H2 consumption
peak associated with the reduction of Pt-Sn alloys, significantly decreased while those
ascribed to unalloyed Pt and unalloyed Sn increased. This trend can be explained in
terms of a segregation of the Pt and Sn caused by the high temperature oxidation. As
21
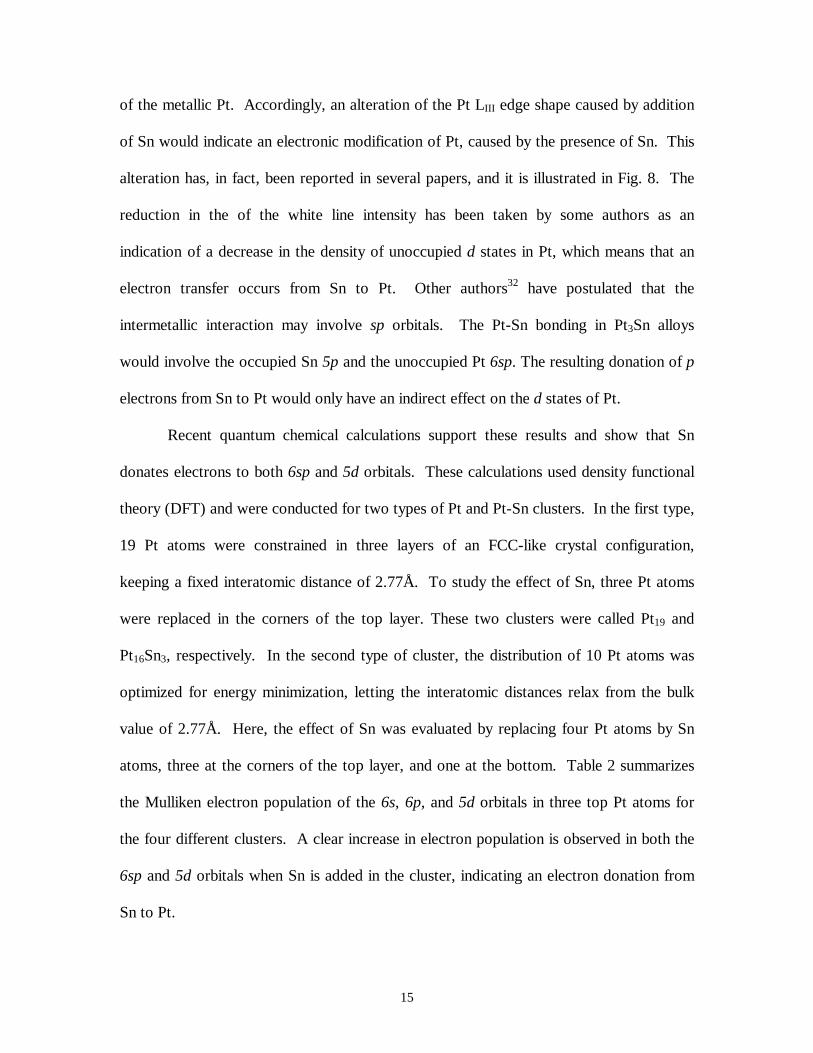
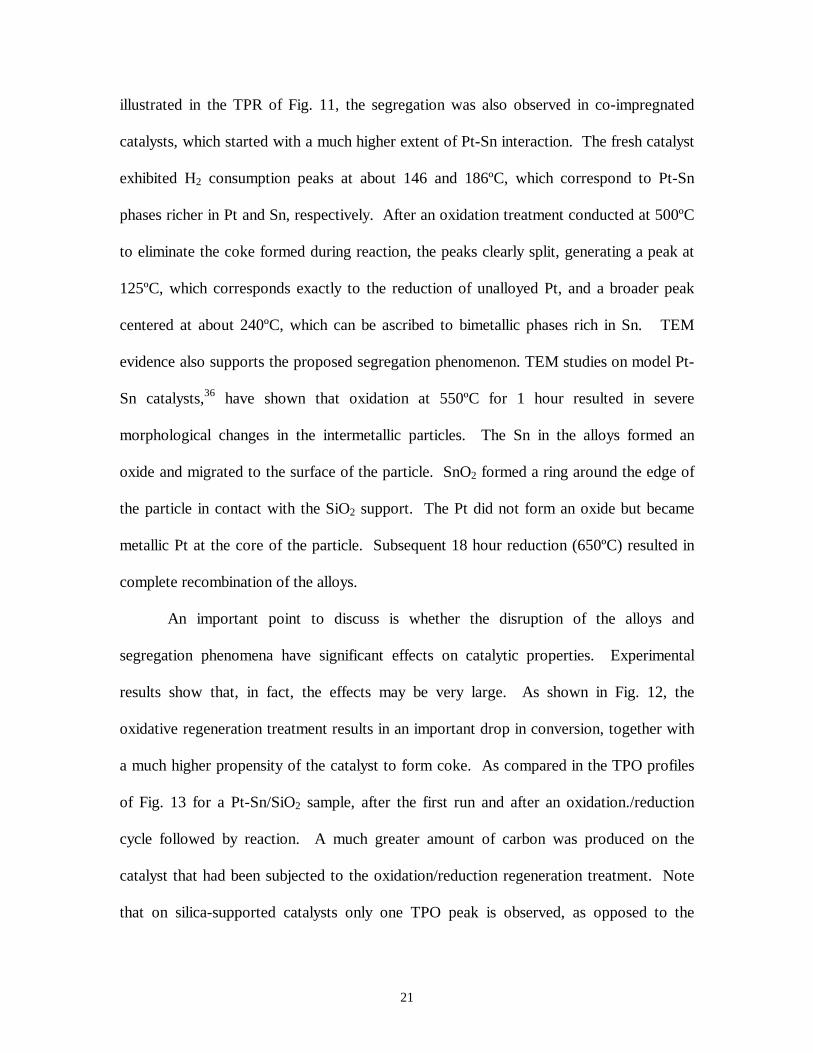
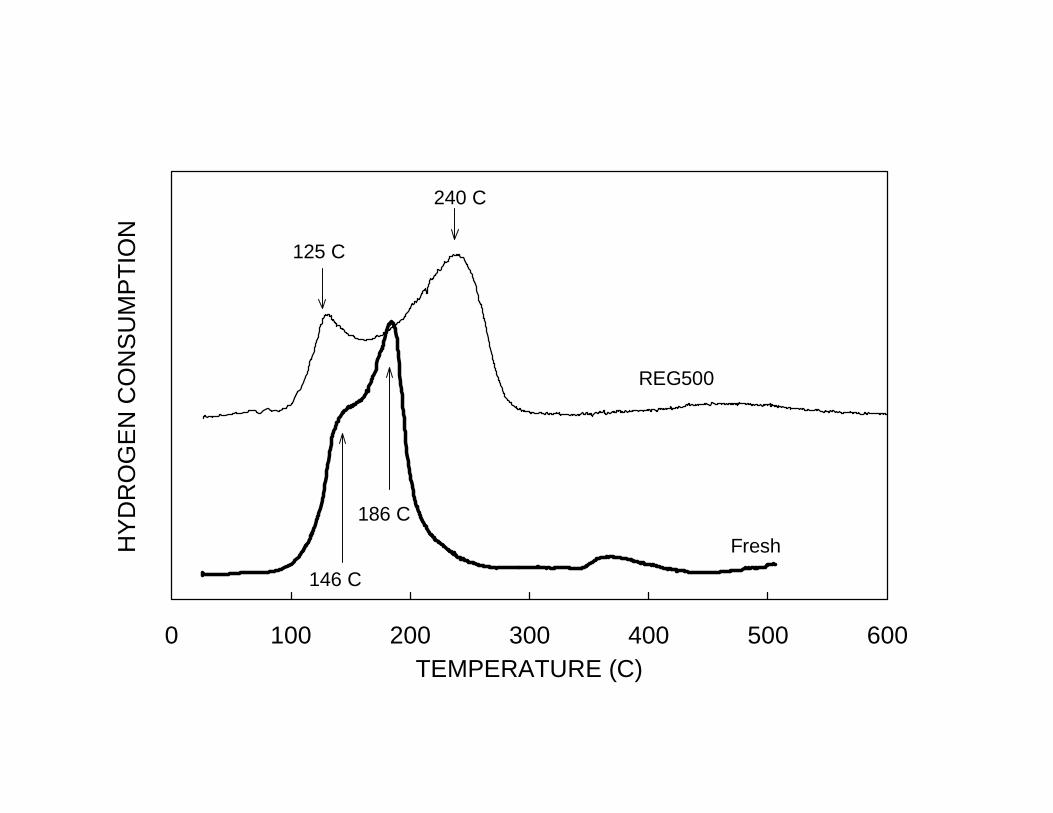
illustrated in the TPR of Fig. 11, the segregation was also observed in co-impregnated
catalysts, which started with a much higher extent of Pt-Sn interaction. The fresh catalyst
exhibited H2 consumption peaks at about 146 and 186ºC, which correspond to Pt-Sn
phases richer in Pt and Sn, respectively. After an oxidation treatment conducted at 500ºC
to eliminate the coke formed during reaction, the peaks clearly split, generating a peak at
125ºC, which corresponds exactly to the reduction of unalloyed Pt, and a broader peak
centered at about 240ºC, which can be ascribed to bimetallic phases rich in Sn. TEM
evidence also supports the proposed segregation phenomenon. TEM studies on model Pt-
Sn catalysts,36 have shown that oxidation at 550ºC for 1 hour resulted in severe
morphological changes in the intermetallic particles. The Sn in the alloys formed an
oxide and migrated to the surface of the particle. SnO2 formed a ring around the edge of
the particle in contact with the SiO2 support. The Pt did not form an oxide but became
metallic Pt at the core of the particle. Subsequent 18 hour reduction (650ºC) resulted in
complete recombination of the alloys.
An important point to discuss is whether the disruption of the alloys and
segregation phenomena have significant effects on catalytic properties. Experimental
results show that, in fact, the effects may be very large. As shown in Fig. 12, the
oxidative regeneration treatment results in an important drop in conversion, together with
a much higher propensity of the catalyst to form coke. As compared in the TPO profiles
of Fig. 13 for a Pt-Sn/SiO2 sample, after the first run and after an oxidation./reduction
cycle followed by reaction. A much greater amount of carbon was produced on the
catalyst that had been subjected to the oxidation/reduction regeneration treatment. Note
that on silica-supported catalysts only one TPO peak is observed, as opposed to the
22
alumina-supported catalysts described in Fig. 10, where one peak corresponds to coke on
the metal and one on the support. Therefore, all the coke formed in this case must be
associated with the metal. When the comparison is made between Pt-Sn bimetallic
catalysts and pure Pt catalysts, it is observed that the latter forms much more coke, and
the TPO peak appears at somewhat higher temperatures, due to a more refractory nature
of the carbon. In the case of the Pt-Sn sample, after the oxidation/reduction cycle, the
TPO peak shifts to the same position as that observed on pure Pt catalysts. This shift
indicates that some of the alloy has been destroyed, leaving behind patches of unalloyed
Pt, on which the formation of the graphitic carbon is more favorable. The regenerated Pt-
Sn catalyst still form less carbon than the pure Pt sample, but almost four times the
amount found on the fresh bimetallic sample. Therefore, the activity loss observed after
the oxidation/reduction cycle can be linked to the partial destruction of the Pt-Sn alloy,
which results in an increase in the deactivation due to coking. Under oxidizing conditions
at high temperatures, the Sn forms an oxide and, at the expense of the subsurface layer,
the exterior becomes rich in Sn. The Pt, which does not form an oxide, is metallic and
becomes the core of the particle. Reduction at high temperatures results in the
destruction of the oxide and possibly redistribution of the Sn, opening patches of pure Pt.
Although the thermodynamically most stable configuration is the complete
recombination of the alloy, short reduction times do not allow for this to occur.
Consequently, after the oxidation/reduction cycle, the bimetallic particles have become
heterogeneous, with Sn-rich regions interdispersed with Pt-rich regions. It is even
possible that pure Pt ensembles are present allowing for the formation of more refractory
carbon to form on the surface under subsequent exposure to reaction conditions. On
23
alumina-supported catalysts, the disruption of Pt-Sn alloys by the high temperature
oxidation is even more pronounced than on silica-supported catalysts.37
The deleterious effects of alloy disruption and Pt-Sn segregation, as well as
sintering of Pt may be overcome by the so-called oxychlorination treatment. In this
treatment chlorine-containing compounds are incorporated in the oxidation stream. This
is a process that has been employed for many years in the regeneration of naphtha
reforming catalysts, but has also been applied in the regeneration of dehydrogenation
catalysts. With monometallic Pt catalysts, the main effect of the oxychlorination
treatment is the redispersion of the Pt particles, which may have sintered during the coke
burning operation. During the oxychlorination treatment, volatile Pt oxychloride species
form and effectively re-disperse the Pt when these species are anchored by the alumina
support. When Sn is present on the catalyst, the effect of chlorine during the
oxidation/reduction cycles depends on the type of support and the Sn loading. For
example, on alumina, Sn may block the anchoring sites of the support, thus inhibiting the
redispersion process. But, at the same time, oxychlorination of bimetallic Pt-Sn catalysts
enhances the contact between Pt and Sn. Thus Cl may have the effect of minimizing the
Pt-Sn segregation that would normally occur in the oxidation treatment without
chlorine.38 The unwanted effect of the oxychlorination process is the generation of
acidity on the support, which must be neutralized to avoid the increase in coke formation
and isomerization products in the subsequent cycle.
Other regeneration methods include the use of steam, either during the
regeneration or continuously during the reaction. Steam can help to reduce the formation
of coke, via the reaction:
24
C + 2 H2O ⇔ CO2 + 2 H2
This reaction is accelerated by the presence of alkali ions, which are sometimes added to
the catalysts as promoters, not only to favor this reaction, but also to eliminate support
acidity.
3.1.7 Industrial units using Pt-based catalysts
Several commercial processes employ Pt-based catalysts. For example, Oleflex
from UOP employs promoted Pt/Al2O3 catalysts in a reaction system composed of 3 to 4
moving bed reactors. In this process, the catalyst is continuously regenerated in a separate
regeneration circuit. A typical Oleflex catalyst consists of spherical pellets of γ-alumina
(surface area about 100 m2/g) containing Pt (< 1 wt %) and promoted with Sn and alkali
metals (e.g. Li). In some patents,39 it is implied that Co and Zn can also been used as
promoters for these catalysts. The STAR process from Phillips Petroleum40 employs a
solid catalyst based on Pt, 0.2 to 0.6 wt %, supported on a Zn aluminate material, 10 to 50
m2/g. This support exhibits a unique stability at high temperatures in the presence of
steam, and this is essential in this case because the process involves the use of steam as a
diluent, at a high steam/alkane feed ratio and relatively high pressures, i.e. up to 3.5 atm..
In addition, due to its non-acidic nature, the support does not promote undesired side
reactions, such as isomerization or cracking. The catalyst contains Sn as a promoter to
reduce coke formation and increases selectivity. As mentioned above, when a diluent
such as steam is added, higher equilibrium conversions can be obtained. In this process,
the operating alkane conversion at 600ºC is close to 50 % and the overall selectivity is
reported to be 95 %.
25
3.2. Chromia-based dehydrogenation catalysts:
Several oxides are able to readily catalyze the activation of C-H bonds via hydrogen
abstraction. In this step, the oxygen species plays an important role in the formation of a
surface O-H bond after the rupture of the C-H bond. However, the crucial role is played
by the surface cations, which are thought to be responsible for the initial activation of the
C-H bond. Chromium oxide has been known as an effective dehydrogenation catalyst for
many years.41 The first chromia-based catalysts were developed at the onset of World
War II, when the sources of natural rubber were suddenly discontinued, and butadiene
had to be made by dehydrogenating n-butane or n-butene. In recent years, with the
increased demand for dehydrogenation processes, modified chromia-based catalysts are
being used in the dehydrogenation of isobutane and propane. In industrial applications,
alumina is the preferred support. Zirconia has been recently considered as a promising
support due to its high thermal and chemical stability.
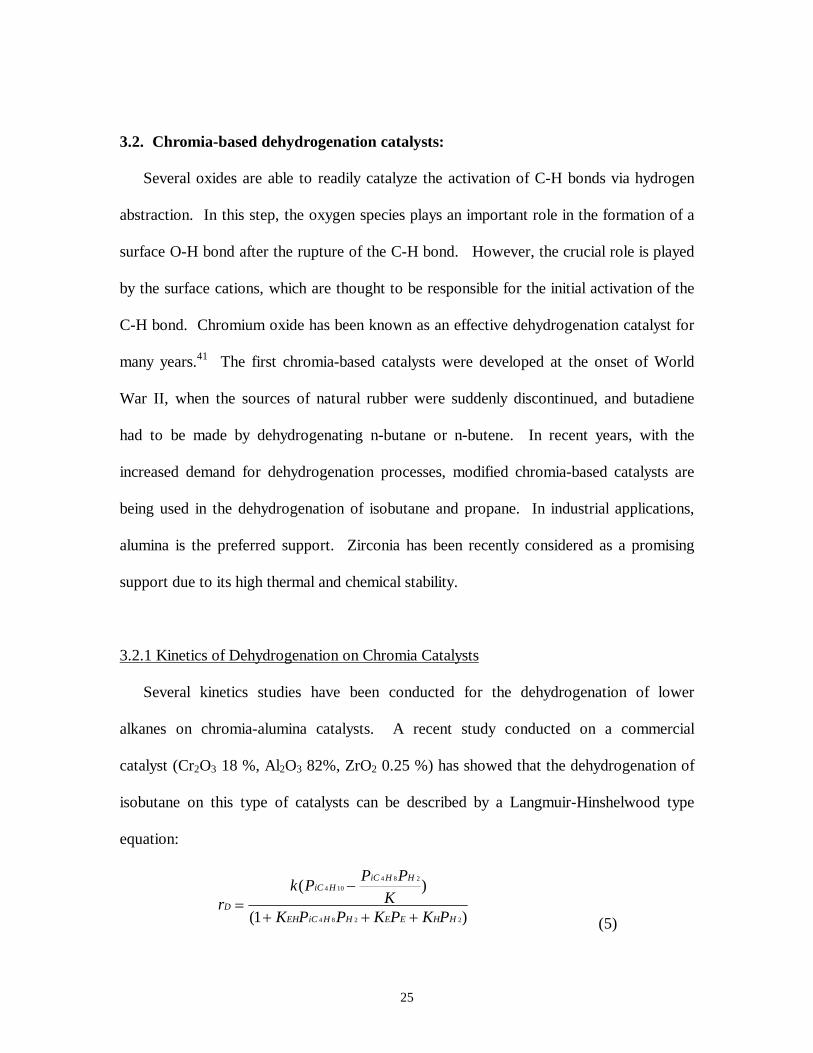
3.2.1 Kinetics of Dehydrogenation on Chromia Catalysts
Several kinetics studies have been conducted for the dehydrogenation of lower
alkanes on chromia-alumina catalysts. A recent study conducted on a commercial
catalyst (Cr2O3 18 %, Al2O3 82%, ZrO2 0.25 %) has showed that the dehydrogenation of
isobutane on this type of catalysts can be described by a Langmuir-Hinshelwood type
equation:
)1(
)(
2284
284104
HHEEHHiCEH
HHiCHiC
DPKPKPPK
KPPPk
r+++
−=
(5)
26
Similar to expression (3), obtained for the Pt-based catalysts, this expression predicts a
first order with respect to the alkane concentration. However, as opposed to the situation
on the Pt catalysts, for which the inhibition by hydrogen was due to a competition for
adsorption sites with the alkane, on the chromia catalysts the best fits of the experimental
data were obtained when the hydrogen terms in the denominator were neglected. This
result is an indication that, on chromia catalysts, hydrogen does not strongly inhibit the
adsorption of alkane.
3.2.2. Active Species in Supported Chromia Catalysts
Chromium oxide supported on alumina has been extensively studied by a number
of characterization techniques (e.g. UV-Vis diffuse reflectance, Raman spectroscopy, X-
ray photoelectron spectroscopy, and chemical analysis). However, the exact nature of the
active site is still controversial. The nature of the chromium species existing on the
surface of a calcined catalyst are not only dependent on a number of parameters, such as
type of support, pre-calcination temperature, and chromium oxide loading, but they also
change during the reaction. On a calcined sample, two types of Cr6+ species have been
normally found. One of them is grafted Cr6+, anchored to the alumina support by
interaction with the surface OH groups. The second type of Cr6+ species on calcined
samples is not chemically bound to the support. The amount of each of these species can
be estimated by first extracting the unbound fraction with water, and then titrating (by
iodometry) the extracted and solid fractions. The remaining amount of chromium left on
the surface is Cr3+. This oxidation state can be either in the form of crystalline aggregates
of α-Cr2O3, large enough to be detected by XRD, or as highly dispersed Cr3+ species,
27
undetected by XRD. A typical distribution of each of these species as a function of
chromium content on a chromia-alumina catalyst series is shown in Fig. 14.42 It can be
observed that, at low chromium loadings, the grafted Cr6+ is the dominant species, as the
amount of Cr increases, the fraction of soluble Cr6+ begins to increase, reaching a plateau
at about 2 wt % CrO3. Interestingly, when the Cr loading was kept constant on alumina
supports of varying surface area, the amount of grafted Cr6+ increased linearly with
surface area. In the present example, at Cr loadings higher than about 4 wt % CrO3 the
Cr3+ species begin to form. At the high-loading end, they are the dominant species on the
catalyst, including the presence of α-Cr2O3, clearly observable by XRD.
In a reducing environment, as that encountered under reaction conditions, the Cr6+
species are reduced to Cr3+. Fig. 15a shows XPS spectra of a calcined 15.3 % CrO3 on
alumina catalyst. The peaks obtained in the binding energy region corresponding to Cr 2
p3/2 were fitted with contributions from Cr6+ and Cr3+ states, taking into consideration the
multiplet states that arise from the spin-orbit splitting. A significant fraction of Cr6+ has
been clearly observed in all calcined catalysts, being the dominant form on the catalysts
with lower Cr concentration. After a reduction treatment in H2, or after the
dehydrogenation reaction, the peak corresponding to Cr6+ decreased significantly. This
decrease is illustrated in Fig. 15b, which compares a K-promoted, 15.3 wt %
CrO3/alumina catalyst after calcination, reduction in H2, and reaction at 470°C in
isobutane/He feed. An interesting difference between the two calcined samples in Fig.
15a and 15b is clearly evident. The K-promoted catalyst shows a higher Cr6+/Cr3+ ratio,
which was also confirmed by chemical analysis and was ascribed to the formation of a
potassium chromate phase at the expense of the Cr3+ species.
28
The interesting point is that the Cr3+ species are supposed to be the active species,
but not all Cr3+species are equally active. In fact, it is believed that the chromium species
initially present on the calcined catalyst as dispersed Cr6+, are more active than α-Cr2O3.
Therefore, the catalyst activation involves the Cr6+-to-Cr3+ transformation. However, in
many cases, the pre-reduction step is omitted because the reaction environment is
reducing and the reaction temperature is normally high enough to induce the
transformation. Although a pre-oxidized sample may exhibit a lower initial conversion,
it eventually reaches the same conversion as one that has been pre-reduced in hydrogen
or other reducing gas.
Industrial chromia-based dehydrogenation catalysts contain small amounts of
alkali promoters, typically 1 wt % K. The beneficial role of the alkali is related to its
ability to poison the acidic sites on the alumina and to inhibit the undesired cracking and
coke formation, associated with acidity. However, the alkali promoter plays a role in
determining the nature of the Cr species present on the catalyst surface. As mentioned
above, the presence of K may lead to the formation of a potassium chromate (Cr6+) phase.
Although this phase is destroyed under reaction conditions, depending on the K and Cr
concentrations, its formation may inhibit the generation of less active forms of Cr3+, e.g.
α-Cr2O3. For Cr concentrations of the order of 15 wt % CrO3 and above, the addition of
K has a promoting effect on dehydrogenation activity, but only at low K concentrations.
When the K concentration exceeds about 1.2 wt % K, the formation of the less active α-
Cr2O3 is enhanced. On the other hand, at low Cr concentrations, e.g. 10 wt % CrO3 and
lower, the addition of K does not result in an increase in activity.
29
3.2.3 Typical Preparation of a Chromia-based Dehydrogenation Catalyst
The γ-alumina support (surface area 80-100 m2/g) is impregnated with an aqueous
solution of CrO3 and K2CrO4 to derive a loading of chromium of about 5-7 wt % Cr and
of potassium of about 1 wt % K. After drying at room temperature, the catalyst is
calcined in flow of air at 600ºC for 6 h. During this calcination step, decomposition of
the chromium precursors occurs, together with an strengthening in the interaction
between the chromium and aluminum oxides. Before reaction, the catalyst is sometimes
activated in situ by reduction in hydrogen flow at 500ºC. Alternatively, the reduction can
be induced by the reaction mixture. After the deposition of chromium oxide, the surface
area typically remains almost unchanged with respect to the original alumina support,
which indicates that the chromium oxide does not agglomerate or plug the pores of
alumina.
Recent studies indicate that using zirconia (ZrO2) as a support of chromia
catalysts instead of alumina may have interesting advantages. Among the potential
advantages of chromia-zirconia catalysts Zirconia is a catalyst support that in recent
years has attracted the attention of researchers for applications in several reactions. In
most catalyst preparations, the support precursor is hydrous zirconium oxide, which is
commonly obtained by precipitation from ZrOCl2 solutions. Typically, the precipitation
is carried out by dropwise addition of ammonium hydroxide, or alternatively, by bubbling
in the solution a gaseous flow of ammonia in an inert carrier. The precipitate is finally
washed to eliminate traces of Cl-. Without the addition of any promoter, the zirconium
oxide rapidly loses its surface area upon heating to the high temperatures required by the
dehydrogenation reactions. This loss in surface area accompanies a crystallographic
30
phase transformation from the metastable tetragonal phase into the monoclinic phase.
However, the presence of foreign species, able to interact with the surface of zirconia,
significantly retards this transformation and helps retaining relatively high surface areas.
This resistance to surface area losses by addition of foreign species has been observed on
several systems, such as sulfate zirconia, tungstated zirconia, chromia-zirconia, as well as
ceria- and lanthanum-doped zirconias. In all these cases, the preservation of surface area
parallels the retention of tetragonal zirconia. Fig. 16 illustrates this trend for a series of
chromia-zirconia catalysts. As the Cr content increased, both the surface area and
fraction of tetragonal zirconia, retained in the sample after heating at 873 K, increased.
3.2.4. Industrial units using chromia-based catalysts
The three main industrial dehydrogenation processes that employ chromia-
alumina catalysts are the Catofin, the Linde-BASF, and the Snamprogetti-Yarsinetz FBD.
In the Catofin process, the reaction takes place at sub atmospheric pressure and in the
temperature range 525-675ºC in 3 to 8 fixed bed adiabatic reactors, depending on the
feedstock. The catalyst is of the chromia-alumina type, containing about 20 wt %
chromia. The process does not use hydrogen or steam as a diluent or to decrease coke
formation. So, the coking rate is very fast and a cyclic operation is required. Each cycle
includes the reaction period, discharge of the reactor, and regeneration/reheating in situ.
The regeneration/reheating involves the burning of the coke. This step not only
eliminates the coke from the catalyst, but also brings the temperature up, after cooling
down due to the endothermicity of the reaction. Typically, about 2 % of the feed goes to
coke and the reaction cycles are of the order of 8 min. The complete cycle, including
31
regeneration/reheating is finished in less than 20 min. Most of the activity is regained
after the regeneration/reheating step. However, a slow irreversible deactivation does take
place over the reaction-regeneration cycles. This deactivation is due to a decrease in
surface area and a phase transformation to the less active form of α-chromia. To
compensate for the activity loss, the process temperature is increased, but this
temperature increase accelerates the phase transformation and consequently the rate of
deactivation. After 1.5 to 3 years the catalyst load has to be replaced.
The Snamprogetti-Yarsinetz FBD process employs fluidized-bed reactors, without
diluents and operating at atmospheric pressure. In this process, the chromia-alumina
catalyst is continuously transferred from the reactor to the regeneration zone and back to
the reactor. The catalyst contains 12-20 wt % Cr2O3 supported on a mixture of high
transition aluminas.
3.3. Other Lower-Alkane Dehydrogenation Catalysts
In addition to the Pt- and chromia-based catalysts other materials have reported to
be active and selective for the dehydrogenation of lower alkanes. For example, zinc
titanates have shown moderate activity for isobutane dehydrogenation.43 These materials
exhibit some economic and environmental advantages. Their cost is low in comparison
to the Pt-based catalysts and they do not exhibit the toxicity of the chromia-based
catalysts. A recent study44 conducted on zinc titanate films has shown that there is a clear
correlation between dehydrogenation activity and the catalyst structure. Depending on
the Zn/Ti ratio, several phases may be present on these catalysts. When the Zn/Ti ratio
was lower than 1, the phases present were hexagonal zinc metatitanate (ZnTiO3) and
32
titanium dioxide (TiO2). At higher Zn/Ti ratios, the main phases were cubic ZnTiO3 and
cubic Zn2TiO4. The maximum dehydrogenation activity occurred for a Zn/Ti ratio close
to 2, whose stoichiometry corresponds to the cubic phase Zn2TiO4.
Similarly, sulfided nickel has shown some promising characteristics in the
dehydrogenation of isobutane.45,46 Unlike Pt, unpromoted Ni is very unselective for
dehydrogenation reactions. However, even at low dosages S binds very strongly to the
surface of Ni and forms stable surface sulfides. When the sulfur concentration is high
enough, the typically high hydrogenolysis activity of Ni is eliminated and
dehydrogenation selectivity can be very high. One of the interesting characteristics of
these catalysts is that not only the dehydrogenation rate exhibits a zeroth-order
dependence with hydrogen, but also the rate of deactivation is much less affected by
hydrogen than most typical Pt-based catalysts. This difference is probably due to a much
weaker interaction of H2 with the sulfided nickel surface than with typical Pt catalysts.
3.4. Removal of hydrogen to shift equilibrium conversion
The dehydrogenation of lower alkane is in most cases limited by thermodynamic
equilibrium. Several approaches have been used to remove part of the hydrogen
produced during the reaction from the reacting mixture, thus shifting the equilibrium
conversions to higher values. The most promising approaches involve the use of
membrane reactors and the addition of hydrogen acceptor materials. For the selective
permeation of hydrogen, both inorganic membranes and non-porous Pd membranes have
been used in most investigations. Palladium membranes are particularly effective
because they only allow the hydrogen diffusion through the membrane due to the high
33
solubility of dissociated hydrogen in the Pd bulk. The addition of Ag improves the
mechanical properties of the membrane, reducing brittleness and modifies the hydrogen
solubility, with an optimal performance at about 23 % Ag. A typical membrane reactor
configuration47 employed in the dehydrogenation of lower alkanes is illustrated in Fig.
17. The dehydrogenation catalyst is placed inside the membrane tube. Part of the
hydrogen produced by the reaction diffuses out of the reaction zone and it is swept away
by a high flow of purge gas that passes by the shell side of the tube. Recent advances in
inorganic membranes are opening interesting possibilities to employ these materials in
dehydrogenation reactors. For example, combinations of mesoporous Al2O3 membranes
and microporous silicalite-alumina membranes prepared by hydrothermal synthesis of the
silicalite in the host material have been tested with promising results in dehydrogenation
reactions. Differences in the permeabilities of hydrogen and the hydrocarbons through
these materials are large enough to produce a high permselectivity and dramatic enhances
in dehydrogenation conversion.
The second interesting alternative is to conduct the dehydrogenation reaction in
the presence of hydrogen acceptor materials. For example, the conversion of isobutane to
isobutylene was found to double its equilibrium value in the presence of an intermetallic
compound, Zr2Fe, which is able to form a stable hydride, Zr2FeH2.6. An interesting
demonstration of the effect was conducted at 470°C with a chromia-alumina catalyst.48
In the presence of Zr2Fe, the initial isobutylene yield was 45 %, which almost doubles the
25 % equilibrium conversion that would be obtained if hydrogen remained in the gas
phase. However, after the intermetallic compound was converted into the hydride form,
the isobutane conversion dropped to about 20 %.
34
4. OTHER DEHYDROGENATION REACTIONS
4.1. Dehydrogenation of C6-C19 normal alkanes:
Alkylsulfonate are widely used in industry for the manufacture of detergents and
emulsifiers. Dehydrogenation plays an important part in the production of
alkylsulfonates, since normal alkanes are an available feedstock, which can be
dehydrogenated to the corresponding mono-olefins. In a subsequent alkylation step, the
mono-olefins react with aromatics to produce alkylbenzenes, which are finally
sulfonated. The typical dehydrogenation of C6-C19 normal alkanes is carried out on Pt-
based catalysts at temperatures around 450-520°C. Most of the concepts discussed above
for the dehydrogenation of propane and isobutane can be applied for these catalysts. The
typical catalyst is Pt supported on alumina, which is promoted with alkali (e.g., Li) to
neutralize the acid sites and to improve selectivity and catalyst life. As discussed above,
the main cause of catalyst deactivation is coke formation, and one way to extend the life
of the catalyst is to co-feed hydrogen at high hydrogen/hydrocarbon ratios. As in the case
of lower alkane dehydrogenation the use of promoters such as Sn or In greatly improve
the catalyst performance. As opposed to the case of lower alkane dehydrogenation,
where side reactions play a minor role, when using higher alkanes, the formation of side
products such as aromatics is not uncommon. Therefore, the reaction is operated at low
conversions (e.g., lower than 15 %). As a result, the post-reaction separation process
plays a very important role. After the dehydrogenation reactor, hydrogen and light
alkanes are first separated while the olefins and unreacted alkanes are sent to the
35
alkylation unit, where the olefins react with benzene to yield the alkylbenzene. After this
unit, the unreacted alkanes are recycled to the dehydrogenation reactor.
4.2. Dehydrogenation of Ethylbenzene to Styrene:
Styrene is a major commodity used in the manufacture of plastics, synthetic
rubber, resins, and insulators. The principal form of styrene production is the direct
dehydrogenation of ethylbenzene, which can be accomplished at around 600-630°C on
iron oxide catalysts promoted with various oxides. This process is normally carried out
either isothermally or adiabatically in the presence of a large excess of steam, which has
several benefits in the reaction. First of all, as shown in section 2 (see Fig. 1), the
presence of an inert moves the equilibrium toward higher conversions. Second, the
addition of steam supplies the heat required by the endothermic reaction. Finally, the
presence of steam at high temperatures helps to inhibit the formation of coke on the
catalyst surface.
Among the most common promoters added to iron oxide, the alkali oxides have
the most noticeable effects on catalytic activity and selectivity. As illustrated in Table
4,49 the addition of K in the form of K2CO3 causes an increase in activity of about an
order of magnitude over the activity of unpromoted Fe2O3. This promoting effect reaches
a maximum at about 20 wt % K2CO3, at higher K concentrations the overall conversion
starts decreasing, while the selectivity to styrene slightly increases. The selectivity is
typically high. In addition to the main dehydrogenation reaction, some side reactions
occur. The most common side reactions are cracking to benzene and ethylene or
hydrogenolysis to toluene and methane, and coke formation.
36
Although several species co-exist in the K-promoted catalysts under reaction
conditions, the most active phase is believed to be KFeO2. This phase forms from the
interaction of a highly dispersed F3O4, mixed with Fe2O3, and K2Fe22O34, which acts as a
K source.50 The active KFeO2 phase can be found on the edges of hexagonal platelets
consisting of a solid solution of F3O4/K2Fe22O34. However, this phase is unstable at
ambient conditions, so it is only detected by “in-situ” characterization techniques.51
Several forms of catalyst deactivation have been identified for this type of catalysts under
ethylbenzene dehydrogenation.52 The first one is the common coke deposition, typical of
all the dehydrogenation catalyst. The second type is more unique to this type of catalysts
and it is due to the blocking of sites by the CO2 produced from the reaction of steam with
the carbon deposits. These two forms of deactivation are considered reversible because
both, coke and adsorbed CO2, can be eliminated by the same steaming treatment.
However, in addition to this reversible deactivation, other irreversible phenomena occur
in these catalysts. The most important one is the loss of K from the active phase, KFeO2.
This reaction may occur by hydrolysis (with steam) or by direct reduction (with H2),
which results in the generation of KOH. In this form, K can migrate and becomes
segregated from the Fe-containing phases. Under industrial conditions, this irreversible
process occurs very slowly, and as a result the catalyst life can be of extended to up to
two years. To stabilize the active KFeO2 phase other promoters, such as Cr and Ce, have
been used, retarding the deactivation process.
37
References
1. D. B. Kang, A. B. Anderson, J. Amer. Chem. Soc., 107, 7858 (1985) 2. C. Andrews, Ground Water 36, 705 (1998) 3. J. Cosyns, J. Chodorge,D. Commereuc, B. Torck, Hydrocarb. Proc. 77, Mar.
1998 4. D. E. Resasco and G. L. Haller, in Catalysis, Royal Society of Chemistry, Vol. 11,
379 5. F. Buonomo, D. Sanfilippo, and F. Trifiro, in Handbook of Catalysis, 6. M. P. Atkins, G. R. Evans, Erdol, Erdgas, Kohle 111, 271 (1995) 7. P. Biloen, J. N. Helle, H. Verbeek, F. M. Dautzenberg, and W. M. H. Sachtler, J.
Catal. 63, 112 (1980) 8. Y. Soma-Noto and W. M. H. Sachtler, J. Catal. 32, 315 (1974) 9. L. C. Loc, N. A. Gaidai, and S. L. Kiperman, in “Proc. IX International Congr.
Catal.”, Calgari, Canada, Vol. 3, p. 1261 (1988) 10. F. C. Wilhelm, U.S. Patent 3,909,451 (1974) 11. T. Imai and C. W. Hung, U.S. Patent 4,866,211 (1989) 12. R. D. Cortright, E. Bergene, P. Levin, M. Natal-Santiago, and J. A. Dumesic,
Stud. Surf. Sci. Catal. 101, 1185 (1996) 13. L. K. Lok, N. A. Gaidai, B. S. Gudkov, S. L. Kiperman, S. B. Kogan, Kinet.
Katal. 27, 1365 (1986) 14. R. D. Cortright, P. Levin, and J. A. Dumesic, Ind. Eng. Chem. Res. 37, 1717,
(1998) 15. R. D. Cortright, and J. A. Dumesic, J. Catal., 157, 576 (1995) 16. G. T. Baronetti, S. R. de Miguel, O. A. Scelza, A. A. Castro, Appl. Catal. 24, 109
(1986) 17. S. R. De Miguel, G. T. Baronetti, A. A. Castro, and O. A. Scelza, Appl. Catal., 45,
61 (1988). 18. J. Margifalvi, M. Hegedus, S. Gobolos, E. Kern-Talas, P. Szedlacsek, S. Szabo, F.
Nagy, in "Proceedings, 8th Inter, Cong. Catal., Berlin, 1984," Vol. IV, p. 903. Dechema, Frankfurt-am-Main, 1984.
19. G. J. Siri, M. L. Casella, G. F. Santori, and O. A. Ferretti, Ind. Eng. Chem., 36, 4821 (1997)
20. R. D. Cortright, and J. A. Dumesic, Appl. Catal. A, 129, 101 (1995) 21. A. H. Haner, P. N. Ross, U. Bardi, and A. Atrei, J. Vac. Sci. Tech., 10, 2719
(1992) 22 S. M. Stagg, C. A. Querini, W. E. Alvarez, and D. E. Resasco, J. Catal. 168, 75
(1997) 23. H. Verbeek, and W. M. H. Sachtler, J. Catal., 42, 257 (1976) 24. R. D. Cortright, and J. A. Dumesic, J. Catal. 148, 771 (1994) 25. D. Rajeshwer, A. G. Basrur, D. T. Gokak, and K. R. Krishnamurthy, J. Catal. 150,
135 (1994) 26. O. A. Barias, A. Holmen, E. A. Blekkan, Catalysis Today, 24, 361 (1995) 27. T. B. Massalski, Ed. in “Binary alloy phase diagrams”; ASTM. Philadelphia,
1986
38
28. A. Borgna, S. M. Stagg, and D. E. Resasco, J. Phys. Chem. 102, 5077 (1998) 29. Y-X. Li, K. L. Klabunde, and B. H. Davis, J. Catal. 128, 1 (1991) 30. Y. Zhou and S. M. Davis, Catal. Lett. 15, 51 (1992) 31 J. H. Sinfelt, Adv. Catal. 23, 91 (1973) 32 . P. N. Ross, J. Vac. Sci. Tech., 10, 2546 (1992) 33. J. Shen, J. M. Hill, R. M. Watwe, B. E. Spiewak, and J. A. Dumesic, J. Phys.
Chem. B, 103, 3923 (1999) 34. F. Buonomo, D. Sanfilippo, and F. Trifirò, in “Handbook of Catalysis”, p. 2140
(1998) 35 L. Lin, T. Zao, J. Zang, and Z. Xu, Appl. Catal. 67, 11 (1990) 36. T. P. Chojnacki,., and L. D. Schmidt, J Catal., 129, 473 (1991) 37. A. El Abed, S. El Qebbaj, M. Guerin, C. Kappenstein, M. Saouabe, and P.
Marecot, J. Chim. Phys. 92, 1307 (1995) 38. G. J. Arteaga, J. A. Anderson, C. H. Rochester, J. Catal. 184, 268 (1999) 39. G. J. Antos, U.S. Patent 4,216,346 (1980) 40. R. O. Dunn, G. F. Schuette, F. M. Brinkmeyer, W. Sund, Proc. De Witt
Petrochem. Review, 1992, 1 41. K. K. Kearby, in “Catalysis” (P. H. Emmet, editor) Reinhold, New York, Vol. 3
p. 453 (1955) 42. F. Cavani, M. Koutyrev, F. Trifiro, A. Bartolini, D. Ghisletti, R. Iezzi, A.
Santucci, and G. del Piero, J. Catal. 158, 236 (1996) 43. A. W. Aldag and B. Okla, U. S. Patent 4,524,144 (1985) 44. Z. X. Chen, A. Derkng, W. Koot, and M. P. van Dijk, J. Catal. 161, 730 (1996) 45 D. E. Resasco, B. K. Marcus, C. S. Huang and V. A. Durante, J. Catal. 146, 40
(1994) 46. D. E. Resasco, B. K. Marcus, C-S. Huang, and V. A. Durante, US Patent
5,468,710 (1995) 47. N. Itoh, AIChE Journal 33, 1577 (1987) 48. V. V. Lunin and O. V. Chetina, Neftekhimiya, 30, 202, 1990 49. T. Hirano, Appl. Catal. 26, 65 (1986) 50. M. Muhler, R. Schlögl, and G. Ertl, J. Catal. 138, 413 (1992) 51. M. Muhler, J. Schütze, M. Wesemann, T. Rayment, A. Dent, R. Schlögl, and G.
Ertl, J. Catal. 126, 339 (1990) 52. K. Kochloefl, , in “Handbook of Catalysis”, p. 2151 (1998)
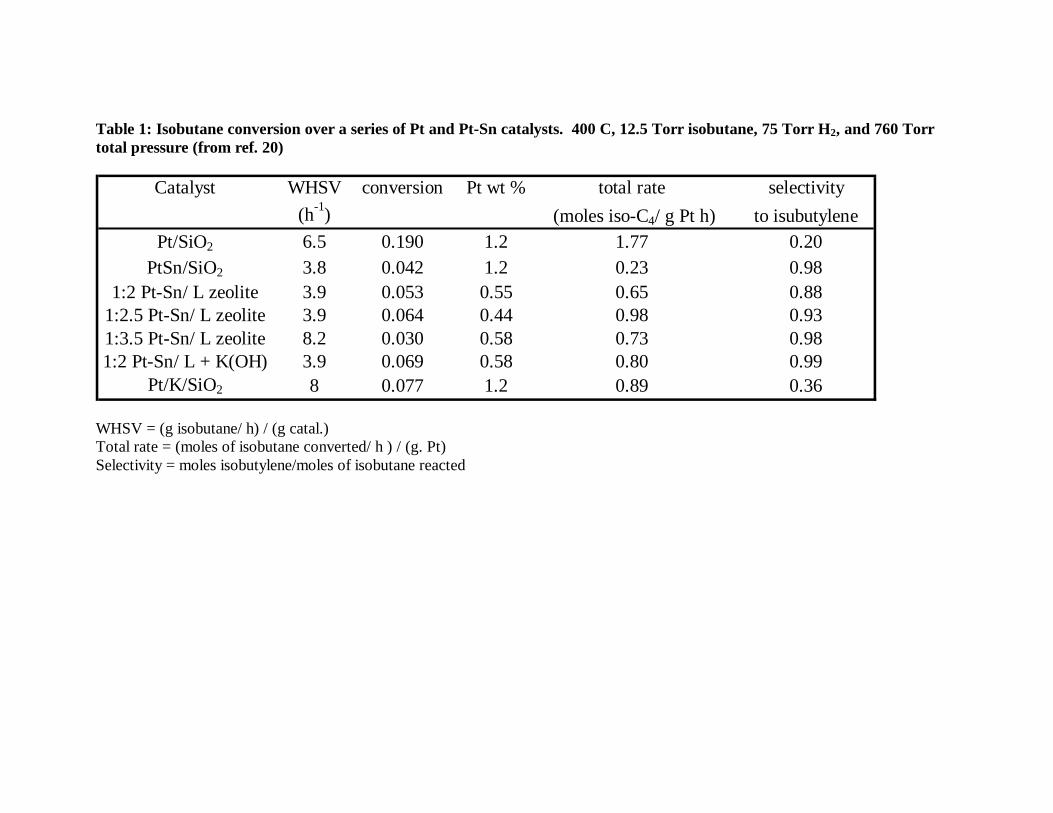
Table 1: Isobutane conversion over a series of Pt and Pt-Sn catalysts. 400 C, 12.5 Torr isobutane, 75 Torr H2, and 760 Torr total pressure (from ref. 20)
Catalyst WHSV conversion Pt wt % total rate selectivity(h-1) (moles iso-C4/ g Pt h) to isubutylene
Pt/SiO2 6.5 0.190 1.2 1.77 0.20PtSn/SiO2 3.8 0.042 1.2 0.23 0.98
1:2 Pt-Sn/ L zeolite 3.9 0.053 0.55 0.65 0.881:2.5 Pt-Sn/ L zeolite 3.9 0.064 0.44 0.98 0.931:3.5 Pt-Sn/ L zeolite 8.2 0.030 0.58 0.73 0.981:2 Pt-Sn/ L + K(OH) 3.9 0.069 0.58 0.80 0.99
Pt/K/SiO2 8 0.077 1.2 0.89 0.36 WHSV = (g isobutane/ h) / (g catal.) Total rate = (moles of isobutane converted/ h ) / (g. Pt) Selectivity = moles isobutylene/moles of isobutane reacted
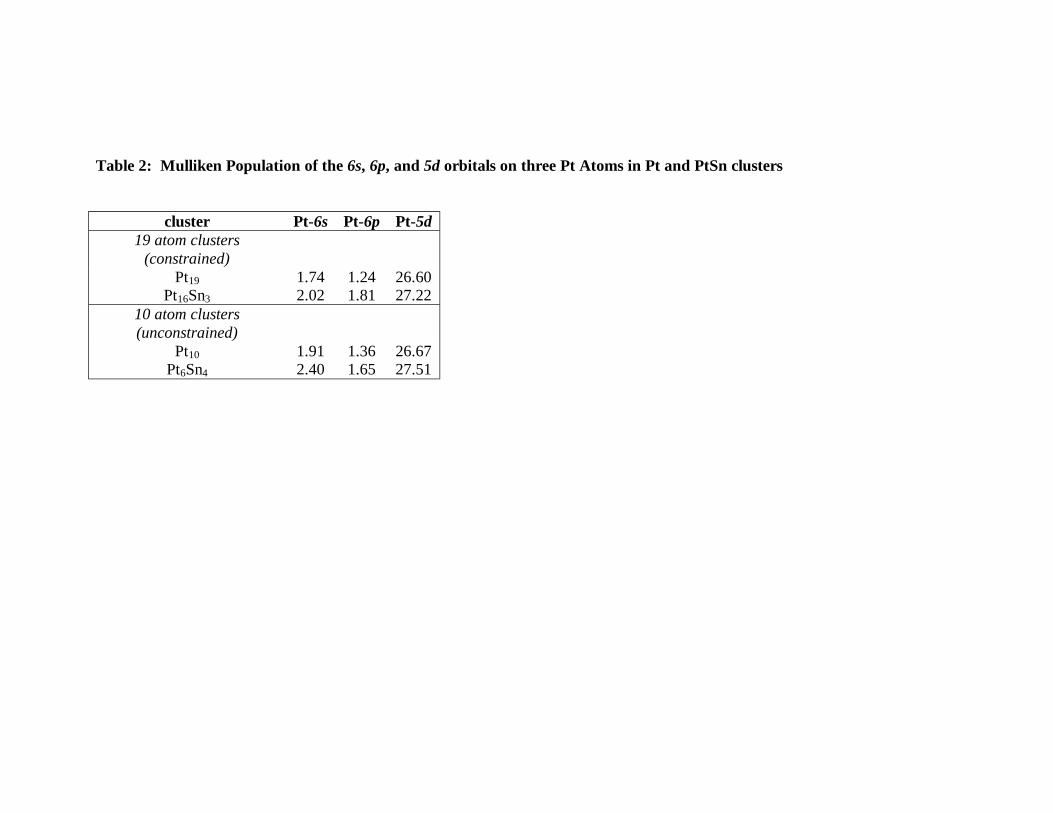
Table 2: Mulliken Population of the 6s, 6p, and 5d orbitals on three Pt Atoms in Pt and PtSn clusters
cluster Pt-6s Pt-6p Pt-5d
19 atom clusters (constrained)
Pt19 1.74 1.24 26.60 Pt16Sn3 2.02 1.81 27.22
10 atom clusters (unconstrained)
Pt10 1.91 1.36 26.67 Pt6Sn4 2.40 1.65 27.51
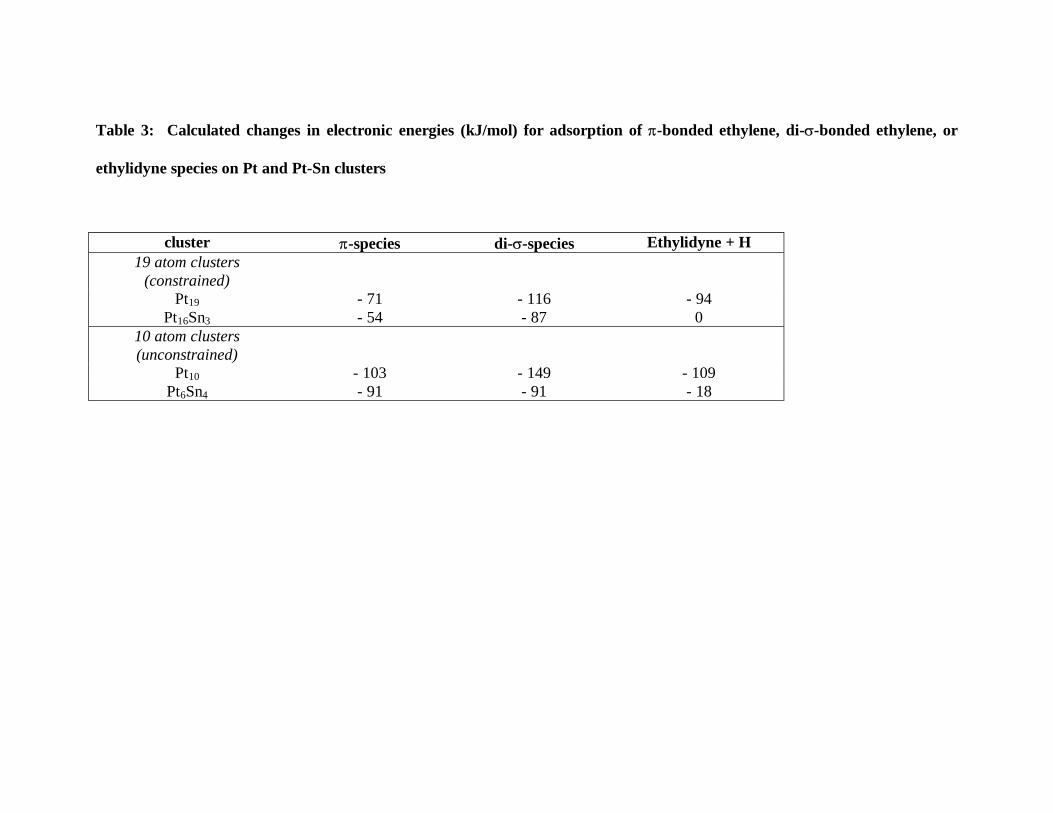
Table 3: Calculated changes in electronic energies (kJ/mol) for adsorption of π-bonded ethylene, di-σ-bonded ethylene, or
ethylidyne species on Pt and Pt-Sn clusters
cluster π-species di-σ-species Ethylidyne + H 19 atom clusters
(constrained)
Pt19 - 71 - 116 - 94 Pt16Sn3 - 54 - 87 0
10 atom clusters (unconstrained)
Pt10 - 103 - 149 - 109 Pt6Sn4 - 91 - 91 - 18
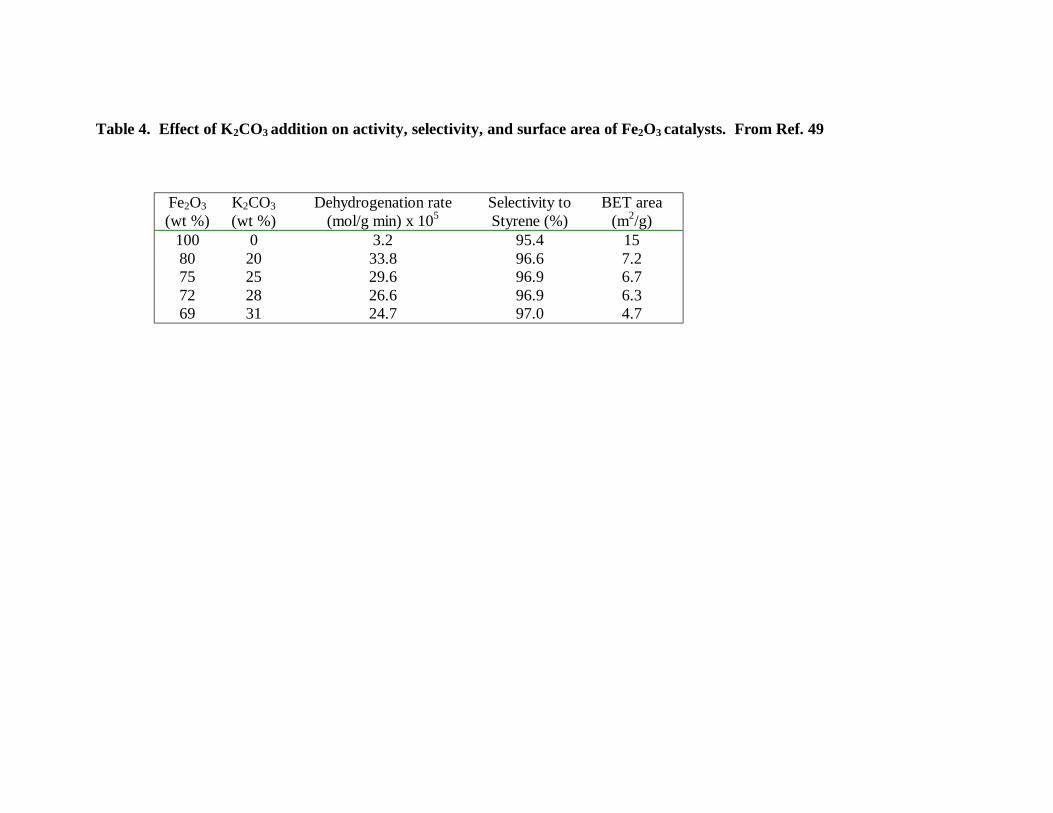
Table 4. Effect of K2CO3 addition on activity, selectivity, and surface area of Fe2O3 catalysts. From Ref. 49
Fe2O3 (wt %)
K2CO3 (wt %)
Dehydrogenation rate (mol/g min) x 105
Selectivity to Styrene (%)
BET area (m2/g)
100 0 3.2 95.4 15 80 20 33.8 96.6 7.2 75 25 29.6 96.9 6.7 72 28 26.6 96.9 6.3 69 31 24.7 97.0 4.7
0
20
40
60
80
600 650 700 750 800 850 900
TEMPERATURE (K)
EQUI
LIBR
IUM
CO
NVER
SIO
N (%
)
h=3
h=1
i=3
h,i=0
0 50 100 150 200 250 300 350
TEMPERATURE (C)
HYD
RO
GEN
CO
NSU
MPT
ION
(a.u
.)
Pt x 2
Pt-Sn
15
20
25
30
35
0 20 40 60 80 100 120
TIME (min)
% C
ON
VER
SIO
N
Pt
Pt-Sn
75
80
85
90
95
100
0 20 40 60 80 100 120
TIME (min)
% S
ELEC
TIVI
TYPt-Sn
Pt
-15 0 15 30 45
RELATIVE ENERGY [ E - Eo ] (eV)
AB
SOR
PTIO
N C
OEF
FIC
IEN
T (a
.u.)
130013501400145015001550Wavenumber (cm-1)
Abs
orba
nce
27ºC
- 70ºC
- 70ºC
27ºC
Pt-Sn
Pt
Pt-Sn
Pt
ab
c
1 2 3 4R/Å
Four
ier T
rans
form
(a.u
.)
PtSn
Pt cluster
Pt + PtSn
0
50
100
150
200
1 2 3 4R/Å
Four
ier t
rans
form
(a.u
.)
0 100 200 300 400 500 600TEMPERATURE (C)
HYD
RO
GEN
CO
NSU
MPT
ION
Fresh
REG500
125 C
240 C
146 C
186 C


