130
Delaware Public Employees’ Retirement System — A component unit of the State of Delaware Forty-Seventh Comprehensive Annual Financial Report 2018
DelawarePublic
Employees’Retirement
System— A component unit of the State of Delaware
Forty-SeventhComprehensiveAnnual FinancialReport 2018

Mailing Address:McArdle Building, Suite #1860 Silver Lake BoulevardDover, Delaware 19904-2402
Telephone:(800) 722-7300
E-Mail Address: [email protected]
WebSite: www.delawarepensions.com

Forty-SeventhComprehensive
Annual FinancialReport
DelawarePublicEmployees’Retirement System— A component unit of the State of Delaware 2018
Presented by the DPERS Board of PensionTrustees and Prepared by the Office of
Pensions Fiscal Year Ended June 30, 2018
- State Employees’ Pension Plan
- Special Fund
- New State Police Pension Plan
- Judiciary Pension Plans
- County & Municipal Policeand Firefighters’ Plans
- County & Municipal OtherEmployees’ Pension Plan
- Closed State Police Pension Plan
- Diamond State PortCorporation Pension Plan
- Delaware VolunteerFiremen’s Fund
- County & Municipal Policeand Firefighters’ COLA Fund
- Post-RetirementIncrease Fund
- Delaware Local GovernmentRetirement Investment Pool

Table Of C
on
tents
Introductory SectionCertificate of Achievement for Excellence in Financial Reporting. . . . . . . . . . . . . . . . . . . . . . . . . . . . . . . . 04Letter of Transmittal . . . . . . . . . . . . . . . . . . . . . . . . . . . . . . . 05Board of Trustees and List of Consultants . . . . . . . . . . . . . . . . 11Organizational Chart . . . . . . . . . . . . . . . . . . . . . . . . . . . . . . . . 12Highlights of Board Activities. . . . . . . . . . . . . . . . . . . . . . . . . . 13PPCC Public Pension Standards Award . . . . . . . . . . . . . . . . . . 152018 Legislation Affecting Pensions. . . . . . . . . . . . . . . . . . . . . 16
Financial SectionIndependent Auditor’s Report . . . . . . . . . . . . . . . . . . . . . . . . . 18Management’s Discussion and Analysis . . . . . . . . . . . . . . . . . . 20
Basic Financial Statements:Combining Statement of Fiduciary Net Position . . . . . . . . . . 24Combining Statement of Changes in Fiduciary Net Position . 26Notes to Financial Statements(an integral part of the Basic Financial Statements) . . . . . . 28
Required Supplementary Information:Schedule 1 - Changes in Net Pension Liability . . . . . . . . . . . 51Schedule 2 - Net Pension Liability . . . . . . . . . . . . . . . . . . . . 60Schedule 3 - Employer Contributions . . . . . . . . . . . . . . . . . 61Schedule 4 - Investment Returns . . . . . . . . . . . . . . . . . . . . 63Notes to Required Supplementary Information . . . . . . . . . . 64
Supporting Schedules:Schedule 5 - Administrative Expenses . . . . . . . . . . . . . . . . . 66Schedule 6 - Investment Expenses . . . . . . . . . . . . . . . . . . . 67Schedules for Delaware Local Government RetirementInvestment Pool . . . . . . . . . . . . . . . . . . . . . . . . . . . . . . . . . 68Independent Auditor’s Report on Internal Control . . . . . . . 70
Investment SectionTen-Year Investment Comparison . . . . . . . . . . . . . . . . . . . . . . 74Letter from Investment Committee Chair . . . . . . . . . . . . . . . . . 75Investment Activity. . . . . . . . . . . . . . . . . . . . . . . . . . . . . . . . . . 77Fifteen-Year Total Investment Rates of Return . . . . . . . . . . . . . 79Comparative Investment Results . . . . . . . . . . . . . . . . . . . . . . . 80Five- and Ten-Year System Performance . . . . . . . . . . . . . . . . . 81List of Largest Assets Held . . . . . . . . . . . . . . . . . . . . . . . . . . . . 82Asset Allocation. . . . . . . . . . . . . . . . . . . . . . . . . . . . . . . . . . . . 83Investment Managers . . . . . . . . . . . . . . . . . . . . . . . . . . . . . . . 84Investment Summary and Schedule of Investment Fees . . . . . . 85Glossary . . . . . . . . . . . . . . . . . . . . . . . . . . . . . . . . . . . . . . . . . 85Schedule of Broker Commissions . . . . . . . . . . . . . . . . . . . . . . 86Annual Market Value of Fund and Rate of Return . . . . . . . . . . 87
Actuarial SectionActuary’s Opinion . . . . . . . . . . . . . . . . . . . . . . . . . . . . . . . . . . 90Summary of Actuarial Assumptions & Methods . . . . . . . . . . . . 92Mortality Table . . . . . . . . . . . . . . . . . . . . . . . . . . . . . . . . . . . . 93Summary of Plan Provisions and Changes in Plan Provisions. . 93Schedule of Active Member Valuation Data . . . . . . . . . . . . . . . 94Schedule of Retirants and Beneficiaries Added to and Removed from Rolls . . . . . . . . . . . . . . . . . . . . . . 96Solvency Test . . . . . . . . . . . . . . . . . . . . . . . . . . . . . . . . . . . . . 100Analysis of Financial Experience . . . . . . . . . . . . . . . . . . . . . . 103
Statistical SectionAbout the Statistical Section . . . . . . . . . . . . . . . . . . . . . . . . . 106Principal Participating Employersin Multiple-Employer Plans . . . . . . . . . . . . . . . . . . . . . . . . . . 107Schedule of Additions by Source . . . . . . . . . . . . . . . . . . . . . . 108Schedule of Deductions by Type . . . . . . . . . . . . . . . . . . . . . . 109Schedule of Benefit Deductions by Type . . . . . . . . . . . . . . . . 116Schedule of Retired Members by Type of Benefit by Plan. . . . 118Schedule of Average Benefit Payments by Plan. . . . . . . . . . . . 120Total Benefit Payments Chart . . . . . . . . . . . . . . . . . . . . . . . . . 124Total Membership Chart . . . . . . . . . . . . . . . . . . . . . . . . . . . . 124Schedule of Participating Employers . . . . . . . . . . . . . . . . . . . 125
DPERS 47th Comprehensive Annual Financial Report2

DelawarePublic
Employees’Retirement
System— A component unit of the State of Delaware
Forty-Seventh ComprehensiveAnnual Financial Report
Presented by the DPERS Board of Pension TrusteesFor the Fiscal Year Ended June 30
2018
INTRODUCTORYSECTION

Presented to
Delaware Public Employees’
Retirement System
For its Comprehensive AnnualFinancial Report
for the Fiscal Year Ended
June 30, 2017
Executive Director/CEO
Certificate of Achievementfor Excellence
in Financial Reporting
Intr
od
uc
tor
ySec
tion
DPERS 47th Comprehensive Annual Financial Report4

Intr
od
uc
tor
y Sectio
nIn
tro
du
cto
ry Sec
tion
STATE OF DELAWARESTATE BOARD OF PENSION TRUSTEES
ANDOFFICE OF PENSIONSMcArdle Building, Suite #1
860 Silver Lake Blvd.Dover, DE 19904-2402
When Calling Long Distance Telephone (302) 739-4208Toll Free Number 1-800-722-7300 Fax (302) 739-6129E-Mail: [email protected] www.delawarepensions.com
November 21, 2018
The Honorable John Carneyand
Members of the 149thGeneral Assembly
Dear Governor and Members of the General Assembly:
The Board of Pension Trustees for the Delaware Public Employees’ Retirement System (DPERS or theSystem) is proud to present its 47th Comprehensive Annual Financial Report for the Fiscal Year endedJune 30, 2018.
This report provides information on nine plans [State Employees’, Special Fund, New State Police,Judiciary, County & Municipal Police and Firefighters’, County & Municipal Other Employees’,Delaware Volunteer Firemen’s Fund, Diamond State Port Corporation, and Closed State Police] plusthree commingled investment funds [County & Municipal Police and Firefighters’ COLA (COLA Fund),Post-Retirement Increase (PRI) and Delaware Local Government Retirement Investment Pool(DELRIP)]. Responsibility for both the accuracy of the data and the completeness and fairness ofpresentation rests with the State Board of Pension Trustees (Board). To the best of our knowledge andbelief, the enclosed data are accurate in all material respects and present fairly the System’s financialposition and operational results for the Fiscal Year ended June 30, 2018.
The Fund’s time-weighted return in Fiscal Year 2018 was 10.6% which was 3.6% above thepolicy benchmark of 7.0%, driven by positive returns for many sectors of the market. In fiscal2018, the Fund’s 10.6% return compares with the 14.4% return of the S&P 500 stock index, the7.3% return of the MSCI All-Country World ex-USA Index, the (0.1)% return of the BarclaysAggregate bond index, and the Delaware Benchmark of 7.0%.
Intr
od
uc
tor
ySec
tion
DPERS 47th Comprehensive Annual Financial Report 5
The System’s longer-term results have been achieved with lower observed return volatility than themedian for the universe, reflecting the System’s long standing focus on risk management. The Board,along with its Investment Committee and staff, will continue to actively monitor and proactivelymanage the System in a manner fully consistent with its fiduciary duty to the System's beneficiaries.
The Management’s Discussion and Analysis (MD&A), located in the Financial Section of this report,provides a narrative introduction, overview, and analysis to accompany the basic financial statements.This Letter of Transmittal is designed to complement the MD&A and should be read in conjunctionwith it. The MD&A can be found immediately following the report of the independent auditors.
The System was established on June 11, 1970, with the incorporation of the State Employees’, Judiciary,Closed State Police, and Retired & Disabled Teachers Pension Plans. The State Employees’ and theJudiciary Plans were changed to actuarial reserve funding shortly thereafter. The Closed State PolicePension Plan remains a pay-as-you-go plan. Fiscal Year 1994 was the last year the Retired & DisabledTeachers’ Pension Plan had members entitled to benefits.
When calendar year 1971 ended, the four pension plans totaled $14.7 million in assets with 2,766pensioners. The State’s contribution was 13.1% of payroll. At the end of Fiscal Year 2018, monies fromthe nine plans and two pension commingled investment funds totaled $10.1 billion. The State’scontribution rate for the State Employees’ Plan for Fiscal Year 2018 was 10.4% of payroll. Employerrates in the other plans that the Board administers range from 7.1% to 21.2% of covered payroll. Benefitcoverage varies by plan as shown on pages 30-33. The majority of beneficiaries’ pension benefits arewell funded, with a majority of the System’s total membership covered by plans with a funded ratiogreater than or equal to 87.5%. The net pension liability of each plan is detailed on page 60.
Governmental Accounting Standards Board (GASB) Accounting
DPERS follows the provision of GASB Statement 67, which replaced those of Statement 25, FinancialReporting for Defined Benefit Pension Plans and Note Disclosures for Defined Contribution Plans,and Statement 50, Pension Disclosures. These provisions affect the financial reporting primarilythrough enhanced note disclosures and schedules of required supplemental information. Thesestatements do not affect the funding requirements for the defined benefit plans, which continue to becalculated based on annual actuarial valuations in conformity with generally accepted actuarialprinciples and practices with the Actuarial Standards of Practice issued by the Actuarial StandardsBoard and applicable statutes.
DPERS provided information to participating employers on GASB Statement 68 for the year endedJune 30, 2017. Statement 68 amends GASB Statement 27, Accounting for Pensions by State and LocalGovernment Employers, by requiring the System to determine and allocate the net pension liability(asset), pension expense, and pension deferred outflows of resources and deferred inflows ofresources attributable to each employer in the pension plans. The employers will report these amountson their respective financial statements for the year ended June 30, 2018.
The Honorable John Carneyand
Members of the 149th General AssemblyPage 2November 21, 2018
Intr
od
uc
tor
ySec
tion
DPERS 47th Comprehensive Annual Financial Report6

Major Accomplishments
Best Practices – The Board, with the help of its legal counsel and various Committee members,continued its “Best Practices Review” during Fiscal Year 2018. Now in its fourteenth year, the processprovides the benefit of annually comparing reviews of the System’s operations and efficiency withsimilar public pension funds. Those reviews assist the System in identifying future initiatives. The Boardpromoted Trustee training opportunities including presentations by the founder of a highly successfulprivate equity firm, the System’s independent auditors, Chief Security Officer for the State's Departmentof Technology about cyber security and the investment advisor. Following recommendations from abest practice review conducted in a prior year by a third party consultant, the Board established anInternal Audit function during Fiscal Year 2018 and hired a director to oversee this function. In addition,with the help of outside legal counsel, the Board continued its review of the structure of the System andeach of its nine plans as established in the Delaware Code for compliance with the Internal RevenueCode and its rules, regulations, and interpretive opinions. See the Tax Status update in Note 8 to thefinancial statements on page 50 for more details.
GFOA Certificate of Achievement – The Government Finance Officers Association of the United Statesand Canada (GFOA) awarded a Certificate of Achievement for Excellence in Financial Reporting toDPERS for its comprehensive annual financial report (CAFR) for the Fiscal Year ended June 30, 2017.In order to be awarded a Certificate of Achievement, a government unit must publish an easilyreadable and efficiently organized comprehensive annual financial report. This report must satisfyboth generally accepted accounting principles and applicable legal requirements. A Certificate ofAchievement is valid for a period of one year only. This is the twenty-second consecutive year thatDPERS has received a Certificate of Achievement. DPERS believes that its current comprehensiveannual financial report continues to meet the Certificate of Achievement Program’s requirements, andwe will submit the Fiscal Year 2018 CAFR to the GFOA to determine its eligibility for another certificateof achievement.
Public Pension Coordinating Council Award – The Public Pension Coordinating Council (PPCC)granted the System the Public Pension Standards Award for 2017. This is the fifteenth consecutive yearthe award has been received. The PPCC is a coalition of National Association of State RetirementAdministrators (NASRA), National Council on Teacher Retirement (NCTR), and National Conferenceon Public Employee Retirement Systems (NCPERS). The major PPCC goal is to promote excellence inplan design and administration among state and local public retirement systems. The Public PensionStandards are intended to reflect minimum expectations for public retirement system managementand administration and serve as a benchmark by which all defined benefit public plans should bemeasured. Public Pension Standards include: comprehensive benefit programs, funding adequacy,receipt of GFOA award in current year, independent actuarial valuation, independent audit reviewresulting in an unqualified opinion from the auditor, independent investment performance evaluation,adoption of written fiduciary standards by Board and Investment Committee, and communicationswith membership.
The Honorable John Carneyand
Members of the 149th General AssemblyPage 3November 21, 2018
Intr
od
uc
tor
ySec
tion
DPERS 47th Comprehensive Annual Financial Report 7

Investments and Economic Climate
The System’s investment activity is governed by the “prudent person rule,” a fiduciary standard whichapplies to anyone with System authority. Fiduciaries must discharge their duties solely in the interestsof System participants and beneficiaries and with the degree of diligence, care and skill which prudentpeople would ordinarily exercise under similar circumstances.
The System continues to manage its investments by focusing on risk control and diversification. Fora further discussion of portfolio diversification and investment strategy, see the Investment Sectionbeginning on page 73 of this report.
The System's investments were positioned to benefit from market gains with an over-weightedexposure to public and private equities while under weighted in fixed income, where holdings weremore focused on credit. Equity allocation and manager changes during the year had the net impactof profit-taking in domestic equity, shifts to take advantage of relative value opportunities elsewherein the world, and an increase in the Fund's liquidity position.
The Board’s investment policy is summarized on pages 43-44. Investment objectives are outlined inthe investment policy established by the Board, including the appropriate degree of risk. Investmentmanagers are hired to execute the investment policy and have discretion for investment decisionswithin statutory authority, Board policy, and their respective guidelines. A list of the investmentmanagers under contract with the System as of June 30, 2018, may be found on page 84 of this report.A summary of the total System’s asset allocation can be found on page 83.
The System’s investments had a 10.6% time-weighted return in Fiscal Year 2018. The System’sannualized total returns for the last five, ten, and fifteen years are 8.2%, 7.3% and 8.3%, respectively.Relative to other large public pension funds, the System’s performance ranks in the top quartile of theTrust Universe Comparison Service (TUCS) universe for the ten-year period ended June 30, 2018.
Funding Status
A pension plan is well funded when it has sufficient assets invested to meet all expected futureobligations to participants. The greater the level of funding, the larger the ratio of assets to the netpension liability. Seven of the plans/funds included in the System – the State Employees’, New StatePolice, Judiciary, County & Municipal Police & Firefighters’ Plan, County & Municipal OtherEmployees’ Plan, Diamond State Port Corporation, and Special Fund – have funded ratios greater thanor equal to 87.5% of the net pension liability. The Delaware Volunteer Firemen’s plan is making annualcontributions at the actuarially determined rate to reach full funding and the Closed State PolicePension Plan remains a pay-as-you-go plan.
The Honorable John Carneyand
Members of the 149th General AssemblyPage 4November 21, 2018
Intr
od
uc
tor
ySec
tion
DPERS 47th Comprehensive Annual Financial Report8

Internal Controls
System internal accounting controls are designed to reasonably assure the safekeeping of assets andthe reliability of financial reporting. The concept of reasonable assurance recognizes that first, thecost of a control should not exceed the benefits likely to be derived and second, the valuation of costsand benefits requires estimates and judgments by management. Control procedures andresponsibilities are well documented both in writing and with graphic flowcharts. These are reviewedand updated annually. The Audit Committee, a committee appointed by the Board, monitorsoperations and controls throughout the year. An independent auditing firm audits the System’s basicfinancial statements annually and reports any findings to the Audit Committee and the Board.
Professional Services
The Board appoints professional consultants to perform ongoing services essential to the effectiveand efficient operation of the System. An opinion on the System’s basic financial statements from theindependent auditors, BDO USA, LLP, is included in the Financial Section of this report. The NorthernTrust Company is the global custodian for the System. Cheiron, Inc. performs the actuarial valuationsfor the System and advises the Board on funding matters. The System’s Investment Advisor, WindmarkInvestment Partners, provides the Board and the Investment Committee with periodic investmentperformance updates, ongoing market insights, asset allocation recommendations, investmentmanager research, manager recommendations, performance and attribution analysis, and additionalinvestment-related services. TBV Advisors provides analysis of the System’s operational and investmentrisk. Financial Recovery Technologies provides securities litigation monitoring to the System. TheSystem has engaged several law firms to assist in specific areas: Ice Miller acts as tax counsel to theSystem and Chapman and Cutler LLP, Morgan, Lewis & Bockius LLP and Reinhart Boerner VanDeurens.c. provide advice related to investment documentation and regulatory matters.
Acknowledgments
The Board thanks the many people who work so diligently to assure the successful operation andfinancial soundness of the Delaware Public Employees’ Retirement System. These include the PensionOffice staff; the Director of the Office of Management & Budget, who provides administrativesupervision to the Pension Office; other State support personnel; professional consultants; members ofthe Governance Subcommittee, Investment and Audit Committees, Internal Auditors; and the PensionAdvisory Council.
The Board welcomes Stephenie Tatman as the new Director of Internal Audit. Prior to joining thePension Office, she was the System's liaison with the State of Delaware's Office of Auditor of Accounts.
The Honorable John Carneyand
Members of the 149th General AssemblyPage 5November 21, 2018
Intr
od
uc
tor
ySec
tion
DPERS 47th Comprehensive Annual Financial Report 9
Acknowledgments (continued)
I am honored to work with a very fine Board and its Governance subcommittee, Investment and AuditCommittees. We appreciate the ongoing support of both the Executive and Legislative branches of ourstate government, the Director of the Office of Management and Budget, the Executive Director andthe Pension Office Staff, Deputy Attorney General, other state support personnel, our investmentadvisors and managers, professional consultants and the Pension Advisory Council. This remarkableteam works tirelessly to produce one of the best managed pension funds in the country. Operationallywe compare favorably or very favorably with other public funds across a host of measures. The Systemranks in the top quartile for the ten-year period ended June 30, 2018, in investment performance forpublic funds in excess of $5 billion in assets by the Trust Universe Comparison Service (TUCS). TheSystem’s longer-term results have been achieved with lower observed return volatility than the medianfor the universe, reflecting the System’s long standing focus on risk management. I look forward tocontinuing the longstanding working relationship with these various entities.
On behalf of our Board, I wish the State, the wider DPERS team and all of our beneficiaries only thevery best going forward.
Respectfully submitted,
Suzanne B. Grant, ChairBoard of Pension Trustees
The Honorable John Carneyand
Members of the 149th General AssemblyPage 6November 21, 2018
Intr
od
uc
tor
ySec
tion
DPERS 47th Comprehensive Annual Financial Report10
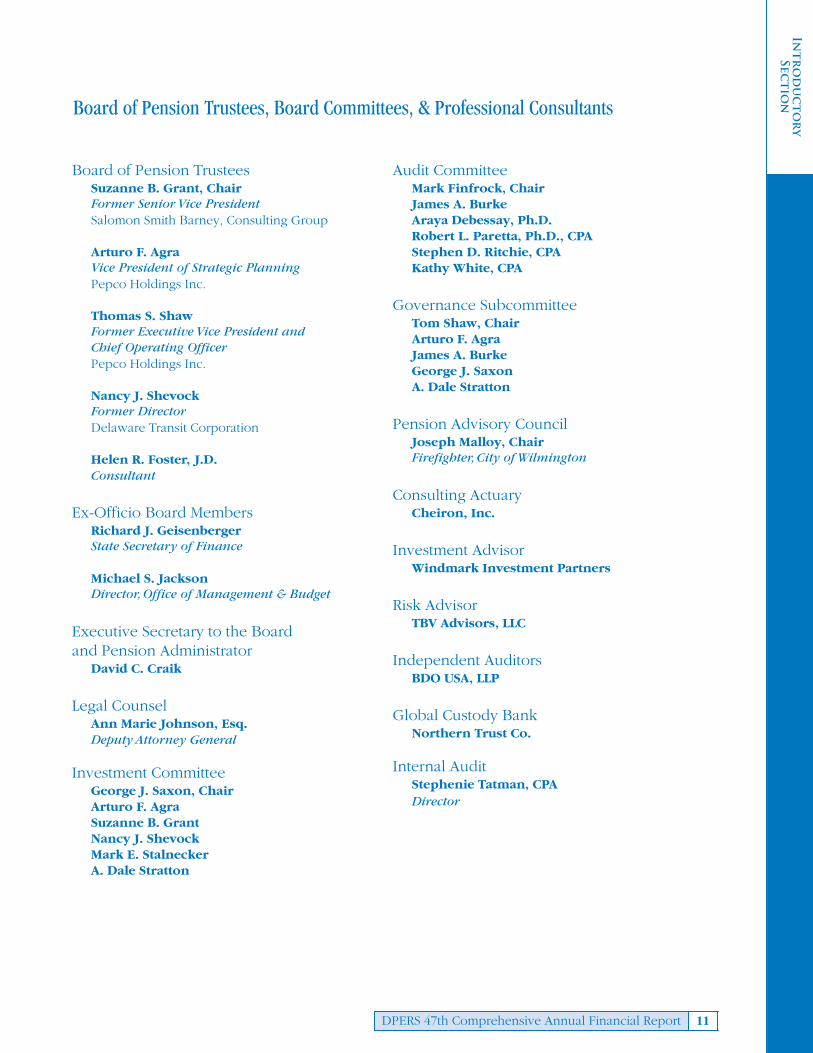
Board of Pension TrusteesSuzanne B. Grant, ChairFormer Senior Vice PresidentSalomon Smith Barney, Consulting Group
Arturo F. AgraVice President of Strategic PlanningPepco Holdings Inc.
Thomas S. ShawFormer Executive Vice President andChief Operating OfficerPepco Holdings Inc.
Nancy J. ShevockFormer DirectorDelaware Transit Corporation
Helen R. Foster, J.D.Consultant
Ex-Officio Board MembersRichard J. Geisenberger State Secretary of Finance
Michael S. JacksonDirector, Office of Management & Budget
Executive Secretary to the Boardand Pension Administrator
David C. Craik
Legal CounselAnn Marie Johnson, Esq.Deputy Attorney General
Investment CommitteeGeorge J. Saxon, ChairArturo F. AgraSuzanne B. GrantNancy J. ShevockMark E. StalneckerA. Dale Stratton
Audit CommitteeMark Finfrock, ChairJames A. BurkeAraya Debessay, Ph.D.Robert L. Paretta, Ph.D., CPAStephen D. Ritchie, CPA Kathy White, CPA
Governance SubcommitteeTom Shaw, ChairArturo F. AgraJames A. BurkeGeorge J. SaxonA. Dale Stratton
Pension Advisory CouncilJoseph Malloy, ChairFirefighter, City of Wilmington
Consulting ActuaryCheiron, Inc.
Investment AdvisorWindmark Investment Partners
Risk AdvisorTBV Advisors, LLC
Independent AuditorsBDO USA, LLP
Global Custody BankNorthern Trust Co.
Internal AuditStephenie Tatman, CPADirector
Board of Pension Trustees, Board Committees, & Professional Consultants
Intr
od
uc
tor
ySec
tion
DPERS 47th Comprehensive Annual Financial Report 11

Organizational Chart
Management Team:
Investments & Accounting: Khairat Makanjuola, CPA, Pension Cash/Debt ManagerJoshua Hitchens, Pension Cash/Debt Manager
Information Services: John McCartney, Information Systems Manager
ERP Functional Resources: Robin Hartnett-Sterner, Strategic Information Systems Manager
Information Technology: Robert Eckstine, Strategic Information Systems Project Leader
Pension Administration: Mary Wood, Human Resource Specialist V
Support Services: Terri L. Timmons, Office Manager
Payroll: Amy Cole, Human Resource Specialist IV
Human Resources: Kristal Diaz, Human Resource Specialist IV
Executive Branch
External InvestmentManagers (p. 84)
Investment & RiskAdvisors
Legal Counsel
Consulting Actuary
State andIndependent Auditors
Internal Audit
State LegislaturePension BenefitsReview Committee
Office ofManagement &
Budget
David C. CraikExecutive Secretary to the Board
& Pension Administrator
Joanna A. AdamsDeputy Pension Administrator
Pension AdvisoryCouncil
Audit Committee
InvestmentCommittee
Investments &Accounting
ERP FunctionalResources
PensionAdministration
SupportServices
Payroll Human ResourcesInformationTechnology
State Board ofPension Trustees
Information Services
GovernanceSubcommittee
Intr
od
uc
tor
ySec
tion
DPERS 47th Comprehensive Annual Financial Report12

Highlights of Board Activities
The Board of Pension Trustees (Board) – comprised of five members appointed by the Governor andconfirmed by the Senate, and two ex-officio members – is responsible for the general administrationof these plans/funds:
� State Employees’ Pension Plan
� Special Fund
� New State Police Pension Plan
� Judiciary Pension Plans (Closed and Revised)
� County & Municipal Police and Firefighters’ Pension Plans
� County & Municipal Other Employees’ Pension Plan
� Diamond State Port Corporation Pension Plan
� Closed State Police Pension Plan
� Delaware Volunteer Firemen’s Fund
The following retirement funds/plans have been established under the custody of the Board forinvestment purposes only:
� County & Municipal Police and Firefighters’ COLA Fund
� Post-Retirement Increase Fund
� Delaware Local Government Retirement Investment Pool
In addition to its general administrative responsibilities, the Board is responsible for these specificfunctions:
� Maintain and oversee the investment of the Delaware Public Employees’ RetirementSystem (System) and the Delaware OPEB Fund Trust (OPEB)
� Appoint an independent actuary to perform annual actuarial valuations used as the basisfor contributions to the System
� Control and manage State pension payments
� Hear appeals from State Pension Office decisions regarding eligibility for pension benefits
� Adopt rules and regulations for the general administration of State pension plans
� Prepare and publish an annual report to the Governor and General Assembly
� To contract with State agencies and others for assistance in the general administration andthe investing or advising as to the investment of pension system and OPEB assets
� Determine interest rates to be credited to members’ contributions and rates to be chargedon repayment of contributions previously withdrawn
The day-to-day administration of these plans/funds is performed by the State Pension Office, whichalso determines the eligibility of individual employees for pension benefits. The Pension Administratorreports to the Director of the Office of Management and Budget and also serves as Executive Secretaryto the Board.
The seven-person Audit Committee of the Board monitors operations and internal controls throughoutthe year to identify issues requiring Board and Pension Office action. They are responsible forinterfacing with the Delaware Auditor of Accounts and the independent auditing firm to assure Systemcompliance with generally accepted accounting principles and practices.
Intr
od
uc
tor
ySec
tion
DPERS 47th Comprehensive Annual Financial Report 13

Highlights of Board Activities (continued)
The Investment Committee of the Board is currently comprised of seven members. This Committeeoperates within the investment guidelines established by the Board. The Committee establishespolicies to meet these objectives and monitors these policies with the assistance of the InvestmentAdvisor. The Committee also reviews prospective risk levels and rates of return of all classes of assets.Hence, the Committee assures investment diversification by selecting managers who demonstratedifferent management styles and asset class expertise. Most importantly, the Committee closelymonitors the performance of all investment managers, not only in relation to specific absoluteobjectives, but also in relation to other fund managers following the same investment objectives.Further discussion of the Investment Committee’s activities may be found in the Investment Sectionof this report beginning on page 73.
The Board has approved the creation of a Governance subcommittee to oversee and advise the Boardon the governance matters relating to DPERS administration, and consistent with the governancereview undertaken of DPERS at the request of the Board. The Governance Subcommittee iscomprised of five members, drawn from the Board and the other committees.
The Board retains Windmark Investment Partners, as investment advisor for the System. Windmarkprovides a variety of services to the System including: investment manager and custody contractnegotiations, investment manager searches, performance analysis/attribution, and investmentpolicy and asset allocation recommendations. The firm is prohibited by contract terms frommanaging any of the System’s assets. A list of investment managers under contract with the Systemas of June 30, 2018, may be found on page 84 of this report. In addition, the schedule of fees andcommissions paid by the System is disclosed on pages 85-86.
The Board retains the firm of Cheiron, Inc., to provide professional actuarial and consulting services.Such services include the preparation of comprehensive actuarial valuations and reports, analysis ofthe costs and other aspects of proposed changes in pension provisions, general consulting advice, andbackground information on other public pension plans.
The Board also retains TBV Advisors, LLC, to provide risk assessment consulting services. TBV reportsto the Board and its Committees the inherent and control risks in the System’s operations andinvestments.
The Department of Justice assigns a Deputy Attorney General to serve as general counsel to the Board.The Deputy deals with legal questions involving interpretation and administration of pension laws,advises the Board in connection with appeals hearings, works with the Board on drafting legislationand regulations, and negotiates contracts.
The major activities of the Board and its committees during the 12-month period July 2017 throughJune 2018 were:
� As part of its continuing best practices review, continued to retain additional outsidecounsel to ensure full compliance with the IRS Code. Outside counsel was also retainedfor the purpose of drafting and reviewing alternative investment contracts. In addition,the Governance Subcommittee held regular meetings to continue addressing therecommendations entailed in the System's most recent review of best practices, that wasperformed by a third party consultant.
� Held regular monthly meetings and met with representatives of investment managementfirms and the custodial bank on a regular basis
� Held hearings for individual plan members who appealed decisions of the Pension Office,including eligibility of individual employees for disability pension benefits, or questionedthe Board’s interpretation of State pension laws
� Participated in meetings with the Governor’s staff, members of the General Assembly,officials of State agencies and school districts, the Pension Advisory Council,representatives of employee organizations, and other interested parties.
Intr
od
uc
tor
ySec
tion
DPERS 47th Comprehensive Annual Financial Report14

Presented to
Delaware Public Employees’ Retirement System
In recognition of meeting professional standards for plan funding as
set forth in the Public Pension Standards.
Presented by the Public Pension Coordinating Council, a confederation of
National Association of State Retirement Administrators (NASRA)National Conference on Public Employee Retirement Systems (NCPERS)
National Council on Teacher Retirement (NCTR)
Alan H. WinkleProgram Administrator
Public Pension Coordinating Council
Recognition Award for Funding
2017
Intr
od
uc
tor
ySec
tion
DPERS 47th Comprehensive Annual Financial Report 15

HS1 for HouseBill 179(81 Del. Laws, C445)
House Bill 312(81 Del. Laws, C368)
Senate Bill 7(81 Del. Laws, C397)
Senate Bill 11(81 Del. Laws, C398)
Senate Bill 236(81 Del. Laws, C281)
Adds 911 workers to the definition of "specified peace officers” in theState Employees’ Pension Plan.
Changes the definition of an employee in the Delaware CountyMunicipal Police/Firefighter Pension Plan to include paid EMTs who areemployed by a volunteer fire company.
Provides burial benefits to the County/Municipal Police/Firefighter planfor active employee deaths effective 7/1/16.
Provides another type of distribution from the County/Municipal COLAfund for the City of Wilmington.
Section 10 of this Act provides for a one-time pension supplement of$400 for the State Employees’, New State Police, and Judicial PensionPlans to be paid in November 2018.
2018 Legislation Affecting Pensions
Intr
od
uc
tor
ySec
tion
DPERS 47th Comprehensive Annual Financial Report16

DelawarePublic
Employees’Retirement
System— A component unit of the State of Delaware
Forty-Seventh ComprehensiveAnnual Financial Report
Presented by the DPERS Board of Pension TrusteesFor the Fiscal Year Ended June 30
2018
FINANCIALSECTION

Independent Auditor’s Report
Board of Pension TrusteesDelaware Public Employees’ Retirement SystemDover, Delaware
Report on the Financial Statements
We have audited the accompanying financial statements of Delaware Public Employees’ Retirement System(the System), a component unit of the State of Delaware, as of and for the year ended June 30, 2018, andthe related notes to the financial statements, which collectively comprise the System’s basic financialstatements as listed in the table of contents.
Management’s Responsibility for the Financial Statements
Management is responsible for the preparation and fair presentation of these financial statements inaccordance with accounting principles generally accepted in the United States of America; this includes thedesign, implementation, and maintenance of internal control relevant to the preparation and fair presentationof financial statements that are free from material misstatement, whether due to fraud or error.
Auditor’s Responsibility
Our responsibility is to express an opinion on these financial statements based on our audit. We conductedour audit in accordance with auditing standards generally accepted in the United States of America and thestandards applicable to financial audits contained in Government Auditing Standards, issued by theComptroller General of the United States. Those standards require that we plan and perform the audit toobtain reasonable assurance about whether the financial statements are free from material misstatement.
An audit involves performing procedures to obtain audit evidence about the amounts and disclosures in thefinancial statements. The procedures selected depend on the auditor’s judgment, including the assessmentof the risks of material misstatement of the financial statements, whether due to fraud or error. In makingthose risk assessments, the auditor considers internal control relevant to the entity’s preparation and fairpresentation of the financial statements in order to design audit procedures that are appropriate in thecircumstances, but not for the purpose of expressing an opinion on the effectiveness of the entity’s internalcontrol. Accordingly, we express no such opinion. An audit also includes evaluating the appropriateness ofaccounting policies used and the reasonableness of significant accounting estimates made by management,as well as evaluating the overall presentation of the financial statements.
We believe that the audit evidence we have obtained is sufficient and appropriate to provide a basis for ouraudit opinion.
Opinion
In our opinion, the financial statements referred to above present fairly, in all material respects, thefiduciary net position of the Delaware Public Employees’ Retirement System as of June 30, 2018, and thechanges in its fiduciary net position for the year then ended in accordance with accounting principlesgenerally accepted in the United States of America.
Other Matters
Prior-Year Comparative Information: We have previously audited the System’s 2017 financial statements,and we expressed an unmodified opinion on those financial statements in our report dated November13, 2017. In our opinion, the summarized comparative information presented herein as of and for theyear ended June 30, 2017 is consistent, in all material respects, with the audited financial statementsfrom which it has been derived.
BDO USA, LLP, a Delaware limited liability partnership, is the U.S. member of BDO International Limited, a UKcompany limited by guarantee, and forms part of the international BDO network of independent member firms.BDO is the brand name for the BDO network and for each of the BDO Member Firms.
Tel: 302-656-5500Fax: 302-656-8024www.bdo.com
4250 Lancaster Pike, Suite 120Wilmington, DE 19805
D
Our opinion is not modified
w
Finan
cial
Sectio
n
DPERS 47th Comprehensive Annual Financial Report18

Required Supplementary Information: Accounting principles generally accepted in the United States ofAmerica require that the Management’s Discussion and Analysis on pages 20 – 23 and Schedules 1, 2,3, and 4, and the related notes to the required supplementary information on pages 51- 64 be presentedto supplement the basic financial statements. Such information, although not a part of the basic financialstatements, is required by Governmental Accounting Standards Board, who considers it to be anessential part of the financial reporting for placing the basic financial statements in an appropriateoperational, economic, or historical context. We have applied certain limited procedures to the requiredsupplementary information in accordance with auditing standards generally accepted in the UnitedStates of America, which consisted of inquiries of management about the methods for preparing theinformation and comparing the information for consistency with management’s responses to ourinquiries, the basic financial statements, and other knowledge we obtained during our audit of thebasic financial statements. We do not express an opinion or provide any assurance on the informationbecause the limited procedures do not provide us with sufficient evidence to express an opinion orprovide any assurance.
Supplementary and Other Information: The audit was conducted for the purpose of forming an opinionon the financial statements that collectively comprise the System’s basic financial statements. The Scheduleof Administrative Expenses, Schedule of Investment Expenses, and the Schedules for Delaware LocalGovernment Retirement Investment Pool (the Schedules) on pages 66-69 are presented for purposes ofadditional analysis and are not a required part of the basic financial statements.
The Schedules are the responsibility of management and were derived from and relate directly to theunderlying accounting and other records used to prepare the basic financial statements. Such informationhas been subjected to the auditing procedures applied in the audit of the basic financial statements andcertain additional procedures, including comparing and reconciling such information directly to theunderlying accounting and other records used to prepare the basic financial statements or to the basicfinancial statements themselves, and other additional procedures in accordance with auditing standardsgenerally accepted in the United States. In our opinion, the Schedules are fairly stated in all material respectsin relation to the basic financial statements as a whole.
The Introductory, Investment, Actuarial, and Statistical sections as listed in the table of contents have notbeen subjected to the auditing procedures applied in the audit of the basic financial statements, andaccordingly, we do not express an opinion or provide any assurance on them.
Other Reporting Required by Government Auditing Standards
In accordance with Government Auditing Standards, we have also issued our report dated November 21,2018 on our consideration of the System’s internal control over financial reporting and on our tests of itscompliance with certain provisions of laws, regulations, contracts, and grant agreements and other matters.The purpose of that report is to describe the scope of our testing of internal control over financial reportingand compliance and the results of that testing, and not to provide an opinion on internal control overfinancial reporting or on compliance. That report is an integral part of an audit performed in accordancewith Government Auditing Standards in considering the System’s internal control over financial reportingand compliance.
Wilmington, DelawareNovember 21, 2018
Board of Pension TrusteesDelaware Public Employees’ Retirement SystemDover, DelawarePage 2 of 2
BDO USA, LLP, a Delaware limited liability partnership, is the U.S. member of BDO International Limited, a UKcompany limited by guarantee, and forms part of the international BDO network of independent member firms.BDO is the brand name for the BDO network and for each of the BDO Member Firms.
We do not express an opinion or p
The 2016 Schedule of Administrative Expenses, Schedule of S
We do not express an opinion or p
The 2016 Schedule of Administrative Expenses, Schedule of S
The report of other auditors dated December 15, 2015 indicated the 2015 Schedules were fairly stated in
a
Finan
cial
Sectio
n
DPERS 47th Comprehensive Annual Financial Report 19

Management’s Discussion and AnalysisThis section presents management’s discussion and analysis of the Delaware Public Employees’Retirement System’s (System) financial performance and provides an overview of the System’s financialactivities for the Fiscal Year ended June 30, 2018. It is intended to be a narrative supplement to theSystem’s financial statements, which begin on page 24 of this report.
Financial Highlights
The following financial highlights occurred during the Fiscal Year ended June 30, 2018, versus FiscalYear 2017:
� Plan net position of all the funds administered by the System increased by $618.9 million.� Fiscal Year 2018 covered employee payroll totaled $2,195.4 million. Employer contributions increased
by 0.8% while Member contributions increased by 4.0%. The increase in Member contributions isattributed to a higher amount of covered payroll.
� Net investment earnings (net increase/(decrease) in fair value, plus investment earnings, lessinvestment-related expenses) increased by $970.9 million as a result of a higher market driveninvestment return of 10.6% in Fiscal Year 2018.
� Transfer of Contributions from PRI Fund decreased by 64.9% per planned schedule of transfersas disclosed in Note 2 of the financial statements.
� Pension benefits paid to retirees and beneficiaries increased $32.7 million bringing the totalbenefit payments to $674.1 million.
Using this Financial Report
The System’s 2018 Financial Statements, Notes to the Financial Statements and Required SupplementaryInformation (RSI) were prepared in conformity with GASB Statement No. 67, Financial Reporting forPension Plans—an amendment of GASB Statement No. 25. This financial report consists of two basicfinancial statements as follows:
� The Statement of Fiduciary Net Position which reports the pension trust funds’ assets,liabilities, and resulting net position where Assets – Liabilities = Net Position held in trust forpension benefits available at the end of the fiscal year. It is a snapshot of the financial positionof the pension trust funds at that specific point in time.
� The Statement of Changes in Fiduciary Net Position summarizes the pension trust funds’financial transactions that have occurred during the fiscal year where Additions – Deductions= Net Change in Net Position. It supports the change that has occurred to the prior year’s netposition on the Statement of Fiduciary Net Position.
Because of the long-term nature of a defined benefit pension plan, the basic financial statements alonecannot provide sufficient information to properly reflect the System’s ongoing plan perspective. TheRequired Supplementary Information includes four required schedules of historical trend informationas follows:
Finan
cial
Sectio
n
DPERS 47th Comprehensive Annual Financial Report20

The Schedule of Changes in Net Pension Liability (pages 51-59) presents sources of changes in thenet pension liability.
The Schedule of Net Pension Liability (page 60) includes historical information about the componentsof the net pension liability and related ratios, including fiduciary net position as a percentage of the totalpension liability, and the net pension liability as a percentage of covered payroll.
The Schedule of Employer Contributions (pages 61-63) includes information about the actuarially de-termined contribution, contributions to the pension plan, and related ratios. Additionally, significantmethods and assumptions used in calculating the actuarially determined contributions are presentedin the notes to required supplementary information.
The Schedule of Investment Returns (page 63) includes the annual money-weighted rate of return onpension plan investments for each year.
Rates of Return on Investments
The System has elected to disclose both the money-weighted and time-weighted rates of return. Themoney-weighted rate of return is disclosed, by plan, in the notes to the financial statements (Note 7– Deposits and Investments) and in the required supplementary information (Schedule of InvestmentReturns). The time-weighted rate of return is disclosed in the Introductory Section and InvestmentSection of this report.
A money-weighted rate of return provides information about the actual performance of a pensionplan’s investment portfolio because it takes into account the effects of transactions that increase theamount of pension plan investments (such as contributions) and those that decrease the amount ofpension plan investments (such as benefit payments). Additionally, the money-weighted rate of returnprovides information that is comparable with the long-term expected rate of return on pension planinvestments, which is used in calculating information presented in the financial section of this report.
In contrast, a time-weighted rate of return considers investment performance of a hypothetical dollarinvested from the beginning of an investment period to the period’s end. The time-weighted rate ofreturn does not consider the effect of varying amounts invested due to, for example, the receipt of con-tributions or the payment of benefits. A time-weighted rate of return communicates information thatis suitable for comparisons to relevant benchmark rates, provides information to assess investmentmanager performance, and provides comparability among pension plans and investment managers.
Finan
cial
Sectio
n
DPERS 47th Comprehensive Annual Financial Report 21

Summary Statement of Fiduciary Net Position(dollar values expressed in thousands)
Increase/ Increase/(Decrease) (Decrease)
Fiscal Years Ended June 30, 2018 2017 Amount Percent
Cash and Investments at Fair Value $ 10,096,178 $ 9,500,174 $ 596,004 6%
Receivables 50,746 57,276 (6,530) (11)%
Total Assets $ 10,146,924 $ 9,557,450 $ 589,474 6%
Total Liabilities $ 21,585 $ 50,967 $ (29,382) (58)%
Total Net Position $ 10,125,339 $ 9,506,483 $ 618,856 7%
Summary Statement of Changes in Fiduciary Net Position(dollar values expressed in thousands)
Increase/ Increase/(Decrease) (Decrease)
Fiscal Years Ended June 30, 2018 2017 Amount Percent
Additions:
Employer Contributions $ 271,472 $ 269,265 $ 2,207 0.8%
Transfer of Contributions from PRI Fund 10,944 31,137 (20,193) (64.9)%
Transfer of Assets from Outside the System 5,812 3,263 2,549 78.1%
Member Contributions 76,520 73,595 2,925 4.0%
Other 36 - 36 -
Net Investment Earnings (Losses) 969,887 959,595 10,292 1.1%
Net Securities Lending Income 1,040 1,166 (126) (10.8)%
TOTAL ADDITIONS $ 1,335,711 $ 1,338,021 (2,310) (0.2)%
Deductions:
Transfer of Contributions from PRI Fund 10,945 31,137 $ (20,192) (64.8)%
Transfer of Assets Outside the System 12,092 12,657 $ (565) (4.5)%
Pension Payments 674,118 641,471 $ 32,647 5.1%
Refunds of Contributions to Members 6,859 6,331 $ 528 8.3%
Burial Benefit Payments 6,603 5,932 $ 671 11.3%
Administrative Expenses:
General Administrative Expenses 6,193 6,044 $ 149 2.5%
Best Practices Review 45 45 $ - 0.0%
Total Administrative Expenses $ 6,238 $ 6,089 $ 149 2.4%
TOTAL DEDUCTIONS $ 716,855 $ 703,617 $ 13,238 1.9%
INCREASE/(DECREASE) IN NET POSITION $ 618,856 $634,404 $ (15,548) (2.5)%
Finan
cial
Sectio
n
DPERS 47th Comprehensive Annual Financial Report22

Analysis of Fiduciary Net Position
The System was created to provide retirement, survivor, and disability benefits to qualified membersand their beneficiaries. The cost of such programs includes recurring benefit payments as designatedby the various plans, refunds of member contributions to terminated employees, and the cost ofadministering the System. Combined Fiduciary net position increased by $618.9 million during FiscalYear 2018. The year's investment return of 10.6% or $970.9 million in investment gains, employercontributions of $271.5 million, employee contribution of $76.5 million and benefit payments andadministration expenses of $680.3 million are the primary reasons for this year's increase in total plannet position.
On a year to year basis, plans had decreases/increases in required actuarial determined contributionrates that ranged from -17.07% to 16.4%. Employer contributions increased by $2.2 million or 0.8%primarily due to the large decrease in contributions to the Post-Retirement Increase Fund, CountyMunicipal Police and Firefighters’ Plan and Judiciary Plan. These decreases were offset by increasedcontributions in other plans. Member contributions increased by $2.9 million. Transfers from thePost-Retirement Increase Fund decreased by $20.2 million, which is in accordance with plannedschedule of transfers for previously granted increases in retiree benefits.
Pension benefit payments increased by approximately 5.1% as a result of a net increase of 857members/beneficiaries during Fiscal Year 2018. Transfers of Assets Outside the System includetransfers from the County & Municipal Police and Firefighters’ COLA Fund (COLA Fund) to individualparticipating entities. This fund invests non-pension contributions designated for distribution topension plans outside the System that meet certain program criteria.
Finan
cial
Sectio
n
DPERS 47th Comprehensive Annual Financial Report 23

Combining Statement of Fiduciary Net Positionas of June 30, 2018 with Comparative Totals for June 30, 2017(expressed in thousands)
County & County &Municipal Municipal
State New State Judiciary Police and OtherEmployees’ Special Police Pension Firefighters’ Employees’
Plan Fund Plan Plans Plans Plan
Assets:
Cash & Cash Equivalents $ 687,839 $ 14 $ 36,148 $ 6,447 $ 28,285 $ 4,069
Receivables:
Accrued Investment Income 10,970 1 353 78 160 19
Pending Trade Sales 16,325 - 853 152 665 96
Employer Contributions 13,723 - 861 137 375 146
Member Contributions 4,247 - 249 17 229 60
Total Receivables: $ 45,265 $ 1 $ 2,316 $ 384 $ 1,429 $ 321
Investments at Fair Value:
Domestic Fixed Income 928,871 20 48,558 8,673 37,832 5,457
Domestic Equities 1,668,095 36 87,203 15,575 67,939 9,799
Pooled Equity & Fixed Income 2,963,872 64 154,942 27,673 120,715 17,412
Alternative Investments 2,203,362 48 115,185 20,573 89,740 12,944
Foreign Fixed Income 71,026 2 3,713 663 2,893 417
Foreign Equities 479,356 10 25,059 4,476 19,524 2,816
Total Investments: $ 8,314,582 $ 180 $ 434,660 $ 77,633 $ 338,643 $ 48,845
TOTAL ASSETS: $ 9,047,686 $ 195 $ 473,124 $ 84,464 $ 368,357 $ 53,235
Liabilities:
Pending Purchases Payable 14,812 - 774 138 603 87
Benefits Payable 944 - 11 - 24 4
Accrued Investment Expenses 3,242 - 166 30 132 19
Accrued Administrative Expenses 241 - 3 - 5 3
Other Liabilities - - - - 123 -
TOTAL LIABILITIES: $ 19,239 $ - $ 954 $ 168 $ 887 $ 113
NET POSITION - RESTRICTEDFOR PENSION BENEFITS: $ 9,028,447 $ 195 $ 472,170 $ 84,296 $ 367,470 $ 53,122
The notes to the financial statements are an integral part of this Statement.
Finan
cial
Sectio
n
DPERS 47th Comprehensive Annual Financial Report24

County & Delaware LocalDelaware Diamond Municipal Gov’t ClosedVolunteer State Port Police and Post- Retirement StateFiremen’s Corporation Firefighters’ Retirement Investment Police Totals as of June 30,
Fund Plan COLA Fund Increase Fund Pool Plan 2018 2017
$ 576 $ 2,571 $ 917 $ 612 $ 3,084 $ 374 $ 770,936 $ 345,253
1 21 3 2 53 (4) 11,657 13,611
- 61 22 14 73 9 18,270 26,369
- 111 - 638 - - 15,991 13,052
- 26 - - - - 4,828 4,244
$ 1 $ 219 $ 25 $ 654 $ 126 $ 5 $ 50,746 $ 57,276
- 3,450 1,225 802 4,171 488 1,039,547 1,008,626
- 6,196 2,200 1,441 7,491 876 1,866,851 2,100,653
19,964 11,008 3,909 2,560 13,309 1,558 3,336,986 3,298,266
- 8,184 2,906 1,903 9,894 1,158 2,465,897 2,154,595
- 264 94 61 319 37 79,489 97,817
- 1,780 632 414 2,153 252 536,472 494,964
$ 19,964 $30,882 $10,966 $ 7,181 $ 37,337 $ 4,369 $9,325,242 $ 9,154,921
$ 20,541 $33,672 $11,908 $ 8,447 $ 40,547 $ 4,748 $10,146,924 $ 9,557,450
- 55 20 13 67 8 16,577 45,645
6 - - - - 9 998 1,021
4 15 4 2 15 3 3,632 3,989
- 1 - - - 2 255 312
- - - - - - 123 -
$ 10 $ 71 $ 24 $ 15 $ 82 $ 22 $ 21,585 $50,967
$ 20,531 $33,601 $11,884 $ 8,432 $40,465 $ 4,726 $10,125,339 $ 9,506,483
Finan
cial
Sectio
n
DPERS 47th Comprehensive Annual Financial Report 25
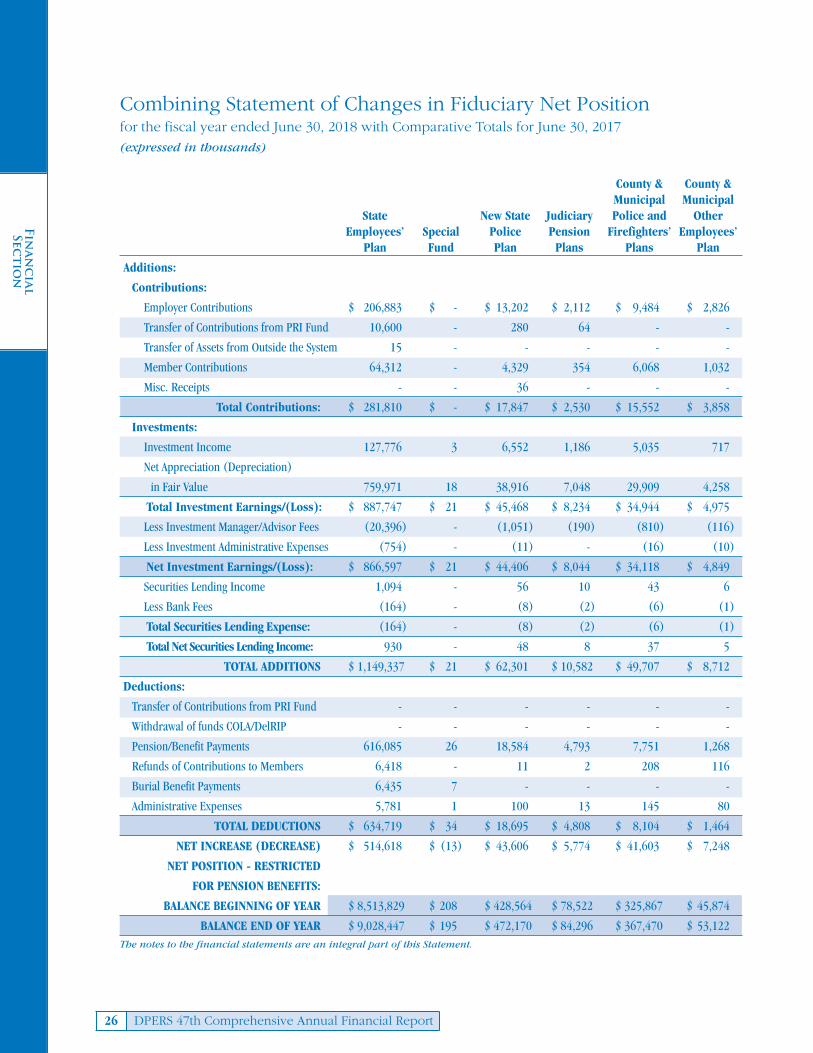
Combining Statement of Changes in Fiduciary Net Positionfor the fiscal year ended June 30, 2018 with Comparative Totals for June 30, 2017(expressed in thousands)
County & County &Municipal Municipal
State New State Judiciary Police and OtherEmployees’ Special Police Pension Firefighters’ Employees’
Plan Fund Plan Plans Plans Plan
Additions:
Contributions:
Employer Contributions $ 206,883 $ - $ 13,202 $ 2,112 $ 9,484 $ 2,826
Transfer of Contributions from PRI Fund 10,600 - 280 64 - -
Transfer of Assets from Outside the System 15 - - - - -
Member Contributions 64,312 - 4,329 354 6,068 1,032
Misc. Receipts - - 36 - - -
Total Contributions: $ 281,810 $ - $ 17,847 $ 2,530 $ 15,552 $ 3,858
Investments:
Investment Income 127,776 3 6,552 1,186 5,035 717
Net Appreciation (Depreciation)
in Fair Value 759,971 18 38,916 7,048 29,909 4,258
Total Investment Earnings/(Loss): $ 887,747 $ 21 $ 45,468 $ 8,234 $ 34,944 $ 4,975
Less Investment Manager/Advisor Fees (20,396) - (1,051) (190) (810) (116)
Less Investment Administrative Expenses (754) - (11) - (16) (10)
Net Investment Earnings/(Loss): $ 866,597 $ 21 $ 44,406 $ 8,044 $ 34,118 $ 4,849
Securities Lending Income 1,094 - 56 10 43 6
Less Bank Fees (164) - (8) (2) (6) (1)
Total Securities Lending Expense: (164) - (8) (2) (6) (1)
Total Net Securities Lending Income: 930 - 48 8 37 5
TOTAL ADDITIONS $ 1,149,337 $ 21 $ 62,301 $ 10,582 $ 49,707 $ 8,712
Deductions:
Transfer of Contributions from PRI Fund - - - - - -
Withdrawal of funds COLA/DelRIP - - - - - -
Pension/Benefit Payments 616,085 26 18,584 4,793 7,751 1,268
Refunds of Contributions to Members 6,418 - 11 2 208 116
Burial Benefit Payments 6,435 7 - - - -
Administrative Expenses 5,781 1 100 13 145 80
TOTAL DEDUCTIONS $ 634,719 $ 34 $ 18,695 $ 4,808 $ 8,104 $ 1,464
NET INCREASE (DECREASE) $ 514,618 $ (13) $ 43,606 $ 5,774 $ 41,603 $ 7,248
NET POSITION - RESTRICTED
FOR PENSION BENEFITS:
BALANCE BEGINNING OF YEAR $ 8,513,829 $ 208 $ 428,564 $ 78,522 $ 325,867 $ 45,874
BALANCE END OF YEAR $ 9,028,447 $ 195 $ 472,170 $ 84,296 $ 367,470 $ 53,122 The notes to the financial statements are an integral part of this Statement.
Finan
cial
Sectio
n
DPERS 47th Comprehensive Annual Financial Report26

Statement of Changes in Plan Net Assetsfor the fiscal year ended June 30, 2013 with Comparative Totals for June 30, 2012(expressed in thousands)
County & Delaware LocalDelaware Diamond Municipal Gov’t ClosedVolunteer State Port Police and Post- Retirement StateFiremen’s Corporation Firefighters’ Retirement Investment Police Totals as of June 30,
Fund Plan COLA Fund Increase Fund Pool Plan 2018 2017
$ 2,019 $ 1,175 $ - $ 11,021 $ - $ 22,750 $ 271,472 $ 269,265
- - - - - - 10,944 31,137
- - 3,497 - 2,300 - 5,812 3,263
145 280 - - - - 76,520 73,595
- - - - - - 36 -
$ 2,164 $ 1,455 $ 3,497 $ 11,021 $ 2,300 $ 22,750 $ 364,784 $ 377,260
256 462 167 113 653 203 143,123 153,017
1,033 2,742 956 665 3,767 1,129 850,412 830,921
$ 1,289 $ 3,204 $ 1,123 $ 778 $ 4,420 $ 1,332 $ 993,535 $ 983,938
(26) (74) (27) (18) (103) (36) (22,847) (23,581)
- (4) - - - (6) (801) (762)
$ 1,263 $ 3,126 $ 1,096 $ 760 $ 4,317 $ 1,290 $ 969,887 $ 959,595
- 4 1 1 6 2 1,223 1,372
- (1) - - (1) - (183) (206)
- (1) - - (1) - (183) (206)
- 3 1 1 5 2 $ 1,040 1,166
$ 3,427 $ 4,584 $ 4,594 $ 11,782 $ 6,622 $ 24,042 $ 1,335,711 $ 1,338,021
- - - 10,945 - - 10,945 31,137
- - 3,367 - 8,725 - 12,092 12,657
2,167 964 - - - 22,480 674,118 641,471
87 17 - - - - 6,859 6,331
- - - - - 161 6,603 5,932
35 40 - 1 2 40 6,238 6,089
$ 2,289 $ 1,021 $ 3,367 $ 10,946 $ 8,727 $ 22,681 $ 716,855 $ 703,617
$ 1,138 $ 3,563 $ 1,227 $ 836 $ (2,105) $ 1,361 $ 618,856 $ 634,404
$ 19,393 $ 30,038 $ 10,657 $ 7,596 $ 42,570 $ 3,365 $ 9,506,483 $ 8,872,079
$ 20,531 $ 33,601 $ 11,884 $ 8,432 $ 40,465 $ 4,726 $ 10,125,339 $ 9,506,483
Finan
cial
Sectio
n
DPERS 47th Comprehensive Annual Financial Report 27

Notes to Financial StatementsJune 30, 2018
1. Plan Descriptions and Contribution Information
The following plans/funds (the Plans) in the Delaware Public Employees' Retirement System (DPERS orSystem) are sponsored by the State of Delaware (the State) and are established in the Delaware Code:
� State Employees’ Pension Plan
� Special Fund
� New State Police Pension Plan
� Judiciary Pension Plans (Closed and Revised)
� County & Municipal Police and Firefighters’ Pension Plans
� County & Municipal Other Employees’ Pension Plan
� Delaware Volunteer Firemen’s Fund
� Diamond State Port Corporation Plan
� Closed State Police Pension Plan
With the exception of the Diamond State Port Corporation Pension Plan, the General Assembly isresponsible for setting benefits and contributions and amending plan provisions; administrative rulesand regulations are adopted and maintained by the Board. The Board of Directors for the DiamondState Port Corporation is responsible for setting benefits and contributions and amending their planprovisions.
The management of all the Plans and Funds in the System is the responsibility of the Board of PensionTrustees (Board). The Board’s oversight includes management of investment funds and pools includedin the System, the Post-Retirement Increase Fund, the County & Municipal Police & Firefighters’ COLAFund, and the Delaware Local Government Retirement Investment Pool. These funds are commingledfor investment purposes only. These funds are more fully explained in Note 2 to the financialstatements.
The Board is comprised of five members appointed by the Governor and confirmed by the StateSenate, plus two ex-officio members. The daily operation of the System is the responsibility of theOffice of Pensions. Although most of the assets of the Plans and Funds are commingled for investmentpurposes, each Plan’s or Fund’s assets may be used only for the payment of benefits to the membersof that Plan or Fund in accordance with the terms of that Plan or Fund. Although separate financialstatements are presented for the System as a whole, the System is considered a component unit of theState of Delaware financial reporting entity and its financial statements are included as Pension TrustFunds within the Fiduciary Funds of the State’s financial report.
A component unit is defined as a legally separate organization for which the elected officials of theprimary government are financially accountable. The System is thus classified as a component unit ofthe State of Delaware because the State Senate retains certain significant governing powers over theSystem as described in the Board structure above. The System’s financials are not intended to presentthe financial position and results of operations of the State.
Finan
cial
Sectio
n
DPERS 47th Comprehensive Annual Financial Report28
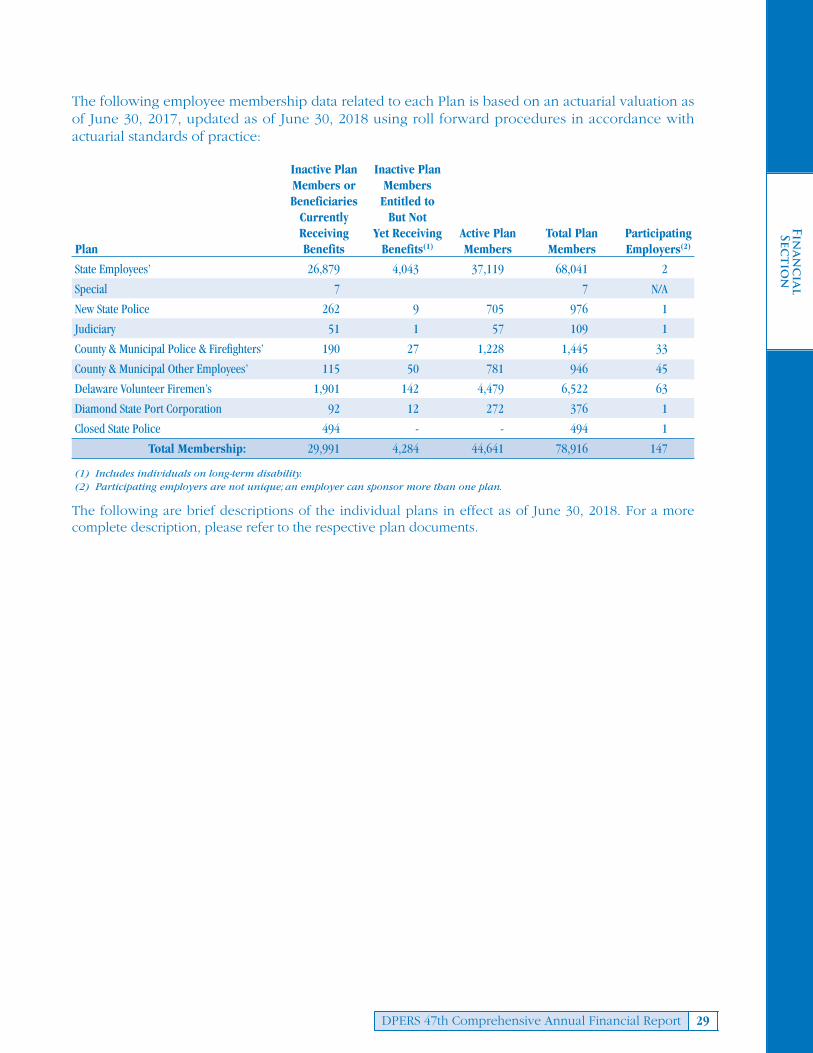
The following employee membership data related to each Plan is based on an actuarial valuation asof June 30, 2017, updated as of June 30, 2018 using roll forward procedures in accordance withactuarial standards of practice:
Inactive Plan Inactive PlanMembers or MembersBeneficiaries Entitled toCurrently But NotReceiving Yet Receiving Active Plan Total Plan Participating
Plan Benefits Benefits(1) Members Members Employers(2)
State Employees’ 26,879 4,043 37,119 68,041 2
Special 7 7 N/A
New State Police 262 9 705 976 1
Judiciary 51 1 57 109 1
County & Municipal Police & Firefighters’ 190 27 1,228 1,445 33
County & Municipal Other Employees’ 115 50 781 946 45
Delaware Volunteer Firemen’s 1,901 142 4,479 6,522 63
Diamond State Port Corporation 92 12 272 376 1
Closed State Police 494 - - 494 1
Total Membership: 29,991 4,284 44,641 78,916 147
(1) Includes individuals on long-term disability.(2) Participating employers are not unique; an employer can sponsor more than one plan.
The following are brief descriptions of the individual plans in effect as of June 30, 2018. For a morecomplete description, please refer to the respective plan documents.
Finan
cial
Sectio
n
DPERS 47th Comprehensive Annual Financial Report 29

State Employees’ Pension Plan
Plan Description and Eligibility: The StateEmployees’ Pension Plan is a cost-sharingmultiple employer defined benefit plan thatcovers virtually all full-time or regular part-timeemployees of the State, including employees ofother affiliated entities.
There are two tiers within this plan: 1) employees hired prior to January 1, 2012 (Pre-2012). 2) employees hired on or afterJanuary 1, 2012 (Post-2011).
Service Benefits: Final average monthlycompensation (employee hired Post-2011 maynot include overtime in pension compensation)multiplied by 2.0% and multiplied by years ofcredited service prior to January 1, 1997, plusfinal average monthly compensation multipliedby 1.85% and multiplied by years of creditedservice after December 31, 1996, subject tominimum limitations. For this plan, final averagemonthly compensation is the monthly averageof the highest three periods of twelveconsecutive months of compensation.
Vesting: Pre-2012 date of hire: 5 years of creditedservice. Post-2011 date of hire: 10 years ofcredited service (5 of which must beconsecutive).
Retirement: Pre-2012 date of hire: Age 62 with 5years of credited service; age 60 with 15 years ofcredited service; or after 30 years of creditedservice at any age. Post-2011 date of hire: age65 with at least 10 years of credited service; Age60 with 20 years of credited service; 30 years ofcredited service at any age.
Disability Benefits: Pre-2012 date of hire: Same asService Benefits. Employee must have 5 years ofcredited service. In lieu of disability pensionbenefits, over 90% of the members of this planopted into a Disability Insurance Programoffered by the State effective January 1, 2006.Post-2011 date of hire – in the DisabilityInsurance Program.
Survivor Benefits: If employee is receiving apension, the eligible survivor receives 50% ofpension (or 67.7% with 2% reduction of benefit,75% with 3% reduction of benefit, or 100% with6% reduction of benefit.); if employee is activewith at least 5 years of credited service, eligiblesurvivor receives 75% of the benefit theemployee would have received at age 62.Amount payable to a surviving spouse underage 50 at the time the survivor's pension begins,shall be reduced for each month under age 50in accordance with actuarial tables approved bythe Board. Any actuarial reduction for such aspouse shall however not apply for the periodduring which the spouse has in his or her care,an unmarried child or children.
Contributions:Employer - determined by Board of PensionTrustees. Employer contributions was 10.42% and9.58% in Fiscal Years 2018 and 2017 respectively.Pre-2012 date of hire Member - 3% of earningsin excess of $6,000. Post-2011 date of hire Member - 5% ofearnings in excess of $6,000.Correctional Officers - additional 2% ofearnings in excess of $6,000.
Burial Benefit: $7,000 per member.
Special Fund
Plan Description and Eligibility: The SpecialFund provides certain benefits granted toindividuals identified through legislationpassed by the General Assembly.
Service Benefits: Defined by special legislation.
Vesting: Defined by special legislation.
Retirement: Defined by special legislation.
Disability Benefits: Defined by special legislation.
Survivor Benefits: Same as State Employees’ Plan.
Contributions: Employer contributions areactuarially determined and fully funded in advance by the General Assembly.
Burial Benefit: $7,000 per member.
Finan
cial
Sectio
n
DPERS 47th Comprehensive Annual Financial Report30

New State Police Pension Plan
Plan Description and Eligibility: The New StatePolice Pension Plan is a single-employerdefined benefit plan that covers all State policeofficers appointed on or after July 1, 1980.
Service Benefits: 2.5% of final average monthlycompensation multiplied by years of creditedservice up to 20 years, plus 3.5% of finalaverage monthly compensation multiplied byyears of service in excess of 20 years. For thisplan, final average monthly compensation isthe monthly average of the highest threeconsecutive years of compensation.
Vesting: 10 years of credited service at age 62.
Retirement: Age plus credited service (but notless than 10 years) equals 75; has 10 years ofservice and is retired due to age 55; or 20years of credited service.
Disability Benefits:Duty - Total Disability - 75% of final averagemonthly compensation plus 10% for eachdependent not to exceed 25% for alldependents.Duty - Partial Disability - calculated the sameas Service Benefits, subject to minimum 50% offinal average monthly compensation.
Non-Duty - Same as Service Benefits, totaldisability subject to a minimum 50% of finalaverage monthly compensation plus 5% foreach dependent not to exceed 20% for alldependents. Partial disability to a minimum of30% of final average monthly compensation.
Survivor Benefits: If employee is receiving apension, the eligible survivor receives aminimum of 50% of pension; if employee isactive, eligible survivor receives 50% ofpension. If member is killed in the line of duty,eligible survivor receives 75% of member'scompensation.
Contributions:Employer - determined by Board of PensionTrustees. Employer contributions were 21.17%and 18.2% of earnings for the Fiscal Year 2018and 2017 respectively.Member - 7% of compensation.
Burial Benefit: $7,000 per member.
Judiciary Pension Plans(Closed and Revised)
Plan Description and Eligibility: The ClosedJudiciary Pension Plan is a single-employerdefined benefit plan that covers members ofState Judiciary appointed before July 1, 1980.
The Revised Judiciary Pension Plan is a single-employer defined benefit plan that coversmembers of State Judiciary appointed on or after July 1, 1980 or members appointedbefore July 1, 1980 who accept the provisionsof this Plan.
Assets of one plan can be used to satisfy the liabilities of the other plan.
Service Benefits:Revised - 1/24th of final average monthlycompensation multiplied by years of service up to 12 years, plus 1/48th of final averagemonthly compensation, multiplied by years of service from 13 to 24 years, subject tomaximum limitations.
For this plan, final average monthlycompensation is the monthly average of the highest three consecutive years ofcompensation.
Vesting: 12 years of credited service.
Retirement:Revised - Age 62 with 12 years of creditedservice, or any age with 24 years of credited service.
Disability Benefits: Same as Service Benefits.
Survivor Benefits:Closed - If employee is receiving a pension,then eligible survivor receives 2/3 of pension; ifemployee is active with 12 years of creditedservice, then eligible survivor receives 2/3 ofpension the employee would have been eligibleto receive.
Revised - If employee is receiving a pension,the eligible survivor receives a minimum of 50%of pension (or 2/3 with 2% reduction ofpensioner’s benefit); if employee is active,eligible survivor receives 2/3 of the benefit theemployee would have received at age 62.
Finan
cial
Sectio
n
DPERS 47th Comprehensive Annual Financial Report 31

Contributions:Employer - determined by Board of PensionTrustees. Employer contributions were 19.87%and 22.13% of earnings for the Fiscal Year 2018and 2017, respectively.Member - Closed - $500 per year for the first 25 years of service.
Member - Revised - 3% of earnings that exceed$6,000 per year, plus 2% of earnings that exceedthe Social Security Wage Base for the first24 years of service.
Burial Benefit: Not applicable.
County & Municipal Police andFirefighters’ Pension Plan
Plan Description and Eligibility: County &Municipal Police and Firefighters’ Pension Plan,is a cost-sharing multiple-employer definedbenefit plan that covers police officers andfirefighters employed by a county ormunicipality of the State which has become partof the Plan.
Service Benefits: 2.5% of final average monthlycompensation multiplied by years of creditedservice up to 20 years, plus 3.5% of final averagemonthly compensation multiplied by years ofservice in excess of 20 years. For this plan, finalaverage monthly compensation is the monthlyaverage of the highest three consecutive yearsof compensation (excluding overtime andspecial pay).
Vesting: 5 years of credited service.
Retirement: Age 62 with 5 years of service; ageplus credited service (but not less than 10 years)equals 75; or 20 years of credited service.
Disability Benefits:Duty - Total Disability - 75% of final averagemonthly compensation plus 10% for eachdependent not to exceed 25% for alldependents.
Duty - Partial Disability - calculated the sameas Service Benefits, subject to minimum 50% offinal average monthly compensation.
Non-Duty - Same as Service Benefits, totaldisability subject to a minimum 50% of finalaverage monthly compensation plus 5% for
each dependant not to exceed 20% for alldependants. Partial disability to a minimum of30% of final average monthly compensation.
Survivor Benefits: If employee is receiving apension, then eligible survivor receives aminimum of 50% of pension; if employee isactive, eligible survivor receives 75% of pensionthe employee would have received at age 62. Ifthe member is killed in the line of duty, theeligible survivor receives 75% of the member’scompensation.
Contributions:Employer - determined by Board of PensionTrustees. Employer contributions were 11.42%and 13.8% of earnings for the Fiscal Year 2018and 2017, respectively.Member - 7% of compensation.
Burial Benefit: Not applicable.
County & Municipal OtherEmployees’ Pension Plan
Plan Description and Eligibility: County &Municipal Other Employees’ Pension Plan is a cost-sharing multiple-employer definedbenefit plan that covers employees of countiesor municipalities which have become part ofthe Plan.
Service Benefits: 1/60th of final average monthlycompensation multiplied by years of creditedservice, subject to maximum limitations. For thisplan, final average monthly compensation is themonthly average of the highest five years ofcompensation.
Vesting: 5 years of credited service.
Retirement: Age 62 with 5 years of creditedservice; age 60 with 15 years of credited service;or after 30 years of credited service.
Disability Benefits: Same as Service Benefits.Employee must have 5 years of credited service.
Survivor Benefits: If employee is receiving apension, then eligible survivor receives aminimum of 50% of pension; if employee isactive, eligible survivor receives 50% of pensionthe employee would have received at age 62.
Finan
cial
Sectio
n
DPERS 47th Comprehensive Annual Financial Report32
Contributions:Employer - determined by Board of PensionTrustees. Employer contributions were 7.1%and 6.8% of earnings for the Fiscal Year 2018and 2017, respectively.Member - 3% of earnings in excess of $6,000.
Burial Benefit: Not applicable.
Delaware Volunteer Firemen’s Fund
Plan Description and Eligibility: The DelawareVolunteer Firemen’s Fund is a cost-sharingmultiple-employer defined benefit pension planthat covers all actively participating volunteers offire departments, ladies auxiliaries, or ambulanceorganizations within the State of Delaware.
Service Benefits: $5 multiplied by years of creditedservice (not to exceed 25 years) per month.
Vesting: 10 years of credited service.
Retirement: Age 60 with 10 years credited service.
Disability Benefits: Not applicable.
Survivor Benefits: Not applicable.
Contributions:Employer - determined by Board of PensionTrustees. Employer contributions were $450.30and $431.53 per member for the Fiscal Year of2018 and 2017, respectively.Volunteer Member - $60 per member percalendar year.
Burial Benefit: Not applicable.
Diamond State PortCorporation Plan
Plan Description and Eligibility: The DiamondState Port Corporation Pension Plan is a single-employer defined benefit plan which covers allemployees of the Diamond State PortCorporation.
Service Benefits: 1.75% of final average monthlycompensation multiplied by the years ofcredited service (not to exceed 30 years). For this plan, final average monthlycompensation is the monthly average of thehighest consecutive five years of compensationwithin the last ten years of employment.
Vesting: 5 years of credited service.
Retirement: Age 65 with 5 years of creditedservice; or age (not less than 55 years) pluscredited service equals 90.
Disability Benefits: Same as Service Benefits.Employee must have 15 years of creditedservice.
Survivor Benefits: If employee is receiving apension, the eligible survivor receives 50% ofpension; if employee is active with at least 15 years of credited service, then eligiblesurvivor receives 50% of pension the employeewould have received at age 65.
Contributions:Employer - determined by the Board of PensionTrustees. Employer contributions were 8.4%and 9.4% of earnings for the Fiscal Year 2018and 2017, respectively.Member - 2% of compensation.
Burial Benefit: Not applicable.
Plan Status: Frozen as of October 3, 2018.
New Participants: N/A
Payroll Contributions: N/A
Vesting: Automatic for all employer contributionsup to date of freeze.
Benefits/Refunds: Processed in accordance withexisting plan provisions.
Closed State Police Pension Plan
Plan Description and Eligibility: The ClosedState Police Pension Plan is a single-employerdefined benefit plan that covers all State policeofficers appointed before July 1, 1980.
Survivor Benefits: If employee is active or isreceiving a service or service-related disabilitypension, the eligible survivor receives 75% ofpension; if employee is receiving a non-servicerelated disability pension, eligible survivorreceives 50% of pension.
Contributions:Employer - The Closed State Police Plan isfunded on a pay-as-you-go basis.
Burial Benefit: $7,000 per member.
Finan
cial
Sectio
n
DPERS 47th Comprehensive Annual Financial Report 33

2. Fund Descriptions and Contributions
County & Municipal Police and Firefighters’ COLA FundDuring 1990, the State of Delaware established a mechanism for funding post-retirement increasesgranted by employers who participate in the County & Municipal Police and Firefighters’ Pension Planand manage a non-DPERS system “closed” pension plan for former employees.
Closed pension groups pertain to employees, for whom the employer elected not to become a part ofthe system when their employers joined the system. Currently, five employers maintain such closedgroups. They include City of Dover, City of Elsmere, City of New Castle, City of Wilmington and NewCastle County.
The COLA Fund is financed through a 0.25% tax on the value of certain homeowners’ insurancepremiums written within the State. The proceeds of the tax are directed into the Fund on a semi-annualbasis and are managed by the Board of Pension Trustees (Board) for investment purposes. Unusedamounts revert to the State General Fund after a period of 10 years per 80 Del. C419. Each participatingemployer receives an allocation of these contributions, earnings on investments of the Fund andexpenses attributed to the Fund based on the headcount of retired members of its police force.
Any new employer, with a closed police pension plan, that joins the system is eligible to receive moneyfrom the COLA Fund (“Fund”). In accordance with 18 Del. C. S708(c), when a participating employergrants a post-retirement increase for a closed plan outside of the County & Municipal Police andFirefighters’ Pension Plan, funds are transferred from the Fund to the trust account(s) of the closedpension group maintained by the employer. However, the entity must first provide 25% of the costestimated by an actuary while the Fund provides the remaining 75% of the cost.
These increases are not the responsibility of DPERS. Each employer entity is solely responsible for anypost-retirement increase granted even if the actuarial cost calculated at the onset of the increase exceedsthe employer’s share of the Fund’s balance. There is no joint liability amongst existing employers.
Post-Retirement Increase FundThe State of Delaware passed legislation which established a mechanism for funding ad hoc post-retirement increases granted by the General Assembly to members retired under the State Employees’Plan, the New State Police Plan, and the Judiciary Plans (Closed and Revised) beginning in Fiscal Year1994. The mechanism allows the State to appropriate actuarially determined employer contributions toa separate Post-Retirement Increase Fund (PRI) managed by the Board. With the exception of the ClosedState Police Plan, projected benefit payments do not include the effects of projected ad hoc cost-of-livingadjustments (ad hoc COLAs) as they are not substantively automatic. The primary considerationsrelevant to making this determination include the historical pattern of granting the changes and theconsistency in the amounts of the changes. The actuary uses the current actuarial assumptions, methods,and population data to calculate the estimated additional liability resulting from granted ad hoc benefitincreases. When the Legislature grants an ad hoc post-retirement adjustment, funds are transferred fromthis PRI Fund on a monthly basis based on a five-year actuarial funding schedule to the appropriatepension plan from which the additional benefits are disbursed. For the Fiscal Year ended June 30, 2018,$10.9 million was transferred to the appropriate plans in the System.
As of June 30, 2018, recently granted post-retirement increases have outstanding liabilities totaling$17.1 million, which are anticipated to be funded by the State and transferred to the appropriate plansover the next two fiscal years as follows:
Fiscal Year 2019 $ 11,300,400Fiscal Year 2020 $ 5,833,800
The Board adopts actuarially determined funding for the Post-Retirement Increase Fund. Funding forFiscal Year 2018 was 0.54% of covered payroll. Funding for Fiscal Year 2019 will be 0.53%.
Finan
cial
Sectio
n
DPERS 47th Comprehensive Annual Financial Report34

Local Government Retirement Investment PoolIn June 1996, the State of Delaware established the Delaware Local Government Retirement InvestmentPool (DELRIP) in the custody of the Board to allow local governments within the State of Delawarethe option to pool their pension assets with the System for investment purposes. The DELRIP is anexternal investment pool that allows local governments to potentially maximize their rate of return andreduce administrative expenses related to the investment of funds. Participation in the pool isvoluntary. There were two participating entities in DELRIP as of June 30, 2018, which comprise thepool in its entirety: Sussex County and the Town of Newport.
DELRIP is subject to the oversight of the System’s Investment Committee and not subject to theregulatory oversight of the Securities and Exchange Commission (SEC). The System has not providedor obtained any legally binding guarantees during the year to support the value of shares. The fairvalue of the pool is determined in the same manner as the value of the Master Trust shares (see pages37-39). Since this pool is a portion of the total System, the same accounting and investment policiesdescribed in the following financial footnotes apply.
3. Summary of Significant Accounting PoliciesThe accompanying financial statements of the Delaware Public Employees’ Retirement System (DPERSor the System) have been prepared in conformity with Accounting Principles Generally Accepted in theUnited States (GAAP) as prescribed by the Governmental Accounting Standards Board (GASB).
Basis of AccountingThe financial statements are presented on the accrual basis. Employer contributions to each plan arerecognized when due pursuant to legal requirements. Benefits and refunds are recognized when dueand payable in accordance with the terms of each Plan or Fund.
The accompanying financial statements include certain prior year summarized comparativeinformation. Such information does not include sufficient detail to constitute a presentation inconformity with U.S. generally accepted accounting principles.
Method Used to Estimate ValuesManagement of the System has made certain estimates and assumptions relative to the reporting ofassets and liabilities, and the disclosure of contingent assets and liabilities, to prepare these financialstatements in conformity with U.S. generally accepted accounting principles. Actual results could differfrom those estimates.
Administrative ExpensesGeneral expenses for the administration of the System are budgeted and approved as part of the annualState budget process and are paid from the assets of the System. Expenses for some professionalservices, including outside legal counsel, auditor, investment manager, investment advisor, and actuarialservices are paid directly from the System. In addition, the Board reviews and approves proposals forone-time, special projects as they arise. The cost of administrative expenses for the System are financedthrough plan contributions and investment earnings.
4. Fair Value MeasurementsAll of the investment assets of the Plans and Funds, with the exception of the Delaware VolunteerFiremen’s Fund (which is a length of service award plan), are pooled and invested in a common MasterTrust. Each of the Plans or Funds described herein shares in the Master Trust based on funds contributedand earnings/(losses) allocated. The investment assets of the Delaware Volunteer Firemen’s Fund areseparately invested in a short-term investment fund, and in domestic equity, domestic fixed income, andinternational stock index funds.
Finan
cial
Sectio
n
DPERS 47th Comprehensive Annual Financial Report 35

Pooled investments are funds wherein the System owns units or shares of commingled equity, fixedincome, and cash funds. These investments are redeemable with the underlying funds at net assetvalues (NAV) under the terms of the partnership agreements and/or subscription agreements. As ofJune 30, 2018, fixed income items classified as cash equivalents include $34.8 million in short-terminvestments and $670.2 million in pooled investments. The fair value of other pooled investmentstotaled $3,337.0 million. The asset allocation (in millions) was $1,226.1 in domestic fixed income,$1,235.6 in domestic equity, and $875.3 in international equity.
Alternative investments are ownership interests in investment limited partnerships or private LLCs,some of which may be illiquid. As of June 30, 2018, alternative investment values of $2,465.9 millionrepresent 24.4% of the System’s net position.
The fair value of the System’s investments is defined as the price that would be received to sell anasset or paid to transfer a liability in an orderly transaction between market participants at themeasurement date. Fair values for fixed income and equity securities are derived from publishedmarket prices and quotations from national security exchanges or security pricing vendors. Wherepublished prices, quotations, or vendor prices are not available, alternate valuation methods are used.
The System categorizes its fair value measurements within the fair value hierarchy established by generallyaccepted accounting principles. The hierarchy is based on the valuation inputs used to measure the fairvalue of the asset. Level 1 inputs are quoted prices in active markets for identical assets; Level 2 inputsare significant other observable inputs; Level 3 inputs are significant unobservable inputs.
In instances where inputs used to measure fair value fall into different levels in the above fair valuehierarchy, fair value measurements in their entirety are categorized based on the lowest level input thatis significant to the valuation. The System’s assessment of the significance of particular inputs to thesefair value measurements requires judgment and considers factors specific to each asset or liability
Equity and Fixed Income securities classified in Level 1 are valued using prices quoted in active marketsfor those securities.
Equity securities classified in Level 2 are valued using the latest available estimates of price bids oractual price bids quoted in active and inactive markets for those securities.
Fixed Income securities and pooled investments classified in level 2 are valued using other inputsincluding, but not limited to, interest rates and yield curves that are observable at commonly quotedintervals as well as the latest available estimates of price bids or actual bids quoted in active and inactivemarkets for those, or similar, securities.
Fixed Income securities classified in level 3 are privately placed subordinated notes, valued using adiscounted cash flow model. Unobservable inputs include projected cash flows and the discount rate.
Pooled investments classified in Level 1 of the fair value hierarchy are investments in open-end, non-exchange-traded mutual funds for which fair value per share (unit) is determined and published andis the basis for current transactions. These securities are valued at their NAV on the date of valuation,and are classified as Level 1 in the fair value hierarchy since they may be purchased or sold at theirpublically quoted NAV on the date of valuation.
Finan
cial
Sectio
n
DPERS 47th Comprehensive Annual Financial Report36
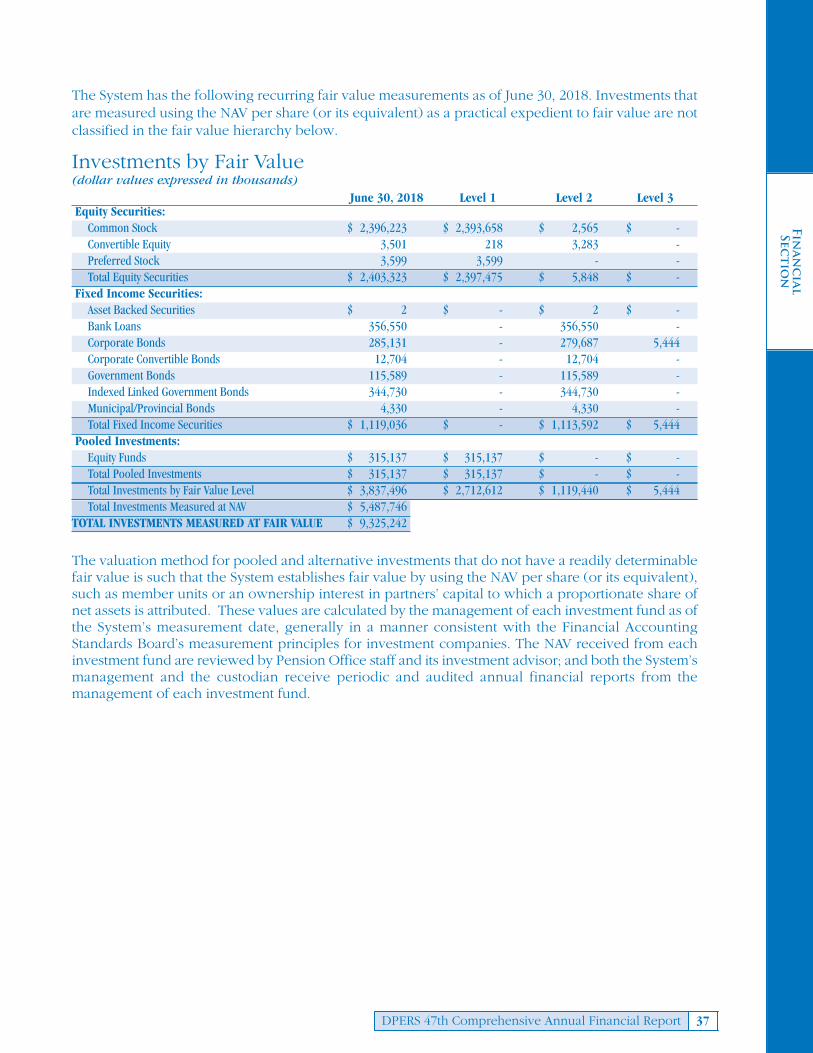
The System has the following recurring fair value measurements as of June 30, 2018. Investments thatare measured using the NAV per share (or its equivalent) as a practical expedient to fair value are notclassified in the fair value hierarchy below.
Investments by Fair Value(dollar values expressed in thousands)
June 30, 2018 Level 1 Level 2 Level 3Equity Securities:Common Stock $ 2,396,223 $ 2,393,658 $ 2,565 $ - Convertible Equity 3,501 218 3,283 - Preferred Stock 3,599 3,599 - - Total Equity Securities $ 2,403,323 $ 2,397,475 $ 5,848 $ -
Fixed Income Securities:Asset Backed Securities $ 2 $ - $ 2 $ - Bank Loans 356,550 - 356,550 - Corporate Bonds 285,131 - 279,687 5,444 Corporate Convertible Bonds 12,704 - 12,704 - Government Bonds 115,589 - 115,589 - Indexed Linked Government Bonds 344,730 - 344,730 -Municipal/Provincial Bonds 4,330 - 4,330 - Total Fixed Income Securities $ 1,119,036 $ - $ 1,113,592 $ 5,444
Pooled Investments:Equity Funds $ 315,137 $ 315,137 $ - $ - Total Pooled Investments $ 315,137 $ 315,137 $ - $ - Total Investments by Fair Value Level $ 3,837,496 $ 2,712,612 $ 1,119,440 $ 5,444Total Investments Measured at NAV $ 5,487,746
TOTAL INVESTMENTS MEASURED AT FAIR VALUE $ 9,325,242
The valuation method for pooled and alternative investments that do not have a readily determinablefair value is such that the System establishes fair value by using the NAV per share (or its equivalent),such as member units or an ownership interest in partners’ capital to which a proportionate share ofnet assets is attributed. These values are calculated by the management of each investment fund as ofthe System’s measurement date, generally in a manner consistent with the Financial AccountingStandards Board’s measurement principles for investment companies. The NAV received from eachinvestment fund are reviewed by Pension Office staff and its investment advisor; and both the System’smanagement and the custodian receive periodic and audited annual financial reports from themanagement of each investment fund.
Finan
cial
Sectio
n
DPERS 47th Comprehensive Annual Financial Report 37

The System has the following recurring NAV measurements as of June 30, 2018. Excluded from pooledinvestments below is a short-term stable value fund that the System classifies as Cash Equivalents inthe amount of $670.2 million. At year end, the NAV, unfunded commitments, and redemption terms areas follows:
Investments Measured at NAV(dollar values expressed in thousands)
Redemption RedemptionUnfunded Frequency Notice
Fair Value Commitments(1) (if currently available) PeriodPooled Investments:Equity Funds $ 1,795,772 - Daily, Monthly 1 to 12 days Fixed Income Funds 1,226,077 - Daily 1 day Total Pooled Investments(2) $ 3,021,849
Alternative Investments:Funds Primarily Invested in Public SecuritiesCredit/Distressed Debt Focused Multi-Strategy(3) $ 174,685 $ - Quarterly, Annual 90 days Equity Focused Strategy(4) 61,442 - Annual 45 to 90 days Multi Strategy(5) 189,409 - Monthly 5 days
Funds Primarily Invested in Private Securities(6)
Buyout $ 215,288 $ 159,618 International 409,415 95,987 Private Debt 52,712 63,156 Private Equity 1,059,450 271,750 Real Assets 303,496 116,509
Total Alternatives $ 2,465,897 Total Investments Measured at NAV $ 5,487,746
1. Unfunded Commitments. The System has commitments to invest additional amounts, to be drawndown as called upon at any time during the term of each relationship. The lengths of these terms arediscussed below. Generally, these commitments are self-funding; in that the capital calls are met usingcash flows generated by distributions received from alternative investment funds as the underlyinginvestments of the funds are liquidated.
2. Pooled Investments. This type includes four index tracking funds, four global value equity funds, andone short-term investment fund. The index funds maintain a portfolio constructed to match or track thecomponents of the following market indices: S&P 500, Russell 1000 Value, Barclays Capital U.S High Yield,and the Barclays Capital U.S. Aggregate. The global value equity funds invest in both U.S. and non-U.S.equities, seeking quality companies that are attractively valued and have growth potential. The short-term investment fund is a stable-value (money market-like) investment vehicle for cash reserves, whichthe System classifies as Cash Equivalents. It is managed by the System’s Custodian to offer a competitiverate of return through a portfolio of obligations of the U.S. Government, its agencies or instrumentalities,and related money market instruments. Principal preservation and liquidity management are the primeobjectives.
3. Credit/Distressed Debt Focused Strategy. This type includes three funds that engage in multipleinvestment strategies across the credit spectrum, with the objective of achieving superior risk-adjustedreturns through opportunistic investment. The composite portfolio for this type includes investments indistressed corporate securities, convertible hedging, residential and consumer debt, real estate debt, mergerarbitrage, and real estate. In limited circumstances, these funds have the ability to impose a suspension orpostponement of redemptions (a “gate”), or in the case of a withdrawal greater than 90% they may holdup to 10% of the redemption amount (a “holdback”) until the completion of the funds’ annual audit. Therehave been no gates imposed during the reporting period. These funds may also segregate a portion of theportfolio, commonly illiquid securities with no active market, from other investments of the portfolio (a
Finan
cial
Sectio
n
DPERS 47th Comprehensive Annual Financial Report38

“side pocket”). Investments in a side pocket are redeemable only upon liquidation of the underlying assetsin the side pocket. Investments representing approximately 11% of the value of the investments in this typeare held in side pockets. Investments representing approximately 3% of the value of the investments inthis type cannot be redeemed because the investments include restrictions (a “lock-up”) that do not allowfor initial redemption in the first 24-36 months after acquisition, with a rolling two-year lock-up thereafter.The remaining restriction period for these investments was 15 months at June 30, 2018.
4. Equity Focused Strategy.This type includes two funds that engage in a fundamental equity investing strategy.The composite portfolio for this type invests both long and short primarily in global common stocks, but alsoin debt, credit, private equity, derivative and other financial instruments. In limited circumstances, these fundshave the ability to impose a gate, or in the case of a withdrawal greater than 95% they may hold back up to5% of the redemption amount until the completion of the funds’ annual audit. These funds may also segregatea portion of the portfolio in a side pocket. Investments in a side pocket are redeemable only upon liquidationof the underlying assets in the side pocket. Investments representing approximately 49% of the value of theinvestments in this type are held in side pockets. Investments representing approximately 100% of the valueof the investments in this type cannot be redeemed because the investments include an initial lock-up that doesnot allow for redemption in the first five years after acquisition. The remaining restriction period for theseinvestments is approximately 27 months at June 30, 2018.
5. Multi-Strategy. This type of fund is such that may invest in a wide range of asset classes in order to meetfund objectives. In limited circumstances, this fund has the ability to impose a suspension or postponementof redemptions (a “gate”), or in the case of a withdrawal greater than 90%; may hold back 10% forapproximately 15 days while the fund NAV is being finalized. There have been no gates imposed duringthe current reporting period.
6. Funds Primarily Invested in Private Securities. These investments can never be redeemed with thefunds. Instead, the nature of the investments in these types is that distributions are received through theliquidation of the underlying assets of the funds. It is expected that the underlying assets of the funds willbe liquidated over the next 1 to 14 years. The strategy of each type is as follows:
Buyout. This type includes three funds that make equity investments in mature, private companies.
International. This type includes 13 funds that invest in private equity and buyout strategiesoperating principally outside of the U.S.
Private Debt. This type includes seven funds that invest in debt or equity securities of financiallystressed (distressed) companies, as well as convertible bonds and subordinated debtin private companies.
Private Equity. This type includes 46 funds that invest in the equity securities of growing privatecompanies, primarily in the technology and healthcare sectors.
Real Assets. This type includes six funds that invest in commercial real estate and private energycompanies including commercial real estate, exploration and production, midstream,power and services businesses.
Finan
cial
Sectio
n
DPERS 47th Comprehensive Annual Financial Report 39

5. Net Pension Liability of Employers
The components of the Net Pension Liability/(Asset) of each Plan as of June 30, 2018 were as follows:(dollar values expressed in thousands)
(4)Plan Fiduciary (6)Net PensionNet Position Liability/(Asset)
(2)Plan (3)Employers’ as a % of the (5) as a % of(1)Total Fiduciary Net Pension Total Pension Covered CoveredPension Net Liability/(Asset) Liability Employee Payroll
Plan Liability Position (1) - (2) (2)/(1) Payroll (3)/(5)
State Employees’ $10,319,912 $ 9,028,447 $1,291,465 87.5% $ 1,985,446 65.0%
Special 121 195 (74) 161.2% N/A N/A
New State Police 529,104 472,170 56,934 89.2% 62,360 91.3%
Judiciary 80,284 84,296 (4,012) 105.0% 10,629 (37.7%)
County & MunicipalPolice and Firefighters’ 390,500 367,470 23,030 94.1% 83,049 27.7%
County & Municipal Other Employees’ 56,269 53,122 3,147 94.4% 39,856 7.9%
Diamond State PortCorporation 37,637 33,601 4,036 89.3% 14,022 28.8%
Closed State Police+ 377,627 4,726 372,901 1.3% N/A N/A
UAALActive Per Active
Members++ Member++
DelawareVolunteer Firemen’s $ 34,099 $ 20,531 $ 13,568 60.2% 4,479 $3,029
+ The Closed State Police Plan is a pay-as-you-go plan.++Not expressed in thousands.
The Schedule of Changes in Net Pension Liability, presented on pages 51-59 is required supplementaryinformation (RSI) following the Notes to the Financial Statements.
Finan
cial
Sectio
n
DPERS 47th Comprehensive Annual Financial Report40

6. Plan Actuarial Assumptions
The total pension liability was determined by an actuarial valuation as of June 30, 2017, and updateprocedures were used to roll forward the total pension liability to June 30, 2018. The followingactuarial assumptions were used, applied to all periods included in the measurement:
State New State Closed StatePlan Employees’ Special Police Judiciary Police
Actuarial Assumptions:
Investment rate of return/Discount rate(1) 7.0% 7.0% 7.0% 7.0% 3.87%
Projected Salary Increases(1) 2.5% + Merit N/A 2.5% + Merit 2.5% + Merit N/A
Cost-of-living adjustments 0.0% 0.0% 0.0% 0.0% 2.5%
County & County &Municipal Municipal Delaware DiamondPolice and Other Volunteer State Port
Plan Firefighters’ Employees’ Firemen’s Corporation
Actuarial Assumptions:
Investment rate of return/Discount rate(1) 7.0% 7.0% 7.0% 7.0%
Projected Salary Increases(1) 2.5% + Merit 2.5% + Merit N/A 2.5% + Merit
Cost-of-living adjustments 0.0% 0.0% 0.0% 0.0%
(1) Inflation is included at 2.5%.
The total pension liabilities are measured based on assumptions pertaining to the interest rates,inflation rates and employee demographic behavior in future years. It is likely that future experiencewill not exactly conform to these assumptions. To the extent that actual experience deviates fromthese assumptions, the emerging liabilities may be higher or lower than anticipated. The more theexperience deviates the larger the impact on future financial statements.
Mortality assumptions are based on the RP-2014 tables with gender adjustments for healthy annuitantsand disabled retirees and an adjusted version on MP-2015 mortality improvement scale on a fullygenerational basis.
With the exception of the Closed State Police Plan, projected benefit payments do not include theeffects of projected ad hoc cost-of-living adjustments (ad hoc COLAs) as they are not substantivelyautomatic. The primary considerations relevant to making this determination include the historicalpattern of granting the changes and the consistency in the amounts of the changes.
The long-term expected rate of return on pension plan investments was determined using a building-block method in which best-estimate ranges of expected future real rates of return (expected returns,net of investment expense and inflation) are developed for each major asset class. These ranges arecombined to produce the long-term expected rate of return by weighting the expected future realrates of return by an asset allocation percentage which is based on the nature and mix of current andexpected plan investments, and by adding expected inflation. Best estimates of geometric real ratesof return for each major asset class included in the System’s current and expected asset allocation asof June 30, 2018 are summarized in the following table:
Finan
cial
Sectio
n
DPERS 47th Comprehensive Annual Financial Report 41

Long-Term ExpectedAsset Class Real Rate of Return
Domestic Equity 5.7%
International Equity 5.7
Fixed Income 2.0
Alternative Investments 7.8
Cash & Equivalents ---
Discount rate. The discount rate for all plans, except Closed State Police, used to measure the totalpension liability was 7.0 percent. The projection of cash flows used to determine the discount rateassumed that contributions from plan members will be made at the current contribution rates and thatcontributions from employers will be made at rates determined by the Board of Pension Trustees,actuarially determined. Based on those assumptions, the pension plans’ fiduciary net position wasprojected to be available to make all projected future benefit payments of current plan members.Therefore, the long-term expected rate of return on pension plan investments was applied to all periodsof projected benefit payments to determine the total pension liability.
The Closed State Police Plan used a discount rate of 3.87%, which represents the 20-year AA MunicipalBond rate since this plan is pay as you go.
Sensitivity of the net pension liability/(asset) to changes in the discount rate. The following presents thenet pension liability/(asset) of the Plans, calculated using the discount rate of 7.0 percent (3.87% forClosed State Police), as well as what the Plans’ net pension liability/(asset) would be if it were calculatedusing a discount rate that is 1-percentage-point lower or 1-percentage-point higher than the current rate:
(dollar values expressed in thousands)
1% Decrease Discount Rate 1% Increase
Plans (6.0%) (7.0%) (8.0%)
State Employees’ $2,506,229 1,291,466 271,487
Special Fund (68) (74) (79)
Judiciary Pension 3,459 (4,011) (10,477)
New State Police 128,830 56,934 (2,513)
County and Municipal P&F 84,424 23,031 (26,664)
County and Municipal Other 11,893 3,147 (3,917)
Delaware Volunteer Fire 17,388 13,567 10,329
Closed State Police 417,317 372,902 337,898
Diamond State Port Corporation 8,846 4,035 (31)
Total $3,178,318 1,760,997 576,033
Finan
cial
Sectio
n
DPERS 47th Comprehensive Annual Financial Report42
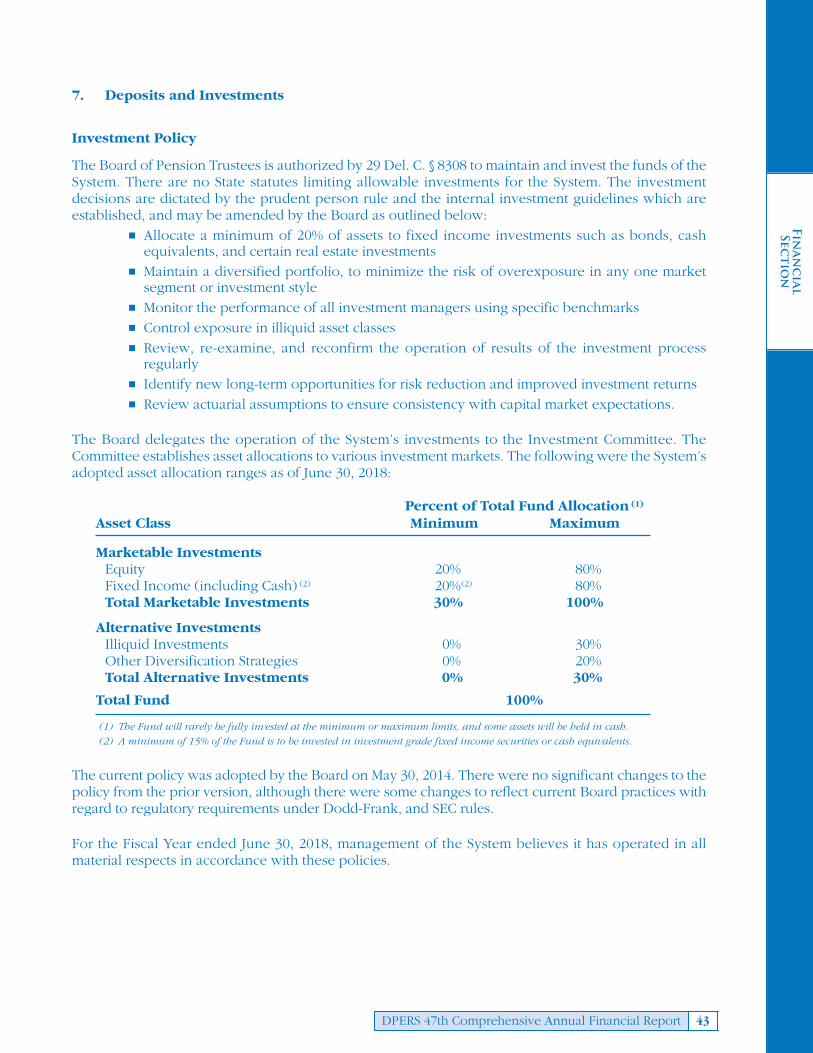
7. Deposits and Investments
Investment Policy
The Board of Pension Trustees is authorized by 29 Del. C. § 8308 to maintain and invest the funds of theSystem. There are no State statutes limiting allowable investments for the System. The investmentdecisions are dictated by the prudent person rule and the internal investment guidelines which areestablished, and may be amended by the Board as outlined below:
� Allocate a minimum of 20% of assets to fixed income investments such as bonds, cashequivalents, and certain real estate investments
� Maintain a diversified portfolio, to minimize the risk of overexposure in any one marketsegment or investment style
� Monitor the performance of all investment managers using specific benchmarks� Control exposure in illiquid asset classes� Review, re-examine, and reconfirm the operation of results of the investment process
regularly� Identify new long-term opportunities for risk reduction and improved investment returns� Review actuarial assumptions to ensure consistency with capital market expectations.
The Board delegates the operation of the System’s investments to the Investment Committee. TheCommittee establishes asset allocations to various investment markets. The following were the System’sadopted asset allocation ranges as of June 30, 2018:
Percent of Total Fund Allocation (1)
Asset Class Minimum Maximum
Marketable InvestmentsEquity 20% 80%Fixed Income (including Cash) (2) 20%(2) 80%Total Marketable Investments 30% 100%
Alternative InvestmentsIlliquid Investments 0% 30%Other Diversification Strategies 0% 20%Total Alternative Investments 0% 30%
Total Fund 100%
(1) The Fund will rarely be fully invested at the minimum or maximum limits, and some assets will be held in cash.
(2) A minimum of 15% of the Fund is to be invested in investment grade fixed income securities or cash equivalents.
The current policy was adopted by the Board on May 30, 2014. There were no significant changes to thepolicy from the prior version, although there were some changes to reflect current Board practices withregard to regulatory requirements under Dodd-Frank, and SEC rules.
For the Fiscal Year ended June 30, 2018, management of the System believes it has operated in allmaterial respects in accordance with these policies.
Finan
cial
Sectio
n
DPERS 47th Comprehensive Annual Financial Report 43

Within the broad asset allocation ranges noted above, the System does not rebalance to a specifictarget allocation. While the System does not utilize a target allocation approach, the following is theaverage asset allocation for the 10-year period ended June 30, 2018, which is representative of thenature and mix of current and expected System investments.
Asset Class 10-year Average Allocation
Domestic Equity 34.0%International Equity 13.1%Fixed Income 24.7%Cash & Short-Term 5.6%Alternative Investments 22.6%
–––––100.0%
Rate of Return
The money-weighted rate of return expresses investment performance, net of investment expense,adjusted for the changing amounts actually invested. For the year ended June 30, 2018, the annualmoney-weighted rates of return on pension plan investments, net of pension plan investmentexpenses, were as follows:
Plan Money-Weighted Rate
State Employees' 10.4%Special 10.3%New State Police 10.4%Judiciary 10.4%County & Municipal Police and Firefighters' 10.4%County & Municipal Other Employees' 10.4%Delaware Volunteer Firefighters 6.9%Diamond State Port Corporation 10.4%County & Municipal COLA 10.0%Post-Retirement Increase Fund 10.8%DELRIP-Sussex Co. 10.1%DELRIP-Newport 10.4%Closed State Police 10.4%
Securities Lending
Effective October 15, 2013, the System entered into a security lending agreement with its custodian bank,which acts as security lending agent for the System. The objective of securities lending is to earn incomethrough a conservatively operated and well-controlled program. The custodian is authorized to lendsecurities within the borrower limits and guidelines established by the System. The System lends fixedincome, domestic equity, and international equity securities to approved broker/dealers. Collateral forsecurities loaned equals 102 percent of fair market value for domestic securities and 105 percent forinternational securities.
The only types of collateral received from borrowers are obligations issued by the U.S. Government. Allrights of ownership to securities pledged as collateral remain with the borrower except in the event ofdefault. The System has the authority to sell collateral securities only upon a borrower default. As ofJune 30, 2018, there were no violations of legal or contractual provisions. The System has not experiencedany losses resulting from the default of a borrower or lending agent during the year ended June 30, 2018.
At year-end, the System has no credit risk exposure to borrowers because the amounts the System owesthe borrowers exceed the amounts the borrowers owe the System. The contract with the System’scustodian requires it to indemnify the System if the borrowers fail to return the securities or fail to paythe System for income distributions by the securities’ issuers while the securities are on loan. The Systemmanages its market risk by recording investments at fair value daily and maintaining the value of the
Finan
cial
Sectio
n
DPERS 47th Comprehensive Annual Financial Report44

collateral held by the System in excess of the value of the securities loaned. As of June 30, 2018, the fair valueof securities on loan was $129.5 million. The associated collateral was $132.9 million.
All open security loans can be terminated on demand by either the System or borrower. The collateral is valuedat fair value obtained from independent pricing services.
Investments
The following is a listing of fixed income investments and cash equivalents and related maturity schedulewhich shows the System’s exposure to interest rate risk as of June 30, 2018. The System holds $1,046.0 millionin domestic fixed income and $80.4 million in foreign fixed income instruments. The table below also includes$670.2 million in pooled stable value fund, $34.8 million in short term bills and notes collectively reported ascash equivalents, and $1,226.0 million in pooled fixed income investments. These are reported on theStatement of Fiduciary Net Position, respectively, as cash and equivalents and pooled equity and fixedincome.
Investment Maturities (in Years) (expressed in thousands)Investment Type Fair Value Less than 1 1 - 6 6 - 10 10 +Asset Backed Securities $ 2 2 - - - Bank Loans 356,550 2,255 215,427 138,868 - Cash Equivalents 704,989 704,989 - - -Corporate Bonds 285,131 13,559 113,787 67,889 89,896 Corporate Convertible Bonds 12,704 1,513 8,108 397 2,686 Government Bonds 115,589 76,289 16,574 7,647 15,079 Index Linked Government Bonds 344,730 - 136,926 113,933 93,871 Municipal/Provincial Bonds 4,330 441 - - 3,889 Pooled Investments 1,226,077 - 130,915 1,095,162 -
Total: $ 3,050,102 799,048 621,737 1,423,896 205,421
Interest Rate Risk
The State has delegated investment policy for the System to the Board and its Committees. The InvestmentCommittee sets its own guidelines in conjunction with the Board to manage and review the System’s exposureto fluctuating interest rates. Interest rate risk is a consideration when establishing and reviewing investmentmanager guidelines and asset allocation. Both topics are included in the statement of Investment Policies andObjectives which are published on the System’s web site.
Custodial Credit RiskDepositsFor deposits, custodial credit risk is the risk that, in the event of the failure of a depository financialinstitution, the deposits or collateral securities may not be recovered from an outside party. At June30, 2018, the $770.9 million carrying amount of the System’s cash and cash equivalents was comprisedof $705.0 million of short-term investments and $65.9 million in deposits. Of the $65.9 million indeposits, $65.5 million was subject to custodial credit risk because it was held by outside institutionsand uninsured and uncollateralized. The remaining $0.4 million was held as pooled cash managementaccount by the State Treasurer's Office, which includes deposit accounts, short- and long-terminvestments.
InvestmentsCustodial credit risk for investments is the risk that, in the event of the failure of the counterparty to atransaction, the value of the investment or collateral securities that are in the possession of an outside partymay not be recovered. Investments are exposed to custodial credit risk if the securities are uninsured, arenot registered in the name of the government, and are held by either the counterparty or the counterparty’strust department or agent but not in the government’s name. The System’s investments are not exposed tocustodial credit risk as they are held by the System’s custodian in the name of the System or its nominee.
Finan
cial
Sectio
n
DPERS 47th Comprehensive Annual Financial Report 45

Credit Risk
The System’s general investment policy is to apply the prudent-person rule to all risks incurred by thefund. Investments are made as a prudent person would be expected to act, with discretion andintelligence, to seek reasonable income, preserve capital and, in general, avoid speculative investments.The System has no investment policy that would further limit its investment choices related to creditrisk. As of June 30, 2018, the System’s fixed income investments and cash equivalents had the followingcredit risk characteristics:
Ratings Detail by Security Type(expressed in thousands)
CorporateFixed Income Asset Backed Bank Cash Corporate ConvertibleSecurity Type Securities Loans Equivalents Bonds BondsAAA $ - $ - $ - $ 4,055 $ -Aaa - - 34,786 - -AA+ - - - 6,813 -AA- - - - 3,272 -A+ - - - 13,494 - A - - 670,203 2,043 - A- 2 - - 9,712 1,428BBB+ - - - 18,882 - BBB - - - 49,289 159 BBB- - 15,718 - 32,932 - BB+ - 5,789 - 16,964 - BB - 29,650 - 10,285 - Ba2 - 2,479 - - - BB- - 45,595 - 18,634 4,951 Ba1 - 652 - - -Ba3 - - - 518 - B+ - 38,736 - 26,080 -B1 - 3,475 - - - B - 70,265 - 18,241 - B2 - 2,675 - - - B- - 14,883 - 23,104 - CCC+ - 12,286 - 14,210 3,591 CCC - 6,883 - 5,427 - Caa2 - 105 - - - CCC- - - - 188 - CC - - - - - C - - - 1,394 -D - - - - - No Rating - 107,359 - 9,594 2,575 Total: $ 2 $ 356,550 $ 704,989 $ 285,131 $ 12,704
Finan
cial
Sectio
n
DPERS 47th Comprehensive Annual Financial Report46

(Continued)Index Linked Municipal/ Percentage
Fixed Income Government Government Provincial Pooled of TotalSecurity Type Bonds Bonds Bonds Investments Total Net PositionAAA $ 3,805 $ - $ 440 $ 1,095,162 $ 1,103,462 10.90%Aaa 99,390 344,730 - - 478,906 4.73%AA+ 803 - - - 7,616 0.08%AA- - - - - 3,272 0.03%A+ - - - - 13,494 0.13%A - - - - 672,246 6.64%A- 8,524 - - - 19,666 0.19%BBB+ - - - - 18,882 0.19%BBB - - - - 49,448 0.49%BBB- - - - - 48,650 0.48%BB+ - - - - 22,753 0.22%BB - - - 130,915 170,850 1.69%Ba2 251 - - - 2,730 0.03%BB- 2,816 - - - 71,996 0.71%Ba1 - - - - 652 0.01%Ba3 - - - - 518 0.01%B+ - - - - 64,816 0.64%B1 - - - - 3,475 0.03%B - - - - 88,506 0.87%B2 - - - - 2,675 0.03%B- - - 3,890 - 41,877 0.41%CCC+ - - - - 30,087 0.30%CCC - - - - 12,310 0.12%Caa2 - - - - 105 0.00%CCC- - - - - 188 0.00%CC - - - - - 0.00%C - - - - 1,394 0.01%D - - - - - 0.00%No Rating - - - - 119,528 1.18%Total: $ 115,589 $ 344,730 $ 4,330 $ 1,226,077 $ 3,050,102 30.12%
Investment Concentration RiskAs of June 30, 2018, the System held no concentration of investments (excluding pooled investments)in an individual issuer in excess of 5% of the fair value of the System's net position.
Management FeesIn addition to the $27.3 million paid in Manager/Advisor fees shown in the Statement of Changes inFiduciary Net Position, the System paid $31.9 million in management fees to the alternative investmentfunds and partnerships for the Fiscal Year ended June 30, 2018. These fees are netted againstinvestment income.
Foreign InvestmentsForeign investments include equity securities, bonds, and cash and cash equivalents. The followingis a listing of foreign assets included in the Statement of Fiduciary Net Position as of June 30, 2018. Thelisting includes $5.3 million of investments of domestic issuers which have been classified as domesticon the Statement of Fiduciary Net Position, but are denominated in a foreign currency.
Finan
cial
Sectio
n
DPERS 47th Comprehensive Annual Financial Report 47

Currency Risk(expressed in thousands)
Fair Value in Cash and CashCurrency U.S. Dollars Equities Fixed Income EquivalentsAustralian dollar $ 3,717 $ 2,446 $ 1,271 $ -
Brazilian real 5,932 3,116 2,816 -
British pound sterling 34,457 33,714 743 -
Canadian dollar 25,620 24,311 1,309 -
Danish krone 4,773 4,773 - -
Euro 99,970 96,231 3,591 148
Hong Kong dollar 10,480 10,480 - -
Indonesian rupiah 65,621 65,621 - -
Japanese yen 20,238 20,238 - -
Mexican peso 27,030 26,909 - 121
New Zealand dollar 12,115 3,856 8,259 -
Nigerian naira 2,864 - 2,864 -
Norwegian krone 1,647 1,647 - -
Philippine peso 3,805 - 3,805 -
Singapore dollar 26,882 26,876 - 6
South African rand 4,062 4,062 - -
South Korean won 2,451 2,451 - -
Swedish krona 14,754 14,754 - -
Swiss franc 7,970 7,970 - -
Thai baht 3,739 3,739 - -
Turkish lira 2,638 2,638 - -
Total Foreign Currencies $ 380,765 $ 355,832 $ 24,658 $ 275
Foreign issued investments denominated in U.S. Dollars 240,775 180,639 60,136 -
Pooled international investmentsdenominated in U.S. Dollars 1,278,813 1,278,813 - -
Total: $ 1,900,353 $ 1,815,284 $ 84,794 $ 275
Finan
cial
Sectio
n
DPERS 47th Comprehensive Annual Financial Report48
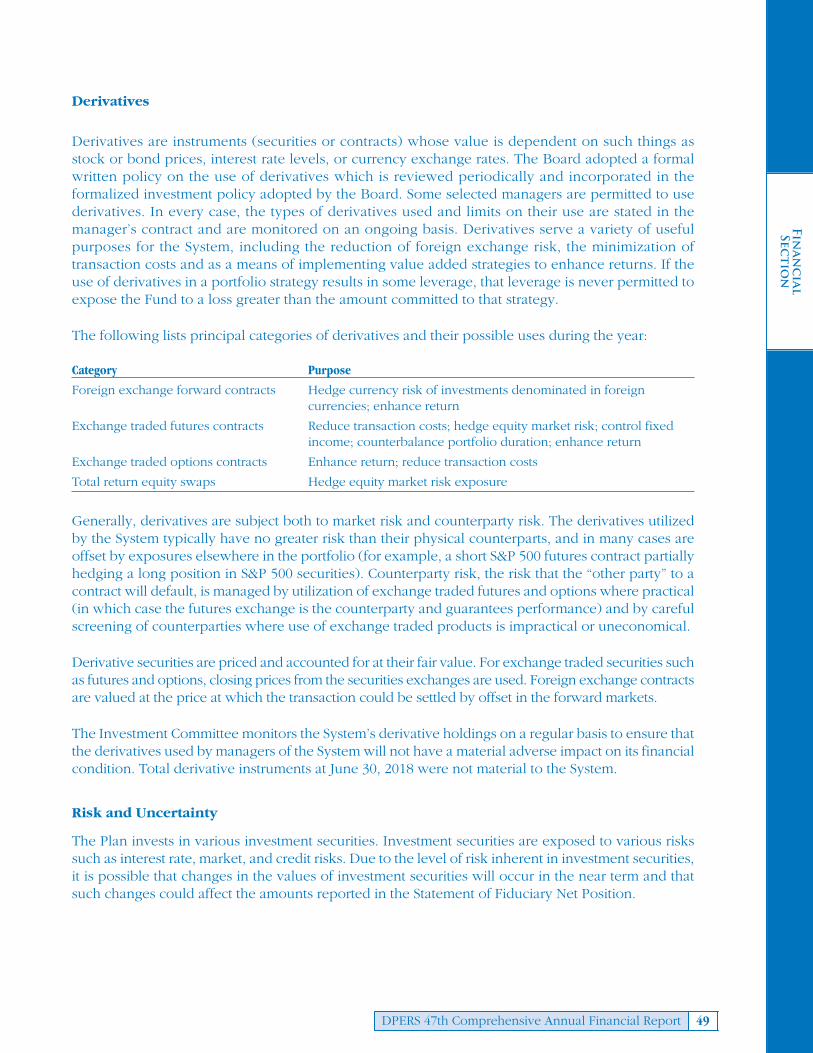
Derivatives
Derivatives are instruments (securities or contracts) whose value is dependent on such things asstock or bond prices, interest rate levels, or currency exchange rates. The Board adopted a formalwritten policy on the use of derivatives which is reviewed periodically and incorporated in theformalized investment policy adopted by the Board. Some selected managers are permitted to usederivatives. In every case, the types of derivatives used and limits on their use are stated in themanager’s contract and are monitored on an ongoing basis. Derivatives serve a variety of usefulpurposes for the System, including the reduction of foreign exchange risk, the minimization oftransaction costs and as a means of implementing value added strategies to enhance returns. If theuse of derivatives in a portfolio strategy results in some leverage, that leverage is never permitted toexpose the Fund to a loss greater than the amount committed to that strategy.
The following lists principal categories of derivatives and their possible uses during the year:
Category Purpose
Foreign exchange forward contracts Hedge currency risk of investments denominated in foreigncurrencies; enhance return
Exchange traded futures contracts Reduce transaction costs; hedge equity market risk; control fixedincome; counterbalance portfolio duration; enhance return
Exchange traded options contracts Enhance return; reduce transaction costs
Total return equity swaps Hedge equity market risk exposure
Generally, derivatives are subject both to market risk and counterparty risk. The derivatives utilizedby the System typically have no greater risk than their physical counterparts, and in many cases areoffset by exposures elsewhere in the portfolio (for example, a short S&P 500 futures contract partiallyhedging a long position in S&P 500 securities). Counterparty risk, the risk that the “other party” to acontract will default, is managed by utilization of exchange traded futures and options where practical(in which case the futures exchange is the counterparty and guarantees performance) and by carefulscreening of counterparties where use of exchange traded products is impractical or uneconomical.
Derivative securities are priced and accounted for at their fair value. For exchange traded securities suchas futures and options, closing prices from the securities exchanges are used. Foreign exchange contractsare valued at the price at which the transaction could be settled by offset in the forward markets.
The Investment Committee monitors the System’s derivative holdings on a regular basis to ensure thatthe derivatives used by managers of the System will not have a material adverse impact on its financialcondition. Total derivative instruments at June 30, 2018 were not material to the System.
Risk and Uncertainty
The Plan invests in various investment securities. Investment securities are exposed to various riskssuch as interest rate, market, and credit risks. Due to the level of risk inherent in investment securities,it is possible that changes in the values of investment securities will occur in the near term and thatsuch changes could affect the amounts reported in the Statement of Fiduciary Net Position.
Finan
cial
Sectio
n
DPERS 47th Comprehensive Annual Financial Report 49

8. Tax Status
The System currently operates seven of its plans as tax qualified governmental retirement plans underthe Internal Revenue Code (“IRC”). The seven plans include the State Employees’, New State Police,Judiciary, County & Municipal Police and Firefighters’, County & Municipal Other Employees’, andDiamond State Port Corporation, and Closed State Police (“Qualified Retirement Plans”). The InternalRevenue Service made favorable determinations by letters dated April 23, 2014 for the StateEmployees’, New State Police, Judiciary, County & Municipal Police and Firefighters’, County &Municipal Other Employees’, and April 28, 2014 for the Closed State Police that the QualifiedRetirement Plans are designed in accordance with applicable sections of the IRC. The Diamond StatePort Corporation received a favorable determination letter and compliance statement dated August 28,2014. The System and its tax counsel believe the Qualified Plans are designed and are currently beingoperated in compliance with the applicable provisions of the IRC. The favorable determination lettersfor the Qualified Retirement Plans are valid through January 31, 2019.
The Delaware Volunteer Firemen’s Fund (“Firemen’s Fund”) operates as a length of service awardplan under IRC section 457(e)(11). The Firemen’s Fund received a favorable private letter ruling fromthe Internal Revenue Service (“IRS”) on January 13, 2009.
Additionally, the System submitted a private letter ruling request in November 2012 with respect to theestablishment of the Delaware Public Employees' Retirement System Qualified Excess BenefitArrangement Plan and Trust, (“QEBA”). On June 16, 2015, the System received a favorable letter ruling,which concluded that the QEBA was a qualified excess benefit arrangement pursuant to Sec. 415(m)of the IRC, and that benefits payable pursuant to the plans will be includible in gross income in theyear that they are paid or otherwise become available to a participant or participant’s beneficiary, andthat income accruing to the QEBA plans is exempt from federal income tax as income derived froman essential government function.
9. Subsequent Events
During Fiscal Year 2018, the Board of Directors of the Diamond State Port approved a concessionagreement, which effectively transferred operations and ownership of the Port to GT USA Wilmington,LLC.
The System has developed a statement to provide information about accrued benefits to the employeesof Port Pension Plan. All employees are vested in employer contributions up to effective transactiondate and will have the option to cash out or retire at normal retirement age in the future. The Systemis working with our legal counsel on any plan resolutions required to be adopted by the Port’s Boardafter the transaction is finalized. The transaction was finalized on October 3, 2018.
While the system will no longer enroll new participants and process payroll contributions for the planafter the transaction date, the System is still responsible for the administration of pension benefits forretirees and refunds for vested employees. The Board of Directors of the Diamond State Port ishowever responsible for plan valuations used to determine the liability for these future benefits, andto provide funding for the pension liability.
In addition, the System will make a one-time pension supplement payment of approximately $10.9million to retirees of the State Employees, New State Police and Judicial Pension plans in November2018, pursuant to the provisions of section 10 of Senate Bill 236.
Finan
cial
Sectio
n
DPERS 47th Comprehensive Annual Financial Report50

Required Supplementary Information
Schedule 1 - Schedule of Changes in Net Pension Liability(dollar values expressed in thousands)(unaudited)
State Employees’ Plan
2018 2017 2016 2015 2014
Total Pension Liability:
Service Cost $ 197,184 $ 180,696 $ 180,782 $ 192,046 $ 190,156
Interest 696,055 676,524 656,475 627,925 599,144
Changes in Benefit Terms 11,028 4,814 - 54,191 -
Differences between Expected and 64,746 20,308 (25,340) (17,907) -
Actual experience
Changes in Assumptions - 211,698 167,454 - -
Benefit Payments, Including (628,938) (598,686) (569,492) (539,630) (509,818)
Refunds of Member Contributions
Net Change in Total Pension Liability $ 340,075 $ 495,354 $ 409,879 $ 316,625 $ 279,482
Total Pension Liability –Beginning (as reported) $ 9,979,837 $ 9,484,483 $ 9,074,604 $ 8,757,979 $ 8,478,498
Total Pension Liability – Ending (a) $10,319,912 $ 9,979,837 $ 9,484,483 $ 9,074,604 $ 8,757,980
Plan Fiduciary Net Position
Contributions – Employer $ 206,883 $ 186,625 $ 182,707 $ 178,293 $ 174,863
Contributions – Non-Employer 10,615 30,302 38,778 32,654 26,877
Contributions – Member 64,312 61,686 59,145 55,782 52,793
Net Investment Income 867,527 861,997 (137,038) 299,825 1,254,715
Benefit Payments, including refunds (628,938) (598,686) (569,492) (539,630) (509,818)
of Member Contributions
Administrative Expenses (5,781) (5,636) (5,895) (7,353) (5,242)
Net Change in Plan Fiduciary Net Position 514,618 536,288 (431,795) 19,571 994,188
Plan Fiduciary Net Position – Beginning $ 8,513,829 $ 7,977,541 $ 8,409,336 $ 8,389,765 $ 7,395,577
Plan Fiduciary Net Position – Ending (b) $ 9,028,447 $ 8,513,829 $ 7,977,541 $ 8,409,336 $ 8,389,765
Plan Net PensionLiability (Asset) – Ending (a)-(b) $ 1,291,465 $ 1,466,008 $ 1,506,942 $ 665,268 $ 368,215
Schedule is intended to show information for 10 years. Additional years will be displayed as they become available.
Finan
cial
Sectio
n
DPERS 47th Comprehensive Annual Financial Report 51

Required Supplementary Information
Schedule 1 - Schedule of Changes in Net Pension Liability (continued)(dollar values expressed in thousands)(unaudited)
Special Fund
2018 2017 2016 2015 2014
Total Pension Liability:
Service Cost $ - $ - $ - $ - $ -
Interest 9 10 14 14 15
Changes in Benefit Terms - - - - -
Differences between Expected and 11 (31) 24 18 -
Actual experience
Changes in Assumptions - 1 4 - -
Benefit Payments, Including (33) (27) (47) (46) (42)
Refunds of Member Contributions
Net Change in Total Pension Liability $ (13) $ (47) $ (5) $ (14) $ (27)
Total Pension Liability –Beginning (as reported) $ 134 $ 181 $ 186 $ 200 $ 227
Total Pension Liability – Ending (a) $ 121 $ 134 $ 181 $ 186 $ 200
Plan Fiduciary Net Position
Contributions – Employer $ - $ - $ - $ - $ -
Contributions – Non-Employer - - - - -
Contributions – Member - - - - -
Net Investment Income 21 22 (5) 10 48
Benefit Payments, including refunds (33) (27) (47) (46) (42)
of Member Contributions
Administrative Expenses (1) (1) (1) (1) (1)
Net Change in Plan Fiduciary Net Position (13) (6) (53) (37) 5
Plan Fiduciary Net Position – Beginning $ 208 $ 214 $ 267 $ 304 $ 299
Plan Fiduciary Net Position – Ending (b) $ 195 $ 208 214 $ 267 $ 304
Plan Net PensionLiability (Asset) – Ending (a)-(b) $ (74) $ (74) $ (33) $ (81) $ (104)
Schedule is intended to show information for 10 years. Additional years will be displayed as they become available.
Finan
cial
Sectio
n
DPERS 47th Comprehensive Annual Financial Report52

Required Supplementary Information
Schedule 1 - Schedule of Changes in Net Pension Liability (continued)(dollar values expressed in thousands)(unaudited)
New State Police
2018 2017 2016 2015 2014
Total Pension Liability:
Service Cost $ 14,833 $ 13,671 $ 13,493 $ 12,686 $ 12,378
Interest 35,226 33,038 30.376 28,395 26,137
Changes in Benefit Terms 105 - - 1,154 -
Differences between Expected and 2,054 8,657 (3,098) (3,520) -
Actual experience
Changes in Assumptions - 12,092 2,199 - -
Benefit Payments, Including (18,595) (16,714) (14,804) (12,188) (10,619)
Refunds of Member Contributions
Net Change in Total Pension Liability $ 33,623 $ 50,744 $ 28,166 $ 26,527 $ 27,896
Total Pension Liability –Beginning (as reported) $ 495,481 $ 444,737 $ 416,571 $ 390,044 $ 362,148
Total Pension Liability – Ending (a) $ 529,104 $ 495,481 $ 444,737 $ 416,571 $ 390,044
Plan Fiduciary Net Position
Contributions – Employer $ 13,202 $ 11,096 $ 11,001 $ 10,730 $ 10,500
Contributions – Non-Employer 316 649 797 639 525
Contributions – Member 4,329 4,233 4,146 4,121 3,862
Net Investment Income 44,454 42,584 (5,965) 13,741 54,635
Benefit Payments, including refunds (18,595) (16,714) (14,803) (12,188) (10,619)
of Member Contributions
Administrative Expenses (100) (88) (91) (113) (82)
Net Change in Plan Fiduciary Net Position 43,606 41,760 (4,915) 16,930 58,821
Plan Fiduciary Net Position – Beginning $ 428,564 $ 386,804 $ 391,719 $ 374,789 $ 315,968
Plan Fiduciary Net Position – Ending (b) $ 472,170 $ 428,564 $ 386,804 $ 391,719 $ 374,789
Plan Net PensionLiability (Asset) – Ending (a)-(b) $ 56,934 $ 66,917 $ 57,933 $ 24,852 $ 15,255
Schedule is intended to show information for 10 years. Additional years will be displayed as they become available.
Finan
cial
Sectio
n
DPERS 47th Comprehensive Annual Financial Report 53

Required Supplementary Information
Schedule 1 - Schedule of Changes in Net Pension Liability (continued)(dollar values expressed in thousands)(unaudited)
Judiciary Pension Plan
2018 2017 2016 2015 2014
Total Pension Liability:
Service Cost $ 2,909 $ 2,802 $ 2,759 $ 2,568 $ 2,542
Interest 5,410 5,378 5,266 5,147 4,869
Changes in Benefit Terms 21 - - 263 -
Differences between Expected and (2,254) (2,018) (156) (1,361) -
Actual experience
Changes in Assumptions - 1,344 (1,953) - -
Benefit Payments, Including (4,795) (4,752) (4,277) (3,985) (3,588)
Refunds of Member Contributions
Net Change in Total Pension Liability $ 1,291 $ 2,754 $ 1,639 $ 2,632 $ 3,823
Total Pension Liability –Beginning (as reported) $ 78,993 $ 76,239 $ 74,600 $ 71,968 $ 68,145
Total Pension Liability – Ending (a) $ 80,284 $ 78,993 $ 76,239 $ 74,600 $ 71,968
Plan Fiduciary Net Position
Contributions – Employer $ 2,112 $ 2,347 $ 2,237 $ 2,640 $ 2,839
Contributions – Non-Employer 64 186 236 200 165
Contributions – Member 354 355 339 327 317
Net Investment Income 8,052 7,898 (1,173) 2,659 10,783
Benefit Payments, including refunds (4,795) (4,752) (4,277) (3,985) (3,588)
of Member Contributions
Administrative Expenses (13) (11) (14) (15) (13)
Net Change in Plan Fiduciary Net Position 5,774 6,023 (2,652) 1,826 10,503
Plan Fiduciary Net Position – Beginning $ 78,522 $ 72,499 $ 75,151 $ 73,325 $ 62,822
Plan Fiduciary Net Position – Ending (b) $ 84,296 $ 78,522 $ 72,499 $ 75,151 $ 73,325
Plan Net PensionLiability (Asset) – Ending (a)-(b) $ (4,012) $ 471 $ 3,740 $ (551) $ (1,357)
Schedule is intended to show information for 10 years. Additional years will be displayed as they become available.
Finan
cial
Sectio
n
54 DPERS 47th Comprehensive Annual Financial Report
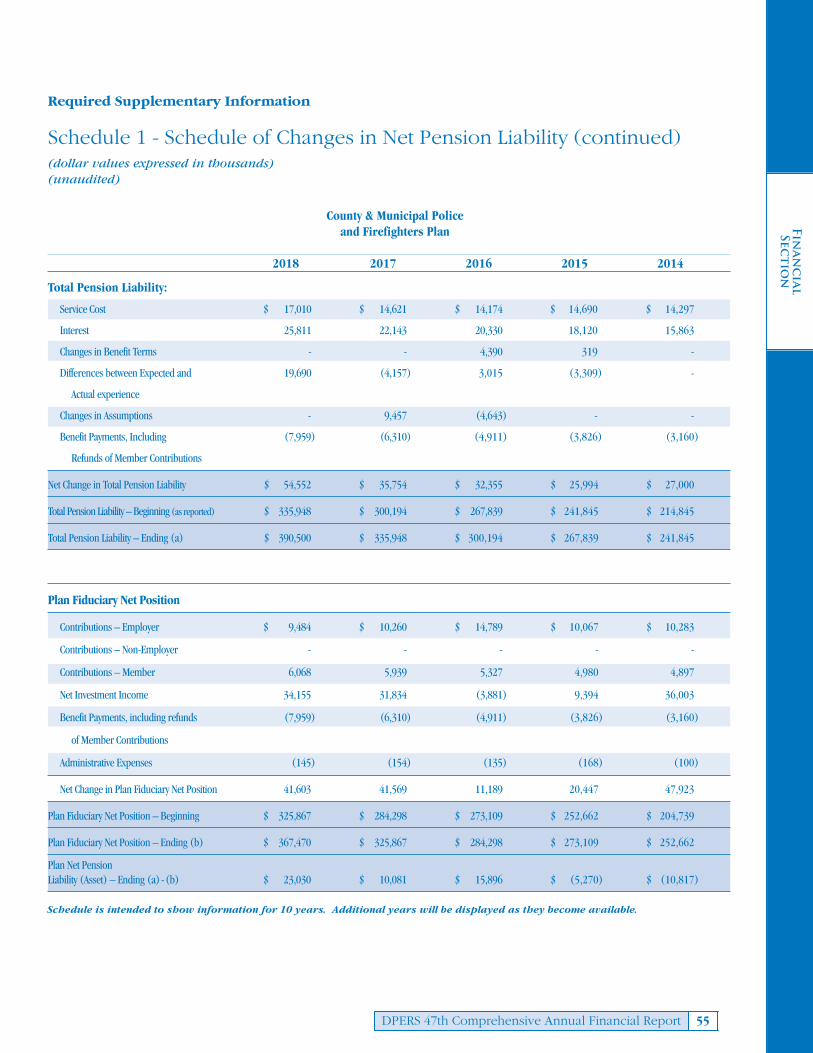
Schedule is intended to show information for 10 years. Additional years will be displayed as they become available.
Finan
cial
Sectio
n
55DPERS 47th Comprehensive Annual Financial Report
Required Supplementary Information
Schedule 1 - Schedule of Changes in Net Pension Liability (continued)(dollar values expressed in thousands)(unaudited)
County & Municipal Police and Firefighters Plan
2018 2017 2016 2015 2014
Total Pension Liability:
Service Cost $ 17,010 $ 14,621 $ 14,174 $ 14,690 $ 14,297
Interest 25,811 22,143 20,330 18,120 15,863
Changes in Benefit Terms - - 4,390 319 -
Differences between Expected and 19,690 (4,157) 3,015 (3,309) -
Actual experience
Changes in Assumptions - 9,457 (4,643) - -
Benefit Payments, Including (7,959) (6,310) (4,911) (3,826) (3,160)
Refunds of Member Contributions
Net Change in Total Pension Liability $ 54,552 $ 35,754 $ 32,355 $ 25,994 $ 27,000
Total Pension Liability –Beginning (as reported) $ 335,948 $ 300,194 $ 267,839 $ 241,845 $ 214,845
Total Pension Liability – Ending (a) $ 390,500 $ 335,948 $ 300,194 $ 267,839 $ 241,845
Plan Fiduciary Net Position
Contributions – Employer $ 9,484 $ 10,260 $ 14,789 $ 10,067 $ 10,283
Contributions – Non-Employer - - - - -
Contributions – Member 6,068 5,939 5,327 4,980 4,897
Net Investment Income 34,155 31,834 (3,881) 9,394 36,003
Benefit Payments, including refunds (7,959) (6,310) (4,911) (3,826) (3,160)
of Member Contributions
Administrative Expenses (145) (154) (135) (168) (100)
Net Change in Plan Fiduciary Net Position 41,603 41,569 11,189 20,447 47,923
Plan Fiduciary Net Position – Beginning $ 325,867 $ 284,298 $ 273,109 $ 252,662 $ 204,739
Plan Fiduciary Net Position – Ending (b) $ 367,470 $ 325,867 $ 284,298 $ 273,109 $ 252,662
Plan Net PensionLiability (Asset) – Ending (a)-(b) $ 23,030 $ 10,081 $ 15,896 $ (5,270) $ (10,817)

Required Supplementary Information
Schedule 1 - Schedule of Changes in Net Pension Liability (continued)(dollar values expressed in thousands)(unaudited)
County &MunicipalOther Employees Fund
2018 2017 2016 2015 2014
Total Pension Liability:
Service Cost $ 3,238 $ 2,894 $ 2,545 $ 2,415 $ 2,207
Interest 3,727 3,462 3,087 2,569 2,235
Changes in Benefit Terms - - - - -
Differences between Expected and (1,665) 324 1,893 (439) -
Actual experience
Changes in Assumptions - 1,437 1,018 - -
Benefit Payments, Including (1,384) (1,252) (938) (722) (659)
Refunds of Member Contributions
Net Change in Total Pension Liability $ 3,916 $ 6,865 $ 7,605 $ 3,823 $ 3,783
Total Pension Liability –Beginning (as reported) $ 52,353 $ 45,488 $ 37,883 $ 34,060 $ 30,277
Total Pension Liability – Ending (a) $ 56,269 $ 52,353 $ 45,488 $ 37,883 $ 34,060
Plan Fiduciary Net Position
Contributions – Employer $ 2,826 $ 2,515 $ 2,077 $ 1,921 $ 2,049
Contributions – Non-Employer - - - - -
Contributions – Member 1,032 985 946 757 748
Net Investment Income 4,854 4,428 (553) 1,291 4,882
Benefit Payments, including refunds (1,384) (1,252) (938) (722) (659)
of Member Contributions
Administrative Expenses (80) (94) (80) (95) (60)
Net Change in Plan Fiduciary Net Position 7,248 6,582 1,452 3,152 6,960
Plan Fiduciary Net Position – Beginning $ 45,874 $ 39,292 $ 37,840 $ 34,688 $ 27,728
Plan Fiduciary Net Position – Ending (b) $ 53,122 $ 45,874 $ 39,292 $ 37,840 $ 34,688
Plan Net PensionLiability (Asset) – Ending (a)-(b) $ 3,147 $ 6,479 $ 6,196 $ 43 $ (628)
Schedule is intended to show information for 10 years. Additional years will be displayed as they become available.
Finan
cial
Sectio
n
DPERS 47th Comprehensive Annual Financial Report56

Required Supplementary Information
Schedule 1 - Schedule of Changes in Net Pension Liability (continued)(dollar values expressed in thousands)(unaudited)
Delaware VolunteerFiremen’s Fund
2018 2017 2016 2015 2014
Total Pension Liability:
Service Cost $ 731 $ 714 $ 667 $ 290 $ 847
Interest 2,306 2,276 2,302 2,340 2,156
Changes in Benefit Terms - - - - -
Differences between Expected and (128) (1,218) (2,222) 1,615 -
Actual experience
Changes in Assumptions - 688 772 - -
Benefit Payments, Including (2,254) (2,205) (2,148) (2,003) (1,887)
Refunds of Member Contributions
Net Change in Total Pension Liability $ 655 $ 255 $ (629) $ 2,242 $ 1,116
Total Pension Liability –Beginning (as reported) $ 33,444 $ 33,189 $ 33,818 $ 31,576 $ 30,460
Total Pension Liability – Ending (a) $ 34,099 $ 33,444 $ 33,189 $ 33,818 $ 31,576
Plan Fiduciary Net Position
Contributions – Employer $ 2,019 $ 2,000 $ 1,764 $ 1,668 $ 1,561
Contributions – Non-Employer - - - - -
Contributions – Member 145 157 179 164 166
Net Investment Income 1,263 1,813 227 412 2,271
Benefit Payments, including refunds (2,254) (2,205) (2,148) (2,003) (1,887)
of Member Contributions
Administrative Expenses (35) (32) (33) (32) (34)
Net Change in Plan Fiduciary Net Position 1,138 1,733 (11) 209 2,077
Plan Fiduciary Net Position – Beginning $ 19,393 $ 17,660 $ 17,671 $ 17,462 $ 15,385
Plan Fiduciary Net Position – Ending (b) $ 20,531 $ 19,393 $ 17,660 $ 17,671 $ 17,462
Plan Net PensionLiability (Asset) – Ending (a)-(b) $ 13,568 $ 14,051 $ 15,529 $ 16,147 $ 14,114
Schedule is intended to show information for 10 years. Additional years will be displayed as they become available.
Finan
cial
Sectio
n
DPERS 47th Comprehensive Annual Financial Report 57

Required Supplementary Information
Schedule 1 - Schedule of Changes in Net Pension Liability (continued)(dollar values expressed in thousands)(unaudited)
Diamond State PortCorporation Plan
2018 2017 2016 2015 2014
Total Pension Liability:
Service Cost $ 1,042 $ 942 $ 899 $ 951 $ 870
Interest 2,495 2,314 2,218 2,160 1,873
Changes in Benefit Terms - - - - -
Differences between Expected and 265 (975) (600) 1,402 -
Actual experience
Changes in Assumptions - 815 (873) - -
Benefit Payments, Including (981) (892) (822) (729) (629)
Refunds of Member Contributions
Net Change in Total Pension Liability $ 2,821 $ 2,204 $ 822 $ 3,784 $ 2,114
Total Pension Liability –Beginning (as reported) $ 34,816 $ 32,612 $ 31,790 $ 28,006 $ 25,892
Total Pension Liability – Ending (a) $ 37,637 $ 34,816 $ 32,612 $ 31,790 $ 28,006
Plan Fiduciary Net Position
Contributions – Employer $ 1,175 $ 1,134 $ 1,200 $ 1,052 $ 1,009
Contributions – Non-Employer - - - - -
Contributions – Member 280 240 246 234 236
Net Investment Income 3,129 2,949 (394) 916 3,612
Benefit Payments, including refunds (981) (892) (822) (729) (629)
of Member Contributions
Administrative Expenses (40) (30) (32) (37) (43)
Net Change in Plan Fiduciary Net Position 3,563 3,401 198 1,436 4,185
Plan Fiduciary Net Position – Beginning $ 30,038 $ 26,637 $ 26,439 $ 25,003 $20,818
Plan Fiduciary Net Position – Ending (b) $ 33,601 $ 30,038 $ 26,637 $ 26,439 $25,003
Plan Net PensionLiability (Asset) – Ending (a)-(b) $ 4,036 $ 4,778 $ 5,975 $ 5,351 $ 3,003
Schedule is intended to show information for 10 years. Additional years will be displayed as they become available.
Finan
cial
Sectio
n
DPERS 47th Comprehensive Annual Financial Report58

Finan
cial
Sectio
n
DPERS 47th Comprehensive Annual Financial Report 59
Required Supplementary Information
Schedule 1 - Schedule of Changes in Net Pension Liability (continued)(dollar values expressed in thousands)(unaudited)
Closed StatePolice Plan
2018 2017 2016 2015 2014
Total Pension Liability:
Service Cost $ - $ - $ - $ - $ -
Interest 14,023 12,238 12,512 16,173 16,319
Changes in Benefit Terms - - - - -
Differences between Expected and 6,599 860 717 18,518 -
Actual experience
Changes in Assumptions (16,687) (33,784) 45,205 23,078 12,942
Benefit Payments, Including (22,641) (22,896) (23,098) (23,125) (23,301)
Refunds of Member Contributions
Net Change in Total Pension Liability $ (18,706) $ (43,582) $ 35,336 $ 34,644 $ 5,960
Total Pension Liability –Beginning (as reported) $ 396,333 $ 439,915 $ 404,578 $ 369,934 $ 363,974
Total Pension Liability – Ending (a) $ 377,627 $ 396,333 $ 439,914 $ 404,578 $ 369,934
Plan Fiduciary Net Position
Contributions – Employer $ 22,750 $ 23,067 $ 23,300 $ 23,473 $ 23,064
Contributions – Non-Employer - - - - -
Contributions – Member - - - - -
Net Investment Income 1,292 1,268 (840) 364 (3)
Benefit Payments, including refunds (22,641) (22,896) (23,098) (23,125) (23,301)
of Member Contributions
Administrative Expenses (40) (42) (48) (60) (46)
Net Change in Plan Fiduciary Net Position 1,361 1,397 (686) 652 (286)
Plan Fiduciary Net Position – Beginning $ 3,365 $ 1,968 $ 2,654 $ 2,002 $ 2,288
Plan Fiduciary Net Position – Ending (b) $ 4,726 $ 3,365 $ 1,968 $ 2,654 $ 2,002
Plan Net PensionLiability (Asset) – Ending (a)-(b) $ 372,901 $ 392,968 $ 437,946 $ 401,924 $ 367,932
Schedule is intended to show information for 10 years. Additional years will be displayed as they become available.

Required Supplementary Information (continued)
Schedule 2 - Schedule of Net Pension Liability (dollar values expressed in thousands)(unaudited)
(4)Plan Fiduciary (6) Net PensionNet Position Liability/(Asset)
(2)Plan (3)Employers’ as a % of the as a % ofActuarial (1)Total Fiduciary Net Pension Total Pension (5) CoveredValuation Pension Net Liability/(Asset) Liability Covered Payroll
Plan Date Liability Position (1) - (2) (2)/(1) Payroll (3)/(5)State Employees’ 30-Jun-2018 $ 10,319,912 $ 9,028,447 $ 1,291,465 87.5% $ 1,985,446 65.0%
30-Jun-2017 9,979,837 8,513,829 1,466,008 85.4% 1,948,072 75.0%30-Jun-2016 9,484,483 7,977,541 1,506,942 84.1% 1,907,169 79.0%30-Jun-2015 9,074,604 8,409,336 665,268 92.7% 1,864,991 35.7%30-Jun-2014 8,757,980 8,389,765 368,215 95.8% 1,840,521 20.0%
Special 30-Jun-2018 $ 121 $ 195 $ (74) 161.2% N/A N/A30-Jun-2017 134 208 (74) 156.0% N/A N/A30-Jun-2016 181 214 (33) 118.2% N/A N/A30-Jun-2015 186 267 (81) 144.0% N/A N/A30-Jun-2014 200 304 (104) 152.0% N/A N/A
New State Police 30-Jun-2018 $ 529,104 $ 472,170 $ 56,934 89.2% $ 62,360 91.3%30-Jun-2017 495,481 428,564 66,917 86.5% 61,002 109.7%30-Jun-2016 444,737 386,804 57,933 87.0% 59,144 98.0%30-Jun-2015 416,571 391,719 24,852 94.0% 57,973 42.9%30-Jun-2014 390,044 374,789 15,255 96.1% 55,067 27.7%
Judiciary 30-Jun-2018 $ 80,284 $ 84,296 $ (4,012) 105.0% $ 10,629 (37.7)%30-Jun-2017 78,993 78,522 471 99.4% 10,604 4.4%30-Jun-2016 76,239 72,499 3,740 95.1% 10,400 36.0%30-Jun-2015 74,600 75,151 (551) 100.7% 9,988 (5.5%)30-Jun-2014 71,968 73,325 (1,357) 101.9% 10,244 (13.3%)
County & Municipal 30-Jun-2018 $ 390,500 $ 367,470 $ 23,030 94.1% $ 83,049 27.7%Police and Firefighters’ 30-Jun-2017 335,948 325,867 10,081 97.0% 82,164 12.3%
30-Jun-2016 300,194 284,298 15,896 94.7% 72,855 21.82%30-Jun-2015 267,839 273,109 (5,270) 102.0% 70,997 (7.5%)30-Jun-2014 241,845 252,662 (10,817) 104.5% 66,268 (16.3%)
County & Municipal 30-Jun-2018 $ 56,269 $ 53,122 $ 3,147 94.4% $ 39,856 7.9%Other Employees’ 30-Jun-2017 52,353 45,874 6,479 87.6% 37,191 17.4%
30-Jun-2016 45,488 39,292 6,196 86.4% 33,453 18.5%30-Jun-2015 37,883 37,840 43 99.9% 29,644 0.1%30-Jun-2014 34,060 34,688 (628) 101.8% 30,937 (2.0%)
Diamond State Port 30-Jun-2018 $ 37,637 $ 33,601 $ 4,036 89.3% $ 14,022 28.8%Corporation 30-Jun-2017 34,816 30,038 4,778 86.3% 12,028 39.7%
30-Jun-2016 32,613 26,637 5,976 81.7% 12,374 48.3%30-Jun-2015 31,790 26,439 5,351 83.2% 11,679 45.8%30-Jun-2014 28,006 25,003 3,003 89.3% 11,771 25.5%
Closed State Police+ 30-Jun-2018 $ 377,627 $ 4,726 $ 372,901 1.3% N/A N/A30-Jun-2017 396,333 3,365 392,968 0.8% N/A N/A30-Jun-2016 439,915 1,968 437,947 0.4% N/A N/A30-Jun-2015 404,578 2,654 401,924 0.7% N/A N/A30-Jun-2014 369,934 2,002 367,932 0.5% N/A N/A
++UAAL++Active Per ActiveMembers Member
Delaware 30-Jun-2018 $ 34,099 $ 20,531 $ 13,568 60.2% 4,479 $ 3,029 Volunteer 30-Jun-2017 33,444 19,393 14,051 58.0% 4,617 $ 3,043 Firefighters 30-Jun-2016 33,189 17,660 15,529 53.2% 4,742 3,275Plan 30-Jun-2015 33,818 17,671 16,147 52.3% 4,828 3,345
30-Jun-2014 31,576 17,462 14,114 55.3% 4,882 2,891
+ The Closed State Police Plan is a pay-as-you-go plan.++ Not expressed in thousands
Schedule is intended to show information for 10 years. Additional years will be displayed as they become available.
Finan
cial
Sectio
n
60 DPERS 47th Comprehensive Annual Financial Report

Contributions Contributionsin Relation to as a
Actuarial the Actuarial Contribution PercentageFiscal Year Determined Determined Deficiency Covered of Covered
Plan Ended Contribution Contribution (Excess) Payroll Payroll
State Employees’* 30-Jun-2018 $ 206,883 $ 206,883 $ - $ 1,985,446 10.4%
30-Jun-2017 186,625 186,625 - 1,948,072 9.6%
30-Jun-2016 182,707 182,707 - 1,907,169 9.6%
30-Jun-2015 178,293 178,293 - 1,864,991 9.6%
30-Jun-2014 174,863 174,863 - 1,840,521 9.5%
30-Jun-2013 160,651 160,651 - 1,877,105 8.6%
30-Jun-2012 147,464 147,464 - 1,881,097 7.8%
30-Jun-2011 128,019 128,019 - 1,783,603 7.2%
30-Jun-2010 101,457 101,457 - 1,740,622 5.8%
30-Jun-2009 96,576 96,576 - 1,753,129 5.5%
Special 30-Jun-2017 $ - $ - $ - $ N/A N/A
30-Jun-2017 - - - N/A N/A
30-Jun-2016 - - - N/A N/A
30-Jun-2015 - - - N/A N/A
30-Jun-2014 - - - N/A N/A
30-Jun-2013 - - - N/A N/A
30-Jun-2012 - - - N/A N/A
30-Jun-2011 - - - N/A N/A
30-Jun-2010 - - - N/A N/A
30-Jun-2009 - - - N/A N/A
New State Police* 30-Jun-2018 $ 13,202 $ 13,202 $ - $ 62,360 21.2%
30-Jun-2017 11,096 11,096 - 61,002 18.2%
30-Jun-2016 11,001 11,001 - 59,144 18.6%
30-Jun-2015 10,730 10,730 - 57,973 18.5%
30-Jun-2014 10,500 10,500 - 55,067 19.1%
30-Jun-2013 9,292 9,292 - 56,289 16.5%
30-Jun-2012 8,309 8,309 - 54,412 15.3%
30-Jun-2011 7,810 7,810 - 50,556 15.4%
30-Jun-2010 6,562 6,562 - 49,896 13.2%
30-Jun-2009 6,791 6,791 - 50,425 13.5%
Judiciary* 30-Jun-2018 $ 2,112 $ 2,112 $ - $ 10,629 19.9%
30-Jun-2017 2,347 2,347 - 10,604 22.1%
30-Jun-2016 2,237 2,237 - 10,400 21.5%
30-Jun-2015 2,640 2,640 - 9,988 26.4%
30-Jun-2014 2,839 2,839 - 10,244 27.7%
30-Jun-2013 2,762 2,762 10,416 26.5%
30-Jun-2012 2,674 2,674 - 10,387 25.7%
30-Jun-2011 2,557 2,557 - 9,624 26.6%
30-Jun-2010 2,473 2,473 - 9,798 25.2%
30-Jun-2009 2,549 2,549 - 9,814 26.0%
Required Supplementary Information (continued)
Schedule 3 - Schedule of Employer Contributions(dollar values expressed in thousands)
(unaudited)
Finan
cial
Sectio
n
61DPERS 47th Comprehensive Annual Financial Report

Contributions Contributionsin Relation to as a
Actuarial the Actuarial Contribution PercentageFiscal Year Determined Determined Deficiency Covered of Covered
Plan Ended Contribution Contribution (Excess) Payroll Payroll
County & Municipal 30-Jun-2018 $ 9,484 $ 9,484 $ - $ 83,049 11.4%
Police and Firefighters’ 30-Jun-2017 11,314 11,314*** - 82,164 13.8%
30-Jun-2016 10,090** 10,090** - 72,855 13.9%
30-Jun-2015 10,067 10,067 - 70,997 14.2%
30-Jun-2014 10,283 10,283 - 66,268 15.5%
30-Jun-2013 8,671 8,671 - 68,122 12.7%
30-Jun-2012 9,265 9,265 - 67,091 13.8%
30-Jun-2011 7,569 7,569 - 59,418 12.7%
30-Jun-2010 7,307 7,307 - 56,917 12.8%
30-Jun-2009 12,007 12,007 - 55,478 21.6%
County & Municipal 30-Jun-2018 $ 2,826 $ 2,826 $ - $ 39,856 7.1%
Other Employees’ 30-Jun-2017 2,515 2,515 - 37,191 6.8%
30-Jun-2016 2,077 2,077 - 33,453 6.2%
30-Jun-2015 1,921 1,921 - 29,644 6.5%
30-Jun-2014 2,049 2,049 - 30,937 6.6%
30-Jun-2013 1,604 1,604 - 26,332 6.1%
30-Jun-2012 1,362 1,362 - 22,435 6.1%
30-Jun-2011 1,186 1,186 - 20,580 5.8%
30-Jun-2010 1,276 1,276 - 20,591 6.2%
30-Jun-2009 2,293 2,293 - 19,046 12.0%
Delaware Volunteer 30-Jun-2018 $ 2,017 $ 2,017 $ - N/A N/A
Firemen’s 30-Jun-2017 1,992 2,000 (8) N/A N/A
30-Jun-2016 2,036 1,764 272 N/A N/A
30-Jun-2015 1,990 1,668 322 N/A N/A
30-Jun-2014 2,006 1,561 445 N/A N/A
30-Jun-2013 2,002 1,456 546 N/A N/A
30-Jun-2012 1,896 1,311 585 N/A N/A
30-Jun-2011 1,762 1,221 541 N/A N/A
30-Jun-2010 1,703 1,191 512 N/A N/A
30-Jun-2009 1,604 1,108 496 N/A N/A
Diamond State Port 30-Jun-2018 $ 1,175 $ 1,175 $ - $ 14,022 8.4%
Corporation 30-Jun-2017 1,134 1,134 - 12,028 9.4%
30-Jun-2016 1,200 1,200 - 12,374 9.7%
30-Jun-2015 1,052 1,052 - 11,679 9.0%
30-Jun-2014 1,009 1,009 - 11,771 8.6%
30-Jun-2013 854 854 - 11,381 7.5%
30-Jun-2012 814 814 - 12,229 6.7%
30-Jun-2011 704 704 - 11,150 6.3%
30-Jun-2010 594 594 - 11,224 5.3%
30-Jun-2009 694 694 - 11,071 6.3%
Required Supplementary Information (continued)
Schedule 3 - Schedule of Employer Contributions (continued)(dollar values expressed in thousands)
(unaudited)
Finan
cial
Sectio
n
62 DPERS 47th Comprehensive Annual Financial Report

Contributions Contributionsin Relation to as a
Actuarial the Actuarial Contribution PercentageFiscal Year Determined Determined Deficiency Covered of Covered
Plan Ended Contribution Contribution (Excess) Payroll Payroll
Closed State Police 30-Jun-2018 $ 25,552 $ 22,750 $ 2,802 N/A N/A
30-Jun-2017 25,978 23,067 2,911 N/A N/A
30-Jun-2016 23,300 23,300 - N/A N/A
30-Jun-2015 26,310 23,473 2,837 N/A N/A
30-Jun-2014 25,696 23,064 2,632 N/A N/A
30-Jun-2013 25,696 23,064 2,632 - N/A
30-Jun-2012 24,678 23,064 1,614 124 18600.0%
30-Jun-2011 26,638 23,367 3,271 114 20497.4%
30-Jun-2010 27,214 23,367 3,847 339 6892.9%
30-Jun-2009 26,423 21,775 4,648 619 3517.8%* Actuarial Determined Contributions do not include Post-Retirement Increase funding (see Note 2 to the Basic Financial Statements).
** Contribution amount differs from amount reported in the Combining Statement of Changes in Fiduciary Net Position due to abuy-in remitted by a new participating entity in the plan.
***Contribution amount differs from amount reported in the Combining Statement of Changes in Fiduciary Net Position due to arefund to a participating entity in the plan.
Schedule 4 - Schedule of Investment Returns*(dollar values expressed in thousands)
(unaudited)Annual Money-Weighted
Rate of Return,net of investment expense
Plan 2018 2017 2016 2015 2014
State Employees' 10.4% 11.0% (1.7%) 3.6% 17.2%Special 10.3% 11.0% (2.0%) 3.6% 17.2%New State Police 10.4% 11.0% (1.5%) 3.7% 17.2%Judiciary 10.4% 11.0% (1.6%) 3.7% 17.2%County & Municipal Police and Firefighters' 10.4% 11.0% (1.5%) 3.7% 17.3%County & Municipal Other Employees' 10.4% 11.0% (1.5%) 3.6% 17.3%Delaware Volunteer Firefighters 6.9% 10.6% 1.4% 2.4% 15.1%Diamond State Port Corporation 10.4% 11.0% (1.5%) 3.7% 17.3%County & Municipal COLA 10.0% 11.6% (3.2%) 3.9% 17.6%Post-Retirement Increase Fund 10.8% 13.9% (1.4%) 4.5% 19.4%DELRIP-Sussex Co. 10.1% 11.0% (1.5%) 3.7% 17.3%DELRIP-Elsmere N/A 0.4% (1.7%) 3.6% 17.2%DELRIP-Newport 10.4% 10.6% (2.0%) 3.7% 17.3%Closed State Police 10.4% 10.0% (6.4%) 2.9% (0.1%)
*Schedule is intended to show information for 10 years. Additional years will be displayed as they become available.
Required Supplementary Information (continued)
Schedule 3 - Schedule of Employer Contributions (continued)(dollar values expressed in thousands)
(unaudited)
Finan
cial
Sectio
n
63DPERS 47th Comprehensive Annual Financial Report

Required Supplementary Information (continued)
Notes to Required Supplementary InformationFactors that significantly affect trends in amounts reported. For the periods presented, there were nochanges of benefit terms or, changes in the size or composition of the population covered by the benefitterms which significantly affect trends in the amounts reported. The changes in assumptions used todetermine total pension liability are described in Note 5 of the financial statements.
Method and assumptions used in calculations of actuarially determined contributions. The actuariallydetermined contribution rates in the Schedule of Employers’ Contributions are calculated as of June 30, twoyears prior to the end of the fiscal year in which contributions are reported, with the exception of Special,Delaware Volunteer Firemen and Closed State Police plans whose contributions are calculated one year priorto to the end of the fiscal year. Complete descriptions of the methods and assumptions used to determinecontribution rates for Fiscal Year 2018 can be found in the June 30, 2016 (2017 for Special, Delaware VolunteerFiremen and Closed State Police plans) actuarial valuation reports. The following actuarial methods andassumptions were used to determine contribution rates reported in that schedule:
State New State Closed StatePlan Employees’ Special Police Judiciary Police
Valuation Date 30-Jun-2016 30-Jun-2017 30-Jun-2016 30-Jun-2016 30-Jun-2017
Actuarial Cost Method Entry Age Entry Age Entry Age Entry Age Entry AgeNormal Normal Normal Normal Normal
Amortization Method Open 20-Year N/A Open 20-Year Open 15-Year Closed 19-YearLevel Percent Level Percent Level Percent Level Dollar
of Payroll of Payroll of Payroll Amortization
Remaining Amortization Period 20 years N/A 20 years 15 years 19 years
Asset Valuation Method 5-year 5-year 5-year 5-year 5-yearSmoothed Smoothed Smoothed Smoothed SmoothedMarket Market Market Market Market
Actuarial Assumptions:Discount Rate 7.2% 7.0% 7.2% 7.2% 7.0%
Amortization Growth Rate 2.5% N/A 2.5% 2.5% N/A
Price Inflation 2.5% N/A 2.5% 2.5% 2.5%
County & County &Municipal Municipal Delaware DiamondPolice and Other Volunteer State Port
Plan Firefighters’ Employees’ Firemen’s Corporation
Valuation Date 30-Jun-2016 30-Jun-2016 30-Jun-2017 30-Jun-2016
Actuarial Cost Method Entry Age Entry Age Entry Age Entry AgeNormal Normal Normal Normal
Amortization Method Open 10-Year Open 10-Year Open 15-Year Open 15-YearLevel Percent Level Percent Level Dollar Level Percent
of Payroll of Payroll Amortization of Payroll
Remaining Amortization Period 10 years 10 years 15 years 15 years
Asset Valuation Method 5-year 5-year 5-year 5-yearSmoothed Smoothed Smoothed SmoothedMarket Market Market Market
Actuarial Assumptions:Discount Rate 7.2% 7.2% 7.0% 7.2%
Amortization Growth Rate 2.5% 2.5% N/A 2.5%
Price Inflation 2.5% 2.5% 2.5% 2.5%
Finan
cial
Sectio
n
DPERS 47th Comprehensive Annual Financial Report64

DelawarePublic
Employees’Retirement
System— A component unit of the State of Delaware
Forty-Seventh ComprehensiveAnnual Financial Report
Presented by the DPERS Board of Pension TrusteesFor the Fiscal Year Ended June 30
2018
SUPPORTINGSCHEDULES

Schedule 5 – Schedule of Administrative Expenses(dollar values expressed in thousands)
Change
Fiscal 2018 Fiscal 2017 Dollars Percent
Personnel Services: Salaries $ 2,349 $ 2,266 83 3.7%
Fringe Benefits 1,299 1,277 22 1.7%
Total Personnel Services: $ 3,648 $ 3,543 105 3.0%
Professional Actuarial 189 234 (45) (19.2%)
Services: Audit 638 332 306 92.2%
Medical Services 7 7 - 0.0%
State Agency Support Services 32 33 (1) (3.0%)
Other Professional Services 51 23 28 121.7%
Total Professional Services: $ 917 $ 629 288 45.8%
Communication: Printing 90 105 (15) (14.3%)
Telephone 17 18 (1) (5.6%)
Postage 163 168 (5) (3.0%)
Travel 15 13 2 15.4%
Other Communications 30 30 - 0.0%
Total Communications: $ 315 $ 334 (19) (5.7%)
Data Processing: Contracting Services 270 483 (213) (44.1%)
Maintenance 316 303 13 4.3%
Equipment - Hardware 19 61 (42) (68.9%)
Equipment - Software 50 27 23 85.2%
Total Data Processing: $ 655 $ 874 (219) (25.1%)
Rental: Equipment Leasing 3 3 - 0.0%
Fleet Services 1 1 - 0.0%
Office Space 629 601 28 4.7%
Total Rentals: $ 633 $ 605 28 4.6%
Miscellaneous: Supplies and Equipment 18 22 (4) (18.2%)
Maintenance 7 11 (4) (36.4%)
Other Miscellaneous -
Total Miscellaneous: $ 25 $ 33 (8) (24.2%)
General Administrative Expenses: $ 6,193 $ 6,018 175 2.9%
Special Projects: Best Practices Review 45 71 (26) (36.6%)
Total Special Projects: $ 45 $ 71 (26) (36.6%)
Grand Total Administrative Expenses: $ 6,238 $ 6,089 149 2.4%
See accompanying independent auditors report.
Suppo
rtin
gSc
hed
ules
66 DPERS 47th Comprehensive Annual Financial Report
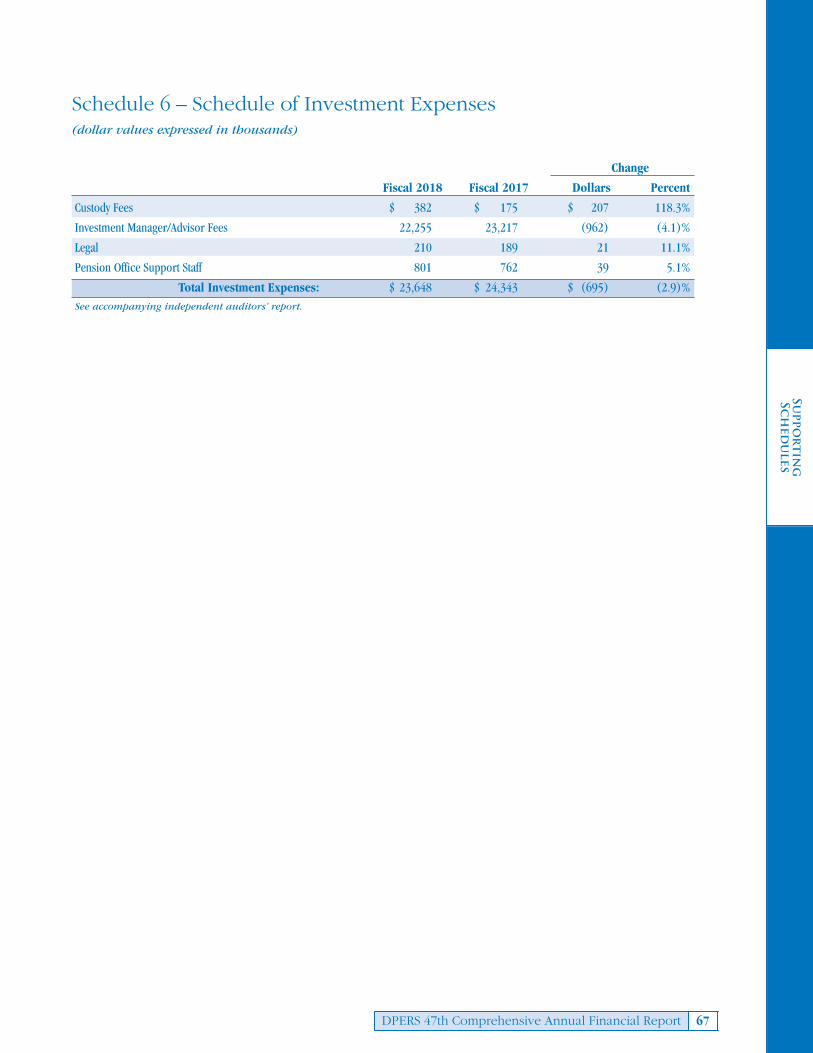
Schedule 6 – Schedule of Investment Expenses(dollar values expressed in thousands)
Change
Fiscal 2018 Fiscal 2017 Dollars Percent
Custody Fees $ 382 $ 175 $ 207 118.3%
Investment Manager/Advisor Fees 22,255 23,217 (962) (4.1)%
Legal 210 189 21 11.1%
Pension Office Support Staff 801 762 39 5.1%
Total Investment Expenses: $ 23,648 $ 24,343 $ (695) (2.9)% See accompanying independent auditors’ report.
Suppo
rtin
gSc
hed
ules
67DPERS 47th Comprehensive Annual Financial Report

Schedule of Fiduciary Net Positionof the Delaware Local Government Retirement Investment Poolas of June 30, 2018 with Comparative Totals for June 30, 2017(expressed in thousands)
Sussex County Town of Totals as of June 30Government Newport 2018 2017
Assets:
Cash & Cash Equivalents $ 2,950 $ 134 $ 3,084 $ 1,547
Receivables:
Accrued Investment Income 50 3 53 60
Pending Trade Sales 70 3 73 119
Total Receivables: $ 120 $ 6 $ 126 $ 179
Investments at Fair Value:
Domestic Fixed Income 3,990 181 4,171 4,534
Domestic Equities 7,165 326 7,491 9,442
Pooled Equity & Fixed Income 12,731 578 13,309 14,742
Alternative Investments 9,464 430 9,894 9,686
Foreign Fixed Income 305 14 319 439
Foreign Equities 2,059 94 2,153 2,225
Total Investments: $ 35,714 $ 1,623 $ 37,337 $ 41,068
Total Assets: $ 38,784 $ 1,763 $ 40,547 $ 42,794
Liabilities:
Pending Purchases Payable 64 3 67 206
Accrued Investment Expenses 14 1 15 18
Total Liabilities: $ 78 $ 4 $ 82 $ 224
Balance End Of Year $ 38,706 $ 1,759 $ 40,465 $ 42,570
See accompanying independent auditors' report.
Suppo
rtin
gSc
hed
ules
68 DPERS 47th Comprehensive Annual Financial Report

Schedule of Changes in Fiduciary Net Positionof the Delaware Local Government Retirement Investment Poolfor the Year Ended June 30, 2018 with Comparative Totalsfor June 30, 2017(expressed in thousands)
Sussex County Town of Totals as of June 30Government Newport 2018 2017
Additions:
Contributions:
Transfer of Assets from Outside the System $ 2,300 $ - $ 2,300 $ -
Total Contributions: $ 2,300 $ - $ 2,300 $ -
Investments:
Investment Income 629 24 653 716
Net Appreciation (Depreciation) in Fair Value 3,622 145 3,767 3,949
Total Investment Earnings/(Loss): $ 4,251 $ 169 $ 4,420 $ 4,665
Less Investment Manager/Advisor Fees (99) (4) (103) (106)
Net Investment Earnings/(Loss): $ 4,152 $ 165 $ 4,317 $ 4,559
Securities Lending Income 5 1 6 6
Less Bank Fees (1) - (1) (1)
Total Securities Lending Expense $ (1) $ - $ (1) $ (1)
Total Net Securities Lending Income $ 4 $ 1 $ 5 $ 5
Total Additions: $ 6,456 $ 166 $ 6,622 $ 4,564
Deductions:
Withdrawal of funds COLA/DelRIP 8,725 - 8,725 12,212
Administrative Expenses 2 - 2 1
Total Deductions $ 8,727 $ - $ 8,727 $ 12,213
Net Increase/Decrease $ (2,271) $ 166 $ (2,105) $ (7,649)
Balance Beginning Of Year $ 40,977 $ 1,593 $42,570 $ 50,219
Balance End Of Year $ 38,706 $ 1,759 $40,465 $ 42,570
See accompanying independent auditors report.
Suppo
rtin
gSc
hed
ules
69DPERS 47th Comprehensive Annual Financial Report

Independent Auditor’s Report on Internal Control Over Financial Reporting and onCompliance and Other Matters Based on an Audit of Financial Statements Performed in
Accordance with Government Auditing Standards
Board of Pension TrusteesDelaware Public Employees’ Retirement SystemDover, Delaware
We have audited, in accordance with the auditing standards generally accepted in the United States ofAmerica and by the standards applicable to financial audits contained in Government Auditing Standardsissued by the Comptroller General of the United States, the financial statements of the Delaware PublicEmployees’ Retirement System (the System) as of June 30, 2018 and have issued our report thereon datedNovember 21, 2018.
Internal Control over Financial Reporting
In planning and performing our audit of the financial statements, we considered the System’s internal controlover financial reporting (internal control) to determine the audit procedures that are appropriate in thecircumstances for the purpose of expressing our opinion on the financial statements, but not for the purposeof expressing an opinion on the effectiveness of the System’s internal control. Accordingly, we do not expressan opinion on the effectiveness of the System’s internal control.
A deficiency in internal control exists when the design or operation of a control does not allow managementor employees, in the normal course of performing their assigned functions, to prevent, or detect and correct,misstatements on a timely basis. A material weakness is a deficiency, or a combination of deficiencies, ininternal control, such that there is a reasonable possibility that a material misstatement of the entity’s financialstatements will not be prevented, or detected and corrected, on a timely basis. A significant deficiency is adeficiency, or a combination of deficiencies, in internal control that is less severe than a material weakness,yet important enough to merit attention by those charged with governance.
Our consideration of internal control was for the limited purpose described in the first paragraph of thissection and was not designed to identify all deficiencies in internal control that might be material weaknessesor significant deficiencies. Given these limitations, during our audit we did not identify any deficiencies ininternal control that we consider to be material weaknesses. However, material weaknesses may exist thathave not been identified.
Compliance and Other Matters
As part of obtaining reasonable assurance about whether the System’s financial statements are free frommaterial misstatement, we performed tests of its compliance with certain provisions of laws, regulations,contracts, and grant agreements, noncompliance with which could have a direct and material effect on thedetermination of financial statement amounts. However, providing an opinion on compliance with thoseprovisions was not an objective of our audit, and accordingly, we do not express such an opinion. Theresults of our tests disclosed no instances of noncompliance or other matters that are required to be reportedunder Government Auditing Standards.
BDO USA, LLP, a Delaware limited liability partnership, is the U.S. member of BDO International Limited, a UKcompany limited by guarantee, and forms part of the international BDO network of independent member firms.BDO is the brand name for the BDO network and for each of the BDO Member Firms.
Tel: 302-656-5500Fax: 302-656-8024www.bdo.com
4250 Lancaster Pike, Suite 120Wilmington, DE 19805
Suppo
rtin
gSc
hed
ules
70 DPERS 47th Comprehensive Annual Financial Report
D
Our opinion is not modified
w

Purpose of this Report
The purpose of this report is solely to describe the scope of our testing of internal control andcompliance and the results of that testing, and not to provide an opinion on the effectiveness of theSystem’s internal control or on compliance. This report is an integral part of an audit performed inaccordance with Government Auditing Standards in considering the System’s internal control andcompliance. Accordingly, this communication is not suitable for any other purpose.
Wilmington, DelawareNovember 21, 2018
Board of Pension TrusteesDelaware Public Employees’ Retirement SystemPage 2 of 2
BDO USA, LLP, a Delaware limited liability partnership, is the U.S. member of BDO International Limited, a UKcompany limited by guarantee, and forms part of the international BDO network of independent member firms.BDO is the brand name for the BDO network and for each of the BDO Member Firms.
Suppo
rtin
gSc
hed
ules
71DPERS 47th Comprehensive Annual Financial Report
We do not express an opinion or p
The 2016 Schedule of Administrative Expenses, Schedule of S
The report of other auditors dated December 15, 2015 indicated the 2015 Schedules were fairly stated in
a
We do not express an opinion or p
The 2016 Schedule of Administrative Expenses, Schedule of S

This page intentionally left blank.
Suppo
rtin
gSc
hed
ules
72 DPERS 47th Comprehensive Annual Financial Report

DelawarePublic
Employees’Retirement
System— A component unit of the State of Delaware
Forty-Seventh ComprehensiveAnnual Financial Report
Presented by the DPERS Board of Pension TrusteesFor the Fiscal Year Ended June 30
2018
INVESTMENTSECTION

Ten-Year Investment Comparison
$0.0
$1.0
$2.0
$3.0
$4.0
$5.0
$6.0
$7.0
$8.0
$9.0
$11.0
$10.0
2009 2010 2011 2012 2013 2014 2015 2016 2017 2018
Investment PortfolioFiscal Years Ended June 30,(expressed in millions)
2009 2010 2011 2012 2013 2014 2015 2016 2017 2018
Domestic Equities $ 1,632.9 $ 1,779.2 $ 2,432.8 $ 2,538.8 $ 3,400.8 $ 3,649.1 $ 3,434.4 $ 2,976.0 $ 3,182.9 $ 3,104.3
International Equities 1,134.9 1,056.8 1,244.5 842.6 981.0 642.1 967.3 903.8 1,302.7 1,412.2
Domestic Fixed Income 1,148.4 1,509.1 1,448.4 1,565.3 1,612.0 1,925.8 2,071.8 2,589.8 2,427.7 2,272.1
International Fixed Income 121.5 138.0 193.5 163.5 148.3 687.8 172.5 155.6 99.1 80.4
Alternative Investments 1,348.6 1,630.2 1,866.1 1,902.5 1,528.1 1,754.8 2,064.0 1,970.5 2,154.6 2,465.9
Cash & Short Term 398.7 248.8 452.8 517.3 426.9 572.9 587.9 265.1 327.5 774.6
$ 5,785.0 $ 6,362.1 $ 7,638.1 $ 7,530.0 $ 8,097.1 $ 9,232.5 $ 9,297.9 $ 8,860.8 $ 9,494.5 $10,109.5
Note: For this section, Pooled Investments are included in their respective equity and fixed income asset classes and, therefore, aredifferent from the categories used in the Financial Section on pages 24-25. In addition, the fair value of investments represented in thissection includes cash and cash equivalents, accrued interest, investment sales pending, and investment purchases pending, as indicated inthe Financial Section on pages 24-25.
Reconciliation to Plan Net Position(expressed in millions)
Total Investment Portfolio Value $ 10,109.5
Receivables
Employer Contributions 16.0
Member Contributions 4.8
Liabilities
Benefits Payable (1.0)
Accrued Investment Expenses (3.6)
Accrued Administrative Expenses (0.2)
Other Liabilities (0.1)
Net Position Held in Trust $ 10,125.4
2018In
vestm
ent
Sectio
n
74 DPERS 47th Comprehensive Annual Financial Report

STATE OF DELAWARESTATE BOARD OF PENSION TRUSTEES
ANDOFFICE OF PENSIONSMcArdle Building, Suite #1
860 Silver Lake Blvd.Dover, DE 19904-2402
When Calling Long Distance Telephone (302) 739-4208Toll Free Number 1-800-722-7300 Fax (302) 739-6129E-Mail: [email protected] www.delawarepensions.com
August 20, 2018
Dear Board Members, Participants, and Beneficiaries:
The Board of Pension Trustees’ Investment Committee oversees the investment of the retirement fundsof the Delaware Public Employees’ Retirement System (System). The Investment Committee’s investmentoversight includes the nine plans/funds [State Employees’, Special, New State Police, Judiciary, County& Municipal Police and Firefighters’, County & Municipal Other Employees’, Delaware VolunteerFiremen’s, Diamond State Port Corporation, and Closed State Police]. In addition, the InvestmentCommittee also oversees the three commingled pension investment funds [County & MunicipalPolice/Firefighters’ COLA, Post-Retirement Increase (PRI), and Delaware Local Government RetirementInvestment Pool (DELRIP)]. The Investment Committee consists of seven members appointed by theBoard. The Investment Committee seeks to achieve the following investment objectives established bythe Board:
� To realize a real return of 3% per year over long periods
� To manage portfolio risk so as to limit downside price fluctuation of the total System portfolio
� To realize as high a rate of total return as possible consistent with the above.
While not governed by mandated target asset allocations, investment decisions are shaped by theBoard’s internal investment guidelines which provide for a minimum of 20% of the total assets of theSystem to be invested in fixed income investments, such as bonds and cash equivalents. TheInvestment Committee continuously reviews expected rates of return and risk levels for all asset classesand seeks to construct portfolios consistent with the System’s return objectives and risk managementguidelines. The Investment Committee strives for appropriate investment diversification by allocatingfunds across a variety of asset classes and by selecting managers whose demonstrated performancereflects different management styles and asset class expertise. The performance of all investmentmanagers is closely monitored, not only in relation to specific absolute objectives, but also in relationto other fund managers following the same or similar investment objectives. All investment guidelinesare monitored with the assistance of the Investment Advisor.
Inv
estmen
tSec
tion
75DPERS 47th Comprehensive Annual Financial Report
The dedicated members of the Investment Committee met seventeen times over the course of the fiscalyear. The System’s investments continued to be allocated with a focus on liquidity and risk management.Asset allocation moves over the year involved shifting equity exposures toward international markets andrepositioning the Fund’s fixed income to benefit more from rising interest rates. Four manager accountswere closed and two new manager accounts were opened during the fiscal year. To help maintainexposure to private investments there were five new commitments to private investment funds duringthe year.
The Fund’s return for the 2018 fiscal year was 10.6%. The total System’s annualized returns for the last5, 10, 15, and 20 years are 8.2%, 7.3%, 8.3%, and 7.2%, respectively, comfortably achieving the Fund’slong-term real return objective of 3% over inflation. The System’s long-term performance rankings inthe TUCS large public plan universe are top quartile for the ten-year period and third quartile for thefive-year period ending June 30, 2018. The System’s longer-term results have been achieved withlower observed return volatility than the median for the universe, reflecting the System’s longstandingfocus on risk management. For the year ending June 30, 2018, the System’s assets had a net increaseof $618.9 million, with investment gains comprising $970.9 million. Investment gains include anadjustment of $202 million in unrealized appreciation from Alternative Investments for the quarterended June 30, 2018.
We thank our dedicated professional staff at the Office of Pensions, our Investment Advisor, ourcustodian bank, and our money managers, who all work diligently to ensure the successfuloperation of the Board of Pension Trustees’ Investment Committee.
Respectfully submitted,
George J. Saxon, ChairBoard of Pension Trustees’Investment Committee
Board Members, Participants and BeneficiariesPage 2August 20, 2018
Inv
estmen
tSec
tion
76 DPERS 47th Comprehensive Annual Financial Report

Investment Activity and Economic ClimateEntering the fiscal year, signs of synchronized global economic growth, accelerating corporate earnings,as well as accommodative global monetary policies appeared to present a favorable backdrop for equitymarkets. Market action through early 2018 did provide investors with generous returns, but long-dormant volatility re-emerged as the period progressed. While equity markets reacted favorably to thepassage of the Tax Reform and Jobs Act in late 2017, worries began to emerge in January that fastereconomic growth may lead to higher inflation and force the Federal Reserve to pursue a more aggressivepace of monetary tightening. Seeking better trade deals, the White House announced a series of tariffsagainst China as well as close allies, including Canada, Mexico and the European Union. These countriesquickly reacted with retaliatory tariffs against the US, raising investors’ concerns that the growing conflictcould evolve into a trade war impacting global economic growth. While economic growth in the current expansion has been generally uneven across regions, positiveglobal growth was in rare harmony during the period. In fact, according to the Organisation for EconomicCo-operation and Development (OECD), each of the 45 largest economies had positive GDP growth forthe first time in a decade. Strength in the US economy helped the unemployment rate fall to the lowestlevel since 2000, while manufacturing activity was robust across most countries, particularly in Europe.Earnings growth in the US so far in 2018 has jumped due to tax reform package, while internationally,earnings were broadly higher. For fiscal 2018, the broad Russell 3000 index of US stocks rallied 14.8%,while the MSCI All-Country ex-USA index of international stocks advanced 7.3%. Global monetary conditions remained accommodative, which supported economic growth and risk assets,even though policy is gradually shifting to tightening. While the Federal Reserve continued on a path ofmonetary policy normalization by raising interest rates three times during the period, monetary policiesof major central banks abroad remained more accommodative. The European Central Bank announcedplans to wind down bond purchases at the end of the year but committed to keeping benchmark interestrates at the current levels until mid to late 2019. Meanwhile, the Bank of Japan is continuing to buy bondsand stocks as part of its unprecedented monetary stimulus program. Returns for fixed income investments were challenged by interest rates that moved notably higher overthe period (prices move inversely to the direction of interest rates). The magnitude of interest rateincreases varied across maturities, with shorter term yields moving up more than longer term yields. Asa result, the yield curve flattened and the difference between the 2-year and 10-year Treasury yieldsreached the tightest spread since 2007. Investors closely watch the yield curve spread as it has historicallybeen a strong predictor of recessions, though it does not predict the timing of a recession. Credit spreadswere little changed over the fiscal year and remained near historically low levels. For the year, the broadBarclays Universal bond index fell 0.3%, while the Barclays High Yield index gained 2.6% and the BarclaysTIPS index was up 2.1%. Given the conditions described above, the System’s investments were positioned to benefit from marketgains, with an over-weighted exposure to public and private equities, while the System was substantiallyunder-weighted in fixed income, where holdings were more focused on credit and investments moresensitive to inflation and higher rates. Asset allocation and manager changes during the year had the netimpact of profit-taking in domestic equity to try and benefit from relative value opportunities elsewherein the world and repositioning the Fund’s fixed income to benefit more from rising interest rates. Looking forward to fiscal year 2019, the global economy is generally healthy, but faces many challenges.The economic expansion that began in mid-2009 is now nine years old, making it the second-longestexpansion on record. While an expansion does not end because of age, there are some signs that the USeconomy is transitioning towards the later stages of the economic cycle. The Federal Reserve is movingtowards tighter monetary policy, interest rates are moving higher, and the addition of fiscal stimulus to aneconomy already operating at or near full capacity may push inflation higher. While economies abroadare likely earlier in the economic cycle, their central banks are signaling they too will move towards lessaccommodative monetary policies. The escalating trade conflict between the US and its trading partnersis a threat to global growth, while political developments in Washington and abroad are likely to be asource of uncertainty. In the face of these uncertainties, we will continue to rely on the investment principles and riskmanagement guidelines that have served us well in the past and do our best to execute a sound investmentstrategy for the benefit of the System’s stakeholders.
Inv
estmen
tSec
tion
77DPERS 47th Comprehensive Annual Financial Report

Investment Philosophy and Objectives
In the investment of public funds, adequate funding of employee pensions is a paramount concern.Excessive risk taking could jeopardize that funding. An appropriate balance must be struck betweenrisks taken and returns sought to ensure the long-term health and affordability of the plans involved.For more than 30 years, the System has been managed to control the extent of downside risk to whichassets are exposed while maximizing the potential for long-term gain.
Specific investment objectives are:� Achieve a real return objective (DPERS return less CPI) of 3% over long periods
(approximately 15 years)� Manage portfolio risk by controlling downside price fluctuations of the Fund in any
12-month period� Maximize total investment returns, consistent with Board objectives.
To achieve these objectives, these investment guidelines are employed:� Allocate a minimum of 20% of assets to fixed income investments such as bonds, cash
equivalents, and certain real estate investments� Maintain a widely diversified portfolio, to minimize the risk of overexposure in any
one market segment or investment style � Monitor the performance of all investment managers using specific benchmarks� Control exposure in illiquid asset classes� Review, re-examine, and reconfirm the operation of the investment process regularly� Identify new long-term opportunities for risk reduction and improved investment returns� Review actuarial assumptions to ensure consistency with capital market expectations.
Investment ProcessWhile the objectives and policies have been repeatedly reaffirmed, the implementation processundergoes continuous evolution. The increasing volume of investment information and thecomplexities of the global marketplace necessitate the continuous review of data, trends, and markets.Ongoing enhancements are employed in every aspect of investment management, from assetallocation decisions to manager selection and performance measurement.
Basis of PresentationInvestment returns for the total System are based on data made available by the fund’s custodian, TheNorthern Trust Company (Northern Trust) and/or Investment Managers. These returns are calculatedgross of directly paid fees, on a time-weighted basis in accordance with accepted practices. Valuations,where available, are based on published pricing from national securities exchanges. Returns forperiods longer than one year are annualized.
General ManagementDuring each year the Investment Committee, with Board of Pension Trustees’ (Board) oversight, carriesout a number of general management practices to assure that the appropriate policies, controls, andresources are in place. Areas that are reviewed at least annually include:
� Investment objectives and policies based on an analysis of cash flow and liabilities� Management tools for decision making� Long-term risk and return levels for various investment options� Manager organization, performance, transaction costs, fees and expenses, proxy voting
procedures, and adherence to investment philosophy� System performance versus externally measured universes of similar funds� Contacts with other leading state investment funds to compare management practices� Policy objectives and performance of alternative investments (including limited
partnerships, and private LLCs).
Inv
estmen
tSec
tion
78 DPERS 47th Comprehensive Annual Financial Report

Investment Results
In Fiscal Year 2018, the investment process experienced:� Fair value annual rate of return of 10.6% on the beginning of year investable balance and
before investment expenses� Benefit and expense payments exceeded net employer and member contributions
by $345.7 million� Net investment gains of $970.9 million (investment gains less investment expenses)� Increase in fair value of investment portfolio from $9.5 billion to $10.1 billion� Overall volatility well below that of an all common stock portfolio.
Fifteen-Year Total Investment Rates of ReturnTotal Investment Portfolio
Fair Value Time-Weighted Annual Consumer(in millions) Annual Rate of Return Price Index Real Rate of Return
2009 $5,785.0 (15.5%) (1.4%) (14.1%)
2010 $6,362.1 14.4% 1.1% 13.3%
2011 $7,638.1 24.3% 3.6% 20.7%
2012 $7,530.0 2.0% 1.7% 0.3%
2013 $8,097.1 11.1% 1.8% 9.3%
2014 $9,232.3 17.5% 2.1% 15.4%
2015 $9,297.9 3.9% 0.1% 3.8%
2016 $8,860.8 (1.3%) 1.0% (2.3%)
2017 $9,494.5 11.3% 1.6% 9.7%
2018 $10,109.5 10.6% 2.9% 7.7%
Five Year 8.2% 1.5% 6.7%
Ten Year 7.3% 1.4% 5.9%
Fifteen Year 8.3% 2.1% 6.2%
Periods Ended June 30, 2018(All Returns Greater Than One Year Are Annualized)
Five Years Ten Years Fifteen Years
Total Fund Return 8.2% 7.3% 8.3%
S&P 500 Index Return 13.4% 10.2% 9.3%
Excess Return vs. S&P 500 Index (5.2%) (2.9%) (1.0%)
Relative Risk vs. S&P 500 Index 63.6% 59.3% 59.7%
Funds are invested for long-term results and each single year’s returns must be viewed in relation tolonger periods.
One investment objective is to achieve an annualized rate of total return over any 15-year period thatis at least 3 percentage points greater than inflation. The most recent 15-year result is a real rate ofreturn of 6.2% (8.3% system return less 2.1% CPI) measured on a time-weighted basis. During thisperiod, risk, as measured by relative volatility, was approximately 59.7% of the level that would havebeen experienced by a fund invested 100% in the S&P 500. The real rate of return from such a 100%stock portfolio would have been 7.2% (9.3% S&P 500 less 2.1% CPI). While 15-year investment marketreturns have been characterized by increased volatility, the portfolio has been successful at meetingthe real return objective of 3.0% (DPERS return less 3%) over the 15-year period.
Inv
estmen
tSec
tion
79DPERS 47th Comprehensive Annual Financial Report

Comparative Investment Results(time-weighted rate of return)
1 Year 3 Year 5 Year 10 Year
Domestic Equities(1) 8.5% 6.7% 8.8% 7.1%
S&P 500 14.4% 11.9% 13.4% 10.2%
Russell 3000 Index 14.8% 11.6% 13.3% 10.2%
Global Equities(2) 17.1% 12.6% 14.4% 8.2%
MSCI All Country World Index 10.7% 8.2% 9.4% 5.8%
International Equities(3) 4.9% 4.1% 5.2% 4.9%
MSCI All Country World Index ex-US 7.3% 5.1% 6.0% 2.5%
Total Equities 10.3% 8.1% 9.8% 7.4%
Equity Section Benchmark(4) 12.2% 9.4% 10.8% 7.6%
Fixed Income & Cash 1.3% 2.5% 2.7% 4.2%
Fixed Income Section Benchmark(5) (0.1)% 2.0% 2.5% 3.9%
Alternative Strategies(6) 24.7% 9.5% 12.1% 10.9%
Policy Benchmark(7) 7.0% 6.4% 7.4% 6.3%
Total System 10.6% 6.7% 8.2% 7.3%
Policy Benchmark(7) 7.0% 6.4% 7.4% 6.3%
Delaware Volunteer Firemen's Fund(8) 6.8% 6.1% 7.1% 6.6%
VFF Benchmark(9) 6.9% 6.2% 7.2% 6.2%
Consumer Price Index 2.9% 1.8% 1.5% 1.4%
(1) Includes domestic convertible securities and real estate investments; includes pooled domestic allocation portfolios.(2) Includes pooled global allocation portfolios.(3) Includes international convertible securities.(4) 65.52% Russell 3000, 34.48% MSCI ACWI ex US (Net)(5) 91.67% Barclays Universal, 3.57% Barclays TIPS, 4.76% 90-Day T-Bills(6) Includes Private Equity and other non-marketable investments. All returns are on a lagged basis, with the exception of quarter ended 6/30/18.(7) Since July 1, 2006: 38% Russell 3000, 20% MSCI ACWI ex-US, 38.5% Barclays Universal, 1.5% Barclays TIPS, 2% 90-day T-bills(8) Delaware Volunteer Firemen's Fund investments are invested separately from the other plans of DPERS.(9) Since July 1, 2008: 38% Russell 3000, 20% MSCI ACWI ex-US, 40% Barclays Aggregate, 2% 90-day T-bills
Inv
estmen
tSec
tion
80 DPERS 47th Comprehensive Annual Financial Report

Total Return Performance Comparison - 5 Years
Total Return Performance Comparison - 10 Years
60
90
120
150
180
210
240
6/30/13 6/30/14 6/30/15 6/30/16 6/30/17
DPERS
CPI
S&P 500
Barclays Govt/Corp
6/30/18
6/30
/201
3 =
100
0
50
100
150
250
200
300
6/30/08 6/30/10 6/30/12 6/30/14 6/30/16 6/30/18
6/
30/2
008
= 1
00
DPERS
CPI
S&P 500
Barclays Govt/Corp
Inv
estmen
tSec
tion
81DPERS 47th Comprehensive Annual Financial Report
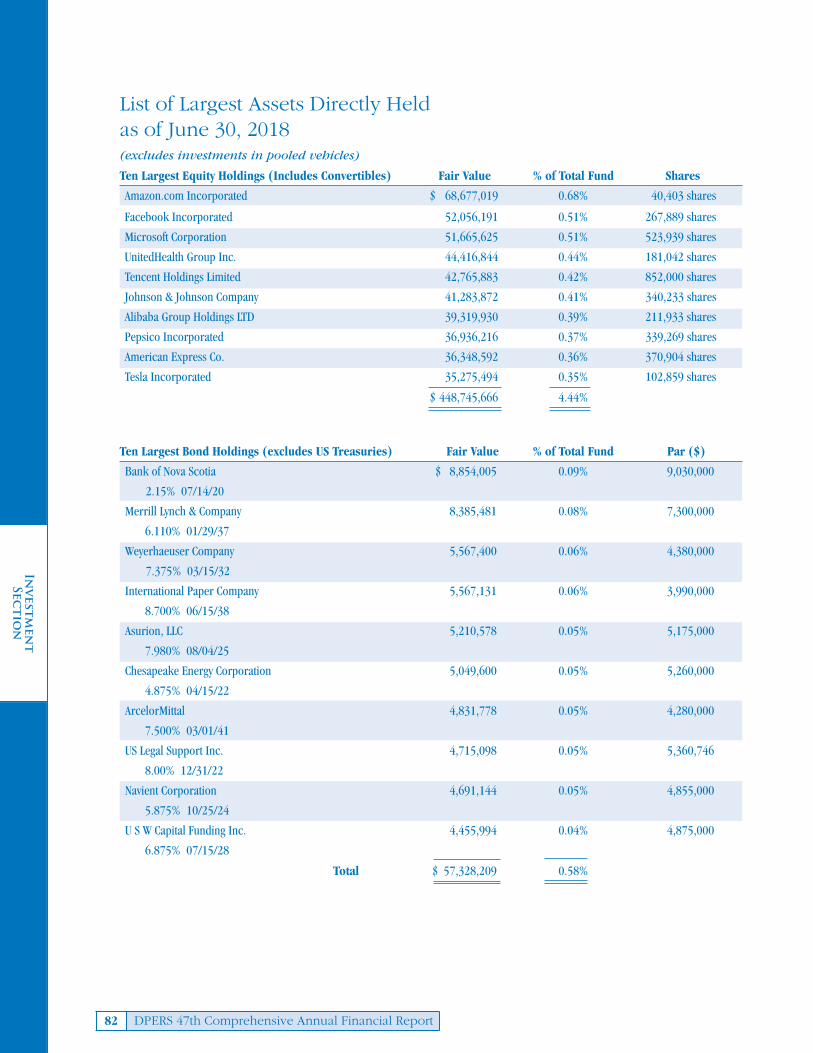
List of Largest Assets Directly Heldas of June 30, 2018(excludes investments in pooled vehicles)
Ten Largest Equity Holdings (Includes Convertibles) Fair Value % of Total Fund Shares
Amazon.com Incorporated $ 68,677,019 0.68% 40,403 shares
Facebook Incorporated 52,056,191 0.51% 267,889 shares
Microsoft Corporation 51,665,625 0.51% 523,939 shares
UnitedHealth Group Inc. 44,416,844 0.44% 181,042 shares
Tencent Holdings Limited 42,765,883 0.42% 852,000 shares
Johnson & Johnson Company 41,283,872 0.41% 340,233 shares
Alibaba Group Holdings LTD 39,319,930 0.39% 211,933 shares
Pepsico Incorporated 36,936,216 0.37% 339,269 shares
American Express Co. 36,348,592 0.36% 370,904 shares
Tesla Incorporated 35,275,494 0.35% 102,859 shares
$ 448,745,666 4.44%
Ten Largest Bond Holdings (excludes US Treasuries) Fair Value % of Total Fund Par ($)
Bank of Nova Scotia $ 8,854,005 0.09% 9,030,000
2.15% 07/14/20
Merrill Lynch & Company 8,385,481 0.08% 7,300,000
6.110% 01/29/37
Weyerhaeuser Company 5,567,400 0.06% 4,380,000
7.375% 03/15/32
International Paper Company 5,567,131 0.06% 3,990,000
8.700% 06/15/38
Asurion, LLC 5,210,578 0.05% 5,175,000
7.980% 08/04/25
Chesapeake Energy Corporation 5,049,600 0.05% 5,260,000
4.875% 04/15/22
ArcelorMittal 4,831,778 0.05% 4,280,000
7.500% 03/01/41
US Legal Support Inc. 4,715,098 0.05% 5,360,746
8.00% 12/31/22
Navient Corporation 4,691,144 0.05% 4,855,000
5.875% 10/25/24
U S W Capital Funding Inc. 4,455,994 0.04% 4,875,000
6.875% 07/15/28
Total $ 57,328,209 0.58%
Inv
estmen
tSec
tion
82 DPERS 47th Comprehensive Annual Financial Report

International Equities13.9%
International Fixed Income0.8%
Alternative Investments24.4%
Cash and Equivalents7.7%
Domestic Fixed Income22.5%
Domestic Equities30.7%
Asset Allocation
Funds are deployed in diverse asset classes offering the desired risk and return characteristics in an effort to achieve stated investment objectives. The accompanying table shows the most recent five-year history and trends in asset allocation. For these asset classifications, the Pooled Equity and FixedIncome accounts are included in their respective equity and fixed income asset classes and, therefore,are different from the asset classes used in the financial section on pages 24-25.
2018 2017 2016 2015 2014
Domestic Equities 30.7% 33.5% 33.6% 36.9% 39.5%
International Equities 13.9% 13.7% 10.2% 10.4% 7.0%
Domestic Fixed Income 22.5% 25.6% 29.2% 22.3% 20.9%
International Fixed Income 0.8% 1.0% 1.8% 1.9% 7.4%
Alternative Investments 24.4% 22.7% 22.2% 22.2% 19.0%
Cash and Equivalents 7.7% 3.5% 3.0% 6.3% 6.2%
Individual investment managers are selected for each asset class based on a rigorous set ofperformance and organizational criteria. In addition to a proven track record of managing a givenclass of assets, they must have a clearly stated and consistently applied investment policy and decisionmaking process, continuity of personnel, and a well-defined plan for retaining key personnel andcontrolling growth.
All investment managers are expected to maintain those organizational criteria in order tocontinue as managers.
The System’s investments continued to be allocated with a focus on liquidity and risk management.Asset allocation moves over the year involved shifting equity exposures toward international marketsand repositioning the Fund’s fixed income to benefit more from rising interest rates. Manager activityover the fiscal year saw two new manager accounts opened and four accounts terminated, while oneexisting account was increased and nine accounts were reduced. To help maintain exposure to privateinvestments there were five new commitments to private investment funds during the year.
Asset Allocationas of June 30, 2018
Inv
estmen
tSec
tion
83DPERS 47th Comprehensive Annual Financial Report

At the end of the fiscal year, the money managers of the System and their responsibilities were:
Investment Manager Mandate Fiscal Year Retained
Domestic EquitiesAJO Large Cap Equities 2017Focused Investors Large Cap Equities 2011Mellon Capital Management Large Cap Equities 1984T. Rowe Price Associates Domestic Equities 1989Vanguard Domestic Equities 2009Wellington Management Company Large Cap Equities 2011
International EquitiesBaillie Gifford Global Equities 2008Dimensional Fund Advisors International Equities 2017Dodge and Cox International Equities 2007Kiltearn Global Equity Global Equities 2013Orbis Investments International Equities 2018T. Rowe Price Associates International Equities 2018T. Rowe Price Associates Global Equities 2010Sanderson Asset Management, Inc. International Equities 2010Vanguard International Equities 2009
Domestic Fixed IncomeLoomis Sayles & Company Long Term Corporate Bonds 1999Mellon Capital Management Domestic Fixed Income 1984T. Rowe Price Associates Floating Rate Bank Loans 2011
Alternative InvestmentsAccel Partners Venture Capital 1984Accel-KKR Company Venture Capital 2001Allegis Capital Venture Capital 2005Advanced Technology Ventures Venture Capital 1990Angelo, Gordon & Co Hedge Fund and Distressed Debt 2007Atalaya Capital Management Distressed Debt 2011Bridgewater Associates Hedge Fund 2017The Carlyle Group Private Equity 1996Centerbridge Partners Hedge Fund 2009Cherry Tree Ventures Venture Capital 1984Flagship Pioneering Venture Capital 2005IDG Capital Partners Venture Capital 2006Lightstone Ventures Venture Capital 2013Liquid Realty Partners Real Assets 2008Main Post Capital Venture Capital 2013Marcus Capital Partners Real Assets 2014MeriTech Capital Partners Venture Capital 1999Oaktree Capital Management Distressed Debt 1998One Liberty Ventures Venture Capital 1995ONSET Enterprise Associates Venture Capital 1990Pecks Management Partners Private Debt 1986Riverstone Real Assets 2006Summit Ventures Venture Capital 1988Trident Capital Venture Capital 2000Viking Global Investors Hedge Fund 2012
Cash & Short-TermNorthern Trust Cash & Equivalents 2007
Inv
estmen
tSec
tion
84 DPERS 47th Comprehensive Annual Financial Report

Investment Summary andSchedule of Investment Fees(dollar values expressed in millions)
Total FiscalFair Value as of Percent of Total Year 2018 BasisJune 30, 2018 Investment Assets Investment Fees Points
Equities
Domestic Equities $ 3,104.3 30.7% $ 4.6
International Equities $ 1,412.2 13.9% $ 9.2
Sub-Total $ 4,516.5 44.6% $ 13.8
Fixed Income
Domestic Fixed Income $ 2,272.1 22.5% $ 3.7
International Fixed Income $ 80.4 0.8% 0.0
Sub-Total $ 2,352.5 23.3% $ 3.7
Other Asset Allocations
Alternative Investments $ 2,465.9 24.4% 0.0
Cast and Short Term $ 774.6 7.7% 0.0
Sub-Total $ 3,240.5 32.1% 0.0
Other Investment Services
Custodian/Investment Advisor Fees $ - - $ 5.4
Pension Office Support Staff Expenses $ - - $ 0.8
Sub-Total $ - - $ 6.2
$ 10,109.5 100.0% $ 23.7 24bp
* Other fees include Alternative Investment fees detailed on page 47. These fees have been excluded from the table above and the basispoints calculation since they have already been netted from income. Basis point calculation is the weighted average based on thequarterly fund valuations.
Glossary of Terms Used
Fair Value:The fair value of the System’s investments is defined as the price that would be received to sell an assetor paid to transfer a liability in an orderly transaction between market participants at the measurementdate. Fair values for fixed income and equity securities are derived from published market prices andquotations from national security exchanges or security pricing vendors. Where published prices,quotations, or vendor prices are not available, alternate valuation methods are used.
Time-Weighted Total Return:The measure used for judging investment management of the System. It is based on fair value andminimizes or eliminates any distortion in the rate of return caused by the timing of cash flows into orout of the System.
Alternative Investments:Alternative investments are ownership interests in investment limited partnerships or private LLCs,some of which may be illiquid.
Inv
estmen
tSec
tion
85DPERS 47th Comprehensive Annual Financial Report

Schedule of Broker Commissions
The System has no commission recapture, directed payment, or “soft dollar” arrangements; however,such arrangements may exist between brokers and investment managers. Broker selection is theresponsibility of individual investment managers.
The following is a list of brokers who received $10,000 or more in commissions during FiscalYear 2018. Total
Commission Dollar Amount TotalBroker # of Shares Per Share of Trades CommissionMORGAN STANLEY & CO. LLC 15,170,194 $0.00 $ 125,020,422 $ 70,979
JEFFERIES LLC 19,525,559 $0.00 290,561,407 59,209
CITIGROUP GLOBAL MARKETS INC. 7,558,973 $0.01 139,248,316 45,410
CREDIT SUISSE (HONG KONG) LIMITED 8,521,513 $0.01 32,799,288 44,891
FRIEDMAN BILLING AND RAMSEY 1,485,557 $0.30 29,876,062 44,567
GOLDMAN, SACHS & CO. 7,942,869 $0.01 144,742,525 44,563
J.P. MORGAN SECURITIES LLC 3,617,623 $0.01 166,103,567 43,091
WELLS FARGO BANK, N.A. 6,661,435 $0.01 176,093,680 38,149
UBS LIMITED 2,952,648 $0.01 37,998,830 32,229
DEUTSCHE BANK SECURITITES 2,277,978 $0.01 133,550,818 30,893
CLSA LIMITED 23,982,555 $0.00 19,298,923 27,952
MERRILL LYNCH PIECE FENNER & SMITH 751,875 $0.03 17,010,725 21,286
BANK OF AMERICA CORPORATION 1,583,840 $0.01 138,590,977 20,553
MERRILL LYNCH INTERNATIONAL LIMITED 5,412,910 $0.00 24,614,100 18,444
SANFORD C. BERNSTEIN LTD 7,422,974 $0.00 64,239,343 15,860
MACQUARIE BANK LIMITED 15,427,488 $0.00 8,455,941 15,047
INSTINET, LLC 1,793,163 $0.01 105,843,570 14,545
UBS SECURITIES LLC 486,834 $0.03 8,332,783 14,214
BARCLAYS CAPITAL 755,510 $0.02 32,984,667 14,108
RBC CAPITAL MARKETS, LLC 1,756,448 $0.01 87,814,754 13,640
DEUTSCHE SECURITIES ASIA LIMITED 13,032,890 $0.00 6,731,117 13,307
BANCO SANTANDER S.A. NEW YORK 1,905,325 $0.01 6,949,717 12,562
CREDIT SUISSE SECURITIES (USA) LLC 545,260 $0.02 26,159,635 12,562
CREDIT SUISSE SECURITIES(EUROPE)LTD 813,416 $0.01 15,359,523 12,035
SG AMERICAS SECURITIES, LLC 1,426,380 $0.01 73,062,922 11,715
All Others ( 132 Brokers Not Listed) 34,205,511 $0.01 601,093,947 208,191
Totals 187,016,728 $ 2,512,537,559 $ 900,002
Average Commission, Per Share $ -
Inv
estmen
tSec
tion
86 DPERS 47th Comprehensive Annual Financial Report

Delaware Public Employees’ Retirement System
Annual Fair Value of Fund and Rate of ReturnFor the 15-Year Period 2003-2018
The Investment Section is prepared by the Pension Office staff with input from the Board of PensionTrustees, the Investment Committee, and the Investment Advisor.
2003 2008 2013 2018
Inv
estmen
tSec
tion
87DPERS 47th Comprehensive Annual Financial Report

This page intentionally left blank.
Inv
estmen
tSec
tion
88 DPERS 47th Comprehensive Annual Financial Report
DelawarePublic
Employees’Retirement
System— A component unit of the State of Delaware
Forty-Seventh ComprehensiveAnnual Financial Report
Presented by the DPERS Board of Pension TrusteesFor the Fiscal Year Ended June 30
2018
ACTUARIALSECTION

October 26, 2018
Board of Pension TrusteesDelaware Public Employees’ Retirement System McArdle Building860 Silver Lake Blvd., Suite 1 Dover, DE 19904-2402
Dear Board Members:
At your request, we have prepared our annual actuarial valuations of each of the funded pension plansadministered by the Board as of June 30, 2017. The results of these valuations are contained in theenclosed exhibits. Any distribution of the exhibits must be in their entirety, including this cover letter,unless prior written consent is obtained. The contributions actually made during FY 2018 were developedin the 2016 actuarial valuations. The basis for the GASB No. 67 net pension liability is the 2017 actuarialvaluations rolled forward to June 30, 2018.
Funding Objective
The funding objective of the System is to establish contribution rates that, over time, will remain level asa percentage of payroll. In order to achieve this, we developed a contribution rate that will provide forcurrent cost (i.e., normal cost expressed as a level percentage of payroll) plus a level percentage of payrollamortizations of each layer of the unfunded liability over a specified period. In addition, unfundedliabilities due to cost-of-living adjustments to retirees are funded through a schedule of future transfersfrom the Post-Retirement Increase Fund.
To our knowledge, the State has consistently funded the full amounts required based on the actuarialvaluations and specific statutory provisions.
Assumptions and Methods
The actuarial assumptions and methods used in the 2017 funding valuations were based on the mostrecent experience study completed during the fiscal year ended June 30, 2016. The Board set theinvestment return assumption based on advice from its investment consultant and did reduce thisassumption from 7.2% to 7.0% for the 2017 valuations.
We believe that all costs, liabilities, rates of interest, and other factors for the System have been determinedon the basis of actuarial assumptions and methods that are individually reasonable (taking into accountthe experience of the System and reasonable expectations) and that, in combination, offer our bestestimate of anticipated experience affecting the System. Nevertheless, the emerging costs rely on futureplan experience conforming to the underlying assumptions and methods outlined in this report. To theextent that the actual experience of the Programs deviates from the underlying assumptions and methods,or there are any changes in plan provisions or applicable law, the results will vary accordingly.
Actuarial computations presented in this report are for purposes of determining the recommendedfunding amounts for the System. Actuarial computations under GASB Statement No. 67 are for purposesof fulfilling financial accounting requirements. The computations prepared for these two purposes maydiffer. The calculations in the enclosed exhibits have been made on a basis consistent with ourunderstanding of the System’s funding requirements and goals and of GASB Statement No. 67.Determinations for purposes other than meeting these requirements may be significantly different fromthe results contained in this report. Accordingly, additional determinations may be needed for otherpurposes.
Ac
tuar
ialSec
tion
90 DPERS 47th Comprehensive Annual Financial Report

This report was prepared for the Delaware Public Employees’ Retirement System for the purposesdescribed herein and for the use by the plan auditor in completing an audit related to the matters herein.Other users of this report are not intended users as defined in the Actuarial Standards of Practice, andCheiron assumes no duty or liability to any other user.
Reliance on Others
In performing our report, we relied on information, some oral and some written, supplied by theDelaware Public Employees’ Retirement System. This information includes, but is not limited to, theplan provisions, membership data, and financial information. We performed an informal examinationof the obvious characteristics of the data for reasonableness and consistency in accordance with ActuarialStandard of Practice No. 23.
We performed a limited review of the data used directly in our analysis for reasonableness andconsistency and have not found material defects in the data. If there are material defects in the data, itis possible that they would be uncovered by a detailed, systematic review and comparison of the datato search for data values that are questionable. Such a review was beyond the scope of our assignment.
Supporting Schedules
Cheiron is responsible for providing all figures in the following schedules of the Financial Section:Membership Data, Current Funded Status of the Plans, Plan Actuarial Methods, Schedule of Changes inNet Pension Liability, and Schedule of Employer Contributions. In addition, we were responsible for theinformation provided in the following schedules found in the Actuarial Section: Actuarial Assumptionsand Methods, Schedule of Active Member Valuation Data, Solvency Test, and Analysis of FinancialExperience for the State Employees’ Pension Plan.
Certification
I hereby certify that, to the best of my knowledge, this report and its contents are work products ofCheiron, Inc. These work products are complete and accurate and have been prepared in accordancewith generally recognized and accepted actuarial principles and practices which are consistent with theCode of Professional Conduct and applicable Standard of Practice set out by the Actuarial StandardsBoard, including the use of assumptions and methods for funding purposes that comply with theActuarial Standards of Practice. Furthermore, as a credentialed actuary, I meet the Qualification Standardsof the American Academy of Actuaries to render the opinion contained in this report. This report doesnot address any contractual or legal issues. We are not attorneys, and our firm does not provide any legalservice or advice.
Board of Pension TrusteesOctober 26, 2018Page 2
Sincerely, Cheiron
Fiona E. Liston, FSA, EAPrincipal Consulting Actuary
Ac
tuar
ialSec
tion
91DPERS 47th Comprehensive Annual Financial Report
Actuarial Assumptions and Methods
Asset Valuation Method
The market value of assets, representing the realizable value of the assets on a particular day, is notnecessarily an appropriate value for the purpose of setting contribution rates. This is because fundingwill take place over a long period of time during which market values can be expected to fluctuatesignificantly from year to year. If market values were used to develop contribution rates, the resultingcontribution rates would also fluctuate from year to year.
In order to produce a stable pattern of contribution rates, market values are adjusted to remove someof the volatility. The actuarial value of assets is equal to 1/5th of the market value plus 4/5th of theexpected value, where the expected value is equal to last year’s actuarial value and subsequent cashflows into and out of the fund accumulated with interest at the prior year valuation rate of 7.0 percentper annum.
Funding Method
We used the Individual Entry Age Normal Method to determine costs for all plans. Under an EntryAge method, a total contribution rate is determined which consists of two elements: the normal costrate and the unfunded liability rate (UAL). In addition, the overall contribution rate includes a provisionfor the plan’s expenses.
For each State plan, an Entry Age Normal cost rate is determined for each member of each respectiveplan. This rate represents the member’s expected future employer-paid normal costs divided by hisexpected future salary, where both measurements are made as of the member’s original entry date tothe System.
In addition to contributions required to meet the normal cost, contributions are required to meet eachplan’s unfunded actuarial liability. Actuarial liability equals the present value of future benefits less thepresent value of future normal costs and future employee contributions. The unfunded liability is thetotal actuarial liability for all members less the actuarial value of the System’s assets.
A portion of the unfunded liability will be paid through future, scheduled transfers from the Post-Retirement Increase Fund. These transfers will cover the liability increases due to the cost-of-livingincreases granted on January 1, 2015. The remaining unfunded actuarial liability will be amortizedover an open 20-year period for the State Employees’ Plan and State Police Plan and over an openperiod of 15 years for the Judiciary Plan, the Volunteer Firemen’s Plan, and the Diamond State PortCorporation plan through the unfunded liability amortization component of the total contribution.We note that in the case where amortization is being performed over an open period, the unfundedliability amount is projected to decrease over time but not actually reach zero when all assumptionsare met.
Board of Pension TrusteesOctober 26, 2018Page 3
Ac
tuar
ialSec
tion
92 DPERS 47th Comprehensive Annual Financial Report

Actuarial Assumptions
The actuarial assumptions for valuation purposes are based on the experience study completed in2016. The investment return assumption has since been reduced after analysis and recommendationby the Board’s Investment Committee. Please refer to the 2016 study for rationale in choosing theassumptions. Differences between assumed and actual experience (actuarial gains and losses) arepart of the unfunded actuarial liabilities. The following significant assumptions were used in theactuarial valuations as of July 1, 2017:
1. Rate of return on investments:7.0% compounded annually (adopted 2017)
2. Salary increases attributable to inflation:2.5% compounded annually (adopted 2016)
3. Salary increases attributable to merit and productivity:Increases for State Employees ranging from 0.0% to 9.0% per year (adopted 2014)
4. Mortality:Rates of mortality vary by gender. For retirees, the assumption anticipates futureimprovements in mortality through the use of a fully generational projection scale(adopted 2016). Sample retiree mortality rates from the State Employees plan are as follows:
Sample Rates in 2017Age Male Female
50 0.43% 0.27%
55 0.62% 0.36%
60 0.83% 0.52%
65 1.18% 0.80%
70 1.83% 1.29%
75 2.99% 2.11%
Male: 110% of RP-2014 Total Dataset Male Healthy Annuitant MortalityTable adjusted back to 2006 with MP-2014 prior to application ofgenerational mortality improvement scale.
Female: 100% of RP-2014 Total Dataset Female Healthy AnnuitantMortality Table adjusted back to 2006 with MP-2014 prior to applicationof generational mortality improvement scale.
5. Rates of termination of service, disablement, and retirement:Based on the results of the Experience Study completed in 2016 (adopted 2016).
6. Aggregate active member payroll:2.50% annually (adopted 2016).
Summary of Plan Provisions and Changes in Plan Provisions
The plans valued are those described on pages 30-33 of the Financial Section.
Board of Pension TrusteesOctober 26, 2018Page 4
Ac
tuar
ialSec
tion
93DPERS 47th Comprehensive Annual Financial Report
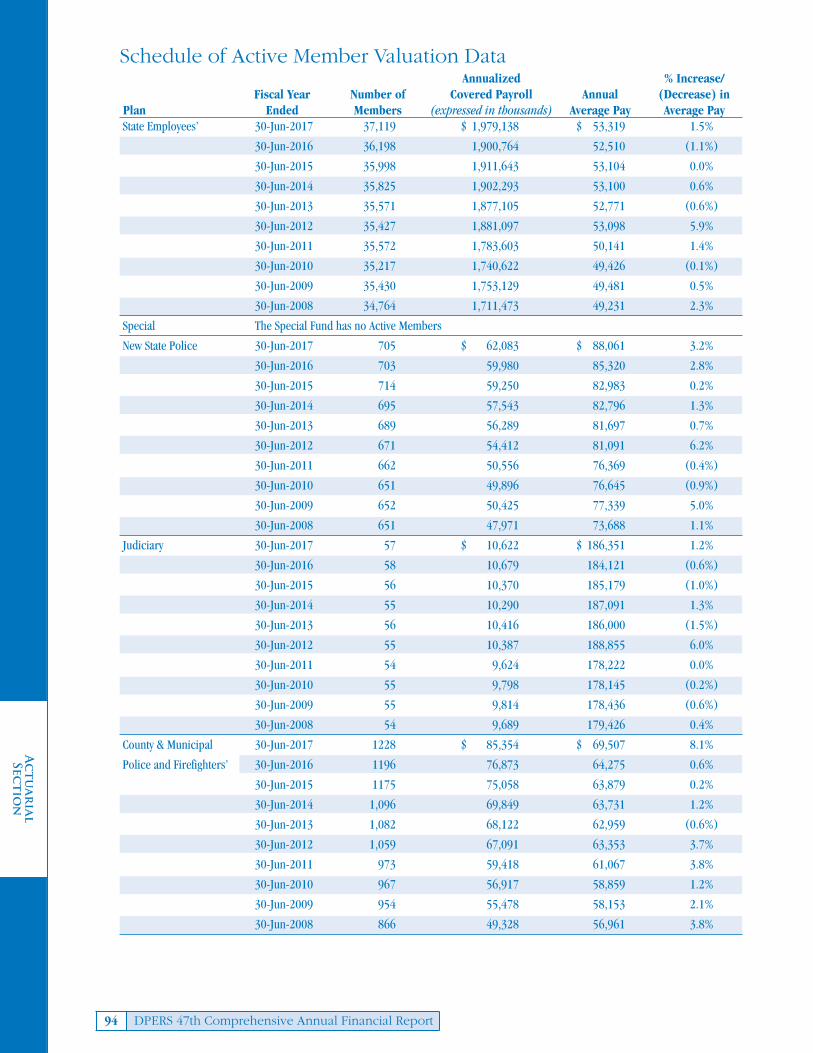
Schedule of Active Member Valuation DataAnnualized % Increase/
Fiscal Year Number of Covered Payroll Annual (Decrease) inPlan Ended Members (expressed in thousands) Average Pay Average PayState Employees’ 30-Jun-2017 37,119 $ 1,979,138 $ 53,319 1.5%
30-Jun-2016 36,198 1,900,764 52,510 (1.1%)
30-Jun-2015 35,998 1,911,643 53,104 0.0%
30-Jun-2014 35,825 1,902,293 53,100 0.6%
30-Jun-2013 35,571 1,877,105 52,771 (0.6%)
30-Jun-2012 35,427 1,881,097 53,098 5.9%
30-Jun-2011 35,572 1,783,603 50,141 1.4%
30-Jun-2010 35,217 1,740,622 49,426 (0.1%)
30-Jun-2009 35,430 1,753,129 49,481 0.5%
30-Jun-2008 34,764 1,711,473 49,231 2.3%
Special The Special Fund has no Active Members
New State Police 30-Jun-2017 705 $ 62,083 $ 88,061 3.2%
30-Jun-2016 703 59,980 85,320 2.8%
30-Jun-2015 714 59,250 82,983 0.2%
30-Jun-2014 695 57,543 82,796 1.3%
30-Jun-2013 689 56,289 81,697 0.7%
30-Jun-2012 671 54,412 81,091 6.2%
30-Jun-2011 662 50,556 76,369 (0.4%)
30-Jun-2010 651 49,896 76,645 (0.9%)
30-Jun-2009 652 50,425 77,339 5.0%
30-Jun-2008 651 47,971 73,688 1.1%
Judiciary 30-Jun-2017 57 $ 10,622 $ 186,351 1.2%
30-Jun-2016 58 10,679 184,121 (0.6%)
30-Jun-2015 56 10,370 185,179 (1.0%)
30-Jun-2014 55 10,290 187,091 1.3%
30-Jun-2013 56 10,416 186,000 (1.5%)
30-Jun-2012 55 10,387 188,855 6.0%
30-Jun-2011 54 9,624 178,222 0.0%
30-Jun-2010 55 9,798 178,145 (0.2%)
30-Jun-2009 55 9,814 178,436 (0.6%)
30-Jun-2008 54 9,689 179,426 0.4%
County & Municipal 30-Jun-2017 1228 $ 85,354 $ 69,507 8.1%
Police and Firefighters’ 30-Jun-2016 1196 76,873 64,275 0.6%
30-Jun-2015 1175 75,058 63,879 0.2%
30-Jun-2014 1,096 69,849 63,731 1.2%
30-Jun-2013 1,082 68,122 62,959 (0.6%)
30-Jun-2012 1,059 67,091 63,353 3.7%
30-Jun-2011 973 59,418 61,067 3.8%
30-Jun-2010 967 56,917 58,859 1.2%
30-Jun-2009 954 55,478 58,153 2.1%
30-Jun-2008 866 49,328 56,961 3.8%
Ac
tuar
ialSec
tion
94 DPERS 47th Comprehensive Annual Financial Report

Schedule of Active Member Valuation Data (continued)
Annualized % Increase/
Fiscal Year Number of Covered Payroll Annual (Decrease) inPlan Ended Members (expressed in thousands) Average Pay Average Pay
County & Municipal 30-Jun-2017 781 $ 38,483 $ 49,274 1.9%
Other Employees’ 30-Jun-2016 743 35,937 48,367 (2.3%)
30-Jun-2015 646 31,983 49,509 1.0%
30-Jun-2014 586 28,716 49,003 1.1%
30-Jun-2013 543 26,332 48,494 4.4%
30-Jun-2012 483 22,435 46,449 2.5%
30-Jun-2011 454 20,580 45,330 1.0%
30-Jun-2010 459 20,591 44,861 1.0%
30-Jun-2009 429 19,046 44,396 1.7%
30-Jun-2008 427 18,632 43,635 8.4%
Closed State Police The Closed State Police Fund has no Active Members
Diamond State Port 30-Jun-2017 272 $ 12,912 $ 47,471 (0.7%)
Corporation 30-Jun-2016 259 12,376 47,784 3.3%
30-Jun-2015 255 11,791 46,239 0.2%
30-Jun-2014 274 12,644 46,146 (3.5%)
30-Jun-2013 238 11,381 47,819 3.6%
30-Jun-2012 265 12,229 46,147 5.5%
30-Jun-2011 255 11,150 43,725 0.1%
30-Jun-2010 257 11,224 43,673 10.1%
30-Jun-2009 279 11,071 39,681 8.6%
30-Jun-2008 281 10,270 36,548 (3.5%)
Delaware 30-Jun-2017 4,479 $ - $ - 0.0%
Volunteer 30-Jun-2016 4,617 - - -
Firemen’s 30-Jun-2015 4,742 - - -
30-Jun-2014 4,882 - - -
30-Jun-2013 4,882 - - -
30-Jun-2012 4,871 - - -
30-Jun-2011 4,933 - - -
30-Jun-2010 4,898 - - -
30-Jun-2009 5,074 - - -
30-Jun-2008 5,066 - - -
Ac
tuar
ialSec
tion
95DPERS 47th Comprehensive Annual Financial Report

Schedule of Retirants and BeneficiariesAdded to and Removed from Rolls
Added to Rolls Removed from Rolls
Annual Annual Fiscal Year Allowance Allowances
Plan Ended Additions (expressed in thousands) Deletions (expressed in thousands)State Employees' 30-Jun-2017 1,579 $ 35,508 879 $ 12,336
30-Jun-2016 1,924 44,774 837 11,530 30-Jun-2015 1,637 41,817 901 10,181 30-Jun-2014 1,622 34,371 845 10,53230-Jun-2013 1,603 36,118 835 9,84630-Jun-2012 1,459 35,304 824 9,28530-Jun-2011 1,339 36,190 839 8,56730-Jun-2010 1,673 38,613 843 10,47230-Jun-2009 1,330 31,401 750 8,61330-Jun-2008 1,363 29,455 680 7,497
Special 30-Jun-2017 - $ - - $ - 30-Jun-2016 1 7 3 23 30-Jun-2015 - - - -30-Jun-2014 - - - -30-Jun-2013 - - 2 730-Jun-2012 - (1) 1 330-Jun-2011 1 3 3 930-Jun-2010 - - 4 1230-Jun-2009 1 4 6 2230-Jun-2008 - - 2 4
New State Police 30-Jun-2017 21 $ 1,515 1 $ 56 30-Jun-2016 36 3,213 - - 30-Jun-2015 22 1,823 1 4030-Jun-2014 13 1,028 1 -30-Jun-2013 16 1,117 2 6630-Jun-2012 31 2,089 2 1630-Jun-2011 18 1,231 1 2030-Jun-2010 27 1,535 2 -30-Jun-2009 18 1,006 1 4030-Jun-2008 12 613 1 39
Judiciary 30-Jun-2017 6 $ 665 6 $ 342 30-Jun-2016 5 421 1 62 30-Jun-2015 4 568 5 289 30-Jun-2014 5 470 2 6830-Jun-2013 3 308 - -30-Jun-2012 1 79 2 9930-Jun-2011 3 322 2 6830-Jun-2010 3 308 1 7530-Jun-2009 4 378 2 15830-Jun-2008 2 153 3 148
County & Municipal 30-Jun-2017 44 $ 1,575 3 $ 80 Police and Firefighters' 30-Jun-2016 24 1,138 - -
30-Jun-2015 23 839 - -30-Jun-2014 15 584 - -30-Jun-2013 9 297 1 1630-Jun-2012 13 453 2 1430-Jun-2011 13 358 1 2730-Jun-2010 12 450 - -30-Jun-2009 8 252 - -30-Jun-2008 5 132 1 7
Ac
tuar
ialSec
tion
96 DPERS 47th Comprehensive Annual Financial Report

Schedule of Retirants and Beneficiaries Added to and Removed from Rolls (continued)
Added to Rolls Removed from Rolls
Annual Annual Fiscal Year Allowance Allowances
Plan Ended Additions (expressed in thousands) Deletions (expressed in thousands)County & Municipal 30-Jun-2017 21 $ 318 3 $ 24 Other Employees' 30-Jun-2016 16 217 2 13
30-Jun-2015 9 100 3 14 30-Jun-2014 10 122 3 1530-Jun-2013 15 114 1 130-Jun-2012 12 117 2 4230-Jun-2011 10 66 2 1830-Jun-2010 9 99 1 4130-Jun-2009 6 75 - -30-Jun-2008 3 17 - -
Delaware Volunteer 30-Jun-2017 146 $ 161 68 $ 61 Firemen's 30-Jun-2016 146 156 72 64
30-Jun-2015 111 128 69 60 30-Jun-2014 125 134 58 4430-Jun-2013 90 100 67 5630-Jun-2012 97 108 63 5230-Jun-2011 115 126 53 4630-Jun-2010 110 118 66 4630-Jun-2009 104 114 61 5130-Jun-2008 123 132 48 41
Diamond State 30-Jun-2017 15 $ 142 4 $ 53 Port Corporation 30-Jun-2016 8 74 7 46
30-Jun-2015 16 155 1 8 30-Jun-2014 18 224 2 530-Jun-2013 5 41 1 730-Jun-2012 2 19 1 1630-Jun-2011 7 77 3 2530-Jun-2010 6 48 1 1030-Jun-2009 2 12 - -30-Jun-2008 1 3 1 14
Closed State Police 30-Jun-2017 9 $ 293 20 $ 910 30-Jun-2016 5 537 7 290 30-Jun-2015 3 425 16 68730-Jun-2014 8 723 16 657 30-Jun-2013 5 1,018 13 45330-Jun-2012 11 1,572 21 76730-Jun-2011 8 234 9 27130-Jun-2010 12 415 14 58530-Jun-2009 12 1,403 10 38530-Jun-2008 13 1,115 13 437
Ac
tuar
ialSec
tion
97DPERS 47th Comprehensive Annual Financial Report

Schedule of Retirants and Beneficiaries Added to and Removed from Rolls (continued)
On Roll at Year End
Annual Average % ChangeFiscal Year Year End Allowance Annual in Annual
Plan Ended Total (expressed in thousands) Allowance AllowanceState Employees' 30-Jun-2017 26,879 $ 594,895 $ 22,132 4.1%
30-Jun-2016 26,179 571,723 21,839 6.2%30-Jun-2015 25,092 538,480 21,460 6.7%30-Jun-2014 24,356 504,593 20,844 4.5%30-Jun-2013 23,579 483,005 20,485 5.8%30-Jun-2012 22,811 456,733 20,070 6.0%30-Jun-2011 22,176 430,713 19,496 6.9%30-Jun-2010 21,676 403,091 18,686 7.5%30-Jun-2009 20,846 374,950 18,071 6.5%30-Jun-2008 20,266 352,161 17,450 6.6%
Special 30-Jun-2017 7 $ 27 $ 3,872 0.0%30-Jun-2016 7 27 3,872 (37.2%)30-Jun-2015 9 43 4,725 1.3%30-Jun-2014 9 42 4,678 -30-Jun-2013 9 42 4,667 (13.2%)30-Jun-2012 11 48 4,408 (7.2%)30-Jun-2011 12 52 4,352 (10.4%)30-Jun-2010 14 58 4,163 (17.58%)30-Jun-2009 18 70 3,929 (20.5%)30-Jun-2008 23 89 3,866 (4.3%)
New State Police 30-Jun-2017 262 $ 17,423 $ 66,499 9.1%30-Jun-2016 242 15,964 65,965 25.2%30-Jun-2015 206 12,751 61,896 16.2%30-Jun-2014 185 10,975 59,008 10.4%30-Jun-2013 173 9,940 57,457 11.8%30-Jun-2012 159 8,889 56,258 30.4%30-Jun-2011 130 6,815 52,829 21.6%30-Jun-2010 113 5,604 49,593 37.72%30-Jun-2009 88 4,069 47,317 31.2%30-Jun-2008 71 3,102 43,701 22.7%
Judiciary 30-Jun-2017 51 $ 4,760 $ 93,326 7.3%30-Jun-2016 51 4,436 86,976 8.8%30-Jun-2015 47 4,077 86,738 12.9%30-Jun-2014 48 3,612 80,270 6.4%30-Jun-2013 45 3,396 75,467 10.0%30-Jun-2012 42 3,088 73,520 (0.6%)30-Jun-2011 43 3,107 72,257 8.9%30-Jun-2010 42 2,853 67,917 8.92%30-Jun-2009 40 2,618 65,471 9.2%30-Jun-2008 38 2,399 63,122 0.2%
County & Municipal 30-Jun-2017 190 $ 6,708 $ 35,304 28.7%
Police and Firefighters’ 30-Jun-2016 149 5,213 34,989 28.0%
30-Jun-2015 125 4,074 32,596 25.9%
30-Jun-2014 102 3,236 31,723 22.0%
30-Jun-2013 87 2,652 30,483 11.8%
30-Jun-2012 79 2,371 30,018 22.7%
30-Jun-2011 68 1,933 28,845 20.7%
30-Jun-2010 56 1,602 28,599 39.05%
30-Jun-2009 44 1,151 26,176 28.1%
30-Jun-2008 36 899 24,979 16.1%
Ac
tuar
ialSec
tion
98 DPERS 47th Comprehensive Annual Financial Report

Schedule of Retirants and Beneficiaries Added to and Removed from Rolls (continued)
On Roll at Year End
Annual Average % ChangeFiscal Year Year End Allowance Annual in Annual
Plan Ended Total (expressed in thousands) Allowance AllowanceCounty & Municipal 30-Jun-2017 115 $ 1,203 $ 10,458 32.3%
Other Employees' 30-Jun-2016 97 909 9,371 28.9%
30-Jun-2015 83 705 8,493 15.4%
30-Jun-2014 77 611 8,147 19.3%
30-Jun-2013 70 512 7,314 28.6%
30-Jun-2012 56 398 7,109 23.2%
30-Jun-2011 46 323 7,023 17.7%
30-Jun-2010 38 275 7,224 26.79%
30-Jun-2009 30 216 7,218 53.7%
30-Jun-2008 24 141 5,871 14.6%Delaware Volunteer 30-Jun-2017 1,901 $ 2,062 $ 1,085 5.1%
Firemen’s 30-Jun-2016 1,823 1,961 1,076 4.9%
30-Jun-2015 1,749 1,870 1,069 4.1%
30-Jun-2014 1,707 1,796 1,057 4.9 %
30-Jun-2013 1,640 1,712 1,044 2.6%
30-Jun-2012 1,617 1,668 1,034 3.5%
30-Jun-2011 1,583 1,612 1,022 5.2%
30-Jun-2010 1,521 1,532 1,007 4.95%
30-Jun-2009 1,477 1,459 994 4.5%
30-Jun-2008 1,434 1,397 977 7.0%Diamond State 30-Jun-2017 92 $ 884 $ 9,610 11.2%
Port Corporation 30-Jun-2016 81 795 9,816 3.7%
30-Jun-2015 80 767 9,587 21.7%
30-Jun-2014 65 630 9,135 57.6%
30-Jun-2013 49 400 8,163 9.2%
30-Jun-2012 45 366 8,143 0.8%
30-Jun-2011 44 364 8,262 16.6%
30-Jun-2010 40 312 7,795 13.96%
30-Jun-2009 35 273 7,817 5.0%
30-Jun-2008 33 261 7,897 (3.7%)Closed State Police 30-Jun-2017 494 $ 23,200 $ 46,964 (2.6%)
30-Jun-2016 505 23,816 47,161 1.0%
30-Jun-2015 507 23,569 46,488 2.6%
30-Jun-2014 520 22,982 44,218 (3.3%)
30-Jun-2013 528 23,764 45,008 2.4%
30-Jun-2012 536 23,200 43,364 3.6%
30-Jun-2011 546 22,395 41,168 (0.2%)
30-Jun-2010 547 22,432 41,161 (0.75%)
30-Jun-2009 549 22,602 41,170 4.7%
30-Jun-2008 547 21,584 39,459 3.2%
Ac
tuar
ialSec
tion
99DPERS 47th Comprehensive Annual Financial Report

Solvency Test(dollar values expressed in thousands)
Aggregate Accrued Liabilities forActive Active Member Actuarial Portion of Accrued
Valuation Member Retirants & Employer Financed Value of Liabilities CoveredDate Contributions Beneficiaries Contributions Reported by Reported Assets
Plan (1) (2) (3) Assets (1) (2) (3)
State Employees’ 30-Jun-2017 $ 704,684 $ 5,932,584 $ 3,407,315 $8,688,641 100% 100% 60%
30-Jun-2016 666,617 5,641,344 3,196,831 8,460,614 100% 100% 67%
30-Jun-2015 657,050 5,172,570 3,221,414 8,289,879 100% 100% 76%
30-Jun-2014 633,353 4,901,957 3,204,762 8,067,032 100% 100% 79%
30-Jun-2013 606,874 4,600,135 3,050,261 7,519,770 100% 100% 76%
30-Jun-2012 629,639 4,370,623 2,949,593 7,270,430 100% 100% 77%
30-Jun-2011 558,065 4,123,360 2,866,526 7,091,821 100% 100% 84%
30-Jun-2010 527,578 3,873,286 2,695,462 6,808,957 100% 100% 89%
30-Jun-2009 508,790 3,608,850 2,709,366 6,744,050 100% 100% 97%
30-Jun-2008 470,813 3,390,993 2,688,050 6,751,949 100% 100% 108%
Special 30-Jun-2017 $ - $ 145 $ - $ 226 N/A 156% N/A
30-Jun-2016 - 151 - 242 N/A 160% N/A
30-Jun-2015 - 210 - 279 N/A 133% -
30-Jun-2014 - 218 - 308 N/A 142% -
30-Jun-2013 - 224 - 329 N/A 147% -
30-Jun-2012 - 264 - 366 N/A 139% -
30-Jun-2011 - 287 - 406 N/A 141% -
30-Jun-2010 - 333 - 457 N/A 137% -
30-Jun-2009 - 399 - 516 N/A 129% -
30-Jun-2008 - 492 - 614 N/A 125% -
New State Police 30-Jun-2017 $ 59,849 $ 213,938 $ 223,748 $ 437,917 100% 100% 73%
30-Jun-2016 56,169 193,065 204,159 411,481 100% 100% 79%
30-Jun-2015 53,739 153,510 206,783 388,587 100% 100% 88%
30-Jun-2014 53,289 132,801 200,434 358,663 100% 100% 86%
30-Jun-2013 49,201 117,660 184,024 317,814 100% 100% 82%
30-Jun-2012 45,534 105,829 173,535 292,262 100% 100% 81%
30-Jun-2011 43,865 81,299 161,726 270,625 100% 100% 90%
30-Jun-2010 40,955 65,550 153,753 245,303 100% 100% 90%
30-Jun-2009 38,619 47,700 154,932 229,457 100% 100% 92%
30-Jun-2008 35,707 36,474 142,740 216,368 100% 100% 101%
Aggregate accrued Liability at June 30, 2017 is calculated using the funding assumptions and does not agree with the Total PensionLiability shown as of the same date in the Financial Section.
Ac
tuar
ialSec
tion
100 DPERS 47th Comprehensive Annual Financial Report
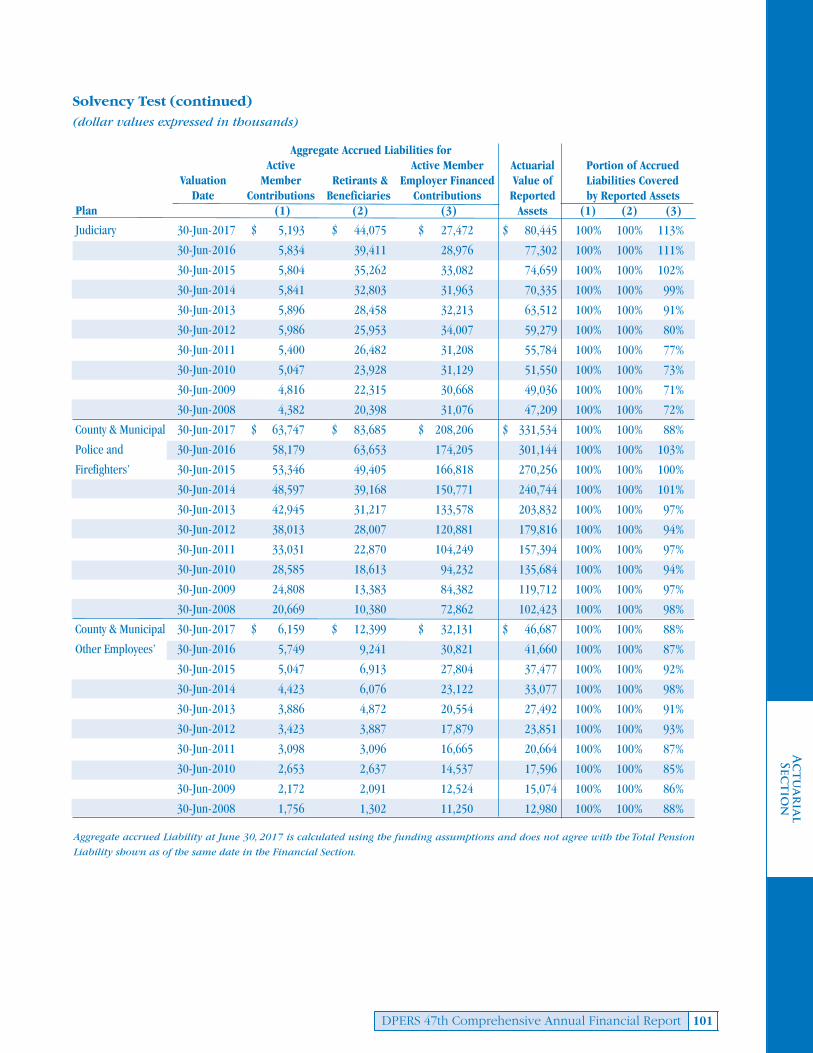
Solvency Test (continued)(dollar values expressed in thousands)
Aggregate Accrued Liabilities forActive Active Member Actuarial Portion of Accrued
Valuation Member Retirants & Employer Financed Value of Liabilities CoveredDate Contributions Beneficiaries Contributions Reported by Reported Assets
Plan (1) (2) (3) Assets (1) (2) (3)
Judiciary 30-Jun-2017 $ 5,193 $ 44,075 $ 27,472 $ 80,445 100% 100% 113%
30-Jun-2016 5,834 39,411 28,976 77,302 100% 100% 111%
30-Jun-2015 5,804 35,262 33,082 74,659 100% 100% 102%
30-Jun-2014 5,841 32,803 31,963 70,335 100% 100% 99%
30-Jun-2013 5,896 28,458 32,213 63,512 100% 100% 91%
30-Jun-2012 5,986 25,953 34,007 59,279 100% 100% 80%
30-Jun-2011 5,400 26,482 31,208 55,784 100% 100% 77%
30-Jun-2010 5,047 23,928 31,129 51,550 100% 100% 73%
30-Jun-2009 4,816 22,315 30,668 49,036 100% 100% 71%
30-Jun-2008 4,382 20,398 31,076 47,209 100% 100% 72%
County & Municipal 30-Jun-2017 $ 63,747 $ 83,685 $ 208,206 $ 331,534 100% 100% 88%
Police and 30-Jun-2016 58,179 63,653 174,205 301,144 100% 100% 103%
Firefighters’ 30-Jun-2015 53,346 49,405 166,818 270,256 100% 100% 100%
30-Jun-2014 48,597 39,168 150,771 240,744 100% 100% 101%
30-Jun-2013 42,945 31,217 133,578 203,832 100% 100% 97%
30-Jun-2012 38,013 28,007 120,881 179,816 100% 100% 94%
30-Jun-2011 33,031 22,870 104,249 157,394 100% 100% 97%
30-Jun-2010 28,585 18,613 94,232 135,684 100% 100% 94%
30-Jun-2009 24,808 13,383 84,382 119,712 100% 100% 97%
30-Jun-2008 20,669 10,380 72,862 102,423 100% 100% 98%
County & Municipal 30-Jun-2017 $ 6,159 $ 12,399 $ 32,131 $ 46,687 100% 100% 88%
Other Employees’ 30-Jun-2016 5,749 9,241 30,821 41,660 100% 100% 87%
30-Jun-2015 5,047 6,913 27,804 37,477 100% 100% 92%
30-Jun-2014 4,423 6,076 23,122 33,077 100% 100% 98%
30-Jun-2013 3,886 4,872 20,554 27,492 100% 100% 91%
30-Jun-2012 3,423 3,887 17,879 23,851 100% 100% 93%
30-Jun-2011 3,098 3,096 16,665 20,664 100% 100% 87%
30-Jun-2010 2,653 2,637 14,537 17,596 100% 100% 85%
30-Jun-2009 2,172 2,091 12,524 15,074 100% 100% 86%
30-Jun-2008 1,756 1,302 11,250 12,980 100% 100% 88%
Aggregate accrued Liability at June 30, 2017 is calculated using the funding assumptions and does not agree with the Total Pension
Liability shown as of the same date in the Financial Section.
Ac
tuar
ialSec
tion
101DPERS 47th Comprehensive Annual Financial Report

Solvency Test (continued)(dollar values expressed in thousands)
Aggregate Accrued Liabilities forActive Active Member Actuarial Portion of Accrued
Valuation Member Retirants & Employer Financed Value of Liabilities CoveredDate Contributions Beneficiaries Contributions Reported by Reported Assets
Plan (1) (2) (3) Assets (1) (2) (3)
Delaware 30-Jun-2017 $ 5,302 $ 18,326 $ 10,713 $ 19,911 100% 80% -
Volunteer 30-Jun-2016 5,268 17,169 10,520 18,773 100% 79% -
Firemen’s 30-Jun-2015 5,282 15,850 12,507 18,002 100% 80% -
30-Jun-2014 5,210 15,326 12,656 17,066 100% 77% -
30-Jun-2013 5,087 14,291 11,663 15,773 100% 75% -
30-Jun-2012 4,896 13,998 11,255 14,972 100% 72% -
30-Jun-2011 4,797 13,457 11,261 14,379 100% 71% -
30-Jun-2010 4,727 12,692 9,963 13,663 100% 70% -
30-Jun-2009 4,702 12,050 9,810 13,241 100% 71% -
30-Jun-2008 4,531 11,513 9,675 12,972 100% 73% -
Diamond State Port 30-Jun-2017 $ 4,719 $ 9,087 $ 21,276 $ 30,687 100% 100% 79%
Corporation 30-Jun-2016 4,374 7,882 19,381 28,341 100% 100% 83%
30-Jun-2015 3,975 7,387 19,766 26,263 100% 100% 75%
30-Jun-2014 3,906 5,980 19,523 23,955 100% 100% 72%
30-Jun-2013 3,550 3,870 17,716 20,964 100% 100% 76%
30-Jun-2012 3,480 3,564 15,995 18,930 100% 100% 74%
30-Jun-2011 3,043 3,602 13,987 17,198 100% 100% 75%
30-Jun-2010 2,689 2,991 12,674 15,418 100% 100% 77%
30-Jun-2009 2,528 2,658 11,098 14,353 100% 100% 83%
30-Jun-2008 2,181 2,576 9,382 13,391 100% 100% 92%
Closed State Police 30-Jun-2017 $ - $ 275,757 $ - $ 3,085 N/A 1% N/A
30-Jun-2016 - 283,043 - 2,990 N/A 1% N/A
30-Jun-2015 - 288,849 - 2,879 N/A 1% -
30-Jun-2014 - 297,523 - 2,460 N/A 1% -
30-Jun-2013 - 294,533 - 2,668 N/A 1% -
30-Jun-2012 125 292,866 817 2,748 100% 1% -
30-Jun-2011 119 285,185 706 2,414 100% 1% -
30-Jun-2010 326 296,089 2,078 1,440 100% - -
30-Jun-2009 519 302,526 3,859 727 100% - -
30-Jun-2008 515 292,027 7,370 618 100% - -
Aggregate accrued Liability at June 30, 2017 is calculated using the funding assumptions and does not agree with the Total Pension
Liability shown as of the same date in the Financial Section.
Ac
tuar
ialSec
tion
102 DPERS 47th Comprehensive Annual Financial Report

Ac
tuar
ialSec
tion
103DPERS 47th Comprehensive Annual Financial Report
Analysis of Financial Experience for all plans
Gains/(Losses) in Accrued Liability During Years Ended June 30,Resulting from Differences Between Assumed Experience and Actuarial Experience
(expressed in thousands)
Gain/(Loss) for the Fiscal Years Ended June 30,
Plan Type of Activity 2017 2016 2015 2014 2013 2012 2011
State Employees' Investment Income/(Loss)on Actuarial Assets $ (43,703) $(120,768) $ 10,364 $ 115,262 $ (31,048) $ (88,902) $ (8,726)
Combined Liability Experience (64,746) (20,308) 23,571 17,908 71,572 (79,092) 26,105
(Loss)/Gain During Year fromFinancial Experience (108,449) (141,076) 33,935 133,170 40,524 (167,994) 17,379
Non-Recurring Items (211,698) (167,455) (132,191) (98,842) (84,221) (39,896) (173,261)
Composite (Loss)/Gain During Year $ (320,147) $(308,531) $ (98,256) $ 34,328 $ (43,697) $(207,890) $ (155,882)
Judiciary Investment Income/(Loss)on Actuarial Assets $ (481) $ (1,201) $ 123 $ 1,068 $ (172) $ (639) $ 7
Combined Liability Experience 2,254 2,017 451 1,361 2,889 1,215 2,169
(Loss)/Gain During Year fromFinancial Experience 1,773 816 574 2,429 2,717 576 2,176
Non-Recurring Items (1,344) 1,953 (263) (410) 589 (252) (1,083)
Composite (Loss)/Gain During Year $ 429 $ 2,769 $ 311 $ 2,019 $ 3,306 $ 324 $ 1,093
New State Police Investment Income/(Loss)on Actuarial Assets $ (2,338) $ (6,169) $ 783 $ 5,759 $ (461) $ (2,738) $ 481
Combined Liability Experience (2,055) (8,657) 2,539 3,520 4,887 (12,064) 5,030
(Loss)/Gain During Year fromFinancial Experience (4,393) (14,826) 3,322 9,279 4,426 (14,802) 5,511
Non-Recurring Items (12,092) (2,199) (1,154) (5,164) (3,664) (803) (5,996)
Composite (Loss)/Gain During Year $ (16,485) $(17,025) $ 2,168 $ 4,115 $ 762 $ (15,605) $ (485)
County & Investment Income/(Loss)Municipal on Actuarial Assets $ (1,430) $ (4,237) $ 675 $ 4,184 $ 163 $ (1,150) $ 846
Police and Combined Liability Experience (19,690) 4,157 (1,731) 3,309 10,625 (3,898) 420
Firefighters' (Loss)/Gain During Year fromFinancial Experience (21,120) (80) (1,056) 7,493 10,788 (5,048) 1,276
Non-Recurring Items (9,457) 252 (319) (2,595) (5,179) - 2,502
Composite (Loss)/Gain During Year $ (30,577) $ 172 $ (1,375) $ 4,898 $ 5,609 $ (5,048) $ 3,778
County & Investment Income/(Loss)Municipal on Actuarial Assets $ (203) $ (592) $ 91 $ 576 $ 35 $ (137) $ 129
Other Combined Liability Experience 1,664 (324) (1,881) 669 539 776 323
Employees’ (Loss)/Gain During Year fromFinancial Experience 1,461 (916) (1,790) 1,275 574 639 452
Non-Recurring Items (1,437) (1,018) - (603) (1,265) - (402)
Composite (Loss)/Gain During Year $ 24 $ (1,934) $ (1,790) $ 672 $ (691) $ 639 $ 50

Ac
tuar
ialSec
tion
104 DPERS 47th Comprehensive Annual Financial Report
Analysis of Financial Experience for all plans
Gains/(Losses) in Accrued Liability During Years Ended June 30,Resulting from Differences Between Assumed Experience and Actuarial Experience (continued)
(expressed in thousands)
Gain/(Loss) for the Fiscal Years Ended June 30,
Plan Type of Activity 2017 2016 2015 2014 2013 2012 2011
Delaware Investment Income/(Loss)Volunteer on Actuarial Assets $ (130) $ (278) $ (83) $ 141 $ (97) $ (200) $ (27)
Firemen’s Combined Liability Experience 6 142 505 230 161 388 29
(Loss)/Gain During Year fromFinancial Experience (124) (136) 422 371 64 188 2
Non-Recurring Items (634) 1,271 - (1,287) (28) - (1,132)
Composite (Loss)/Gain During Year $ (758) $ 1,135 $ 422 $ 916 $ 36 $ 188 $ (1,130)
Diamond Investment Income/(Loss)State Port on Actuarial Assets $ (162) $ (426) $ 44 $ 374 $ (37) $ (181) $ 24
Corporation Combined Liability Experience (265) 975 662 (1,403) 147 (499) 186
(Loss)/Gain During Year fromFinancial Experience (427) 549 706 (1,029) 110 (680) 210
Non-Recurring Items (815) 873 - (361) 6 - (571)
Composite (Loss)/Gain During Year $ (1,242) $ 1,422 $ 706 $ (1,390) $ 116 $ (680) $ (361)
Special Investment Income/(Loss)on Actuarial Assets $ (4) $ (7) $ (3) $ (1) $ (8) $ (11) $ (8)
Combined Liability Experience 11 31 (25) (18) 4 (13) (22)
(Loss)/Gain During Year fromFinancial Experience 7 24 (28) (19) (4) (24) (30)
Non-Recurring Items - (4) - (3) - - 16
Composite (Loss)/Gain During Year $ 7 $ 20 $ (28) $ (22) $ (4) $ (24) $ (14)
Closed State Investment Income/(Loss)Police on Actuarial Assets $ (279) $ (256) $ (56) $ (114) $ (95) $ (69) $ (38)
Combined Liability Experience (9,197) (54) 6,154 3,391 (2,739) (9,977) 6,882
(Loss)/Gain During Year fromFinancial Experience (9,476) (310) 6,098 3,277 (2,834) (10,046) 6,844
Non-Recurring Items (5,447) 2,557 - (9,314) - - 6,197
Composite (Loss)/Gain During Year $ (14,923) $ 2,247 $ 6,098 $ (6,037) $ (2,834) $ (10,046) $ 13,041

DelawarePublic
Employees’Retirement
System— A component unit of the State of Delaware
Forty-Seventh ComprehensiveAnnual Financial Report
Presented by the DPERS Board of Pension TrusteesFor the Fiscal Year Ended June 30
2018
STATISTICALSECTION

About the Statistical Section
This section provides the reader with detailed information about the economic and demographictrends experienced over the past ten years in the System:
Schedule of Principal Participating Employers lists the entities that make up at least 50% of theSystem’s two multiple-employer plans (County Municipal Police & Firefighter and County & MunicipalOther Employees’).
Schedules of Additions by Source and Deductions by Type display for each plan/fund the changes inplan/fund net assets as a result of payments made to and by the System.
Schedule of Benefit Deductions by Type identifies the type of payments made to beneficiaries and toformer employees.
Schedule of Retired Members by Type of Benefit by Plan identifies the range of benefit paymentsmade to retirees sorted by plan and type of retirement for the current fiscal year.
Schedule of Average Benefit Payments by Plan presents the average monthly benefit paid as ofJune 30, 2017, for plans that calculate benefits based on years of service or salary.
Schedule of Participating Employers lists all the current participating entities in the plans and fundswithin the System.
Statistical
Sectio
n
106 DPERS 47th Comprehensive Annual Financial Report

Principal Participating Employers in Multiple-Employer Plans of the Delaware Public Employees’ Retirement SystemCurrent Year and Nine Years Ago
2017 2008
County & Municipal Police and Firefighters' Plan # of Participants % of total # of Participants % of total
City of Wilmington Police/Fire 399 32.5% 293 33.8%
New Castle County Police/Fire 381 31.0% 244 28.2%
City of Dover Police 100 8.1% 94 10.9%
All Others 348 28.4% 235 27.1%
1,228 100.0% 866 100.0%
2017 2008
County & Municipal Other Employees' Plan # of Participants % of total # of Participants % of total
City of Wilmington 192 24.6% - -
Kent Conservation District 88 11.3% 67 15.7%
City of Milford 64 8.2% 80 18.7%
Town of Bethany Beach 27 3.5% 23 5.4%
Sussex Conservation District 33 4.2% 29 6.8%
Town of Smyrna 22 2.8% - -
Town of Georgetown 23 2.9% 26 6.1%
City of Harrington 23 2.9% 21 4.9%
Town of Laurel 20 2.6% - -
City of New Castle 18 2.3% 21 4.9%
All Others 271 34.7% 160 37.5%
781 100.0% 427 100.0%
Statistical
Sectio
n
107DPERS 47th Comprehensive Annual Financial Report

Schedule of Additions by Source(dollar values expressed in thousands)
Net EmployerTransfer of Transfer of Increase/ Contri-
Fiscal Contri- Assets (Decrease) butionsYear Employer butions from Member Net in Fair As a PercentEnded Contri- From Outside the Contri- Investment Value of Total of Covered
Plan June 30, butions PRI Fund System butions Other Income Investments Additions Payroll
State Employees’ 2018 $ 206,883 10,600 15 64,312 - 107,496 759,971 $ 1,149,277 10.4%
2017 186,625 30,302 - 61,686 - 116,473 745,524 1,140,610 9.6%
2016 182,707 38,778 - 59,146 - 100,375 (237,413) 143,593 9.6%
2015 178,293 32,654 - 55,782 - 96,394 203,431 566,554 9.6%
2014 174,863 26,877 - 52,793 - 93,944 1,160,771 1,509,248 9.5%
2013 160,651 25,949 - 50,555 - 108,849 627,223 973,227 8.6%
2012 147,464 8,179 - 47,850 - 86,946 25,782 316,221 7.8%
2011 128,019 13,640 - 46,403 - 113,771 1,277,375 1,579,208 7.2%
2010 101,457 26,116 - 44,915 - 75,498 681,066 929,052 5.8%
2009 96,576 38,835 - 45,899 - 71,803 (1,120,066) (866,953) 5.5%
Special 2018 $ - - - - - 3 18 $ 21 -
2017 - - - - - 3 19 22 -
2016 - - - - - 3 (8) (5) -
2015 - - - - - 3 7 10 -
2014 - - - - - 3 45 48 -
2013 - - - - - 5 28 33 -
2012 - - - - - 4 - 4 -
2011 - - - - - 6 64 70 -
2010 - - - - - 4 48 52 -
2009 - - - - - 7 (103) (96) -
New State Police 2018 $ 13,202 280 - 4,329 36 5,537 38,916 $ 62,300 21.2%
2017 11,096 649 - 4,233 - 5,771 36,813 58,562 18.2%
2016 11,001 793 - 4,146 4 4,780 (10,745) 9,979 18.6%
2015 10,730 639 - 4,121 12 4,409 9,320 29,231 18.5%
2014 10,500 494 - 3,862 31 4,115 50,520 69,522 19.1%
2013 9,292 477 - 3,772 9 4,655 26,058 44,263 16.5%
2012 8,309 143 - 3,560 29 3,446 1,385 16,872 15.3%
2011 7,810 86 - 3,434 - 4,254 47,611 63,195 15.4%
2010 6,562 151 - 3,276 38 2,677 23,358 36,062 13.2%
2009 6,791 205 - 3,422 40 2,276 (35,658) (22,924) 13.5%
Statistical
Sectio
n
108 DPERS 47th Comprehensive Annual Financial Report

Schedule of Deductions by Type(dollar values expressed in thousands)
Transfer ofFiscal Contri- TransferYear butions of Assets Refund of Burial Adminis-Ended from Outside Benefit Contri- Benefit trative Total Total Change
Plan June 30, PRI Fund the System Payments butions Payments Expenses Deductions in Net Position
State Employees’ 2018 $ - - 616,085 6,418 6,435 5,721 $ 634,659 $ 514,618
2017 - - 587,115 5,772 5,799 5,636 604,322 536,288
2016 - - 558,498 5,078 5,917 5,895 575,388 (431,795)
2015 - - 529,576 5,168 4,886 7,353 546,983 19,571
2014 - - 500,978 3,624 5,216 5,242 515,060 994,188
2013 - - 478,018 3,640 5,270 5,548 492,476 480,751
2012 - - 443,919 4,024 4,976 5,392 458,311 (142,090)
2011 - - 418,585 2,988 4,843 5,035 431,451 1,147,757
2010 - - 399,253 3,099 4,825 5,376 412,553 516,499
2009 - - 369,243 3,072 4,966 6,148 383,429 (1,250,382)
Special 2018 $ - - 26 - 7 1 $ 34 $ (13)
2017 - - 27 - - 1 28 (6)
2016 - - 29 - 18 1 48 (53)
2015 - - 42 - 4 1 47 (37)
2014 - - 42 - - 1 43 5
2013 - - 46 - 7 1 54 (21)
2012 - - 48 - 7 1 56 (52)
2011 - - 56 - 21 1 78 (8)
2010 - - 61 - 14 2 77 (25)
2009 - - 78 - 35 3 116 (212)
New State Police 2018 $ - - 18,584 11 - 99 $ 18,694 $ 43,606
2017 - - 16,629 78 7 88 16,802 41,760
2016 - - 14,800 3 - 91 14,894 (4,915)
2015 - - 12,173 15 - 113 12,301 16,930
2014 - - 10,591 21 7 82 10,701 58,821
2013 - - 9,456 60 - 88 9,604 34,659
2012 - - 7,949 78 7 76 8,110 8,762
2011 - - 6,213 22 - 78 6,313 56,882
2010 - - 5,182 60 - 74 5,316 30,746
2009 - - 3,662 63 14 71 3,810 (26,734)
Statistical
Sectio
n
109DPERS 47th Comprehensive Annual Financial Report

Schedule of Additions by Source (continued from page 108)(dollar values expressed in thousands)
Net EmployerTransfer of Transfer of Increase/ Contri-
Fiscal Contri- Assets (Decrease) butionsYear Employer butions from Member Net in Fair As a PercentEnded Contri- From Outside the Contri- Investment Value of Total of Covered
Plan June 30, butions PRI Fund System butions Other Income Investments Additions Payroll
Judiciary 2018 $ 2,112 64 - 354 - 1,003 7,048 $ 10,581 19.9%
2017 2,347 186 - 355 - 1,071 6,827 10,786 22.1%
2016 2,237 237 - 339 - 909 (2,082) 1,640 21.5%
2015 2,640 200 - 327 - 856 1,803 5,826 26.4%
2014 2,839 165 - 317 - 813 9,970 14,104 27.7%
2013 2,762 159 - 310 - 918 5,223 9,372 26.5%
2012 2,674 49 - 305 - 701 260 3,989 25.7%
2011 2,557 99 - 298 - 881 9,852 13,687 26.6%
2010 2,473 190 - 304 - 564 4,953 8,484 25.2%
2009 2,549 294 - 304 - 498 (7,723) (4,078) 26.0%
County & 2018 $ 9,535 - - 6,068 - 4,245 29,909 $ 49,757 11.4%
Municipal 2017 10,260 - - 5,939 - 4,304 27,530 48,033 13.8%
Police and 2016 14,789 - - 5,328 - 3,403 (7,283) 16,237 13.9%
Firefighters’ 2015 10,067 - - 4,980 - 3,007 6,387 24,441 14.2%
2014 10,283 - - 4,897 - 2,706 33,297 51,183 15.5%
2013 8,671 - - 4,166 - 2,866 16,411 32,114 12.7%
2012 9,265 - - 4,569 - 2,063 1,033 16,930 13.8%
2011 7,569 - - 3,986 - 2,420 27,158 41,133 12.7%
2010 7,307 - - 3,734 - 1,446 12,316 24,803 12.8%
2009 12,007 - - 3,852 - 1,057 (16,658) 258 21.6%
County & 2018 $ 2,826 - - 1,032 - 595 4,258 $ 8,711 7.1%
Municipal 2017 2,515 - - 985 - 593 3,835 7,928 6.8%
Other 2016 2,077 - - 946 - 465 (1,019) 2,469 6.2%
Employees’ 2015 1,921 - - 757 - 410 881 3,969 6.5%
2014 2,049 - - 748 - 363 4,519 7,679 6.6%
2013 1,604 - - 600 - 380 2,196 4,780 6.1%
2012 1,362 - - 547 - 270 144 2,323 6.1%
2011 1,186 - - 489 - 314 3,556 5,545 5.8%
2010 1,276 - - 509 - 182 1,559 3,526 6.2%
2009 2,293 - - 481 - 135 (2,122) 787 12.0%
Statistical
Sectio
n
110 DPERS 47th Comprehensive Annual Financial Report

Schedule of Deductions by Type (continued from page 109)(dollar values expressed in thousands)
Transfer ofFiscal Contri- TransferYear butions of Assets Refund of Burial Adminis-Ended from Outside Benefit Contri- Benefit trative Total Total Change
Plan June 30, PRI Fund the System Payments butions Payments Expenses Deductions in Net Position
Judiciary 2018 $ - - 4,793 2 - 12 $ 4,807 $ 5,774
2017 - - 4,752 - - 11 4,763 6,023
2016 - - 4,278 - - 14 4,292 (2,652)
2015 - - 3,985 - - 15 4,000 1,826
2014 - - 3,588 - - 13 3,601 10,503
2013 - - 3,261 - - 11 3,272 6,100
2012 - - 3,067 - - 10 3,077 912
2011 - - 2,844 - - 10 2,854 10,833
2010 - - 2,726 - - 15 2,741 5,743
2009 - - 2,643 15 - 8 2,666 (6,744)
County & 2018 $ - - 7,751 208 - 144 $ 8,103 $ 41,654
Municipal 2017 - - 6,179 131 - 154 6,464 41,569
Police and 2016 - - 4,782 131 - 135 5,048 11,189
Firefighters’ 2015 - - 3,714 112 - 168 3,994 20,447
2014 - - 2,989 171 - 100 3,260 47,923
2013 - - 2,586 193 - 116 2,895 29,219
2012 - - 2,254 227 - 109 2,590 14,340
2011 - - 1,810 116 - 113 2,039 39,094
2010 - - 1,365 142 - 101 1,608 23,195
2009 - - 1,054 177 - 110 1,341 (1,083)
County & 2018 $ - - 1,268 116 - 79 $ 1,463 $ 7,248
Municipal 2017 - - 1,082 170 - 94 1,346 6,582
Other 2016 - - 855 81 - 81 1,017 1,452
Employees’ 2015 - - 658 64 - 95 817 3,152
2014 - - 581 78 - 60 719 6,960
2013 - - 448 50 - 50 548 4,232
2012 - - 345 53 - 44 442 1,881
2011 - - 301 64 - 48 413 5,132
2010 - - 236 30 - 43 309 3,217
2009 - - 164 34 - 62 260 527
Statistical
Sectio
n
111DPERS 47th Comprehensive Annual Financial Report

Schedule of Additions by Source (continued from page 110)(dollar values expressed in thousands)
Net EmployerTransfer of Transfer of Increase/ Contri-
Fiscal Contri- Assets (Decrease) butionsYear Employer butions from Member Net in Fair As a PercentEnded Contri- From Outside the Contri- Investment Value of Total of Covered
Plan June 30, butions PRI Fund System butions Other Income Investments Additions Payroll
Delaware 2018 $ 2,019 - - 145 - 230 1,033 $ 3,427 -
Volunteer 2017 2,000 - - 157 - 241 1,572 3,970 -
Firemen’s 2016 1,764 - - 180 - 212 15 2,171 -
2015 1,668 - - 164 - 207 205 2,244 -
2014 1,561 - - 166 - 315 1,956 3,998 -
2013 1,456 - - 172 - 397 1,033 3,058 -
2012 1,311 - - 177 - 341 (165) 1,664 -
2011 1,221 - - 180 - 317 2,008 3,726 -
2010 1,191 - - 181 - 346 785 2,503 -
2009 1,108 - - 185 - 377 (1,714) (44) -
Diamond 2018 $ 1,175 - - 280 - 387 2,742 $ 4,584 8.4%
State Port 2017 1,134 - - 240 - 396 2,553 4,323 9.4%
2016 1,200 - - 246 - 323 (716) 1,053 9.7%
2015 1,052 - - 234 - 293 623 2,202 9.0%
2014 1,009 - - 236 - 270 3,342 4,857 8.6%
2013 854 - - 223 - 292 1,692 3,061 7.5%
2012 814 - - 216 - 218 94 1,342 6.7%
2011 704 - - 209 - 265 2,992 4,170 6.3%
2010 594 - - 204 - 164 1,452 2,414 5.3%
2009 694 - - 211 - 138 (2,166) (1,123) 6.3%
Closed 2018 $ 22,750 - - - - 163 1,129 $ 24,042 -
State Police 2017 23,067 - - - - 185 1,083 24,335 -
2016 23,300 - - - - 147 (988) 22,459 -
2015 23,473 - - - - 50 314 23,837 -
2014 23,064 - - - - (3) - 23,061 -
2013 23,064 - - - - (2) - 23,062 -
2012 23,064 - - 2 - (1) - 23,065 -
2011 23,367 - - 4 - 4 - 23,375 -
2010 23,367 - - 6 - 2 - 23,375 -
2009 21,775 - - 20 - 24 - 21,819 -
Statistical
Sectio
n
112 DPERS 47th Comprehensive Annual Financial Report
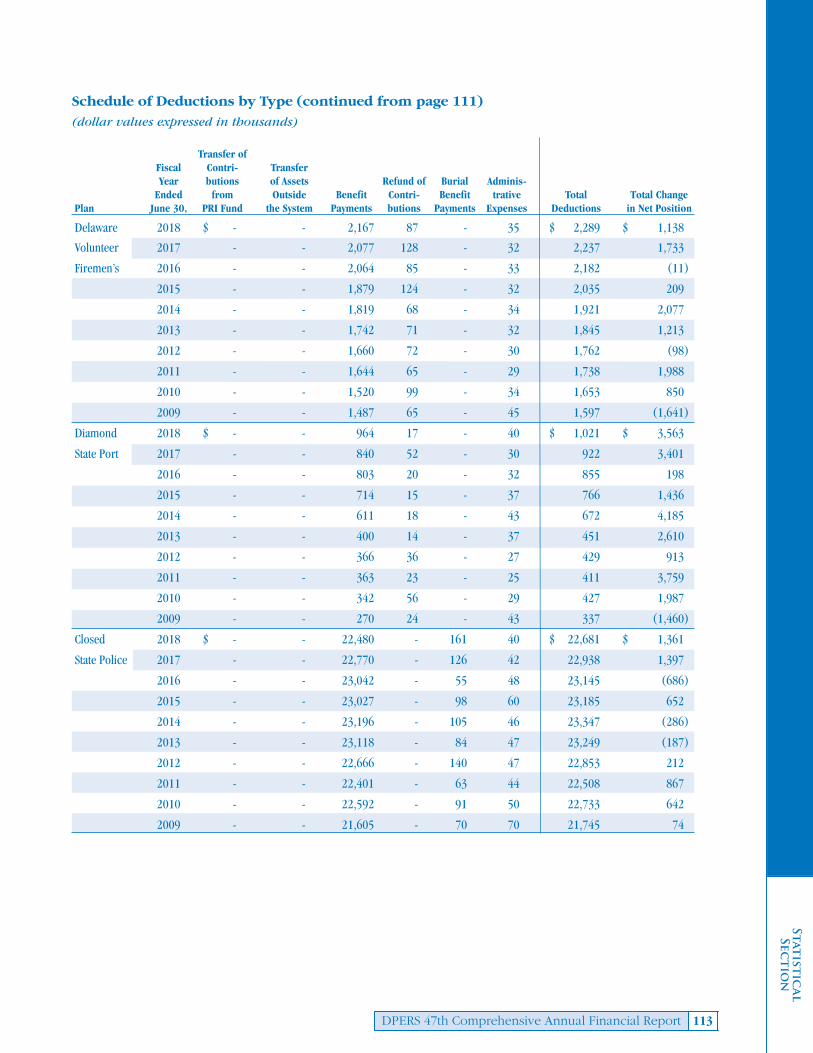
Schedule of Deductions by Type (continued from page 111)(dollar values expressed in thousands)
Transfer ofFiscal Contri- TransferYear butions of Assets Refund of Burial Adminis-Ended from Outside Benefit Contri- Benefit trative Total Total Change
Plan June 30, PRI Fund the System Payments butions Payments Expenses Deductions in Net Position
Delaware 2018 $ - - 2,167 87 - 35 $ 2,289 $ 1,138
Volunteer 2017 - - 2,077 128 - 32 2,237 1,733
Firemen’s 2016 - - 2,064 85 - 33 2,182 (11)
2015 - - 1,879 124 - 32 2,035 209
2014 - - 1,819 68 - 34 1,921 2,077
2013 - - 1,742 71 - 32 1,845 1,213
2012 - - 1,660 72 - 30 1,762 (98)
2011 - - 1,644 65 - 29 1,738 1,988
2010 - - 1,520 99 - 34 1,653 850
2009 - - 1,487 65 - 45 1,597 (1,641)
Diamond 2018 $ - - 964 17 - 40 $ 1,021 $ 3,563
State Port 2017 - - 840 52 - 30 922 3,401
2016 - - 803 20 - 32 855 198
2015 - - 714 15 - 37 766 1,436
2014 - - 611 18 - 43 672 4,185
2013 - - 400 14 - 37 451 2,610
2012 - - 366 36 - 27 429 913
2011 - - 363 23 - 25 411 3,759
2010 - - 342 56 - 29 427 1,987
2009 - - 270 24 - 43 337 (1,460)
Closed 2018 $ - - 22,480 - 161 40 $ 22,681 $ 1,361
State Police 2017 - - 22,770 - 126 42 22,938 1,397
2016 - - 23,042 - 55 48 23,145 (686)
2015 - - 23,027 - 98 60 23,185 652
2014 - - 23,196 - 105 46 23,347 (286)
2013 - - 23,118 - 84 47 23,249 (187)
2012 - - 22,666 - 140 47 22,853 212
2011 - - 22,401 - 63 44 22,508 867
2010 - - 22,592 - 91 50 22,733 642
2009 - - 21,605 - 70 70 21,745 74
Statistical
Sectio
n
113DPERS 47th Comprehensive Annual Financial Report

Schedule of Additions by Source (continued from page 112)(dollar values expressed in thousands)
Net EmployerTransfer of Transfer of Increase/ Contri-
Fiscal Contri- Assets (Decrease) butionsYear Employer butions from Member Net in Fair As a PercentEnded Contri- From Outside the Contri- Investment Value of Total of Covered
Plan June 30, butions PRI Fund System butions Other Income Investments Additions Payroll
County & 2018 $ - - 3,497 - - 141 956 $ 4,594 -
Municipal 2017 - - 3,263 - - 115 756 4,134 -
Police and 2016 - - 3,156 - - 97 (370) 2,883 -
Firefighters’ 2015 - - 2,999 - - 140 320 3,459 -
COLA Fund 2014 - - 2,938 - - 115 1,430 4,483 -
2013 - - 3,018 - - 107 636 3,761 -
2012 - - 2,918 - - 66 38 3,022 -
2011 - - 3,108 - - 71 815 3,994 -
2010 - - 2,901 - - 63 949 3,913 -
2009 - - 2,963 - - 128 (2,010) 1,081 -
Post- 2018 $ 11,021 - - - - 96 665 $ 11,782 -
Retirement 2017 30,221 - - - - 73 460 30,754 -
Increase 2016 40,361 - - - - 91 (202) 40,250 -
Fund 2015 32,436 - - - - 96 225 32,757 -
2014 28,899 - - - - 76 935 29,910 -
2013 27,786 - - - - 73 385 28,244 -
2012 9,799 - - - - 60 198 10,057 -
2011 13,985 - - - - 35 364 14,384 -
2010 23,380 - - - - 45 537 23,962 -
2009 37,692 - - - - 35 (533) 37,194 -
Delaware 2018 $ - - 2,300 - - 555 3,767 $ 6,622 -
Local Gov’t 2017 - - - - - 615 3,949 4,564 -
Retirement 2016 - - - - - 627 (1,427) (800) -
Investment 2015 - - - - - 584 1,229 1,813 -
Pool 2014 - - - - - 552 6,774 7,326 -
2013 - - - - - 620 3,550 4,170 -
2012 - - - - - 480 174 654 -
2011 - - - - - 607 6,792 7,399 -
2010 - - - - - 392 3,443 3,835 -
2009 - - 5 - - 355 (5,504) (5,144) -
Statistical
Sectio
n
114 DPERS 47th Comprehensive Annual Financial Report

Schedule of Deductions by Type (continued from page 113)(dollar values expressed in thousands)
Transfer ofFiscal Contri- TransferYear butions of Assets Refund of Burial Adminis-Ended from Outside Benefit Contri- Benefit trative Total Total Change
Plan June 30, PRI Fund the System Payments butions Payments Expenses Deductions in Net Position
County & 2018 $ - 3,367 - - - - $ 3,367 $ 1,227
Municipal 2017 - 445 - - - - 445 3,689
Police and 2016 - 8,794 - - - - 8,794 (5,911)
Firefighters’ 2015 - 2,367 - - - - 2,367 1,092
COLA Fund 2014 - 971 - - - - 971 3,512
2013 - 1,954 - - - - 1,954 1,807
2012 - 2,318 - - - 3 2,321 701
2011 - 1,822 - - - - 1,822 2,172
2010 - 10,331 - - - - 10,331 (6,418
2009 - 3,045 - - - - 3,045 (1,964)
Post- 2018 $ 10,945 - - - - 1 $ 10,946 $ 836
Retirement 2017 31,137 - - - - - 31,137 (383)
Increase 2016 39,808 - - - - - 39,808 442
Fund 2015 33,493 - - - - - 33,493 (736)
2014 27,536 - - - - - 27,536 2,374
2013 26,585 - - - - - 26,585 1,659
2012 8,371 - - - - - 8,371 1,686
2011 13,825 - - - - - 13,825 559
2010 26,457 - - - - - 26,457 (2,495)
2009 39,334 - - - - - 39,334 (2,140)
Delaware 2018 $ - 8,725 - - - 2 $ 8,727 $ (2,105)
Local Gov’t 2017 - 12,212 - - - 1 12,213 (7,649)
Retirement 2016 - 504 - - - 1 505 (1,305)
Investment 2015 - 60 - - - 1 61 1,752
Pool 2014 - 166 - - - 1 167 7,159
2013 - 167 - - - 1 168 4,002
2012 - 233 - - - 1 234 420
2011 - 190 - - - 1 191 7,208
2010 - 119 - - - - 119 3,716
2009 - 4,326 - - - - 4,326 (9,470)
Statistical
Sectio
n
115DPERS 47th Comprehensive Annual Financial Report

Schedule of Benefit Deductions by Type(dollar values expressed in thousands)
Fiscal Year Refund DeductionsEnded Benefit Deductions Death Separation
Plan June 30 Service Survivor Disability Total Refunds Refunds Total
State Employees’ 2018 $ 559,216 38,118 18,751 $ 616,085 $ 700 $ 5,718 $ 6,418
2017 531,380 36,184 19,551 587,115 1,057 4,715 5,772
2016 503,689 34,759 20,050 558,498 775 4,303 5,078
2015 475,683 33,601 20,292 529,576 963 4,205 5,168
2014 448,106 32,268 20,604 500,978 455 3,169 3,624
2013 426,144 30,765 21,109 478,018 587 3,053 3,640
2012 393,801 29,158 20,960 443,919 809 3,215 4,024
2011 369,593 28,064 20,928 418,585 391 2,597 2,988
2010 350,695 26,958 21,600 399,253 546 2,553 3,099
2009 321,214 25,791 22,238 369,243 426 2,646 3,072
Special 2018 $ - 23 3 $ 26 $ - $ - $ -
2017 - 19 8 27 - - -
2016 4 17 8 29 - - -
2015 16 18 8 42 - - -
2014 16 18 8 42 - - -
2013 16 23 7 46 - - -
2012 16 25 7 48 - - -
2011 24 24 8 56 - - -
2010 29 25 7 61 - - -
2009 38 33 7 78 - - -
New State Police 2018 $ 17,151 274 1,159 $ 18,584 $ - $ 11 $ 11
2017 15,339 168 1,122 16,629 - 78 78
2016 13,587 150 1,063 14,800 - 3 3
2015 10,949 151 1,073 12,173 - 15 15
2014 9,337 187 1,067 10,591 - 21 21
2013 8,240 184 1,032 9,456 2 58 60
2012 6,781 180 988 7,949 - 78 78
2011 5,095 198 920 6,213 - 22 22
2010 4,137 198 847 5,182 27 33 60
2009 2,655 198 809 3,662 - 63 63
Judiciary 2018 $ 4,045 703 45 $ 4,793 $ - $ 2 $ 2
2017 3,888 792 72 4,752 - - -
2016 3,450 709 119 4,278 - - -
2015 3,196 671 118 3,985 - - -
2014 2,874 596 118 3,588 - - -
2013 2,502 642 117 3,261 - - -
2012 2,327 625 115 3,067 - - -
2011 2,129 601 114 2,844 - - -
2010 2,068 544 114 2,726 - - -
2009 2,028 501 114 2,643 - 15 15
Statistical
Sectio
n
116 DPERS 47th Comprehensive Annual Financial Report

Schedule of Benefit Deductions by Type (continued)(dollar values expressed in thousands)
Fiscal Year Refund DeductionsEnded Benefit Deductions Death Separation
Plan June 30 Service Survivor Disability Total Refunds Refunds Total
County & 2018 $ 6,100 431 1,220 $ 7,751 $ 3 $ 205 $ 208
Municipal Police 2017 5,006 312 861 6,179 7 124 131
and Firefighters’ 2016 3,945 191 646 4,782 - 131 131
2015 3,143 185 386 3,714 - 112 112
2014 2,159 183 647 2,989 - 171 171
2013 1,787 179 620 2,586 - 193 193
2012 1,516 170 568 2,254 - 227 227
2011 1,386 115 309 1,810 43 73 116
2010 1,046 66 253 1,365 - 142 142
2009 745 60 249 1,054 - 177 177
County & 2018 $ 1,135 64 69 $ 1,268 $ 20 $ 96 $ 116
Municipal 2017 961 44 77 1,082 9 161 170
Other Employees’ 2016 741 35 79 855 3 78 81
2015 547 30 81 658 2 62 64
2014 494 28 59 581 1 77 78
2013 383 27 38 448 - 50 50
2012 288 23 34 345 2 51 53
2011 267 9 25 301 - 64 64
2010 213 6 17 236 13 17 30
2009 143 4 17 164 6 28 34
Delaware 2018 $ 2,167 - - $ 2,167 $ 48 $ 39 $ 87
Volunteer 2017 2,077 - - 2,077 28 100 128
Firemen’s 2016 2,064 - - 2,064 27 58 85
2015 1,879 - - 1,879 30 94 124
2014 1,819 - - 1,819 52 16 68
2013 1,742 - - 1,742 20 51 71
2012 1,660 - - 1,660 21 51 72
2011 1,644 - - 1,644 7 58 65
2010 1,520 - - 1,520 13 86 99
2009 1,483 4 - 1,487 13 52 65
Diamond 2018 $ 704 200 60 $ 964 $ 16 $ 1 $ 17
State Port 2017 639 151 50 840 28 24 52
Corporation 2016 658 96 49 803 20 - 20
2015 578 87 49 714 - 15 15
2014 486 76 49 611 5 13 18
2013 284 67 49 400 - 14 14
2012 261 56 49 366 14 22 36
2011 259 55 49 363 5 18 23
2010 244 49 49 342 33 23 56
2009 181 43 46 270 - 24 24
Statistical
Sectio
n
117DPERS 47th Comprehensive Annual Financial Report

Schedule of Benefit Deductions by Type (continued)
(dollar values expressed in thousands)
Fiscal Year Refund DeductionsEnded Benefit Deductions Death Separation
Plan June 30 Service Survivor Disability Total Refunds Refunds Total
Closed State 2018 $ 15,365 4,012 3,103 $ 22,480 $ - $ - $ -
Police 2017 15,783 3,838 3,149 22,770 - - -
2016 16,069 3,696 3,277 23,042 - - -
2015 16,014 3,687 3,326 23,027 - - -
2014 16,198 3,688 3,310 23,196 - - -
2013 16,169 3,707 3,242 23,118 - - -
2012 15,781 3,714 3,171 22,666 - - -
2011 15,745 3,547 3,109 22,401 - - -
2010 15,918 3,483 3,191 22,592 - - -
2009 15,249 3,162 3,194 21,605 - - -
Schedule of Retired Members by Type of Benefit by PlanAs of June 30, 2017
Amount of Number of Type of RetirementMonthly Benefit Retirants Service Survivor Disability
State Employees' Deferred 4,043 - - -
$1 - 499 4,561 2,548 1,492 521
500 - 999 4,817 3,313 1,031 473
1,000 - 1,499 4,166 3,364 532 270
1,500 - 1,999 3,386 2,974 282 130
2,000 - 2,499 2,664 2,457 121 86
2,500 - 2,999 2,088 1,972 72 44
over $3,000 5,197 5,057 81 59
Special Deferred - - - -
$1 - 499 5 - 5 -
500 - 999 2 - 1 1
over $1,000 - - - -
New State Police Deferred 9 - - -
$1 - 499 5 5 - -
500 - 999 3 2 1 -
1,000 - 1,499 3 2 - 1
1,500 - 1,999 - - - -
2,000 - 2,499 9 3 - 6
2,500 - 2,999 13 9 3 1
over $3,000 229 210 3 16
Statistical
Sectio
n
118 DPERS 47th Comprehensive Annual Financial Report

Schedule of Retired Members by Type of Benefit by Plan (continued)As of June 30, 2017
Amount of Number of Type of RetirementMonthly Benefit Retirants Service Survivor Disability
Judiciary Deferred 1 - - -
$1 - 499 - - - -
500 - 999 - - - -
1,000 - 1,499 - - - -
1,500 - 1,999 - - - -
2,000 - 2,499 - - - -
2,500 - 2,999 3 1 2 -
over $3,000 48 35 12 1
County & Municipal Deferred 27 - - -
Police and $1 - 499 4 3 1 -
Firefighters’ 500 - 999 13 10 3 -
1,000 - 1,499 16 6 4 6
1,500 - 1,999 10 4 2 4
2,000 - 2,499 21 11 3 7
2,500 - 2,999 37 33 1 3
over $3,000 89 77 2 10
County & Municipal Deferred 50 - - -
Other Employees’ $1 - 499 47 32 14 1
500 - 999 39 37 2 -
1,000 - 1,499 12 10 1 1
1,500 - 1,999 8 7 - 1
2,000 - 2,499 2 1 - 1
2,500 - 2,999 1 1 - -
over $3,000 6 6 - -
Delaware Volunteer Deferred 142 - - -
Firemen’s $1 - 74 654 654 - -
75 - 99 471 471 - -
over $100 776 776 - -
Diamond State Port Deferred 12 - - -
Corporation $1 - 499 35 21 14 -
500 - 999 31 18 11 2
1,000 - 1,499 13 9 2 2
1,500 - 1,999 10 10 - -
over $2,000 3 2 1 -
Closed State Police Deferred - - - -
$1 - 499 - - - -
500 - 999 - - - -
1,000 - 1,499 - - - -
1,500 - 1,999 2 - 2 -
2,000 - 2,499 21 - 19 2
2,500 - 2,999 68 - 64 4
over $3,000 403 317 30 56
Statistical
Sectio
n
119DPERS 47th Comprehensive Annual Financial Report
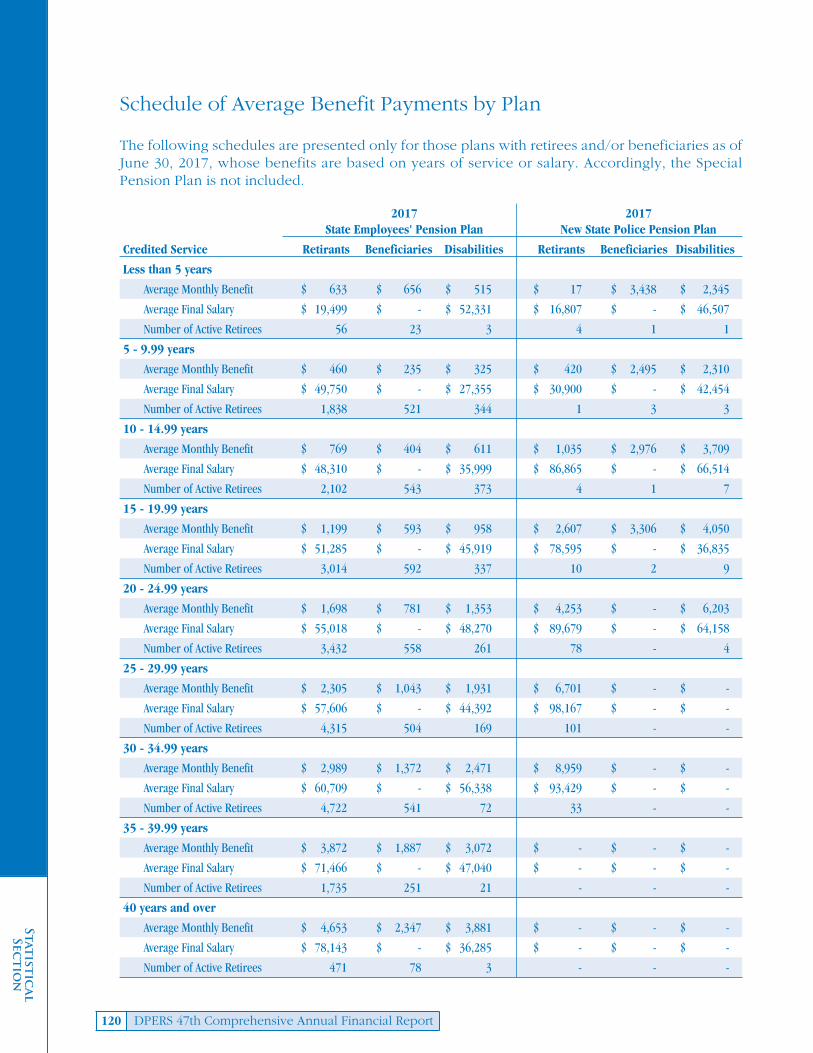
Schedule of Average Benefit Payments by Plan
The following schedules are presented only for those plans with retirees and/or beneficiaries as ofJune 30, 2017, whose benefits are based on years of service or salary. Accordingly, the SpecialPension Plan is not included.
2017 2017State Employees' Pension Plan New State Police Pension Plan
Credited Service Retirants Beneficiaries Disabilities Retirants Beneficiaries Disabilities
Less than 5 years
Average Monthly Benefit $ 633 $ 656 $ 515 $ 17 $ 3,438 $ 2,345
Average Final Salary $ 19,499 $ - $ 52,331 $ 16,807 $ - $ 46,507
Number of Active Retirees 56 23 3 4 1 1
5 - 9.99 years
Average Monthly Benefit $ 460 $ 235 $ 325 $ 420 $ 2,495 $ 2,310
Average Final Salary $ 49,750 $ - $ 27,355 $ 30,900 $ - $ 42,454
Number of Active Retirees 1,838 521 344 1 3 3
10 - 14.99 years
Average Monthly Benefit $ 769 $ 404 $ 611 $ 1,035 $ 2,976 $ 3,709
Average Final Salary $ 48,310 $ - $ 35,999 $ 86,865 $ - $ 66,514
Number of Active Retirees 2,102 543 373 4 1 7
15 - 19.99 years
Average Monthly Benefit $ 1,199 $ 593 $ 958 $ 2,607 $ 3,306 $ 4,050
Average Final Salary $ 51,285 $ - $ 45,919 $ 78,595 $ - $ 36,835
Number of Active Retirees 3,014 592 337 10 2 9
20 - 24.99 years
Average Monthly Benefit $ 1,698 $ 781 $ 1,353 $ 4,253 $ - $ 6,203
Average Final Salary $ 55,018 $ - $ 48,270 $ 89,679 $ - $ 64,158
Number of Active Retirees 3,432 558 261 78 - 4
25 - 29.99 years
Average Monthly Benefit $ 2,305 $ 1,043 $ 1,931 $ 6,701 $ - $ -
Average Final Salary $ 57,606 $ - $ 44,392 $ 98,167 $ - $ -
Number of Active Retirees 4,315 504 169 101 - -
30 - 34.99 years
Average Monthly Benefit $ 2,989 $ 1,372 $ 2,471 $ 8,959 $ - $ -
Average Final Salary $ 60,709 $ - $ 56,338 $ 93,429 $ - $ -
Number of Active Retirees 4,722 541 72 33 - -
35 - 39.99 years
Average Monthly Benefit $ 3,872 $ 1,887 $ 3,072 $ - $ - $ -
Average Final Salary $ 71,466 $ - $ 47,040 $ - $ - $ -
Number of Active Retirees 1,735 251 21 - - -
40 years and over
Average Monthly Benefit $ 4,653 $ 2,347 $ 3,881 $ - $ - $ -
Average Final Salary $ 78,143 $ - $ 36,285 $ - $ - $ -
Number of Active Retirees 471 78 3 - - -
Statistical
Sectio
n
120 DPERS 47th Comprehensive Annual Financial Report

Schedule of Average Benefit Payments by Plan (continued)
20172017 County & Municipal Police and
Judiciary Pension Plan Firefighters’ Pension Plan
Credited Service Retirants Beneficiaries Disabilities Retirants Beneficiaries Disabilities
Less than 5 years
Average Monthly Benefit $ 8,788 $ - $ - $ 70 $ 2,318 $ 1,808
Average Final Salary $ 72,650 $ - $ - $ 42,000 $ - $ 36,680
Number of Active Retirees 2 - - 2 1 3
5 - 9.99 years
Average Monthly Benefit $ - $ 4,948 $ - $ 796 $ 2,188 $ 1,624
Average Final Salary $ - $ - $ - $ 41,495 $ - $ 52,565
Number of Active Retirees - 1 - 10 2 7
10 - 14.99 years
Average Monthly Benefit $ 6,080 $ 2,876 $ 5,659 $ 1,352 $ 1,282 $ 2,847
Average Final Salary $ 147,061 $ - $ 48,635 $ 61,531 $ - $ 61,759
Number of Active Retirees 11 2 1 8 9 10
15 - 19.99 years
Average Monthly Benefit $ 8,258 $ 3,551 $ - $ 2,434 $ 5,210 $ 3,197
Average Final Salary $ 177,280 $ - $ - $ 67,942 $ - $ 66,205
Number of Active Retirees 1 3 - 13 1 9
20 - 24.99 years
Average Monthly Benefit $10,096 $ 4,227 $ - $ 3,215 $ 2,310 $ 3,169
Average Final Salary $ 141,117 $ - $ - $ 70,792 $ - $ 63,929
Number of Active Retirees 10 3 - 92 3 1
25 - 29.99 years
Average Monthly Benefit $ 11,167 $ 4,325 $ - $ 5,374 $ - $ -
Average Final Salary $ 181,929 $ - $ - $ 82,088 $ - $ -
Number of Active Retirees 5 2 - 16 - -
30 - 34.99 years
Average Monthly Benefit $ 11,622 $ 6,485 $ - $ 6,357 $ - $ -
Average Final Salary $ 245,412 $ - $ - $ 83,086 $ - $ -
Number of Active Retirees 6 2 - 3 - -
35 - 39.99 years
Average Monthly Benefit $ 11,143 $ - $ - $ - $ - $ -
Average Final Salary $ 168,844 $ - $ - $ - $ - $ -
Number of Active Retirees 1 - - - - -
40 years and over
Average Monthly Benefit $ - $ 4,931 $ - $ - $ - $ -
Average Final Salary $ - $ - $ - $ - $ - $ -
Number of Active Retirees - 1 - - - -
Statistical
Sectio
n
121DPERS 47th Comprehensive Annual Financial Report

Schedule of Average Benefit Payments by Plan (continued)
2017 2017County & Municipal Delaware Volunteer Firemen’s
Other Employees’ Pension Plan Pension Plan
Credited Service Retirants Beneficiaries Disabilities Retirants Beneficiaries Disabilities
Less than 5 years
Average Monthly Benefit $ 111 $ 38 $ - $ - $ - $ -
Average Final Salary $ 15,577 $ - $ - $ - $ - $ -
Number of Active Retirees 3 1 - - - -
5 - 9.99 years
Average Monthly Benefit $ 364 $ 142 $ - $ - $ - $ -
Average Final Salary $ 57,724 $ - $ - $ - $ - $ -
Number of Active Retirees 30 8 - - - -
10 - 14.99 years
Average Monthly Benefit $ 706 $ 296 $ 375 $ 57 $ - $ -
Average Final Salary $ 58,488 $ - $ 24,099 $ - $ - $ -
Number of Active Retirees 29 5 1 650 - -
15 - 19.99 years
Average Monthly Benefit $ 942 $ 925 $ - $ 84 $ - $ -
Average Final Salary $ 48,626 $ - $ - $ - $ - $ -
Number of Active Retirees 13 2 - 388 - -
20 - 24.99 years
Average Monthly Benefit $ 2,021 $ 697 $ 2,020 $ 109 $ - $ -
Average Final Salary $ 65,210 $ - $ 45,160 $ - $ - $ -
Number of Active Retirees 11 1 2 334 - -
25 - 29.99 years
Average Monthly Benefit $ 2,844 $ - $ 1,368 $ 125 $ - $ -
Average Final Salary $ 120,794 $ - $ 57,632 $ - $ - $ -
Number of Active Retirees 1 - 1 529 - -
30 - 34.99 years
Average Monthly Benefit $ 2,531 $ - $ - $ - $ - $ -
Average Final Salary $ 66,844 $ - $ - $ - $ - $ -
Number of Active Retirees 6 - - - - -
35 - 39.99 years
Average Monthly Benefit $ 4,995 $ - $ - $ - $ - $ -
Average Final Salary $ 94,344 $ - $ - $ - $ - $ -
Number of Active Retirees 1 - - - - -
40 years and over
Average Monthly Benefit $ - $ - $ - $ - $ - $ -
Average Final Salary $ - $ - $ - $ - $ - $ -
Number of Active Retirees - - - - - -
Statistical
Sectio
n
122 DPERS 47th Comprehensive Annual Financial Report
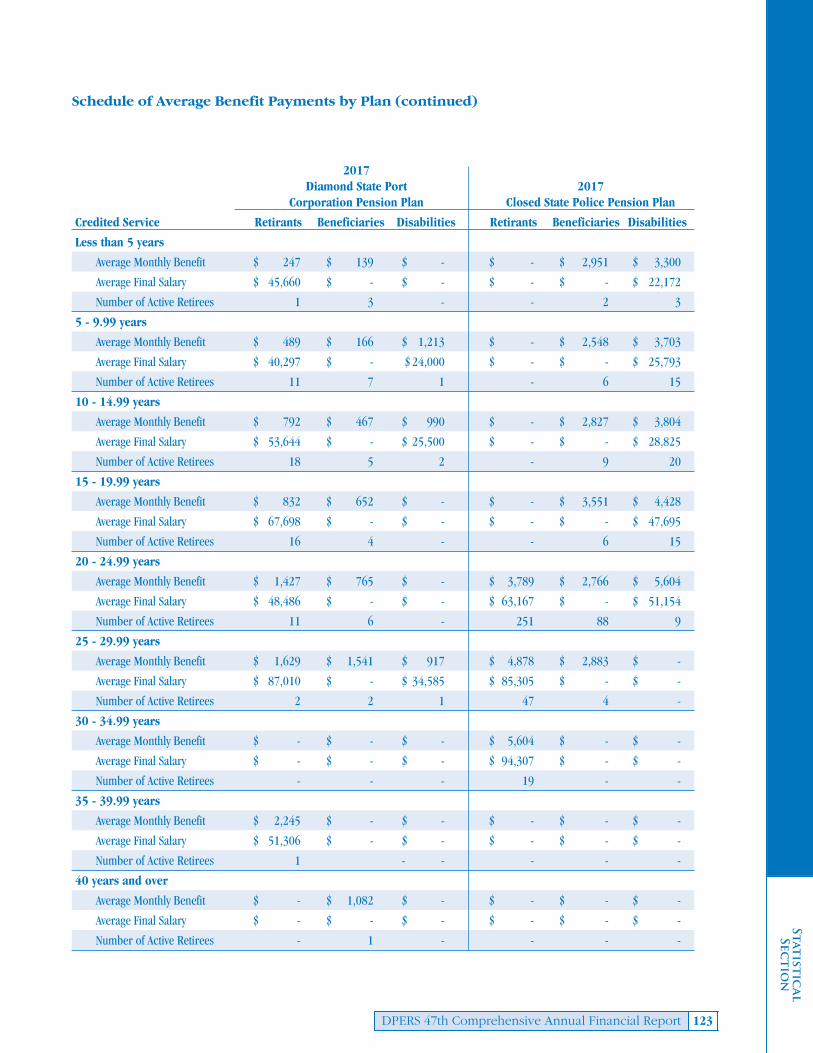
Schedule of Average Benefit Payments by Plan (continued)
2017Diamond State Port 2017
Corporation Pension Plan Closed State Police Pension Plan
Credited Service Retirants Beneficiaries Disabilities Retirants Beneficiaries Disabilities
Less than 5 years
Average Monthly Benefit $ 247 $ 139 $ - $ - $ 2,951 $ 3,300
Average Final Salary $ 45,660 $ - $ - $ - $ - $ 22,172
Number of Active Retirees 1 3 - - 2 3
5 - 9.99 years
Average Monthly Benefit $ 489 $ 166 $ 1,213 $ - $ 2,548 $ 3,703
Average Final Salary $ 40,297 $ - $ 24,000 $ - $ - $ 25,793
Number of Active Retirees 11 7 1 - 6 15
10 - 14.99 years
Average Monthly Benefit $ 792 $ 467 $ 990 $ - $ 2,827 $ 3,804
Average Final Salary $ 53,644 $ - $ 25,500 $ - $ - $ 28,825
Number of Active Retirees 18 5 2 - 9 20
15 - 19.99 years
Average Monthly Benefit $ 832 $ 652 $ - $ - $ 3,551 $ 4,428
Average Final Salary $ 67,698 $ - $ - $ - $ - $ 47,695
Number of Active Retirees 16 4 - - 6 15
20 - 24.99 years
Average Monthly Benefit $ 1,427 $ 765 $ - $ 3,789 $ 2,766 $ 5,604
Average Final Salary $ 48,486 $ - $ - $ 63,167 $ - $ 51,154
Number of Active Retirees 11 6 - 251 88 9
25 - 29.99 years
Average Monthly Benefit $ 1,629 $ 1,541 $ 917 $ 4,878 $ 2,883 $ -
Average Final Salary $ 87,010 $ - $ 34,585 $ 85,305 $ - $ -
Number of Active Retirees 2 2 1 47 4 -
30 - 34.99 years
Average Monthly Benefit $ - $ - $ - $ 5,604 $ - $ -
Average Final Salary $ - $ - $ - $ 94,307 $ - $ -
Number of Active Retirees - - - 19 - -
35 - 39.99 years
Average Monthly Benefit $ 2,245 $ - $ - $ - $ - $ -
Average Final Salary $ 51,306 $ - $ - $ - $ - $ -
Number of Active Retirees 1 - - - - -
40 years and over
Average Monthly Benefit $ - $ 1,082 $ - $ - $ - $ -
Average Final Salary $ - $ - $ - $ - $ - $ -
Number of Active Retirees - 1 - - - -
Statistical
Sectio
n
123DPERS 47th Comprehensive Annual Financial Report

Total Benefit Payments Chartexpressed in thousands
Total Membership Chart
0
$100,000
$200,000
$300,000
$400,000
$500,000
$674,118 $700,000
$600,000
1971 1976 1981 1986 1991 1996 2001 2006 2011 2016 2018
Fiscal Year
1971 1974 1978 1983 1988 1993 1998 2003 2008 2017 2013
Fiscal Year
78,916
48,925
29,991 Statistic
alSec
tion
124 DPERS 47th Comprehensive Annual Financial Report
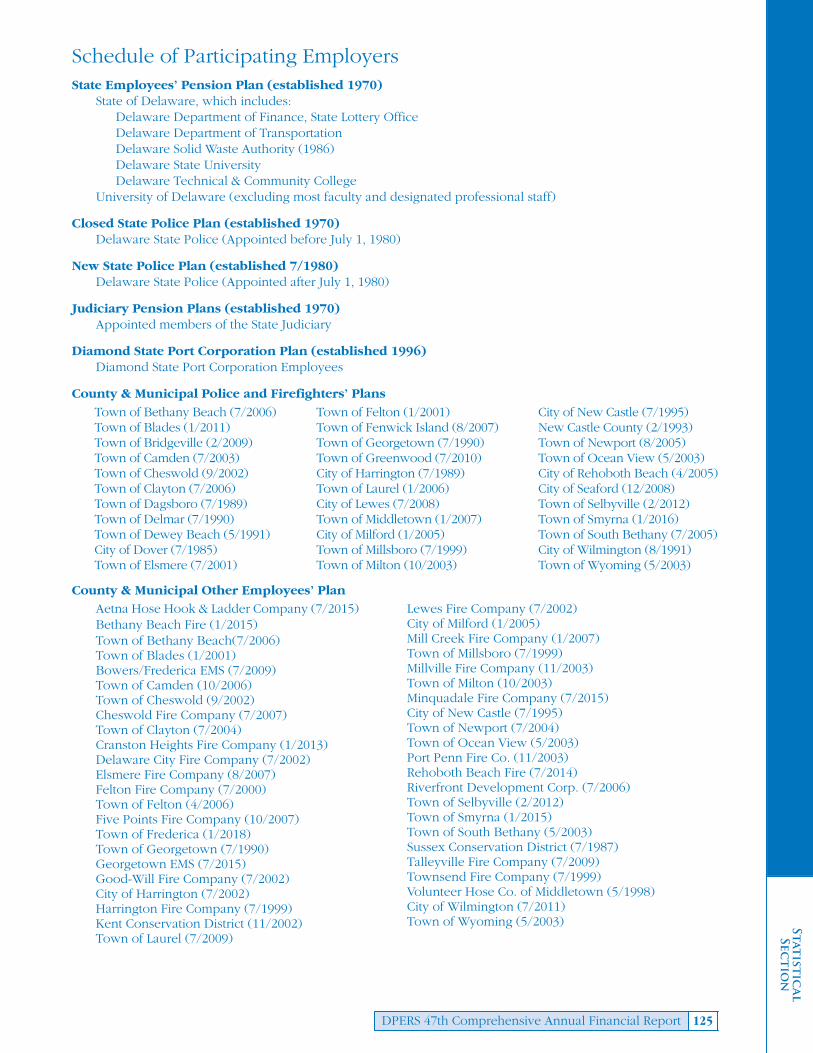
Schedule of Participating EmployersState Employees’ Pension Plan (established 1970)
State of Delaware, which includes:Delaware Department of Finance, State Lottery OfficeDelaware Department of TransportationDelaware Solid Waste Authority (1986)Delaware State UniversityDelaware Technical & Community College
University of Delaware (excluding most faculty and designated professional staff)
Closed State Police Plan (established 1970)Delaware State Police (Appointed before July 1, 1980)
New State Police Plan (established 7/1980)Delaware State Police (Appointed after July 1, 1980)
Judiciary Pension Plans (established 1970)Appointed members of the State Judiciary
Diamond State Port Corporation Plan (established 1996)Diamond State Port Corporation Employees
County & Municipal Police and Firefighters’ Plans
Town of Bethany Beach (7/2006)Town of Blades (1/2011)Town of Bridgeville (2/2009)Town of Camden (7/2003)Town of Cheswold (9/2002)Town of Clayton (7/2006)Town of Dagsboro (7/1989)Town of Delmar (7/1990)Town of Dewey Beach (5/1991)City of Dover (7/1985)Town of Elsmere (7/2001)
Town of Felton (1/2001)Town of Fenwick Island (8/2007)Town of Georgetown (7/1990)Town of Greenwood (7/2010)City of Harrington (7/1989)Town of Laurel (1/2006)City of Lewes (7/2008)Town of Middletown (1/2007)City of Milford (1/2005)Town of Millsboro (7/1999)Town of Milton (10/2003)
City of New Castle (7/1995)New Castle County (2/1993)Town of Newport (8/2005)Town of Ocean View (5/2003)City of Rehoboth Beach (4/2005)City of Seaford (12/2008)Town of Selbyville (2/2012)Town of Smyrna (1/2016)Town of South Bethany (7/2005)City of Wilmington (8/1991)Town of Wyoming (5/2003)
Aetna Hose Hook & Ladder Company (7/2015)Bethany Beach Fire (1/2015)Town of Bethany Beach(7/2006)Town of Blades (1/2001)Bowers/Frederica EMS (7/2009)Town of Camden (10/2006)Town of Cheswold (9/2002)Cheswold Fire Company (7/2007)Town of Clayton (7/2004)Cranston Heights Fire Company (1/2013)Delaware City Fire Company (7/2002)Elsmere Fire Company (8/2007)Felton Fire Company (7/2000)Town of Felton (4/2006)Five Points Fire Company (10/2007)Town of Frederica (1/2018)Town of Georgetown (7/1990)Georgetown EMS (7/2015)Good-Will Fire Company (7/2002)City of Harrington (7/2002)Harrington Fire Company (7/1999)Kent Conservation District (11/2002)Town of Laurel (7/2009)
Lewes Fire Company (7/2002)City of Milford (1/2005)Mill Creek Fire Company (1/2007)Town of Millsboro (7/1999)Millville Fire Company (11/2003)Town of Milton (10/2003)Minquadale Fire Company (7/2015)City of New Castle (7/1995)Town of Newport (7/2004)Town of Ocean View (5/2003)Port Penn Fire Co. (11/2003)Rehoboth Beach Fire (7/2014)Riverfront Development Corp. (7/2006)Town of Selbyville (2/2012)Town of Smyrna (1/2015)Town of South Bethany (5/2003)Sussex Conservation District (7/1987)Talleyville Fire Company (7/2009)Townsend Fire Company (7/1999)Volunteer Hose Co. of Middletown (5/1998)City of Wilmington (7/2011)Town of Wyoming (5/2003)
County & Municipal Other Employees’ Plan
Statistical
Sectio
n
125DPERS 47th Comprehensive Annual Financial Report
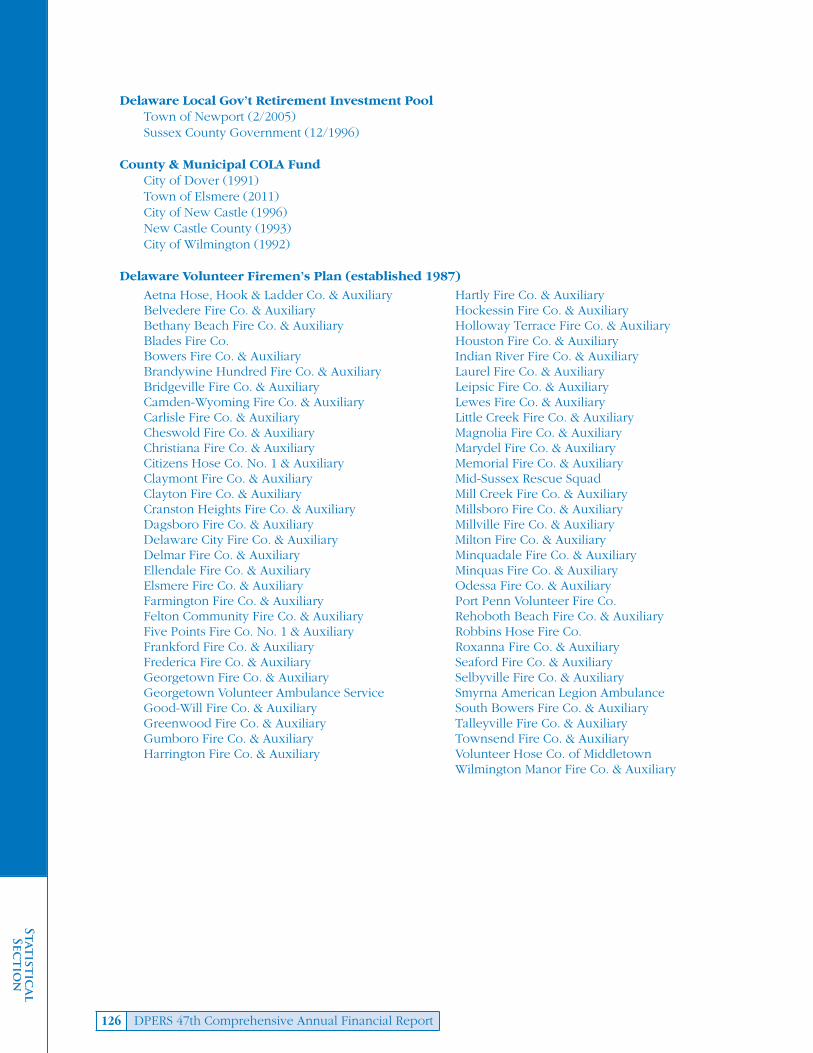
Delaware Local Gov’t Retirement Investment PoolTown of Newport (2/2005)Sussex County Government (12/1996)
County & Municipal COLA FundCity of Dover (1991)Town of Elsmere (2011)City of New Castle (1996)New Castle County (1993)City of Wilmington (1992)
Delaware Volunteer Firemen’s Plan (established 1987)
Aetna Hose, Hook & Ladder Co. & AuxiliaryBelvedere Fire Co. & AuxiliaryBethany Beach Fire Co. & AuxiliaryBlades Fire Co.Bowers Fire Co. & AuxiliaryBrandywine Hundred Fire Co. & AuxiliaryBridgeville Fire Co. & AuxiliaryCamden-Wyoming Fire Co. & AuxiliaryCarlisle Fire Co. & AuxiliaryCheswold Fire Co. & AuxiliaryChristiana Fire Co. & AuxiliaryCitizens Hose Co. No. 1 & AuxiliaryClaymont Fire Co. & AuxiliaryClayton Fire Co. & AuxiliaryCranston Heights Fire Co. & AuxiliaryDagsboro Fire Co. & AuxiliaryDelaware City Fire Co. & AuxiliaryDelmar Fire Co. & AuxiliaryEllendale Fire Co. & AuxiliaryElsmere Fire Co. & AuxiliaryFarmington Fire Co. & AuxiliaryFelton Community Fire Co. & AuxiliaryFive Points Fire Co. No. 1 & AuxiliaryFrankford Fire Co. & AuxiliaryFrederica Fire Co. & AuxiliaryGeorgetown Fire Co. & AuxiliaryGeorgetown Volunteer Ambulance ServiceGood-Will Fire Co. & AuxiliaryGreenwood Fire Co. & AuxiliaryGumboro Fire Co. & AuxiliaryHarrington Fire Co. & Auxiliary
Hartly Fire Co. & AuxiliaryHockessin Fire Co. & AuxiliaryHolloway Terrace Fire Co. & AuxiliaryHouston Fire Co. & AuxiliaryIndian River Fire Co. & AuxiliaryLaurel Fire Co. & AuxiliaryLeipsic Fire Co. & AuxiliaryLewes Fire Co. & AuxiliaryLittle Creek Fire Co. & AuxiliaryMagnolia Fire Co. & AuxiliaryMarydel Fire Co. & AuxiliaryMemorial Fire Co. & AuxiliaryMid-Sussex Rescue SquadMill Creek Fire Co. & AuxiliaryMillsboro Fire Co. & AuxiliaryMillville Fire Co. & AuxiliaryMilton Fire Co. & AuxiliaryMinquadale Fire Co. & AuxiliaryMinquas Fire Co. & AuxiliaryOdessa Fire Co. & AuxiliaryPort Penn Volunteer Fire Co.Rehoboth Beach Fire Co. & AuxiliaryRobbins Hose Fire Co.Roxanna Fire Co. & AuxiliarySeaford Fire Co. & AuxiliarySelbyville Fire Co. & AuxiliarySmyrna American Legion AmbulanceSouth Bowers Fire Co. & AuxiliaryTalleyville Fire Co. & AuxiliaryTownsend Fire Co. & AuxiliaryVolunteer Hose Co. of MiddletownWilmington Manor Fire Co. & Auxiliary
Statistical
Sectio
n
126 DPERS 47th Comprehensive Annual Financial Report

Pension Office Programmatic Goal is to maintain comprehensive andresponsive systems for benefits and funds management,
which helps retain a quality workforce and provides a secureand supportive retirement commitment.
127DPERS 47th Comprehensive Annual Financial Report


