DISCUSSION PAPER SERIES Forschungsinstitut zur Zukunft der Arbeit Institute for the Study of Labor Delayed Graduation and Overeducation: A Test of the Human Capital Model versus the Screening Hypothesis IZA DP No. 6413 March 2012 Carmen Aina Francesco Pastore
Transcript
DI
SC
US
SI
ON
P
AP
ER
S
ER
IE
S
Forschungsinstitut zur Zukunft der ArbeitInstitute for the Study of Labor
Delayed Graduation and Overeducation: A Test of the Human Capital Model versus the Screening Hypothesis
IZA DP No. 6413
March 2012
Carmen AinaFrancesco Pastore
Delayed Graduation and Overeducation:
A Test of the Human Capital Model versus the Screening Hypothesis
Carmen Aina Università degli Studi Piemonte Orientale
Any opinions expressed here are those of the author(s) and not those of IZA. Research published in this series may include views on policy, but the institute itself takes no institutional policy positions. The Institute for the Study of Labor (IZA) in Bonn is a local and virtual international research center and a place of communication between science, politics and business. IZA is an independent nonprofit organization supported by Deutsche Post Foundation. The center is associated with the University of Bonn and offers a stimulating research environment through its international network, workshops and conferences, data service, project support, research visits and doctoral program. IZA engages in (i) original and internationally competitive research in all fields of labor economics, (ii) development of policy concepts, and (iii) dissemination of research results and concepts to the interested public. IZA Discussion Papers often represent preliminary work and are circulated to encourage discussion. Citation of such a paper should account for its provisional character. A revised version may be available directly from the author.
Delayed Graduation and Overeducation: A Test of the Human Capital Model versus the Screening Hypothesis*
The academic circles are devoting a growing interest to delayed graduation and overeducation, but none has analyzed the joint consequences of these two phenomena. Thus, this paper studies the link between graduation not within the minimum period and overeducation, and the effects of these variables on wages, using the ISFOL-Plus data. According to the human capital model, delayed graduation increases a student’ human capital and should, therefore, reduce her probability of being overeducated, while increasing her wage. According to the screening hypothesis, instead, delayed graduation signals low skills and therefore increases the chances of being overeducated, while bearing a wage penalty. The evidence lines towards predictions based on the screening hypothesis. First, delayed graduation increases the chances of overeducation. In addition, the direct wage penalty associated to delayed graduation equals 7% of the median wage. However, being a determinant of overeducation, it also indirectly contributes to the penalty of 19.8% of the median wage associated to overeducation. These effects are sizeable, considering the very low returns to higher education in Italy reported in previous studies. JEL Classification: C25, C26, C33, I2, J13, J24 Keywords: university-to-work transition, delayed graduation, overeducation,
human capital theory, screening hypothesis, earnings equations, Italy Corresponding author: Francesco Pastore Seconda Università di Napoli Faculty of Law Via Mazzocchi 5 81055 Santa Maria Capua Vetere Italy E-mail: [email protected]
* An earlier version of this paper has been presented at a workshop on: “Horizontal and Vertical Overeducation. A Cross-Country Perspective”, held at Seconda Università di Napoli (December 2011). We thank all seminar participants, especially Giuseppe Croce, Marcello D’Amato, Francesca Sgobbi, Peter Sloane and Dieter Verhaest, for useful comments. This notwithstanding, the authors take full responsibility of any opinion or mistake contained in the paper.
A typical feature of the Italian educational system is the large share of students that spend more years
than the curricular number prescribed to attain their degree. Extended time to degree is a very common fact
in Italy for which a neologism has been introduced: “ fuoricorsismo”, which means “being registered (or
graduating) beyond the minimum period”. According to the data provided by the Italian Ministry of
Education, the fuoricorso’ students have represented a share as high as at least 40% of registered students. In
addition, the share of students who graduate as fuoricorso have reduced (mainly for administrative reasons)
from 76.2% to 56.3% from 2002 to 2008.
However, delayed graduation is becoming a widespread phenomenon and, hence, a topical issue not
only in the case of Italy, but in a growing number of countries, such as, for instance, the United States of
America, Germany, France, Denmark, Sweden and other European countries (see, among others, Hakkinen
and Usitalo, 2002; Van Ours and Ridder, 2002; Brunello and Winter-Ebmer, 2003; Bowen, Chingos and
McPherson, 2009). The reasons why not all students graduate at the typical age vary by country. Excess time
to graduation recently increased in all those countries where the cost of education has steeply risen, forcing
not well-off students to do paid work to support their studies (i.e. US). In other countries, especially in the
Nordic ones, graduation rates for students aged over 30 account for a quarter or more of the total graduation
rate, as students can leave the education system relatively easily and re-enter it at a later date (OECD, 2010).
By contrast, the poor performance of Italian students in terms of time to get a degree is mainly driven by
the characteristics of the institutional framework. The fact of not applying admission tests allows university
enrolment of poorly motivated and unqualified students, which fosters drop-out rates and time-to-degree. Not
being forced to pass all the exams scheduled during an academic year to proceed to a subsequent year of
study along with uncapped completion period discourage graduation on time. Then, the policy of reducing
tuition fees for students enrolled beyond the minimum period does not encourage graduation at the expected
length (Garibaldi et al., 2012), and poor labor market prospects contribute particularly to the length of time
to degree (Aina, Baici and Casalone, 2011). Furthermore, as the state transfers were positively related to the
overall number of students enrolled at college, inclusive of the number of fuoricorso, universities did not
have any incentive to reduce the quota of these students. The relevance of this topic arises in consideration of
the effects that this behavior may have on students who get a degree not in the prescribed period, namely
higher expenditure, lower starting salary, later launch of career trajectory and foregone tax revenue.
This paper aims to contribute to the recent, but quickly growing literature on the economic consequences
of graduates not within the legal duration. The specific hypothesis tested here is whether delayed graduation
is a determinant of overeducation and bears a wage penalty for Italian workers holding a university degree.
Two effects – a direct effect and an indirect one, through overeducation – may be hypothesized. On the one
hand, delayed graduation might affect wages directly; on the other hand, it might increase overeducation and
therefore cause an additional effect on earnings. In turn, since delayed graduation is a very common behavior
amongst Italian undergraduates, confirming the above hypothesis would amount to giving an important
3
contribution to the existing explanations of the low returns to education in Italy (for a survey of the literature
on returns to education in Italy, see Brunello, Comi and Lucifora, 2001). Supply side considerations would
add to the existing demand side considerations. The low returns to tertiary education would be also a
consequence of the low quality of tertiary education and the inefficiency of the university system in
generating a supply of human capital – in the quantity and the quality – that is actually requested in the labor
market. In other words, the wage penalty associated to delayed graduation and overeducation would
contribute to explain also the poor returns to education in Italy as compared to other advanced economies.
The focus of the analysis is not on comparison of different factors of delayed graduation or
overeducation, since we do not focus on early out, but on graduates belonging to different age cohorts. This
is because of the specific nature of the dataset used: a sub-sample of university graduates drawn from the
ISFOL-Plus data which is a survey of individuals belonging to the entire active population, rather than of
graduates only interviewed in the first years after graduation. The survey has a longitudinal structure, since,
up to now, it has been collected on the same individuals observed in three years (2005, 2006 and 2008).
Nevertheless, due to the small number of observations available when considering a balanced panel of
employed university graduates only, we base the estimates on a pooled sample including any individual who
is a university graduate and is employed in any of the three point observations.
Expectations based on the human capital model and on the screening hypothesis suggest opposite
conclusions regarding the impact of delayed graduation and overeducation. Following Groot and Oosterbeek
(1994), the estimates presented in this paper control for actual years, effective years, repeated years. In
addition, we also control for delayed and overeducation years.
The rest of the paper is structured as follows. Section one motivates the paper by showing that it moves
from two main aims: explaining the causes and consequences of delayed graduation as well as its links to
overeducation. Section two provides surveys of the relevant literatures, highlighting both the theoretical
framework of the analysis and the empirical testing that is carried out in later sections. Section three
discusses the methodology applied. Two specifications are considered: the first one refers to the probability
to be overeducated; the second one to the Mincerian earnings equations used to test the human capital versus
the screening model. Section four describes the main features of the ISFOL-Plus data and the way key
variables are defined. Section five shows the main findings of the analysis and section six discusses the
relevance of our results, while drawing also several policy implications. Some concluding remarks follow.
1. Motivation
The main aim of this paper is to understand and to assess the labor market consequences of graduation
beyond the minimum period, as a distinctive aspect of the Italian tertiary education system, but also of many
other OECD economies.
Before the introduction of the 2001 reform of the Italian post-secondary education system, the average
curricular number of years varied between 4 and 6 depending on the field of study. It means that high-school
4
leavers who enrolled at university were expected to graduate in the age group 23-25. However, according to
national statistics, slightly fewer than 40% of students get a degree within the prescribed period (Miur,
2006); for instance, in standard four-year programs, students were actually observed to graduate at 27.5
years.
Delayed graduation has always been a typical feature of the Italian university system. Figure 1 shows
that the number of registered students has been growing since the early 1970s up to the mid-1990s. In the
late 1990s this upward trend experienced a lull, and restarted only after the implementation of the 2001
university reform. Accordingly, also the number of students enrolled beyond the legal duration has increased
over time, which highlights the waste of resources and delayed entry to the labor market (Aina, 2010b).
[Figure 1 about here]
Although originally meant also as a remedy against fuoricorsismo, the 2001 Bologna reform, which
introduced the so-called “3+2” system, only marginally increased the number of students graduating within
the prescribed legal time span, as shown in Figure 2. This result was achieved mainly via the reduction in the
length of the basic degree courses – 3 years – and gave the opportunity to the students enrolled under the old
regime to switch to the new one and complete their studies with a reduction in the number of exams to be
passed. However, only a few students completed their academic careers, and the proportions are very low as
compared to the number of new matriculations.
[Figure 2 about here]
According to AlmaLaurea (2011), the average time required to achieve a first degree is 4.6 against the 3
years required, and about 76.8% continue their studies either in a two-year degree – specialistica – or in
other post-baccalaureate programs. Statistics confirm, even under the new system, that the field of study
wherein students are still more likely to spend more years than the minimum required are Law, Education,
Modern Literature and Philosophy, and Language and Linguistics (see Istat and AlmaLaurea, 2010). Now,
although recently flourishing (see, among others, Becker, 2006; Manacorda and Moretti, 2006; Pastore,
2009; Aina, Baici and Casalone, 2011; Aina and Casalone, 2011; Aina, Cappellari and Francesconi, 2011;
Garibaldi et al., 2012), the studies addressing the analysis of the causes and consequences of delayed
graduation are still only very few, and to the best of our knowledge none of them investigates the link with
overeducation. The next section provides a comprehensive survey of this literature. Here we simply ask:
What is the labor market consequence of delayed graduation? Does it affect overeducation? How do these
forms of inefficiency of the educational system affect earnings in turn?
We focus on two consequences of delayed graduation: first, graduating with a delay might increase the
chances of overeducation; second, it might also affect earnings, directly or indirectly, through overeducation.
Groot and Oosterbeek (1994) provide an empirical framework to disentangle the human capital and the
screening model as a theoretical framework to explain delays in education and their consequences on the
labor market. To discriminate between the aforementioned models, they apply Mincerian earnings equations
and divide the actual years of schooling into effective, repeated, skipped, inefficient and dropout years. Their
expectations are summarized in Table 1. Repeated years should bear a wage gain or a null effect on wages in
5
the human capital model if they lead to some deeper understanding of the subject studied. They lead to a
negative effect in the screening theory, since employers might perceive them as a signal of low skill. The
wage effect of skipped years is the opposite of that of repeated years. The wage effect of inefficient routing
years and the dropout years is the same as that of repeated years. Inefficient routing years are those that an
individual spends in a program that she decides to leave or to change at a later stage as it is not consistent
with the individual’s aspirations. Dropout years are those spent in education without gaining the aimed
certificate.
[Table 1 about here]
They find essentially a confirmation of the human capital theory against the screening hypothesis. In
fact, first of all, they find that a model that includes controls only for the actual and effective years is
statistically inferior to a model where each component is clearly specified. In addition, class skipping
generates a wage penalty, class-failing is wage neutral, and dropout years bear a wage premium. Within their
theoretical and empirical framework, the delay in one’ studies, and therefore also at the university, can be
rationalized as being conceptually opposite to that associated to skipped years and similar to that of repeated
years. Repeated years will have a non-negative effect on earnings in the human capital model and a negative
one in the screening model.
We argue that also expectations on the impact of delayed graduation on earnings can be understood not
only within the human capital, but also within the screening model, although with different implications. In
the human capital model, delayed years may (or may not) lead to a thorough understanding of the intellectual
content of the schooling program attended. If they do so, delayed years might increase the human capital and
hence also the productivity level of students, positively affecting also their earnings. According to the
screening hypothesis, instead, in the view of perspective employers, delayed years signal low skills
(motivation and effort) in individuals. This is because the most skilled individuals will try to get their degree
the soonest they can to signal their higher skills to their perspective employers. In this theoretical framework,
a delay in their studies is seen as the consequence of a lower skill endowment across individuals and should,
hence, bear a wage penalty to those who experience it.
This study focuses on university graduates only using the ISFOL-Plus data. In our specification, due to
lack of information, we cannot define “inefficient years”, namely the years spent to find the best field of
study, and the “dropout years”, i.e. the years spent at school or at the university before dropping out. Our
data allows us to analyze solely university graduates in order to take into consideration the years spent at
college beyond the minimum period.
What is the relation between delayed graduation and overeducation? The latter is sometimes called
excess schooling. In that, it is similar to delayed graduation: both lead to some kind of waste or inefficiency
in the education system and, indirectly, in the labor market. We will try to ascertain whether and the extent to
which the two phenomena correlate to each other and generate a concurring effect on wages.
Our modeling strategy consists, first of all, of testing the extent to which delayed graduation causes
overeducation and, secondly, whether the wage penalty associated to each of these two phenomena is
6
similar. Following Leuven and Oosterbeek (2011), this paper will be mainly based on the Duncan and
Hoffman (1981) version of the ORU specification, whereas years of schooling are preferred to schooling
dummies to indicate a given status. This is despite the fact that, unfortunately, the data does not allow
computing the years of underschooling.
In addition, we investigate whether, in case an individual graduated with delay and is at the meantime
also overeducated, tends also to receive a greater wage penalty than just if she delayed her graduation or was
overeducated only.
2. The state of the art
Following the arguments brought to the fore in the motivation section, we survey and attempt to bridge
two branches of literature, namely that on delayed graduation and that on overeducation. The review
considers both theoretical and empirical aspects.
2.1. Causes and consequences of delayed graduation
The causes and consequences of delayed graduation have recently attracted much attention. Manacorda
and Moretti (1996), for instance, study the reasons why in Italy over 80% of young people continue to live
with their parents until late in their thirties. They see this as a result of parents’ tastes for co-residence. In
other words, co-habitation would be the consequence of bargaining within the household between parents
and their children, whereas the former offers unlimited financial support to their children and the latter
remain at home providing some form of remuneration in terms of affection to their parents. This is clearly
related also to the disincentives that lead young people to delay their graduation, since most young people
who are at the university do so because they continue to live with their parents and enjoy their financial
support. Becker (2006) sees delayed graduation within the context of a job-search theoretical model where
time-to-educate matters.
Pastore (2009) considers delayed graduation within the context of the human capital model, as a
consequence of demand and supply side constraints to the investment in high education. In other words,
delayed graduation may be seen as the consequence of the low return and the high cost of tertiary education.
From the demand side, the country’s specialization in traditional manufacturing explains the low demand for
high education, the low returns to high education and the tendency of young people to reduce their effort,
therefore delaying graduation. In other words, since university students believe that the return to their degree
is low, they do not feel the urgency of graduating. From the supply side, delayed graduation is the
consequence of the high cost that the educational system requires young people to pay to attain a university
degree. In the case of Italy, the author notes that since the direct cost – mainly tuition fees – is relatively low
by OECD standards, it is the share of the indirect costs – such as the effort and the opportunity cost of the
time spent in education – that is likely to explain the differences between actual and legal time span to a
degree. The effort is positively related to the size of the programs of study of many courses, the low
7
attendance rate of fundamental courses, especially in some faculties, and the poor educational background of
university students1. The inefficiency and the lack of organization of the Italian university system is another
important factor: for instance, undergraduates can decide which exam and when to seat an exam and, in case
they do not pass it, they can seat it all the times they wish to, causing a delay in their overall university path.
All these factors concur to increase the indirect cost of education and explain the hardship that too many
young people experience in attaining a university degree. This is especially true for individuals coming from
poor households and with a low educational background, as Caroleo and Pastore (2012) argue. In a sense,
delayed graduation can be seen as an involuntary phenomenon, as proven also by the fact that it is very
common among graduates.
In line with the screening theory, graduation beyond the minimum period entails a negative signal to the
employers: longer delays hint unobserved characteristics with a negative productivity value. The existing
related literature provides evidence on the link between delay and starting salary. Monks (1997) shows a
disparity of earnings between younger graduates and those who complete university study at a later age. The
negative correlation between age at graduation and entry level wages holds also once he controls for work
experience, job tenure, hours of work, ability measures and individual fixed effects. Analyzing early work
career, Brodaty, Gary-Bobo and Prieto (2008) test the impact of job market signaling effects using
information on delay graduation. They find evidence that delay information is used by employers to
discriminate, consistently with the employer-learning theory. In particular, their estimates confirm the
negative signal given to the labor market by graduates not within the prescribed duration as their wage
penalty associated is about 9%, averaged over the first five years of career. Aina and Casalone (2011)
investigate the early labor outcomes of Italian graduates – namely probability of finding a job and the labor
market returns – using a representative sample at a national level, taking into account the actual number of
years spent to get a degree. Thanks to the AlmaLaurea data, the authors are able to look at their career
development and to investigate if completion beyond the legal period may still have effects on the salary also
after three and five years from graduation. Their findings underline that only a large delay (more than two
years) is perceived as negative by prospective employers in the labor market and bears persistent wage
effects over the early career, suggesting that, due to the fact that only few graduates get a degree on time, a
delay up to two years is considered as “normal” in the Italian context.
2.2. Overeducation
In principle, it is hard to say whether overschooling is in Italy higher or lower than elsewhere. Istat
estimated that in 2006 the undereducated, namely graduates who do a job for which the years of schooling
required is higher than that completed, were 1.9 million (9% of employment), whereas the overeducated, i.e.
1 In Italy high-school leavers can enroll at university independently of the schooling track, but if the diploma is not academic oriented students face more difficulties to complete their university studies (see, among others, Cappellari, 2004; Checchi and Flabbi, 2007; Aina, 2010; Caroleo and Pastore, 2012).
8
graduates who do a job for which the number of years of schooling required is lower than that completed (so-
called excess schooling), amounted to 3.7 million (16.5%) in 2006. The existing comparative evidence hints
that the country has a higher than average share of overeducated workers, suggesting that demand is more at
risk of losing the race with the supply of human capital than elsewhere, despite the low average level of
education attainment existing in the country. Horizontal overeducation might also be an important
component, due to the low degree of orientation of high school diploma students, the scant integration of the
educational system with the labour market and the high share of graduates in humanities and other arts
degrees.
McGuinness and Sloane (2010, Table 3.6) find that the extent of the educational mismatch is in Italy one
of the highest among the EU countries included in the REFLEX sample data. With a share of 23% of
overeducated workers at the time of their first job and of 13% five years after graduation, Italy is the third
last performer, after Spain and the UK, that have a share of overeducation equal to 17% and 14%,
respectively, five years after graduation. In other EU countries in the sample, overeducation is almost always
under the threshold of 10%.
Slightly different is the case of overskilling, which is much more common in the REFLEX sample and
for which Italy tends to the sample average. This is due to the tendency of overskilling to be much more
common than overeducation. In Italy, overskilling equals 21% at the first job and 11% five years after
graduation. Italy is still under Spain and the UK only, but this time also other countries have similar levels,
fluctuating from 8% in Portugal and Norway to 19% in Belgium and 21% in France.
Instead, the wage penalty of overeducated or overskilled university graduates is found to be lower in
Italy than in other countries. Using the 2001 ISTAT enquiry on professional integration of 1998 graduates,
Cutillo and Di Pietro (2006) find a wage penalty for university graduates ranging between 2.4% and 5.7% in
simple OLS estimates based on an ISTAT database. McGuinness and Sloane (2010) find a wage penalty of
about 10%. Interestingly, in the case of Italy, they find a higher wage penalty for the overskilled (about 11%)
than for the overeducated (about 4%). The latter is not statistically significant. They also find a wage penalty
of about 8% in the case of under-skilling.
Caroleo and Pastore (2011) focus their analysis on jobs held 5 years after the graduation attained in 2005
among AlmaLaurea pre-reform university graduates. Overeducation / overskilling are relatively high when
compared to those in similarly advanced economies, and persistent over the years after graduation. Ceteris
paribus they tend to be more frequent among children of parents with lower educational levels, through
school tracking. The degrees more frequently associated to overeducation are: Agriculture, Arts, Education,
Languages, Physical Education, Political Sciences and Psychology. Working while studying and having
started the university later than the curricular years are also factors. Moreover, they estimate a conditional
wage penalty of about 10% of the median wage for overeducation and of about 6.7% for overskilling.
According to some authors, the evidence available suggests that firms have strong incentives to hire a
worker with a university degree rather than a secondary high school diploma even if the university graduate
is bound to remain overeducated. This can be understood considering the highest unemployment rate existing
9
traditionally in the country and the abundance of non-employed job seekers especially among the youngest
segments of the population. Although higher than that among young people holding a high school diploma,
the unemployment rate of university graduates is in Italy higher than in other EU countries.
This poses an apparent problem of sample selection bias when estimating the wage effect of
overeducation and seems to line in favour of the job competition and job assignment models, rather than the
job search theoretical model. According to the job competition (but also the job assignment) model, it is
likely that the wage penalty of overeducation is lower than actual when it is estimated only among the
employed that are overeducated. The latter represent the smoothest form of educational mismatch: in other
words, the personal attributes that dispose individuals to be mismatched might also reduce their probability
of finding a job. In fact, the most dramatic penalty of possessing educational characteristics that are not much
on demand in the labour market is in terms of a reduced probability to find a job. An alternative hypothesis is
also in order. According to the search theoretical model, unemployment is a voluntary choice and the most
skilled individuals prefer to stay in the unemployment pool waiting for a better job offer to come. In this
case, the OLS would return upward biased estimates of the wage effect of overeducation.
Using an ISTAT survey carried out in 2001 on graduates in 1998, Cutillo and Di Pietro (2006) find that
once controlling for endogeneity of overeducation, the size of the wage penalty increases up to between 22
and 39%. Once controlling for both endogeneity and sample selection bias, the wage penalty of
overeducation reaches always about 40%, regardless of the sample adopted. Controlling for this source of
sample selection bias by using the heckit procedure, Caroleo and Pastore (2011) find that the wage penalty
associated to overeducation / overskilling goes up to 35 and 74 percent, respectively. They take this finding
as supporting the job competition and the job assignment models versus the search theoretical model,
suggesting that the non-employed would be more likely overeducated / overskilled if they found a job.
3. Methodology
The first step of the analysis is studying the determinants of overeducation with a focus on the possible
labor market impact of delayed graduation. Vertical overeducation, the case on which we here focus,
happens when the years of schooling required for the job is lower than the years of schooling completed (so-
called excess schooling). For the determinants of overeducation, we estimate by maximum likelihood a
probit model of the probability to be overeducated:
���� = 1|� = Φ�� + ��� + ��� + �′�� [1]
where O is a binary variable with outcome 1 in case of overeducation and 0 otherwise; X is a vector of
regressors and β is a vector of parameters; Pr denotes probability and Φ is the cumulative distribution
function of the standard normal distribution. Among the regressors, there are a number of components of the
schooling variable, which, following Groot and Oosterbeek (1994), we call actual years of schooling (SA), to
mean the algebraic sum of all components of education:
�� = � + �� + �� [2]
10
where SE represents the effective years, namely the curricular number of years that are necessary to
attain a university degree. As detailed in the data section, it ranges between 16 and 19 according to the type
of degree course program chosen, under the old and new Bologna system, and the kind of faculty attended.
SR represents the number of years that the individual has repeated during her pre-university educational path.
In our data, this variable varies between 0 and 3. SD represents the number of years of delay of graduation
with respect to the curricular years: the data section details how we have measured years of delay, which
range between 0 and 12. In some specifications, SD is collapsed in two components, which are provided
directly in the data:
�� = ����� + ������� [3]
where ����� represents a delay of three years or less and ������� represents a delay of more than three
years. In this type of specification, we have two coefficients for years of delay at the degree: ���� and
������. In fact, three years of delay are quite common in Italy and therefore it is interesting to see whether
also a delay of few years or only a longer one matters. Note also that in some specifications, we use dummy
variables, instead of years, for being in the overeducation status.
Expectations on coefficients of interest are summarized in Table 2. They differ according to the
theoretical framework chosen, namely the human capital model and the screening hypothesis. Effective years
are expected to reduce the probability of being overeducated in both theoretical contexts, although in the
human capital model it happens because of the greater productivity acquired by increasing the years of
schooling, whereas according to the screening hypothesis, it depends on the ability of more skilled
individuals to increase their human capital endowment to signal their skills to perspective employers.
Repeated years are expected to reduce the probability of overeducation according to the human capital
model, since they increase the productivity of individuals. According to the screening hypothesis, instead,
they should increase the probability of overeducation, since they signal lower skill levels.
Similar to repeated years, delayed years at graduation affect the probability of overeducation positively
as based on the screening hypothesis and negatively as based on the human capital model. In fact, delayed
graduation means the possibility of young students to be exposed to educational course programs for a longer
period of time, which means that it should increase the human capital of the individual and reduce the
probability of overeducation. In other words, graduates that have spent more time to attain their degree have
become more skilled and have a possibility to refuse jobs that can be accessed also by competitors with a
lower educational level. According to the screening hypothesis, instead, delayed graduation signals to
perspective employers a lower skill level as compared to graduates who attained their degree on time. It
means that they might be forced by competition in the labor market to choose lower level jobs.
[Table 2 about here]
The chore specification of step two of the analysis is a standard Mincerian earnings equation, estimated
by OLS and augmented of several terms to catch the impact of repeated years, delayed graduation and
11
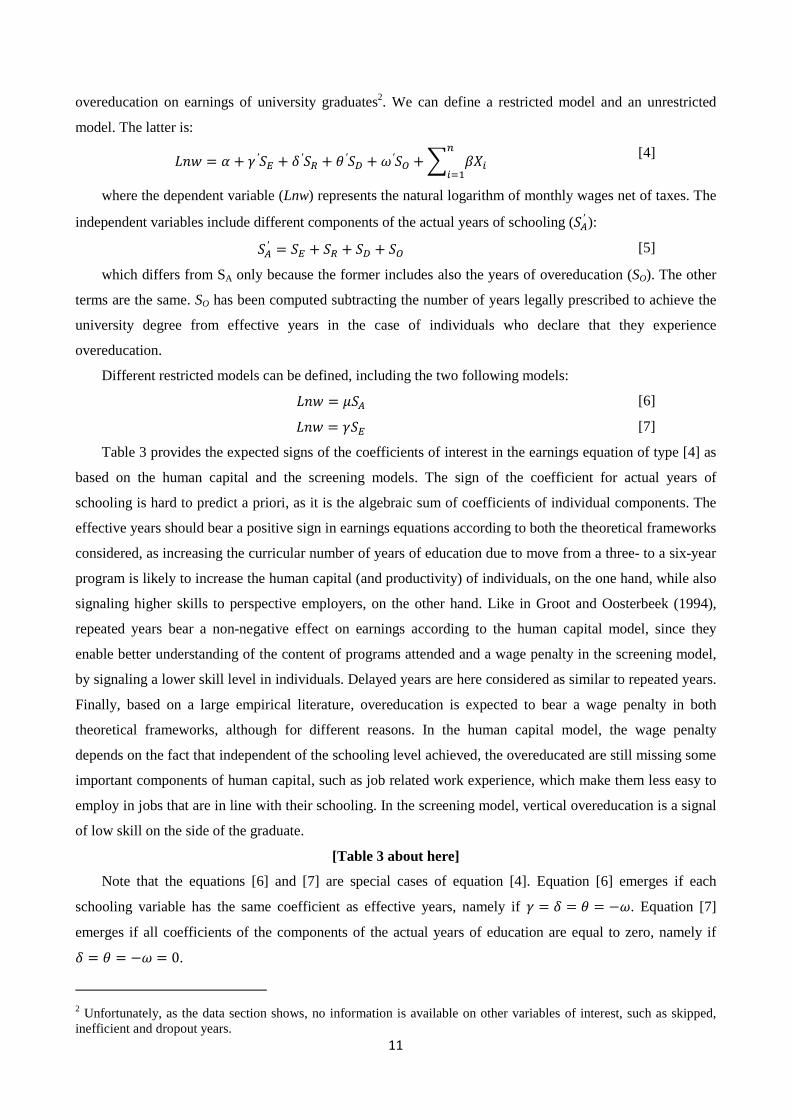
overeducation on earnings of university graduates2. We can define a restricted model and an unrestricted
model. The latter is:
��� = + � ′� + � ′�� + � ′�� + !′�" +# ��$%
$&�
[4]
where the dependent variable (Lnw) represents the natural logarithm of monthly wages net of taxes. The
independent variables include different components of the actual years of schooling (��′ ): ��′ = � + �� + �� + �" [5]
which differs from SA only because the former includes also the years of overeducation (SO). The other
terms are the same. SO has been computed subtracting the number of years legally prescribed to achieve the
university degree from effective years in the case of individuals who declare that they experience
overeducation.
Different restricted models can be defined, including the two following models:
��� = '�� [6]
��� = �� [7]
Table 3 provides the expected signs of the coefficients of interest in the earnings equation of type [4] as
based on the human capital and the screening models. The sign of the coefficient for actual years of
schooling is hard to predict a priori, as it is the algebraic sum of coefficients of individual components. The
effective years should bear a positive sign in earnings equations according to both the theoretical frameworks
considered, as increasing the curricular number of years of education due to move from a three- to a six-year
program is likely to increase the human capital (and productivity) of individuals, on the one hand, while also
signaling higher skills to perspective employers, on the other hand. Like in Groot and Oosterbeek (1994),
repeated years bear a non-negative effect on earnings according to the human capital model, since they
enable better understanding of the content of programs attended and a wage penalty in the screening model,
by signaling a lower skill level in individuals. Delayed years are here considered as similar to repeated years.
Finally, based on a large empirical literature, overeducation is expected to bear a wage penalty in both
theoretical frameworks, although for different reasons. In the human capital model, the wage penalty
depends on the fact that independent of the schooling level achieved, the overeducated are still missing some
important components of human capital, such as job related work experience, which make them less easy to
employ in jobs that are in line with their schooling. In the screening model, vertical overeducation is a signal
of low skill on the side of the graduate.
[Table 3 about here]
Note that the equations [6] and [7] are special cases of equation [4]. Equation [6] emerges if each
schooling variable has the same coefficient as effective years, namely if � = � = � = −!. Equation [7]
emerges if all coefficients of the components of the actual years of education are equal to zero, namely if
� = � = −! = 0.
2 Unfortunately, as the data section shows, no information is available on other variables of interest, such as skipped, inefficient and dropout years.
12
When the regressor of a semi-log earnings equation is a continuous variable, such as years of human
capital accumulated, the elasticity at the mean of the covariates, namely the percentage change in the
dependent variable for a percentage change in the regressor, can be computed multiplying the coefficient by
the mean of the regressor: ��*. In the case of independent dummy variables, like levels of education
attainment or being overeducated, the semi-elasticity interpretation is flawed and, following Halvorsen and
Palmquist (1980), it should be computed as: +, − 1� ∗ 100. This formula measures the percentage change
in the median wage, which is less affected by outliers. Nonetheless, many authors interpret also the estimated
coefficients of dummy variables directly as semi-elasticity. This is acceptable when the estimated coefficient
is sufficiently close to zero.
4. Data
The empirical strategy is tested using a sample of university graduates extracted from the ISFOL-Plus
data base. This is an individual level survey of people belonging to the active population, rather than a
survey of graduates. It means that the sample on which estimates have been run is a sub-sample of graduates
of different age from 21 to 62.
The survey has a longitudinal structure, since the available release has been collected in three years
(2005, 2006 and 2008). However, due to the small number of observations available when we select only
employed university graduates (591 obs.) and the small number of transitions in and out of the overeducation
status (about 20 obs. on average), we base our estimates on a pooled sample including any individual who is
a university graduate and employed after graduation in any of the three point observations.
The ISFOL-Plus survey contains detailed information on the characteristics of individuals according to
their status in the labor market. Our analysis is all conditional on individuals who happen to hold a university
degree and to be employed at the time of the interview, since the purpose of this work is to detect the link
between delayed graduation and overeducation.
In order to calculate the number of years spent at the university beyond the minimum prescribed period,
it is necessary to select individuals who achieved a university degree. To define the delay, we exclude those
who do not provide information on the date of graduation as well as on the type of degree achieved (129
observations); the latter is crucial for defining the legal duration of the degree program chosen. The years of
delay are computed considering the records on individuals’ education careers. To be more precise, for each
person we know the number of years eventually repeated at high school, the type of university degree
attained, the faculty, the year of graduation and whether graduation occurred on time or with a delay of up to
three years or more. Exploiting all the information available, we are in a position of determining with much
accuracy the effective years of schooling – sum of total number of years legally required to graduate, of
repeated years and delay years. In addition, we drop a small number of individuals who have missing values
in their earnings (68 obs).
13
To improve comparability among observations, our exercise excludes the self-employed – as they may
provide no reliable data on their salary – and individuals employed while studying as it might have a
negative effect on graduation time because of having less time to devote to their studies and a positive
impact on the probability of experiencing overeducation.
The final sample includes 1,026 graduates of different age cohorts. With respect to the probability of
being overeducated (i.e. working in a job for which the university degree is not necessary), the dependent
variable takes value 1 if the individual is overeducated and 0 otherwise3. The natural logarithm of the
monthly wage net of taxes is the dependent variable of Mincerian earnings equations4.
The bunch of covariates used in the estimates are selected taking into account the characteristics at the
time of graduation, namely gender, area of residence, type of high-school, high-school marks, faculty,
university final grade, total number of years legally required (i.e. effective years), repeated years and delay
years. The number of years officially prescribed to get a degree varies from 16 to 19 according to the type of
degree course program and regime. It equals 16 years for graduates from three years degree course programs
under the new Bologna system; 17 years for graduates under the old regime if they were enrolled in a four
year program (for instance, in Economics, Law, Modern Literature, Philosophy, Mathematics and so on); 18
years if enrolled in a five year program either under the old system with a degree in Psychology,
Engineering, Agriculture and Biology or in the new Bologna system (the “3+2” program), whatever the field
of study; and 19 years for those who are enrolled in medical studies. The repeated years represents the
number of years that the individual has lost during her pre-university educational path. This variable ranges
between zero – no failures – to three. Finally, delay varies from zero for those who complete their university
studies within the prescribed time to 12 years. Work experience is an additional control. It enters the
estimates as a dummy variable taking a value of 1 if an individual has been in the labor market for up to 10
years, and 0 otherwise. Work experience is computed as the difference between age at the time of the
interview and two terms, namely the age when one gets the first job and the time spent not in employment
after getting the first job. Once we estimate labor market returns, to the aforementioned set of variables, we
include also the dummy for overeducation, the interaction between overeducation and delayed graduation
and a dummy for up to ten years of work experience.
In some of the estimates, we include groups of degrees representing aggregations of different fields of
study. The Humanities group includes education, modern literature and philosophy, foreign languages, and
psychology. The Sciences group includes engineering, architecture, mathematics and physics, agriculture,
medical studies, veterinary medicine, biology, and chemistry. The social sciences group contains law,
economics, statistics, sociology, and political sciences. Finally, the remaining fields of study form the
residual group, namely physical education, interfaculty and the like.
3 The exact wording of the question used to define overeducation is: “With reference to your current job, was your degree necessary?” (Question 43). 4 Unfortunately, we cannot compute the logarithm of hourly wages as only few workers provide information on the number of hours worked per week.
14
5. Results
5.1. Determinants of overeducation
Before considering the results of estimates of equation [1], it is useful to describe the structure of the
data used. The graduates with some delay are about 55% of the employed, while the overeducated are about
19.5%. The graduates who are exposed to both risk factors are 11.8% of the graduates who are employed.
The latter group – delayed graduates who are overeducated – represents a share as high as 21.5% of the
overeducated and 60.5% of the overeducated, showing that the graduates with delay have a higher than
average probability of being overeducated.
Table 4 reports descriptive statistics of our sample of graduates who are in wage employment.
Confirming data obtained in other datasets, 19.5% of individuals in the sample declare to be overeducated.
Most graduates hold a diploma of lyceum, specializing in classical studies, in Mathematics and Sciences, in
Foreign Languages and others. A lower share holds a technical or professional high school diploma. The
proportion of graduates coming from the lyceum is higher than that coming from professional and technical
schools also thanks to the higher quality of high secondary education of the former group of students (see,
for instance, Cappellari, 2004). High school grades concentrate around the highest marks, with only small
shares attaining a small grade. The same applies to the university final grade, with few individuals attaining
small grades. The average work experience is 14.8 years. About half of the sample is constituted of workers
with less than 10 years of work experiences.
[Table 4 about here]
As recent theories of overeducation claim, overeducation is strongly related to the individual’s human
capital endowment. Generally speaking, the individuals with the lowest human capital endowment tend to be
more frequently overeducated: in fact, human capital includes not only general education, but also work
related experience. Estimation by probit of equation [1] allows testing this hypothesis. Results are reported in
Table 5, which can be considered a benchmark estimate to which other estimates can be compared, since it
does not include but the human capital determinants of overeducation.
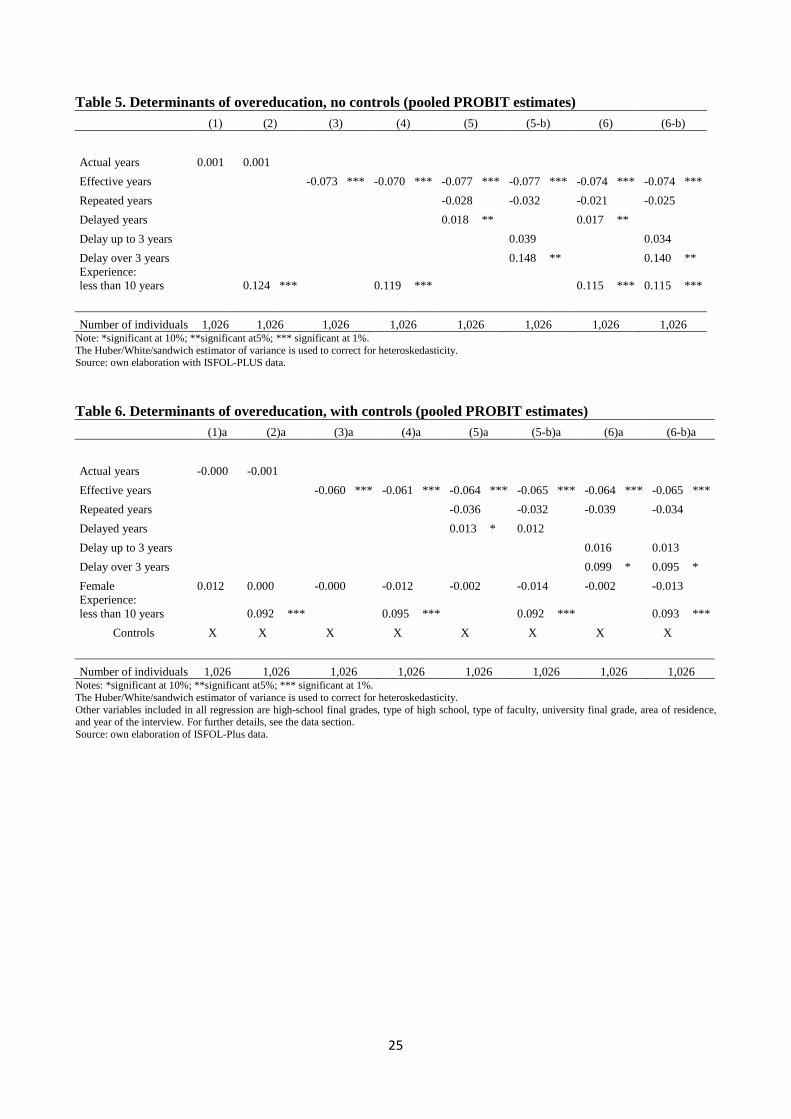
Interestingly, actual years turn out to be not statistically significant regardless of whether we control or
not for work experience (columns 1 and 2), confirming that it is important to disentangle the different
components of schooling if we want to catch the impact of education on the probability to be overeducated.
As already noted above, work experience enters the estimates not as a continuous variable, but rather as a
dummy variable. Not surprisingly, having a work experience of up to 10 years increases the probability of
overeducation by more than 10% and the impact is statistically significant.
When disentangling the components of education, some remarkable results emerge. First of all, the
effective years of schooling (the legal length of a degree) correlate negatively to the probability of
overeducation (columns 3 and 4), as one would expect based on the human capital and the screening models
(recall expectations on coefficients reported in Table 2). Students who attended a longer degree course
15
program, have a lower chance of working in a job wherein the degree awarded is not necessary (about 7%
per year). Again, the impact of effective years is not affected by controls for work experience.
In column (5) and (6) we provide further decomposition of the actual years of education in effective
years, repeated and delayed years. Contrary to what emerges in column (1) and (2) where the total number of
years is not statistically significant, now some of the regressors are statistically significant. Effective years
only slightly reduce their coefficient, once controlling for other factors. The fact that repeated years do not
affect the probability to be overeducated is in line with the human capital model, and in contrast to
expectations based on the screening hypothesis. The likely explanation is that, in the case of people holding a
university degree, employers tend to look only at the last degree attained, not at performance at school.
According to the screening hypothesis, instead, repeated years should be perceived by perspective employers
as a signal of low ability, therefore increasing the probability of overeducation.
Confirming a finding of Caroleo and Pastore (2011), attained using the AlmaLaurea data, delayed
graduation is found to be an important factor of overeducation. Our estimate is that graduating with delay
entails a higher probability of about 2% per each year of delay to get a job for which the degree is not
necessary while no controls are accounted for.
Previous research suggests that the impact of delayed graduation on labor market outcomes is not linear.
For instance, Caroleo and Pastore (2011) find that only delays of five or more years affect in a statistically
significant way the probability to be overeducated, while only delays of three or more years affect the
probability of being overskilled. According to Aina and Casalone (2011), the labor market considers a delay
of three years or less to be physiological, while a degree of more than three years, which means almost
doubling the curricular time, is perceived as a kind of stigma on graduates. On the demand side, employers
see delays of three years or more as indirectly signaling lower skill and productivity levels, also in view of
the late age of entry in the labor market; on the supply side, because of their condition of delay, workers tend
to accept jobs that are less in line with the degree achieved, just to enter the labor market as soon as possible.
Once including two dummies for a delay of three years or less and for a delay of more than three years
(columns 5-b and 6-b), it appears that the probability to be overeducated is positively correlated only with a
delay of more than three years, namely the risk at becoming overeducation is about 14%. Shorter delays at
graduation seem not to be factors from a statistical point of view, although the coefficients have the expected
sign. Other coefficients do not change much. This finding confirms those of the previous literature and
suggests that we should keep the distinction between different length of the delay at graduation when
estimating the wage impact of overeducation and delayed graduation on earnings to which we turn in the
next section.
[Table 5 about here]
Table 6 presents the same human capital variables as Table 5, but controls for a greater number of
regressors, including the high-school final grade, type of high school, faculties, university final grade, area of
residence, and year of the interview. The results discussed above are largely robust to the inclusion of these
16
controls, except for the fact that their level tends to slightly shrink and the coefficients of delayed years tend
to loose in significance levels.
[Table 6 about here]
To sum up, while the evidence on effective and repeated years seems to confirm expectations based on
the human capital model, instead the evidence on delayed years are in line with the screening hypothesis,
though the signal of low skill is especially falling on those individuals who experience a delay of more than
three years.
5.2. Earnings effects
Also results relative to the wage effect of the human capital components are in line with theoretical
expectations. We anticipate that the evidence relative to the impact on wages of different human capital
components is consistent with that found in the overeducation equation: in fact, findings tend to support the
theoretical hypotheses in both contexts. We present three sets of earnings estimates. The first two sets differ
only for the presence of a dummy for less-than-ten-years work experience. The last set also includes some
interaction terms of interest, i.e. the joint effect of being overeducated and fuoricorso, of being fuoricorso
and having little work experience, and of being overeducated with little work experience.
Table 7 provides the first set of estimates. Two columns are foreseen for each specification which differ
for the second column includes additional controls, namely the same controls as in Table 6: high-school final
grade, type of high school, type of faculty, university final grade, area of residence, and year of the
interview. Overeducation bears a wage penalty of about 15.04%5 of the median wage in the specification in
column 1 and of 13%-13.5% in the specifications reported in the following columns including a number of
controls. Overall, this finding is in line with previous ones relative to Italy in similar type earnings equations
(see, among others, Caroleo and Pastore, 2011; and the references therein).
Actual years are not statistically significant when they appear alone (column 1). Interestingly, when
adding the usual control variables, the coefficient of actual years becomes statistically significant and
negative, underlying again that it is important to distinguish the different components of education attained.
This finding would suggest that longer degrees tend to provide a lower annual return than shorter degrees. It
is also probably the algebraic effect of the different components of education.
Confirming the expected human capital effect, earnings increase according to the human capital
endowment of each individual. This conclusion is based on the coefficients of effective years in the columns
from 3 to 6. For example, the salary of a graduate from a four year degree programs is about 7.4% higher
than the one received from a graduate with a first level degree (three-year program). OLS assumes constant
returns to education and therefore the same rate applies for those who have achieved higher education
attainment. Note, though, that when controls are added to the estimate (columns 4 and 6), this variable
becomes not statistically significant. The reason might be that the effect of different types of degree
5 As an example, we report here the application of the Halvorsen and Palmquist’ (1980) formula: (exp(-0.163)-1)*100=-15.04
17
programs are associated with different observed characteristics that also relate positively with earnings, such
as the type of the degree, the share of men, the field of study, the final grade and so on.
Having experienced a failure at high school turns out to affect earnings positively as the human capital
theory would suggest. In line with the screening theory, instead, excess time to graduation entails a poorer
performance in the labor market. The findings reported in column (5) of table 7 suggests that not including in
the regression any ability measures induce employers to select workers taking into account the delayed
graduation as a sign of lower ability/productivity. The estimates are overall statistically significant also when
we introduce in the specification individual characteristics.
The gender wage gap appears to be quite sizeable at over 22% of the median wage in favor of men,
confirming a typical finding of the literature on the gender earnings gap.
[Table 7 about here]
Table 8, then, shows the estimated coefficients of the specification taking into consideration work
experience by means of a dummy variable that equals one for individuals who have less than ten years of
work experience. In each of the columns including a control for work experience, overeducation implies a
lower wage penalty as clearly the number of years spent in the labor market partly compensates for the fact
of doing a job for which the university degree is not necessary.
With regard to the decomposition of the actual years of education reported, the repeated years are not
statistically significant anymore (see columns (5)a and (6)a) as the positive correlation is overcome by the
lack of a sufficient level of work experience. It is then important to notice the behavior of the coefficient
associated with the female dummy. Clearly, females earn less than their male counterpart, but the coefficient
of the gender dummy is twice as large if we do not include any controls, but work experience. For example
in column (5)a, wherein the educational covariates are not considered, females are paid about 44.4% less
than males, ceteris paribus, but this wage differential decreases to about 21% once we take into account the
heterogeneous accumulation of human capital by gender. Finally, individual differences in work experience
determine a salary reduction of about 32% of the median wage for those who have already spent less than 10
years in the labor market.
[Table 8 about here]
The interaction estimates, shown in table 9, aim at exploring the joint effect of delayed graduation and
overeducation (columns (1) and (1a)), delayed graduation and work experience (columns (2) and (2a)), and
overeducation and work experience (column (3) and (3a)) on the individual’s earnings. First, these estimates
confirm the negative separate effects of being overeducated or graduating beyond the minimum period on
wages. Instead, the joint effect of these two variables on wages is always positive, although statistically
significant only when we include in the specification all the controls mentioned earlier. The positive sign
highlights that the wage differential of overeducation is higher amongst those who graduated within the
minimum period rather than not on time. In other words, the wage penalty associated to overeducation is, in
absolute value, higher amongst graduates within the legal length than amongst fuoricorso.
18
The fact of being at the same time fuoricorso and having a work experience of less than 10 years does
not seem to add any statistically significant effect on wages. However, the coefficient of the interaction
between overeducation and a work experience below10 years (columns (3) and (3a)) is statistically
significant and positive, which means that the wage penalty associated to overeducation is higher for those
graduates who have a work experience greater than 10 years. This estimated result is in line with the
evidence according to which overeducation is more harmful if a worker remains overeducated also after
gaining much work experience in the labor market. Thus, it confirms that the wage differences of
overeducated and non-overeducated workers at the beginning of their career are not so huge, contrary to
what happens to older workers. For the latter group the large work experience does not seem to compensate
for the condition of not doing a job for which the university degree achieved is necessary. Overall, all the
other coefficients in each specification provided in table 9 are in line with the expected signs and effects
discussed with reference to table 7 and 8.
[Table 9 about here]
6. Discussion and policy implications
This paper has studied a neglected consequence of delayed graduation, namely overeducation. It has
shown that delayed graduation is an important factor of overeducation and concurs with it to generate a wage
penalty. In fact, we find that delayed graduation generates a direct and an indirect – through overeducation –
wage effect, with the latter being greater than the former.
We find confirmation of the screening hypothesis versus the human capital model in the case of delayed
years and vice versa of the human capital model in the case of repeated years. Repeated years affect
negatively the probability of overeducation, although not with a statistically significant coefficient, but
positively wages. Conversely, years of delayed graduation affect positively the probability of overeducation
and negatively wages, as the screening hypothesis would predict. Although conceptually similar, hence,
delayed years cannot be treated as repeated years: the latter generate a wage premium, whereas the former
generate a wage loss.
On a policy ground, these findings would suggest that while repeated years may be considered an
efficient tool to improve the educational process, in as much as they cause an increase in the human capital
level of students, instead, delayed years are highly inefficient. The likely reason is that, when repeating a year
at high school, a student has to improve her knowledge to pass the exam and in most cases she does; instead
when delaying graduation, there is no guarantee at all that the time spent before graduation is spent studying
and, therefore, increasing one’s human capital. In fact, at the university, students can seat an exam as many
times as they like and often when they like. Only few high quality students tend to take the occasion of
seating again the exam to improve their knowledge. A vast majority instead tends to pass the exam also with
strong deficiencies, simply because professors feel it as nonsensical to fail them again and again for ever.
19
On a more general ground, this paper contributes to the understanding of the causes of low returns to
education in Italy and also in other countries where delayed graduation is common. If delayed graduation
concurs with overeducation in generating a wage penalty for those individuals who have a university degree,
it means that delayed graduation is also a cause of low returns to education. This is a supply-side factor,
confirming the impression of the large and dramatic inefficiencies of the Italian university system and the
fact that they contribute to keep low the quality level of education in the country. Our findings sound
therefore as a warning also for other countries where delayed graduation is becoming more and more
common. Removing the causes of delayed graduation would contribute to reducing overeducation. It is an
important element of efficiency enhancing policy in the tertiary education sector.
Summary remarks The academic circles are devoting a growing interest to the analysis of the overeducation issue –
especially in terms of how to define it and the effects in the individual wage profile – and of delayed
graduation – to detect its determinants and consequences in the labor market –; but, to our knowledge, none
has analyzed the joint consequences of these risk factors. This paper is the first attempt to provide evidence
about the labor market outcomes of overeducated workers that graduated beyond the minimum period
prescribed.
Taking advantage of an adapted version of the theoretical and empirical framework laid down in Groot
and Oosterbeek (1994), we firstly provide evidence that overeducation is more likely to occur if an
individual takes longer than the curricular years to complete her undergraduate studies. We interpret this
result as a consequence of the negative signal – of low productivity – given to prospective employers. The
negative coefficient of effective years supports predictions based on the human capital theory, instead, since
graduates who experience longer degree course programs face a lower probability of being overeducated.
Furthermore, we test the human capital theory and the screening design within the context of Mincerian
earnings equations. The decomposition of the actual years of education in effective years, repeated years,
delayed years and years of overeducation suggests that an increase in the human capital endowment is able to
enhance the returns to education, but overeducation and delayed graduation entail a wage penalty.
Finally, the interaction term of overeducation and work experience underlines that the earnings
differences associated to overeducation is larger amongst workers with more than ten years of work
experience. This finding can be taken as signaling that (a) the wage profile of the overeducated is lower than
that of the non-overeducated and that (b) they are not able to catch up with non-overeducated workers in
terms of earning despite the greater work experience. Instead, regarding the interaction between
overeducation and delayed graduation we find that the wage differential of overeducation is greater for the
group of individuals graduating within the minimum period rather than for the group of graduates not on
time.
The wage effects of overeducation and delayed graduation estimated in this paper are sizeable and
important for two reasons: first, they compare with the very low returns to high education that the previous
20
literature reports in the case of Italy; second, they apply to a large number of graduates, since fuoricorso are
a large majority of Italian graduates. In fact, the findings provided in this paper can be taken as able to
contribute to explain the low returns to high education adding supply side to the more common demand side
considerations. In other words, low average returns to education are also a consequence of the inefficiency of
the tertiary educational system in particular and the waste of resources caused by the fact of generating a
large share of fuoricorso.
In light of our findings, in order to avoid poor returns from higher education, with all the consequences
that this may have in terms of disincentive to investment in high education, policy makers should introduce
incentives to narrow the time spent to get a university degree. Substantial changes in the institutional
framework that could in principle provide an effective mechanism to avoid delayed graduation might be
important policy tools. Among them, progression schemes conditional on having passed all the exams
scheduled in a specific academic year and higher tuition fees for enrolment beyond the prescribed period are
worth mentioning. Clearly, all the interventions must be implemented without reducing the quality of
education that graduates receive during their studies. Finally, to increase job opportunities for graduates and
facilitate a better matching in the graduate labor market which may result also in a reduction in the risk of
becoming overeducated, policy makers should provide more on-the-job training opportunities so to allow
young graduates to increase their work related human capital. An important step forward in this direction is
the recently reformed apprenticeship system.
21
References
Aina, C. (2010), “The Determinants of Success and Failure of Italian University Students. Evidence from administrative data” Working Papers 131, SEMEQ Department – Faculty of Economics – University of Eastern Piedmont .
Aina, C. (2010b), “The Determinants of Educational Attainment, University Drop-out and Time-to-Degree. A Focus on Italy” Working Papers 132, SEMEQ Department – Faculty of Economics – University of Eastern Piedmont .
Aina, C., Baici, E. and G. Casalone (2011), “Time to degree: student’s abilities, university characteristics or something else? Evidence from Italy”, Education Economics, 19(3): 311-325.
Aina, C., L. Cappellari and M. Francesconi (2011), Student Performance may not Improve when Universities are Choosier, CESifo Working Paper Series 3264, CESifo Group Munich.
Aina, C. and G. Casalone (2011), “Does Time-to-Degree Matter? The Effect of Delayed Graduation on Employment and Wages”, Working Papers 38, AlmaLaurea Inter-University Consortium.
AlmaLaurea (2011), XII profilo dei laureati italiani. Valutazione dei percorsi formativi nell’università a dieci anni dalla Dichiarazione di Bologna, Il Mulino, Bologna.
AlmaLaurea (2010), XI profilo dei laureati italiani. Valutazione dei percorsi formativi nell’università a dieci anni dalla Dichiarazione di Bologna, Il Mulino, Bologna.
Becker, S. (2006), “Introducing Time-to-Educate in a Job-Search Model”, Bulletin of Economic Research, 58(1): 61-72.
Bound, J., M.F. Lovenheim and S. Turner (2010), “Increasing time to baccalaureate degree in the United States”. Working Paper 15892, National Bureau of Economic Research (NBER).
Bowen, W.G., M.M. Chingos and M.S. McPherson (2009), Crossing the Finish Line: Completing College at America’s Public Universities, Princeton University Press, Princeton.
Brodaty, T., R.J. Gary-Bobo and A. Prieto (2008), “Does Speed Signal Ability? The Impact of Grade Repetitions on Employment and Wages”, Discussion Paper DP6832, Center for Economic Policy Research (CEPR).
Brunello, G., S. Comi and C. Lucifora (2001), “The Returns to Education in Italy: A New Look at the Evidence”, in C.Harmon, I. Walker and N. Westergard-Nielsen (eds.), The Returns to Education in Europe, Edward Elgar, 2001.
Brunello, G. and R. Winter-Ebmer (2003), “Why do students expect to stay longer in college? Evidence from Europe”. Economic Letters 80(2): 247-253.
Brunello, G. e D. Checchi (2007), “Does School Tracking Affect Equality of Opportunity? New International Evidence”, Economic Policy, 22(52): 783-861.
Cappellari, L. (2004), "The Effects of High School Choices on Academic Performance and Early Labour Market Outcomes," Royal Economic Society Annual Conference, Royal Economic Society.
Caroleo F. E. and F. Pastore (2012), “Talking about the Pigou Paradox: Socio-Educational Background and Educational Outcomes of AlmaLaurea”, forthcoming in International Journal of Manpower, 33 (1).
Checchi, D. (2003), “The Italian Educational System: Family Background and Social Stratification”, in ISAE (ed.), Monitoring Italy, ISAE, Rome.
Checchi, D. and L. Flabbi (2007), “Intergenerational Mobility and Schooling Decisions in Germany and Italy: The Impact of Secondary School Tracks”, IZA discussion paper, N. 2876.
Cutillo, A. and G. Di Pietro (2006), “The effects of overeducation on wages in Italy: a bivariate selectivity approach”, International Journal of Manpower, 27(2): 143-168.
22
Garibaldi, P., F. Giavazzi, A. Ichino, and E. Rettore (2012), “College Cost and Time to Complete a Degree: Evidence from Tuition Discontinuities”, forthcoming in The Review of Economics and Statistics.
Groot, W. and H. Oosterbeek (1994), “Earnings Effects of Different Components of Schooling; Human Capital versus Screening”, The Review of Economics and Statistics, 76 (2): 317.321.
Häkkinen, I. and R. Uusitalo (2003), “The effect of a student aid reform on graduation: a duration analysis”. Journal of Applied Econometrics, 5(1): 1-28.
Halvorsen, R. and Palmquist, R. (1980), “The Interpretation of Dummy Variables in Semilogarithimic Equations”, American Economic Review 70(3), 474-75.
ISTAT. 2008. Università e Lavoro: orientarsi con la statistica. Roma: ISTAT
Manacorda, M. and E. Moretti (2006), “Why Do Most Italian Young Men Live With Their Parents? Intergenerational Transfers and Household Structure”, Journal of the European Economic Association, 4 (4): 800-829.
McGuinness, S. and P.J. Sloane (2010), “Esiste overeducation? Un’analisi comparata”, in AlmaLaurea, XII Rapporto sulla condizione occupazionale dei laureati. Investimenti in capitale umano nel future di Italia ed Europa, Il Mulino, Bologna.
Monks, J. (1997), “The Impact of College Timing on Earnings”, Economics of Education Review, 16(4): 419-423.
OECD (2010), Education at a Glance 2010: OECD Indicators, OECD Publishing.
Pastore, F. (2009), “School-to-work Transitions in Italy. A steeplechase with no Winner?”, XXIV AIEL Conference, University of Sassari, Sassari.
Van Ours, J. C. and G. Ridder (2003).”Fast Track or Failure: A Study of the Graduation and Dropout Rates of Ph.D. Students in Economics”, Economic of Education Review, 22(2): 157-166.
23
Appendix of Tables and Figures Table 1. Human capital versus screening model, expected sign in Groot and Oosterbeek (1994) Human capital model Screening hypothesis Repeated years �� ≥ 0 �� < 0 Skipped years �0 ≤ 0 �� > 0 Inefficient routing years �3 ≥ 0 �3 < 0 Dropout years ��" > 0 ��" < 0
Table 2. Expected signs in PROBIT equations of the determinants of overeducation Human capital model Screening hypothesis Actual years ' = �. 5. ' = �. 5. Effective years � < 0 � < 0 Repeated years � ≤ 0 � > 0 Delayed years � ≤ 0 � > 0 1-3 years of delay ���� ≤ 0 ���� > 0 3 years or more of delay ������ ≤ 0 ������ > 0 Note: coefficients are as presented in equation [1] in the main text.
Table 3. Expected signs in earnings equations Human capital model Screening hypothesis Actual years ' = �. 5. ' = �. 5. Effective years � ′ ≥ 0 � ′ ≥ 0 Repeated years � ′ ≥ 0 � ′ < 0 Delayed years 6′ ≥ 0 6′ < 0 1-3 years of delay ����,′ ≥ 0 ����,′ < 0 3 years or more of delay ������,′ ≥ 0 ������,′ < 0 Overeducation years ! < 0 ! < 0 Note: coefficients are as presented in equation [1] in the main text.
24
Table 4. Descriptive statistics All
Overeducated 19.49
Graduates with delay 54.97
Graduates with delay and overeducated 11,79
Actual years 18.705
Effective years 17.256
Repeated years .1257
Delayed years 1.323
Overeducation .1949
Women .6715
Age 40.81
High school
Licei .4483
Technical .1325
Professional .1033
High school final gradea
90-100 .2544
80-89 .3099
70-79 .2339
60-69 .0877
Group of faculties
Social sciences .1969
Scientific .2368
The Humanities .2914
Other faculties .0419
University final gradea
110 -110 cum laude .3635
99-109 .4415
<99 .1491
Area of residence
North West .2437
North East .2368
Center .1959
South .3236
Work career
Experience in years 14.812
Experience10 .4766
Number of observations 1,026 Note:
a The sum of the percentages within each category is not
equal to 1 as some individuals do not provide information about the final mark. Source: own elaboration of ISFOL-Plus data.
25
Table 5. Determinants of overeducation, no controls (pooled PROBIT estimates) (1) (2) (3) (4) (5) (5-b) (6) (6-b)
Delay over 3 years 0.148 ** 0.140 ** Experience: less than 10 years 0.124 *** 0.119 *** 0.115 *** 0.115 ***
Number of individuals 1,026 1,026 1,026 1,026 1,026 1,026 1,026 1,026 Note: *significant at 10%; **significant at5%; *** significant at 1%. The Huber/White/sandwich estimator of variance is used to correct for heteroskedasticity. Source: own elaboration with ISFOL-PLUS data.
Table 6. Determinants of overeducation, with controls (pooled PROBIT estimates) (1)a (2)a (3)a (4)a (5)a (5-b)a (6)a (6-b)a
Female 0.012 0.000 -0.000 -0.012 -0.002 -0.014 -0.002 -0.013 Experience: less than 10 years 0.092 *** 0.095 *** 0.092 *** 0.093 ***
Controls X X X X X X X X
Number of individuals 1,026 1,026 1,026 1,026 1,026 1,026 1,026 1,026 Notes: *significant at 10%; **significant at5%; *** significant at 1%. The Huber/White/sandwich estimator of variance is used to correct for heteroskedasticity. Other variables included in all regression are high-school final grades, type of high school, type of faculty, university final grade, area of residence, and year of the interview. For further details, see the data section. Source: own elaboration of ISFOL-Plus data.
26
Table 7. Earnings estimates, without work experience (pooled OLS estimates) (1) (2) (3) (4) (5) (6)
Number of individuals 1,026 1,026 1,026 1,026 1,026 1,026 Notes: *significant at 10%; **significant at5%; *** significant at 1%. The Huber/White/sandwich estimator of variance is used to correct for heteroskedasticity. Other variables included in all regression are high-school final grade, type of high school, type of faculty, university final grade, area of residence, and year of the interview. Source: own elaboration of ISFOL-Plus data.
Table 8. Earnings estimates including work experience (pooled OLS estimates) (1)a (2)a (3)a (4)a (5)a (6)a
Number of individuals 1,026 1,026 1,026 1,026 1,026 1,026 Notes: *significant at 10%; **significant at5%; *** significant at 1%. The Huber/White/sandwich estimator of variance is used to correct for heteroskedasticity. Other variables included in all regression are high-school final grade, type of high school, type of faculty, university final grade, area of residence, and year of the interview. Source: own elaboration of ISFOL-Plus data.
Number of individuals 1,026 1,026 1,026 1,026 1,026 1,026 Notes: *significant at 10%; **significant at5%; *** significant at 1%. The Huber/White/sandwich estimator of variance is used to correct for heteroskedasticity. Other variables included in all regression are high-school final grade, type of high school, type of faculty, university final grade, area of residence, and year of the interview. Source: own elaboration of ISFOL-Plus data.
28
Figure 1. Enrolled students, fuoricorso and graduates in Italy (1969-2009)
Note: The vertical line highlights the year when “3+2” university reform has been introduced. Source: Own elaboration of Istat and MIUR data (1969-2009).
Figure 2. Trends of graduates within the minimum period and fuoricorso (2002-2010)
Source: Own elaboration of MIUR data.
50,000
350,000
650,000
950,000
1,250,000
1,550,000
1,850,000
2001
1969
1974
1979
1984
1989
1994
1999
2004
2009
year
Students enrolled Graduates Fuori Corso
25
30
35
40
45
50
55
60
65
70
75%
2002 2004 2006 2008 2010year
Graduates within the minimum period Graduates fuoricorso