Page 1
Deletion of Mitochondrial Uncoupling Protein 2 Exacerbates
Mitochondrial Damage in Mice Subjected to Cerebral Ischemia and
Reperfusion Injury Under Both Normo- and Hyperglycemic
Conditions
Maotao He1,2,3, Yanmei Ma2, Rui Wang2, Jianzhong Zhang2, Li Jing2,*, P. Andy Li3,*
1Department of Pathology, General Hospital of Ningxia Medical University,
Yinchuan, Ningxia 750004, China
2School of Basic Medical Sciences, Department of Pathology, Ningxia Medical
University; Ningxia Key Laboratory of Vascular Injury and Repair, Yinchuan,
Ningxia 750004, China
3Department of Pharmaceutical Sciences, Biomanufacturing Research Institute and
Technological Enterprise (BRITE), College of Health and Sciences, North Carolina
Central University, Durham, NC 27707, USA
*Corresponding authors: Dr. P. Andy Li, Email: [email protected] ; Dr. Li Jing, Email:
[email protected]
Declarations of interest: None
Page 2
Abstract
Deletion of mitochondrial uncoupling protein 2 (UCP2) has been shown to aggravate
ischemic damage in the brain. However, the underlying mechanisms are not fully
understood. The objective of this study is to explore the impact of homozygous UCP2
deletion (UCP2-/-) on mitochondrial fission and fusion dynamic balance in ischemic
mice under normo- and hyperglycemic conditions. UCP2-/- and wildtype mice were
subjected to a 60 min middle cerebral artery occlusion (MCAO) and allowed
reperfusion for 6h, 24h and 72h. Our results demonstrated that deletion of UCP2
enlarged infarct volumes and increased numbers of cell death in both normo- and
hyperglycemic ischemic mice compared with their wildtype counterparts subjected to
the same duration of ischemia and reperfusion. The detrimental effects of UCP
deletion were associated with increased ROS production, elevated mitochondrial
fission markers Drp1 and Fis1 and suppressed fusion markers Opa1 and Mfn2 in
UCP2-/- mice. Electron microscopic study demonstrated a marked mitochondrial
swolling after 6h of reperfusion in UCP2-/- mice, contrasting to a mild mitochondrial
swolling in wildtype ischemic animals. It is concluded that the exacerbating effects of
UCP2-/- on ischemic outcome in both normo- and hyperglycemic animals are
associated with increased ROS production, disturbed mitochondrial dynamic balance
towards fission and early damage to mitochondrial ultrastructure.
Keyword: Uncoupling protein 2; cerebral ischemia; hyperglycemia; mitochondrial
dynamics; mitochondrial fission; mitochondrial ultrastructure; ROS.
Page 3
Introduction
Uncoupling protein 2 (UCP2) is a member of inner mitochondrial membrane proteins,
that dissipates the mitochondrial proton gradient by transporting H+ across the inner
membrane, thereby generating heat, stabilizing the inner mitochondrial membrane
potential and reducing the formation of reactive oxygen species (ROS) [1,2]. Several
studies have suggested UCP2 plays a vital role in the pathological process of neural
damage after cerebral ischemia and reperfusion (I/R) [3, 4, 5]. Our previous studies
have shown that deletion of the UCP2 gene exacerbates ischemic infarct volume,
upregulates the protein levels of the inflammatory cytokines, and suppresses
antioxidant, cell-cycle, and DNA repair genes in normoglycemic animals [6]. And
that overexpression of UCP2 inhibits pro-inflammatory cytokines and activates cell
cycle and cell survival factors [7].
Many studies have identified diabetes mellitus as an independent and significant
risk factor for stroke as well as stroke-related mortality [8, 9, 10]. Both experimental
and clinical studies have shown that hyperglycemia, one of the main characteristics of
diabetes mellitus, further exacerbates ischemia/reperfusion, activating cell survival
pathways [11, 12], causing early damage to astrocytes and mitochondria, and
inhibiting mTOR and ERK1/2 signaling [13, 14, 15]. However, the role of UCP2 in
hyperglycemic ischemic damage has not been studied. In this study, we examined the
effects of UCP2 deletion on ischemic outcomes in normo- and hyperglycemic mice
subjected to a transient middle cerebral artery occlusion (MCAO).
Page 4
Mitochondrial dynamics refers to the balance of fusion and fission in the
mitochondrial network to maintain their shape, distribution, and size. Mitochondrial
fission is ensured by dynamin-related protein 1 (Drp1) and fission 1 (Fis1), while
Mitofusins 1, 2 (Mfn1, Mfn2) and optic atrophy 1 (Opa1) mediate mitochondrial
fusion process [16]. Mitochondrial dynamics is closely associated with mitochondrial
function and neurons are particularly sensitive to perturbations in mitochondrial
dynamics. Accumulative evidence has revealed a close link between imbalanced
mitochondrial dynamics and neurodegenerative diseases. Recent reports have
suggested that mitochondrial fission is an early event required for ischemic neuronal
death [17]. Mitochondrial fission occurs as early as 3 h after reperfusion in ischemic
mice [18]. In contrast, loss of mitochondrial fusion protein Mfn2 contributes to
enhanced ischemia/reperfusion injury [19]. In both in vivo and in vitro ischemic
models, the expression of Mfn2 is decreased,which leads to mitochondrial dynamics
imbalance and disruption of Ca2+ homeostasis [20]. Hyperglycemia further tilts the
mitochondrial dynamic imbalance toward fission by increasing the levels of fission
markers and decreasing fusion proteins in the early reperfusion stage [21]. However,
it is unknown whether UCP2 regulates mitochondrial fission and fusion in the setting
of cerebral I/R injury under normo- and hyperglycemic conditions. The objective of
this study was to explore the impact of UCP2 deletion on mitochondrial dynamic
balance in ischemia and reperfusion injury under both normo-and hyperglycemic
conditions.
Page 5
Materials and Methods
Materials
Streptozotocin (STZ) and 2,3,5-Triphenyl Tetrazolium Chloride (TTC) were obtained
from Sigma. A Reactive Oxygen Species Assay Kit was purchased from Beyotime
(Jiangsu, China). TUNEL Assay Kit was obtained from Roche (Mannheim, Germany).
Opa1 (ab90857) and Mfn2 (ab50843) antibodies were purchased from Abcam. Fis1
(PA5-22142) antibody was purchased from Thermo Fisher scientific. Drp1 (#8570)
antibody was purchased from Cell Signaling Technology and anti-β-actin was
purchased from Bios (Beijing, China).
Animals and groups
A total of 286 male UCP2-/- mice and wildtype (WT) mice were used in this study. All
animal procedures were performed following the NIH Guide for Care and Use of
Laboratory Animals and were approved by the Institutional Animal Care and Use
Committee at Ningxia Medical University. Breeding pairs of UCP2-/- mice were
obtained from the Jackson laboratory and their off-springs were genotyped. The mice
were maintained in a specific pathogen-free colony of the Laboratory Animal Center of
Ningxia Medical University (Yinchuan, China) with controlled temperature, humidity,
and 12:12 hour light and dark cycle.
UCP2-/- mice and WT mice were randomly divided into normo- and hyperglycemic
groups, each consisting of four subgroups: a sham-operated control and 1h MCAO plus
6h, 24h, and 72h of reperfusion. The animal groups and numbers used in each group are
summarized in Table 1. Hyperglycemia was induced by intraperitoneal injection of
Page 6
STZ (120 mg/kg) that was freshly dissolved in 0.1 M citrate buffered saline (pH 4.5).
Age-matched mice receiving the same volume of 0.1 M citrate-buffered saline served
as normoglycemic controls. The blood glucose level was measured after 72h of STZ
injection using Blood Glucose Meter (Boshilong, Taiwan). Animals with a blood
glucose level higher than 16.8 mmol/L were designated as the hyperglycemia mice
based on our previous experience [22].
Ischemia and reperfusion model
The animals were anesthetized with 3% isoflurane for induction and maintained at 1.0
- 1.5% during the surgical procedures. The anesthesia was delivered in a 70% nitrous
oxide and 30% oxygen mixture using a facemask (MATRX VIP 3000). Cerebral
ischemia was induced by middle cerebral artery occlusion (MCAO). Briefly, the
internal carotid artery (ICA), external carotid artery (ECA), and the common carotid
artery (CCA) were isolated through a midline incision. The right CCA was ligated,
and the right ICA was temporarily closed by a loose suture. A small incision was
made on the CCA and a filament (Doccol corporation, USA), which had a distal
cylinder of silicon rubber with a diameter of 0.21±0.02 mm, was inserted into the ICA
until a faint resistance was felt. After 60 min occlusion, the filament was withdrawn to
achieve recirculation. The sham animals were subjected to the same surgical
procedure as the MCAO mice but without occlusion of the MCA. During the surgery
period, the body temperature of the mice was maintained with a heating pad and lamp
and monitored by a rectal thermometer (Omron, Dalian, China). The mice were
Page 7
subjected to a neurological examination immediately after the animals recovered from
anesthesia to judge the successful induction of MCAO model and again after 24h
reperfusion to compare the functional recovery between the experiential groups. The
neurological deficit was scored by Zea-Longa scale: 0, no neurological deficits; 1,
failure to fully extend left paw; 2, circling to the left; 3, falling to the left; 4, unable to
walk spontaneously and exhibiting depressed levels of consciousness. The animal
with scores of 2 and above was selected as the successful MCAO model. Five animals
were excluded due to lack of neurological deficit after MCAO. All animals were
coded with a number and the people who further process the measurements and
analysis were blinded to the experimental conditions.
Anatomy of the MCA and Circle of Willis
The animals were deeply anesthetized and transcardially perfused with 0.9% saline to
flush out the blood. Mouse was injected with Indian ink (2%) made in 20% gelatin
and saline. After perfusion brain was cooled to allow gelatin solidification and fixed
with 4% paraformaldehyde. Brain images were captured using a Nikon digital
camera.
Measurement of infarct volume and edema
The mice were sacrificed at 24 h after MCAO and whole brains were dissected
coronally into 1-mm brain slices using a stainless brain matrix (68707, RWD,
Shenzhen). The brain slices were immediately placed into a 24-well plate and
Page 8
incubated with 2, 3, 5-triphenyltetrazolium chloride (TTC, 2%) at 37 °C for 15 min
and then fixed in 4% paraformaldehyde. TTC stains viable brain tissue as deep red but
infarcted tissues as pale color. Areas of infarcted tissue were measured using NIH
Image J software (rsb.info.nih.gov/nih-image) and infarct volumes were calculated
from all sections with corrections of intersection distance. The infarcted volume was
expressed as the percentage of infarcted tissue relative to total brain tissue. Edema
volume was semi-quantitatively analyzed after 24 h reperfusion. The relative edema
volume (%) was calculated as: (ipsilateral hemisphere volume - contralateral
hemisphere volume) / (contralateral hemisphere volume) ×100%.
ROS detection
Frozen mice brain sections were cultured and incubated in the dark with 10 μM/L of
Dihydroethidium (DHE) for 30 min at 37°C. Intracellular ROS production was
assessed with an Olympus FluoView1000 Laser Scanning Confocal Microscope
(using ex/em λ=480 nm/535 nm for DHE).
TUNEL staining
Terminal deoxynucleotidyl transferase mediated dUTP nick‑end labeling (TUNEL)
staining was used to detect apoptosis cells (Roche, #11684795910) according to the
manufacturer’s protocol. The number of TUNEL-positive cells was counted in five
microscopic fields at 400 X.
Page 9
Immunohistochemistry assay
Paraformaldehyde-fixed and paraffin-embedded brain tissues were sectioned (4 µm
thickness). The sections were submerged in citrate buffer (pH = 6.0) and heated at
boiling temperature under a high-pressure situation for 5 min for antigen retrieval.
The expression levels of Fis1 (1:400, PA5-22142, Thermo Fisher), Opa1(1:200,
ab90857, Abcam), Drp1(1:200, #8570, CST) and Mfn2 (1:200, ab50843, Abcam)
proteins were examined in each group after primary antibody incubation overnight
and secondary antibody incubation at 37°C for 45 min. The reaction was visualized
with DAB (ZSGB-BIO, Beijing, China) staining and then hematoxylin
counterstaining the nuclei. The number of positively stained cells was counted in five
microscopic fields at 400 X.
Western blot
The brain tissues were homogenized on ice with lysis buffer. We determined the
protein concentration of each protein sample to ensure that the sample volumes were
consistent. Equal amounts (50 µg) of protein extracts were subjected to 10%-12%
sodium dodecyl sulfate-polyacrylamide gels electrophoresis (SDS-PAGE) and
transferred to polyvinylidene fluoride membranes (Millipore). The membranes were
incubated overnight at 4°C with the following primary antibodies: anti-Fis1 (1:1000),
anti-Opa1 (1:1000), anti-Mfn2 (1:1000) and anti-Drp1 (1:1000). Then, the membranes
were incubated with secondary antibodies for 1h at room temperature. Imaging was
performed using the BIO-RAD Imaging System with chemiluminescence detection
reagents. Semi-quantitative results were obtained by measuring the optical density of
the target bands and were expressed as the ratio of each targeted protein to β-actin. We
make the band densities in WT+NG sham groups as 100 to compare differences in
Page 10
other group. Band relative densities were analyzed by NIH Image J software
(rsb.info.nih.gov/nih-image).
Electron Microscopic Studies
Brains were perfusion fixed with 2% glutaraldehyde at 6 h of reperfusion collected
from both normoglycemic and hyperglycemic animals. The brain sections were taken
between Bregma 1 to -1 mm and post-fixed with 4% glutaraldehyde in 0.1 mol/L
cacodylate buffer (pH 7.4). The sections were then soaked in 1% osmium tetroxide in
0.1 M cacodylate buffers for 2 h and stained with 1% aqueous uranyl acetate
overnight. Tissue sections were dehydrated in ascending series of ethanol to 100%
followed by dry acetone and embedded in epoxy resin. Ultrathin sections were cut and
counterstained with lead citrate before examination by transmission electron
microscope (H7650).
Statistics
All data are presented as means ± SD. Statistical analysis was performed using
one-way ANOVA with SPSS 19.00. Student’s t-test was used to analyze the
difference in infarct volume between the two animal species. Statistical significance
was determined as p < 0.05. The numbers of animals in each subgroup are given in
Table 1 and in Figure legends.
Page 11
Results.
1. Cerebral vasculature and blood glucose levels in transgenic and WT mice
The experimental protocol is illustrated in Fig. 1A. To evaluate whether UCP2
deletion causes phenotypic changes in the cerebral vasculature, we transcardially
injected Indian black ink and imaged the cerebral blood vessels (Fig. 1B). The result
showed intact and correct alignment of the circle of Willis, anterior, middle, and
posterior cerebral arteries with no remarkable difference between WT and UCP2-/-
mice. Physiological variables were measured and maintained constant. Body
temperature was kept at 36.5°C to 37.5°C. As expected, the blood glucose (Fig. 1C)
was significantly higher in the STZ induced hyperglycemia mice than those in control
group (p<0.01). The average blood glucose level in the WT normal glucose group
(WT+NG) was 7.70±1.32 mM, while that in the WT hyperglycemic group (WT+HG)
was 22.19±6.10 mM (p<0.01 vs. WT+NG). Similarly, blood glucose concentration
was 7.15±2.00 mM in UCP2-/- normal glucose group (UCP2-/-+NG) and 21.91±6.31
mM in UCP2-/- hyperglycemic group (UCP2-/-+HG) (p<0.01 vs. UCP2-/- +NG).
However, there was no difference in blood glucose level between WT and UCP2-/-
animals. Animal body weight and body temperature were the same between UCP2-/-
and WT under same glycemic conditions (Fig. 1D and 1E).
2. UCP2 deletion aggravated ischemic brain damage in both normo- and
hyperglycemic mice.
To determine whether the deletion of UCP2 can aggravate ischemic brain damage
under both normo- and hyperglycemic conditions, we examined infarct volumes and
neurological deficits. First, the results showed that UCP2 deletion increased infarct
volume compared to WT mice under normoglycemic condition. Focal ischemia of 60
Page 12
min duration induced brain infarct in the striatum, without much involvement of the
overlaying cortex in WT mice at 24h of reperfusion. The infarct volume was
significantly enlarged in UCP2-/- mice compared with the WT mice, which covered
both the striatum and the cortex. Second, hyperglycemia enlarged infarct volume
compared with that in normoglycemic WT mice (Fig. 2A and 2B). Third, UCP2
deletion with hyperglycemia further expanded the infarct volume compared with WT
mice under hyperglycemic condition. Similarly, UCP2-/- mice showed a significant
increase in neurological deficit scores compared with WT ischemic mice (Fig. 2C),
indicating neurological deficit scores were positively correlated to the infarct size.
Compared with the WT+HG group, UCP2-/- +HG group had more severe neurological
deficit scores after ischemia/reperfusion (p<0.05). Measurement of brain edema also
suggested that UCP2-/- significantly increased brain edema compared to WT mice
under both normo- and hyperglycemic ischemic conditions (p<0.05, Fig. 2D). Our
data demonstrate that UCP2 deletion aggravated ischemic brain damage in both
normo- and hyperglycemic mice.
3. UCP2 deletion aggravated histopathological changes and apoptotic death after
ischemia under both normo- and hyperglycemic conditions.
The pathological outcomes in the cortex are given in Figure 3A and 3B. As shown
in Figure 3A, a few scattered dead neurons were observed in the sham-operated
animals. Transient cerebral ischemia resulted in a mildly increased number of dead
neurons in the cortex after 24h of reperfusion in WT mice (p<0.01). Deletion of
UCP2 further increased the percentage of dead neurons in the cortex 24h after
reperfusion compared with the WT counterpart under both euglycemic and
hyperglycemic conditions (Fig. 3A and 3B). As expected, hyperglycemia caused more
ischemic cell death than normoglycemic animals in both WT and UCP2-/- mice.
Page 13
Interestingly, Nissl staining showed a significant decrease after ischemia in WT
animals with euglycemic condition. Deletion of UCP2 did not seem to further reduce
to the Nissl staining in euglycemic mice. However, deletion of UCP2 in
hyperglycemic animals significantly decreased Nissl body’s density compared with
WT mice in hyperglycemic group (Fig. 3C and 3D). TUNEL staining images were
taken from the ischemic penumbra area in the ipsilateral cortex. We selected the
penumbral area because most apoptotic cells present in this area. Our results revealed
ischemia increased the number of TUNEL positive cells. Similarly, hyperglycemic
ischemia increased the number of TUNEL positive cells compared with
normoglycemic ischemia and UCP2 deletion further elevated the numbers of TUNEL
positive cells after ischemia in both normo-and hyperglycemic animals compared with
the WT counterparts (Fig. 3E and 3F). The right corner of the WT+HG image was
taken close to the ischemic core. There was less TUNEL positive neurons in this area
probably due to the fact that severe insult in HG ischemia led to more necrotic,
instead of apoptotic, cell death.
4. UCP2 deletion enhanced ROS production in both normo- and hyperglycemic
mice after ischemia.
As shown in Figure 4A and 4B, MCAO induction caused a significant
enhancement of superoxide production as detected by DHE. Consistently,
hyperglycemia further increased the ROS compared with normoglycemic mice after
ischemia and reperfusion at 24h in the cortex and deletion of UCP2 led to a much
more pronounced elevation of ROS in both normo- and hyperglycemic animals after
ischemia and reperfusion injury compared with their matched WT counterparts.
Page 14
5. UCP2 deletion further exacerbated the ischemia-induced mitochondrial
dynamic imbalance
Mitochondrial dynamics constantly change between fission and fusion status. To
understand the mechanism by which UCP2 modulates mitochondrial fission/fusion
balance, we detected mitochondrial fission and fusion-associated proteins in cortical
samples collected from animals subjected to 60 min of ischemia and followed by 6h,
24h and 72h of reperfusion by immunohistochemistry and Western blot (Fig. 5 and
Fig. 6).
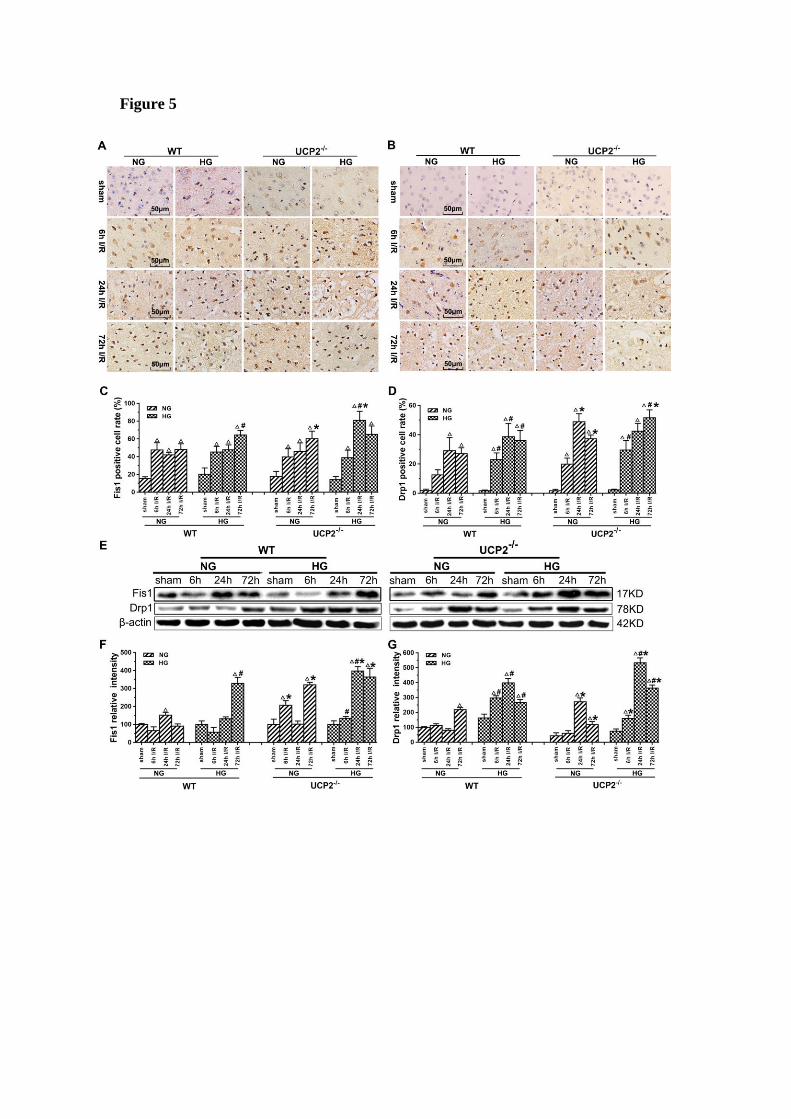
The results of immunohistochemistry for Fis1 and Drp1 are given in Figure
5A-5D. The positive cells were labeled in brownish yellow color, and hematoxylin
counterstaining stained the nuclei in blue. The expression of mitochondrial
fission-related proteins was evaluated by the ratio of the number of positive cells to
the total number of cells. Ischemia in normoglycemic WT mice induced a significant
elevation of Fis1 and its level already peaked at 6h of reperfusion and maintained at
that high level up to 72h (Fig. 5A and 5C). UCP2 deletion caused a further elevation
of Fis1 in both normo- and hyperglycemic mice after ischemia compared with the WT
mice. Changes of Drp1 were similar to those of Fis1. Thus, UCP2 deletion further
pushed the Drp1 to higher levels at 24h and 72h in normoglycemic and 72h in
hyperglycemic animals than in the WT counter groups (Fig. 5B and 5D). These
results were further supported by Western blot. As shown in Figure 5E-5G, I/R injury
upregulated the expression of proteins related to mitochondrial fission such as Fis1
and Drp1 over reperfusion time. The trend of Fis1 changes was similar to the results
of immunohistochemistry (Fig. 5E and 5F). However, the level of Drp1 reached a
peak at 24h in UCP2-/- mice and was significantly higher than that in WT mice in
hyperglycemic group (Fig. 5E and 5G).
Page 15
Immunohistochemistry detection of mitochondrial fusion proteins Opa1 and Mfn2
revealed decreases of these two proteins in UCP2-/- mice (Fig. 6A-6D). As shown,
Opa1 level decreased slightly in WT mice after 72h of reperfusion, while UCP2
deletion decreased Opa1 content at 6h and 24h compared with WT ischemic mice
(Fig. 6A and 6C). UCP2 deletion in hyperglycemic animals lowered Opa1 values in
control and at 6h of reperfusion. UCP2 deletion resulted in a significant reduction of
Mfn2 at 72h of reperfusion in normoglycemic ischemic animals and at 24h and 72h in
hyperglycemic ischemic animals (Fig. 6B and 6D), suggesting that deletion of UCP2
suppressed mitochondrial fusion. Western blot results showed that ischemia in WT
suppressed Opa1 at 24h and 72h of reperfusion (Fig. 6E-6G). The deletion of UCP2 in
normoglycemic mice led to an early reduction of Opa1 in normoglycemic animals
(Fig. 6E and 6F). Hyperglycemia resulted in a more pronounced decline of Opa1in
WT than in normoglycemic group in all endpoints including non-ischemic control;
however, it did not further decrease Opa1 in UCP2-/- mice. Opa1 level in
hyperglycemic animals was lower than that of the normoglycemic animals as revealed
by two-way ANOVA analysis (p<0.05). The protein level of Mfn2 in the
mitochondrial fraction decreased after cerebral ischemia and reperfusion in
normoglycemic animals (Fig.6E and 6G). Overall, the Opa1 and Mfn2 levels were
intended to be lower in hyperglycemic ischemia than in normoglycemic ischemia and
deletion of UCP2 affected these fusion markers in normoglycemic ischemic mice.
To better distinguish the effects of UCP2 knockout on the dynamic balance of
mitochondrial fission and fusion, we summarized the levels of mitochondrial fission
and fusion markers, calculated the ratio of fission and fusion, and expressed the data
as the mitochondrial fission/fusion index. As shown in Figure 7, the fission/fusion
index began to rise and peaked at 24h in UCP2-/- mice, while mitochondrial
Page 16
fission/fusion index began to rise at 24h and reached its peak at 72h in WT mice
under normoglycemic condition. The finding indicates that in normoglycemic animals,
deletion of UCP2 induced mitochondrial fission/fusion index to reach the peak early
and is significantly higher than the WT group. In the hyperglycemic group,
mitochondrial fission/fusion index began to increase at 6h and peaked at 24h. The
ratio decreased slightly in both WT and UCP2 mice at 72h. Mitochondrial
fission/fusion index in UCP2-/- group was significantly higher than that of the WT
group at 24h of reperfusion. These indicated that deletion of UCP2 increased
mitochondrial fission/fusion index, tuning the mitochondrial dynamic towards fission.
Thus, mitochondrial fission/fusion index was higher in UCP2-/- as compared to WT
animals (Fig. 7).
Double labeling of the above fission and fusion markers with neuronal marker
NeuN (Fig 8A) or astrocyte marker GFAP (Fig 8B) on brain sections 1 day after
reperfusion revealed that Drp1, Fis1, Opa1, and Mfn2 were co-localized with NeuN
positive neurons, but not with GFAP positive astrocytes, suggesting that
mitochondrial fission and fusion occurred majorly in neurons rather than astrocytes.
6. Mitochondrial ultrastructural alterations
To further demarcate the effect of UCP2 on mitochondria, we performed
transmission electron microscope to analyze the mitochondrial ultrastructural changes.
Mitochondrial morphology was normal in both WT and UCP2-/- non-ischemic control
mice. Mild mitochondrial swollen, as reflected by mitochondrial lucency and cristae
disarray, was observed in both normoglycemic and hyperglycemic animals after 6h of
recovery (Fig. 9, red arrows in WT+NG and WT+HG images). In contrast, deletion of
UCP2 resulted in markedly mitochondrial swollen, as reflected by increased
Page 17
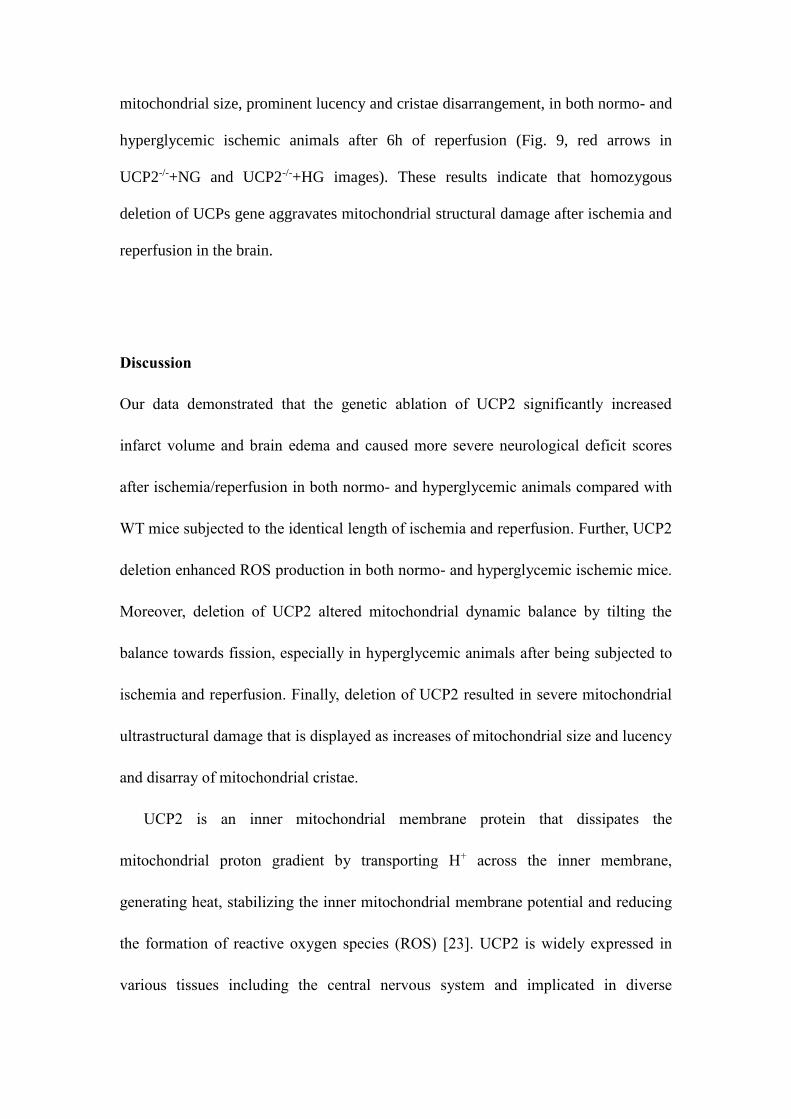
mitochondrial size, prominent lucency and cristae disarrangement, in both normo- and
hyperglycemic ischemic animals after 6h of reperfusion (Fig. 9, red arrows in
UCP2-/-+NG and UCP2-/-+HG images). These results indicate that homozygous
deletion of UCPs gene aggravates mitochondrial structural damage after ischemia and
reperfusion in the brain.
Discussion
Our data demonstrated that the genetic ablation of UCP2 significantly increased
infarct volume and brain edema and caused more severe neurological deficit scores
after ischemia/reperfusion in both normo- and hyperglycemic animals compared with
WT mice subjected to the identical length of ischemia and reperfusion. Further, UCP2
deletion enhanced ROS production in both normo- and hyperglycemic ischemic mice.
Moreover, deletion of UCP2 altered mitochondrial dynamic balance by tilting the
balance towards fission, especially in hyperglycemic animals after being subjected to
ischemia and reperfusion. Finally, deletion of UCP2 resulted in severe mitochondrial
ultrastructural damage that is displayed as increases of mitochondrial size and lucency
and disarray of mitochondrial cristae.
UCP2 is an inner mitochondrial membrane protein that dissipates the
mitochondrial proton gradient by transporting H+ across the inner membrane,
generating heat, stabilizing the inner mitochondrial membrane potential and reducing
the formation of reactive oxygen species (ROS) [23]. UCP2 is widely expressed in
various tissues including the central nervous system and implicated in diverse
Page 18
pathologic conditions such as obesity, diabetes, neurodegenerative diseases,
atherosclerosis, and cancer [24, 25, 26]. Emerging evidence suggests that UCP2 may
play an important role in cerebral stroke by regulating mitochondrial potential and
energy balance, neuroendocrine and autonomic functions, reactive oxygen species
(ROS) production and fatty acid anion transport, cell death, and inflammation [27].
Among the published literature, a majority of studies have demonstrated that
increasing UCP2 is neuroprotective [28]. Upregulation of UCP2 has been reported to
reduce neuronal damage in cerebral stroke, traumatic brain injury, epilepsy and
Parkinson’s models [6, 7, 29, 30]. Our data demonstrated that the genetic ablation of
UCP2 significantly increased infarct volume, brain edema, apoptosis and aggravated
neurological deficit scores after ischemia/reperfusion under normoglycemic condition,
which is consistent with our previous report and those published in the literature [6,
31, 32]. Furthermore, our results for the first time demonstrated that deletion of UCP2
further worsened the ischemic brain damage in hyperglycemic animals comparing to
wildtype animals subjected to hyperglycemic ischemia. These results suggest that
UCP2 plays an important role in cerebral ischemic injury under both normo- and
hyperglycemic conditions.
Reactive oxygen species (ROS) are free radicals that can damage DNA, lipids,
and proteins. Hyperglycemia has been found to lead to oxidative stress and increased
ROS production in neuronal cells [33, 34]. UCP2 reduces the ROS formation by
preventing mitochondrial membrane hyperpolarization that in turn inhibits
mitochondrial electron transport chain. Studies have shown that UCP2 confers
Page 19
protective effects on various stressors by decreasing mitochondrial ROS production in
the brain and liver [35, 36, 37]. It has also been reported that UCP2 could protect
cardiomyocytes from exogenous oxidant stress [38]. In the present study, superoxides
were increased after ischemia in normoglycemic animals and further elevated by
hyperglycemia. Deletion of UCP2 led to exacerbated levels of ROS after ischemia in
both normo- and hyperglycemic animals compared to the counterparts in wildtype
animals. These data imply that the increased damage observed in UCP2-/- mice is
partially due to increases in ROS production.
Recent studies have suggested that impaired mitochondrial dynamics and
excessive mitochondrial fission are connected to several neurodegenerative disorders
such as stroke [39], Parkinson’s diseases [40], and Alzheimer’s diseases [41]. In the
present study, we also found in both immunohistochemistry and Western blotting that
UCP2 deletion caused mitochondrial dynamic imbalance after cerebral ischemic
injury under both normo- and hyperglycemic conditions. The results demonstrated
that ischemia and reperfusion increased the protein levels of fission proteins Fis1 and
Drp1, and decreased fusion proteins Opa1and Mfn2, thereby, tilting the mitochondrial
dynamic balance towards fission. Preischemic hyperglycemia further augmented the
alteration as reflected by the higher levels of Fis1 and Drp1 in hyperglycemic animals
at 6h of reperfusion than those observed in the normoglycemic counterparts,
suggesting that hyperglycemia caused an early onset of mitochondrial fission process
by hyperglycemia. This is consistent with our previous finding that hyperglycemic
ischemia increases mitochondrial dynamic imbalance towards fission [21]. When
Page 20
comparing to wildtype animals, deletion of UCP2 further increased the levels of Fis1
and Drp1 in both normo- and hyperglycemic ischemic animals. Previous study shows
UCP2 in the ventromedial nucleus of the hypothalamus is required for
glucose-induced DRP1-mediated mitochondrial fission [42]. However, the impact of
UCP2 deletion on mitochondrial fission and fusion balance after cerebral ischemia
has not been reported before. A recent study using acute kidney ischemia and
reperfusion model demonstrated that UCP knockout mice had pronounced
mitochondrial dynamic imbalance towards fission and mitochondrial fragmentation;
whereas upregulation of UCP2 ameliorated hypoxia-induced mitochondrial fusion and
fission imbalance [43]. The immunoreactivity of Opa1 was not changed after
ischemia in both normo- and hyperglycemic animals after ischemia and reperfusion
up to 72h. That of the Mfn2 decreased in both normo- and hyperglycemic animals
with no significant difference between the two glycemic conditions. In contrast,
deletion of UCP2 significantly decreased the immunoreactivity of Opa1 and Mfn2 in
both normo- and hyperglycemic ischemic animals, suggesting deletion of UCP2
inhibited mitochondrial fusion. Semi-quantitative measurements of Opa1 and Mfn2
by protein blotting revealed marked decreases of these two fusion proteins after
ischemia in normoglycemic animals and the decreases were more pronounced in
hyperglycemic ischemic animals than in normoglycemic animals, suggesting
hyperglycemia inhibited mitochondrial fusion. Deletion of UCP2 further decreased
the levels of Opa1 and Mfn2 and the decreases were more obvious in normoglycemic
than hyperglycemic animals. The discrepant result of Opa1 between
Page 21
immunohistochemistry and Western blotting may ascribe to the fact that IHC detects
the target proteins in specific areas, while ischemic lateral brain was used in Western
blotting, which more accurately reflects the changes of fusion protein levels.
Because the general tendency was that ischemia increased fission and decreased
fusion proteins, that hyperglycemia further aggravated these alterations, and that
UCP2 deletion made the changes even more obvious than in wildtype counterpart
animals, we decided to calculate mitochondrial fission/fusion index, which is the ratio
of fission proteins divided by fusion proteins. The results clearly demonstrated that
ischemia in normoglycemic animals induced mitochondrial fission and hyperglycemia
induced a more dramatic increase. These results are further supported by previous
publications showing that hyperglycemia causes mitochondrial fission [44, 45].
Deletion of UCP2 further increased the fission/fusion index in both normo-and
hyperglycemic animals. These data suggest that hyperglycemic ischemia enhances
mitochondrial fission after cerebral ischemia and reperfusion and UCP2 deletion
further increases mitochondrial dynamic imbalance under both normo- and
hyperglycemic conditions. The slanting of the mitochondrial dynamics to fission may
reduce the mitochondrial network and enhance mitochondrial rupture and induce
neuronal cell death after cerebral ischemia [46]. UCP2 silencing has been shown to
cause mitochondrial dysfunction in astrocytes under septic conditions [47]. However,
it is not known whether UCP2 deletion affects the mitochondrial dynamics in
astrocytes. Based on our double immunostaining results, the fission and fusion protein
markers were co-localized with neuronal marker NeuN, but not with astrocytes. This
Page 22
indicated that UCP2 deficiency mainly affects mitochondrial division and fusion
balance in neurons.
Mitochondrial dynamic imbalance could result in mitochondrial morphological
alterations [48]. Observation of the mitochondrial ultrastructure using an electron
microscope found mild to moderately swollen mitochondria with increased lucency
and cristae disarrangement in both normo- and hyperglycemic animals as early as 6 h
of reperfusion after 1 h of ischemia. In UCP2-/- mice, mitochondrial sizes increased
significantly due to swelling. Pronounced lucency and disarray and disappearance of
mitochondrial cristae were observed, suggesting that UCP2 deletion increases
mitochondrial morphological damage caused by cerebral ischemia in both normo- and
hyperglycemic animals. We have previously shown that hyperglycemia aggravates
ischemic brain damage [49, 50]. This effect is associated with increases of
mitochondrial fission and mitochondrial morphological alterations [21, 33, 51]. In this
study, we observed mild mitochondrial damage including lucency and disarray of
cristae in both normo- and hyperglycemic animals at 6 h of reperfusion. UCP2
knockout further aggravated the mitochondrial damage in both normo- and
hyperglycemic mice after ischemia and reperfusion. Therefore, mitochondrial size
was further enlarged and mitochondrial lucency and vacuolization were more
prominent than those being observed in wildtype mice. The impact of UCP2 on
mitochondrial morphology of the brain tissue after cerebral ischemia and reperfusion
has not been reported. Several studies have demonstrated that silencing UCP2 by
small interference RNA resulted in more severe mitochondrial swelling, vacuolization
Page 23
and loss of matrix content in cardiomyocytic H9C2 cells and astrocytes compared
with control cells challenged with sepsis [47, 52, 53]. These results support our
finding that UCP2 plays an important role in maintaining mitochondrial dynamic and
morphological integrity in the brain.
Collectively, deletion of UCP2 has an adverse impact on cerebral
ischemia-reperfusion injury under both normo- and hyperglycemic conditions.
Deletion of UCP2 increases ROS production, mitochondrial fission and
morphological abnormalities. These findings may pave the way to new treatment
modalities, which are needed for the treatment of brain I/R injury.
Acknowledgements
The authors greatly appreciate Ms. Roslyn Lewis for language checking and proof
reading. This study was supported by the Natural Science Foundation of Ningxia Hui
Autonomous Region (2019AAC03212) to Maotao He,the Ningxia Medical
University Research Fund (XM2016028) to Maotao He and the National Science
Foundation of China (No. 81560208) to Li Jing. The funders had no role in study
design, data collection and analysis, decision to publish, or preparation of the
manuscript.
Abbreviations
UCPs: Uncoupling proteins; UCP2: Uncoupling protein 2; UCP2-/-: UCP2 deletion;
I/R: ischemia/reperfusion; MCAO: middle cerebral artery occlusion; WT: wildtype;
Page 24
NG: normoglycemic; HG: hyperglycemic; TUNEL: Terminal deoxynucleotidyl
transferase mediated dUTP nick‑end labeling; ROS: reactive oxygen species; Fis1:
fission 1; Drp1: dynamin-related protein 1; Opa1: optic atrophy 1; Mfn2: mitofusin 2;
STZ: Streptozotocin; TTC: 2,3,5-Triphenyl Tetrazolium Chloride; ICA: internal
carotid artery; ECA: external carotid artery; CCA: common carotid artery; DHE:
Dihydroethidium.
Conflict of Interest
The authors declare that they have no conflict of interest.
Author contributions
P. Andy Li and Li Jing conceived and designed the experiments. Maotao He, Yanmei
Ma and Rui Wang performed the experiments. Maotao He and Jianzhong Zhang
analyzed the data. Maotao He prepared the writing-original draft. P. Andy Li and Li
Jing reviewed and edited the manuscript.
References
1. Toda C, Diano S. Mitochondrial UCP2 in the central regulation of metabolism. Best
Pract Res Clin Endocrinol Metab. 2014; 28(5): 757-764.
2. Lee S, Moon H, Kim G, Cho JH, Lee DH, Ye MB, Park D. Anion transport or
nucleotide binding by UCP2 is indispensable for UCP2-mediated efferocytosis. Mol
Cells. 2015; 38(7): 657.
3. Islam R, Yang L, Sah M, Kannan K, Anamani D, Vijayan C, Fridell YW. A
neuroprotective role of the human uncoupling protein 2 (hUCP2) in a Drosophila
Page 25
Parkinson's disease model. Neurobiol Dis. 2012; 46(1): 137-146.
4. Dutra MRH, Feliciano RDS, Jacinto KR, Gouveia TLF, Brigidio E, Serra AJ, Silva
J. Protective role of UCP2 in oxidative stress and apoptosis during the silent phase of
an experimental model of epilepsy induced by pilocarpine. Oxid Med Cell Longev.
2018; 2018.
5. Bhattacharya R, Singh P, John JJ, Gujar NL. Oxidative damage mediated iNOS and
UCP-2 upregulation in rat brain after sub-acute cyanide exposure: dose and
time-dependent effects. Drug Chem Toxicol. 2019; 42(6): 577-584.
6. Haines BA, Mehta SL, Pratt SM, Warden CH, Li PA. Deletion of mitochondrial
uncoupling protein-2 increases ischemic brain damage after transient focal ischemia
by altering gene expression patterns and enhancing inflammatory cytokines. J Cereb
Blood Flow Metab. 2010; 30(11): 1825-1833.
7. Haines B, Li PA. Overexpression of mitochondrial uncoupling protein 2 inhibits
inflammatory cytokines and activates cell survival factors after cerebral ischemia.
PLoS One. 2012; 7(2): e31739.
8. Chen R, Ovbiagele B, Feng W. Diabetes and stroke: epidemiology, pathophysiology,
pharmaceuticals and outcomes. Am J Med Sci. 2016; 351(4): 380-386.
9. Tun NN, Arunagirinathan G, Munshi SK, Pappachan JM. Diabetes mellitus and
stroke: A clinical update. World J Diabetes. 2017; 15; 8(6):235-248.
10. Shukla V, Shakya AK, Perez-Pinzon MA, Dave K R. Cerebral ischemic damage in
diabetes: an inflammatory perspective. J Neuroinflammation. 2017; 14(1): 1-22.
11. He Q, Csiszar K, Li PA. Transient forebrain ischemia induced phosphorylation of
Page 26
cAMP-responsive element-binding protein is suppressed by hyperglycemia.
Neurobiol Dis. 2003; 12(1): 25-34.
12. Muranyi M, Fujioka M, He Q, Han A, Yong G, Csiszar K, Li PA. Diabetes
activates cell death pathway after transient focal cerebral ischemia. Diabetes. 2003;
52(2): 481-486.
13. Liu P, Yang X, Hei C, Meli Y, Niu J, Sun T, Li PA. Rapamycin reduced ischemic
brain damage in diabetic animals is associated with suppressions of mTOR and
ERK1/2 signaling. Int J Biol Sci. 2016; 12(8): 1032.
14. Hei C, Liu P, Yang X, Niu J, Li PA. Inhibition of mTOR signaling confers
protection against cerebral ischemic injury in acute hyperglycemic rats. Int J Biol Sci.
2017; 13(7): 878.
15. Yang X, Hei C, Liu P, Li PA. Involvement of obesity-associated upregulation of
chemerin/chemokine-like receptor 1 in oxidative stress and apoptosis in ovaries and
granulosa cells. Biochem Biophys Res Commun. 2019; 510(3): 449-455.
16. Chen H, Chan DC. Mitochondrial dynamics–fusion, fission, movement, and
mitophagy–in neurodegenerative diseases. Hum Mol Genet. 2009; 18(R2):
R169-R176.
17. Peng C, Rao W, Zhang L, Wang K, Hui H, Wang L, Su N, Luo P, Hao YL, Tu Y,
Zhang S, Fei Z. Mitofusin 2 ameliorates hypoxia-induced apoptosis via mitochondrial
function and signaling pathways. Int J Biochem Cell Biol. 2015; 69: 29-40.
18. Barsoum, MJ, Yuan H, Gerencser A A, Liot G, Kushnareva Y, Gräber S, White AD.
Nitric oxide‐induced mitochondrial fission is regulated by dynamin‐related GTPases
Page 27
in neurons. EMBO J. 2006; 25(16): 3900-3911.
19. Liu W, Tian F, Kurata T, Morimoto N, Abe K. Dynamic changes of mitochondrial
fusion and fission proteins after transient cerebral ischemia in mice. J Neurosci Res.
2012; 90(6): 1183-1189.
20. Martorell‐Riera A, Segarra‐Mondejar M, Muñoz JP, Ginet V, Olloquequi J, Pérez‐
Clausell J, Soriano FX. Mfn2 downregulation in excitotoxicity causes mitochondrial
dysfunction and delayed neuronal death. EMBO J. 2014; 33(20): 2388-2407.
21. Kumari S, Anderson L, Farmer S, Mehta SL, Li PA. Hyperglycemia alters
mitochondrial fission and fusion proteins in mice subjected to cerebral ischemia and
reperfusion. Transl Stroke Res. 2012; 3(2): 296-304.
22. Li PA, Shamloo M, Katsura KI, Smith ML, Siesjö BK. Critical values for plasma
glucose in aggravating ischaemic brain damage: correlation to extracellular pH.
Neurobiol Dis. 1995; 2(2): 97-108.
23. Ji F, Shen T, Zou W, Jiao J. UCP2 Regulates Embryonic Neurogenesis via ROS‐
Mediated Yap Alternation in the Developing Neocortex. Stem Cells. 2017; 35(6):
1479-1492.
24. Donadelli M, Dando I, Dalla Pozza E, Palmieri M. Mitochondrial uncoupling
protein 2 and pancreatic cancer: a new potential target therapy. World J Gastroenterol.
2015; 21;21(11):3232-8.
25. Li J, Jiang R, Cong X, Zhao Y. UCP 2 gene polymorphisms in obesity and
diabetes, and the role of UCP 2 in cancer. FEBS letters. 2019; 593(18): 2525-2534.
26. Sreedhar A, Zhao Y. Uncoupling protein 2 and metabolic diseases. Mitochondrion.
Page 28
2017; 34: 135-140.
27. Duffy CM, Xu H, Nixon JP, Bernlohr DA, Butterick TA. Identification of a fatty
acid binding protein4-UCP2 axis regulating microglial mediated neuroinflammation.
Mol Cell Neurosci. 2017; 80: 52-57.
28. Mehta SL, Li PA. Neuroprotective role of mitochondrial uncoupling protein 2 in
cerebral stroke. J Cereb Blood Flow Metab. 2009; 29(6): 1069-1078.
29. Normoyle KP, Kim M, Farahvar A, Llano D, Jackson K, Wang H. The emerging
neuroprotective role of mitochondrial uncoupling protein-2 in traumatic brain injury.
Transl Neurosci. 2015; 6(1).
30. Kishimoto Y, Johnson J, Fang W, Halpern J, Marosi K, Liu D, Geisler JG, Mattson
MP. A mitochondrial uncoupler prodrug protects dopaminergic neurons and improves
functional outcome in a mouse model of Parkinson’s disease. Neurobiol Aging. 2020;
85: 123-130.
31. Mattiasson G, Shamloo M, Gido G, Mathi K, Tomasevic G, Yi S, Nikolich K.
Uncoupling protein-2 prevents neuronal death and diminishes brain dysfunction after
stroke and brain trauma. Nat Med. 2003; 9(8): 1062-1068.
32. Deierborg T, Wieloch T, Diano S, Warden CH, Horvath TL, Mattiasson G.
Overexpression of UCP2 protects thalamic neurons following global ischemia in the
mouse. J Cereb Blood Flow Metab. 2008; 28(6): 1186-1195.
33. Muranyi M, Ding C, He Q, Lin Y, Li PA. Streptozotocin-induced diabetes causes
astrocyte death after ischemia and reperfusion injury. Diabetes. 2006; 55(2): 349-355.
34. Kaeidi A, Hajializadeh Z, Jahandari F, Fatemi I. Leptin attenuates oxidative stress
Page 29
and neuronal apoptosis in hyperglycemic condition. Fundam Clin Pharmacol. 2019;
33(1): 75-83.
35. Streck EL, Gonçalves CL, Furlanetto CB, Scaini G, Dal-Pizzol F, Quevedo J.
Mitochondria and the central nervous system: searching for a pathophysiological basis
of psychiatric disorders. Braz J Psychiatry. 2014; 36(2): 156-167.
36. Hass DT, Barnstable CJ. Uncoupling protein 2 in the glial response to stress:
implications for neuroprotection. Neural Regen Res. 2016; 11(8): 1197.
37. Zhong H, Liu M, Ji Y, Ma M, Chen K, Liang T, Liu C. Genipin reverses
HFD-induced liver damage and inhibits UCP2-mediated pyroptosis in mice. Cell
Physiol Biochem. 2018; 49(5): 1885-1897.
38. Wu H, Ye M, Liu D, Yang J, Ding JW, Zhang J, Yang J. UCP2 protect the heart
from myocardial ischemia/reperfusion injury via induction of mitochondrial
autophagy. J Cell Biochem. 2019; 120(9): 15455-15466.
39. Yang JL, Mukda S, Chen SD. Diverse roles of mitochondria in ischemic stroke.
Redox Biol. 2018; 16: 263-275.
40. Von Stockum S, Nardin A, Schrepfer E, Ziviani E. Mitochondrial dynamics and
mitophagy in Parkinson's disease: A fly point of view. Neurobiol Dis. 2016; 90:
58-67.
41. Hroudová J, Singh N, Fišar Z. Mitochondrial dysfunctions in neurodegenerative
diseases: relevance to Alzheimer’s disease. Biomed Res Int. 2014; 2014.
42. Toda C, Kim JD, Impellizzeri D, Cuzzocrea S, Liu ZW, Diano S. UCP2 regulates
mitochondrial fission and ventromedial nucleus control of glucose responsiveness.
Page 30
Cell. 2016; 164(5): 872-883.
43. Qin N, Cai T, Ke Q, Yuan Q, Luo J, Mao X, Zhou Y. UCP2‐dependent
improvement of mitochondrial dynamics protects against acute kidney injury. J
pathology. 2019; 247(3): 392-405.
44. Kumari S, Mehta SL, Li PA. Glutamate induces mitochondrial dynamic imbalance
and autophagy activation: preventive effects of selenium. PloS one. 2012; 7(6):
e39382.
45. Klacanova K, Kovalska M, Chomova M, Pilchova I, Tatarkova Z, Kaplan P,
Racay P. Global brain ischemia in rats is associated with mitochondrial release and
downregulation of Mfn2 in the cerebral cortex, but not the hippocampus. Int J Mol
Med. 2019; 43(6): 2420-2428.
46. Friedman J R, Nunnari J. Mitochondrial form and function. Nature. 2014;
505(7483): 335-343.
47. Peng W, Huang J, Zheng Y, Ding Y, Li S, Zhang J, Lyu J, Zeng Q. UCP2 silencing
aggravates mitochondrial dysfunction in astrocytes under septic conditions. Mol Med
Rep. 2019; 20: 4459-4466.
48. Saita S, Ishihara T, Maeda M, Iemura SI, Natsume T, Mihara K, Ishihara N.
Distinct types of protease systems are involved in homeostasis regulation of
mitochondrial morphology via balanced fusion and fission. Genes Cells. 2016; 21(5):
408-424.
49. Liu, WJ, Jiang HF, Rehman FU, Zhang JW, Chang Y, Jing L, Zhang JZ. Lycium
barbarum polysaccharides decrease hyperglycemia-aggravated ischemic brain injury
Page 31
through maintaining mitochondrial fission and fusion balance. J Biol Med Sci. 2017;
13(7): 901.
50. Lu CJ, Guo YZ, Zhang Y, Yang L, Chang Y, Zhang JW, Zhang JZ. Coenzyme Q10
ameliorates cerebral ischemia reperfusion injury in hyperglycemic rats. Pathol Res
Pract. 2017; 213(9): 1191-1199.
51. Ding C, He QP, Li PA. Activation of cell death pathway after a brief period of
global ischemia in diabetic and non-diabetic animals. Exp Neurol. 2004; 188(2):
421-429.
52. Zheng G, Lyu J, Liu S, Huang J, Liu C, Xiang D, Zeng Q. Silencing of uncoupling
protein 2 by small interfering RNA aggravates mitochondrial dysfunction in
cardiomyocytes under septic conditions. Int J Mol Med. 2015; 35(6): 1525-1536.
53. Huang J, Peng W, Zheng Y, Hao H, Li S, Yao Y, Zeng Q. Upregulation of UCP2
Expression Protects against LPS-Induced Oxidative Stress and Apoptosis in
Cardiomyocytes. Oxid Med Cell Longev. 2019; 2019.
Page 32
Figure legends
Figure 1. Effect of UCP2 deletion on the onset of high glucose in different mice.
(A) This diagram illustrated the experimental design. (B) Cerebral vasculature. Mice
(n = 3, each group) were perfused with Indian black ink to determine whether there
were vascular abnormalities in the UCP2-/- mice. The Circle of Willis, anterior
cerebral arteries, middle cerebral arteries, and posterior arteries all appear normal as
compared with those in WT controls. (C) Blood glucose level. The blood glucose was
obviously higher in the STZ induced diabetic mice than those in control group
(p<0.01). There was no significant in WT mice and UCP2-/- mice (n = 54, each group).
(D) Body weight. There was no significant different between initial and preoperative
weight in different groups (n = 54, each group). (E) Body temperature. There was no
significant among preoperative temperature, intraoperative temperature and
postoperative (n = 54, each group).
Figure 2. UCP2 deletion aggravated ischemic brain damage in hyperglycemic
mice. (A) Representative TTC stained brain sections showing infarct volume (white
color) at 24-h of reperfusion following 60min of MCAO in WT and UCP2-/- mice.
There were 4 animals for WT each group and 5 animals for UCP2-/- each group. (B)
Bar graph summarizes the mean values of cerebral infarction in WT and UCP2-/- mice.
Infarct volume enlarged significantly in UCP2-/- mice with high glucose (n = 4 in each
WT group; n = 4 in each UCP2-/- group). #p<0.05 vs. NG; *p<0.05 vs. WT. (C)
Assessments of neurological deficits (n=20 in each group). #p<0.05 vs. NG; *p<0.05
vs. WT. (D) Quantitative analysis of edema volume. There were 4 animals for WT
each group and 5 animals for UCP2-/- each group.. #p<0.05 vs. NG; *p<0.05 vs. WT,
respectively.
Page 33
Figure 3. UCP2 deletion aggravated ischemia/reperfusion induced histopathological
changes and apoptotic in hyperglycemic mice. (A) HE staining. (B) Quantitative
summary of pyknotic cells. (C) Nissl staining. (D) The average optical density of each
group of Nissl bodies. (E) Apoptosis was determined via TUNEL test. (F) the number
of TUNEL positive cells (n=6 mice, each group). p<0.05 vs. sham group; *p<0.05 vs.
WT group; #p<0.05 vs. NG group, respectively.
Figure 4. UCP2 deletion enhanced ROS production in hyperglycemic mice. (A)
ROS production detected by DHE in WT and UCP2-/- mice. Nuclei were labeled with
DAPI. Magnification, 400X. Scale bar= 50 μm. (B) summarized DHE fluorescent
intensity. n=4 mice per group. Data are presented as means ± SD. *p < 0.001 vs. WT
group in same glucose and #p < 0.05 vs. NG group in some type of animal.
Figure 5. UCP2 deletion increased the levels of mitochondrial fission-related
proteins in hyperglycemic mice after ischemia/reperfusion. Detections of
mitochondrial fission-related proteins by immunohistochemistry and Western blotting
(n=6, per group). (A, B) Representative photomicrographs for Fis1 and Drp1. Scale
bar=50 μm. (C, D) Quantification of Fis1 and Drp1 immunointensity. E:
Representative Western blots for Fis1 and Drp1. (F, G) Semi-quantification of Fis1
and Drp1 protein bands. Data are shown as mean ± SD. For values in F and G, the
values in WT+NG sham group were converted to 100 and percent changes were
presented for other groups relative to the WT+NG sham. p<0.05 vs. respective
sham-operated controls, #p<0.05 vs. normoglycemic and *p<0.05 vs. WT counterpart
at an identical reperfusion stage.
Figure 6. UCP2 deletion increased the levels of mitochondrial fusion-related
proteins in hyperglycemic mice after ischemia/reperfusion. Detections of
Page 34
mitochondrial fusion-related proteins by immunohistochemistry and Western blotting.
(A, B) Representative photomicrographs for Mfn2 and OPA1. Scale bar=50 μm. (C,
D) Quantification of Mfn2 and OPA1 immunointensity. E: Representative Western
blots for Mfn2 and OPA1. (F, G) Semi-quantification of Mfn2 and OPA1 protein
bands. n=6 mice per group. Data are shown as mean ± SD. For values in F and G, the
values in WT+NG sham group were converted to 100 and percent changes were
presented for other groups relative to the WT+NG sham. p<0.05 vs. respective
sham-operated controls, #p<0.05 vs. normoglycemic and *p<0.05 vs. WT counterpart
at an identical reperfusion stage.
Figure 7. Mitochondrial fission/fusion index following cerebral ischemia and
reperfusion under both normo- and hyperglycemic conditions. Index represents
the ratio of fission (Drp1 and Fis1) and fusion (Opa1 and Mfn2) proteins. Data are
expressed as means ± SD. △p<0.05, vs. respective sham-operated controls, #p<0.05
vs. normoglycemic and *p<0.05 vs. WT counterpart at an identical reperfusion stage.
Figure 8. Mitochondrial fusion-related proteins (Opa1 and Mfn2) and
fission-related proteins (Drp1, Fis1) co-localized with neurons in UCP2-/- mice
following ischemic stroke. Double immunostaining of Drp1, Fis1, Opa1 and Mfn2
with GFAP (astrocyte marker) and NeuN (neuron marker) were performed in UCP2-/-
mice brain sections 1 day after reperfusion (n=6, each group). Scale bar =25 μm.
Figure 9. Mitochondrial ultrastructural alterations. Representative transmission
electron microscope of neuron form cortical area of the brains in UCP2-/- and WT
mice after 6h of reperfusion (n=4, each group). Arrow indicates varying
mitochondrial size whereas arrowhead shows mitochondrial swelling and disarrayed
cristae. Scale bar =1 μm.
Page 35
Table 1 Summary of group and subgroups
Groups Processing TTC Histo WB TEM
WT
NG
Sham Sham-operated 4 10 4 4
6h I/R MCAO + reperfusion 6h 0 6 6 4
24h I/R MCAO + reperfusion 24h 4 10 6 0
72h I/R MCAO + reperfusion 72h 0 6 6 0
HG
Sham Sham-operated 0 10 4 4
6h I/R MCAO + reperfusion 6h 0 6 6 4
24h I/R MCAO + reperfusion 24h 4 10 6 0
72h I/R MCAO + reperfusion 72h 0 6 6 0
UCP2-/-
NG
Sham Sham-operated 5 10 4 4
6h I/R MCAO + reperfusion 6h 0 6 6 4
24h I/R MCAO + reperfusion 24h 5 10 6 0
72h I/R MCAO + reperfusion 72h 0 6 6 0
HG
Sham Sham-operated 0 10 4 4
6h I/R MCAO + reperfusion 6h 0 6 6 4
24h I/R MCAO + reperfusion 24h 5 10 6 0
72h I/R MCAO + reperfusion 72h 0 6 6 0
WT: Wildtype mice; UCP2-/-: knock out UCP2 mice; NG: normoglycemia; HG:
hyperglycemia; 6h I/R, 24h I/R and 72h I/R: MCAO and reperfusion 6h, 24h, and 72h.
MCAO: middle cerebral artery occlusion; TTC: 2,3,5-triphenyltetrazolium chloride;
Histo: histology; WB: Western blot; TEM: transmission electron microscopy.
Page 42
Figure 7
Figure 8