Delft University of Technology Ensemble EMD-based automatic extraction of the catenary structure wavelength from the pantograph-catenary contact corce Liu, Zhigang; Wang, Hongrui; Dollevoet, Rolf; Yang, Song; Nunez, Alfredo; Zhang, Jingyu DOI 10.1109/TIM.2016.2579360 Publication date 2016 Document Version Accepted author manuscript Published in IEEE Transactions on Instrumentation and Measurement Citation (APA) Liu, Z., Wang, H., Dollevoet, R., Yang, S., Nunez Vicencio, A., & Zhang, J. (2016). Ensemble EMD-based automatic extraction of the catenary structure wavelength from the pantograph-catenary contact corce. IEEE Transactions on Instrumentation and Measurement, 65(10), 2272-2283. https://doi.org/10.1109/TIM.2016.2579360 Important note To cite this publication, please use the final published version (if applicable). Please check the document version above. Copyright Other than for strictly personal use, it is not permitted to download, forward or distribute the text or part of it, without the consent of the author(s) and/or copyright holder(s), unless the work is under an open content license such as Creative Commons. Takedown policy Please contact us and provide details if you believe this document breaches copyrights. We will remove access to the work immediately and investigate your claim. This work is downloaded from Delft University of Technology. For technical reasons the number of authors shown on this cover page is limited to a maximum of 10.
Transcript
Delft University of Technology
Ensemble EMD-based automatic extraction of the catenary structure wavelength from thepantograph-catenary contact corce
DOI10.1109/TIM.2016.2579360Publication date2016Document VersionAccepted author manuscriptPublished inIEEE Transactions on Instrumentation and Measurement
Citation (APA)Liu, Z., Wang, H., Dollevoet, R., Yang, S., Nunez Vicencio, A., & Zhang, J. (2016). Ensemble EMD-basedautomatic extraction of the catenary structure wavelength from the pantograph-catenary contact corce.IEEE Transactions on Instrumentation and Measurement, 65(10), 2272-2283.https://doi.org/10.1109/TIM.2016.2579360Important noteTo cite this publication, please use the final published version (if applicable).Please check the document version above.
CopyrightOther than for strictly personal use, it is not permitted to download, forward or distribute the text or part of it, without the consentof the author(s) and/or copyright holder(s), unless the work is under an open content license such as Creative Commons.
Takedown policyPlease contact us and provide details if you believe this document breaches copyrights.We will remove access to the work immediately and investigate your claim.
This work is downloaded from Delft University of Technology.For technical reasons the number of authors shown on this cover page is limited to a maximum of 10.
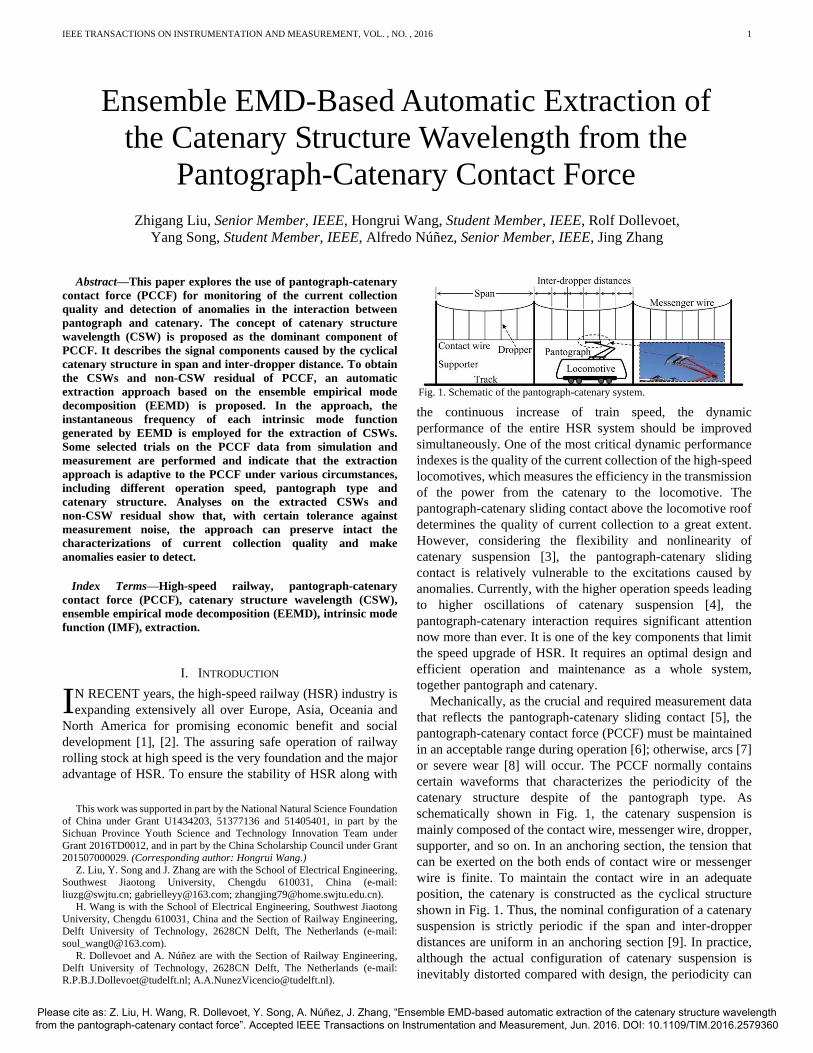
Fig. 1. Schematic of the pantograph-catenary system.
Please cite as: Z. Liu, H. Wang, R. Dollevoet, Y. Song, A. Núñez, J. Zhang, “Ensemble EMD-based automatic extraction of the catenary structure wavelength from the pantograph-catenary contact force”. Accepted IEEE Transactions on Instrumentation and Measurement, Jun. 2016. DOI: 10.1109/TIM.2016.2579360
IEEE TRANSACTIONS ON INSTRUMENTATION AND MEASUREMENT, VOL. , NO. , 2016
2
still be generally remained.
Consequently, in previous studies concerning
pantograph-catenary interaction, the periodicity of catenary
structure can be constantly identified in the PCCF signals from
either simulation results or real-life measurements. In order to
investigate the frequency-domain characteristics of PCCF, the
Fourier transform and the power spectrum density are
frequently adopted [10]-[15]. As a result, the frequency
components that characterize the span and inter-dropper
distance can be observed from the frequency domain of PCCF.
Thus, in this paper, the term Catenary Structure Wavelength
(CSW) is proposed to represent all the signal components
caused by the cyclical structure of the soft catenary.
To the best of our knowledge, the CSWs inevitably exist in
PCCF as long as the soft catenary suspension is adopted for the
purpose of power transmission in HSR. In fact, due to the
variation of contact wire elasticity along the catenary, the
CSWs generally occupy a large proportion of energy in PCCF,
which makes other signal components that may be caused by
anomalies such as contact wire irregularity [14], contact strip
wear [16], environmental perturbation [17], etc. almost
unobservable. Therefore, the extraction of the CSWs in PCCF
can be useful in the following two aspects:
1) The obtained CSWs are the dominant signal components
in PCCF, which can reveal the overall trend and fluctuation of
PCCF. Also, the CSWs are highly sensitive to the positional
deviations occurred in catenary structure. Thus, the CSWs can
be used to evaluate the overall quality of pantograph-catenary
interaction.
2) With the elimination of CSWs, the residual is the PCCF
containing the signal components that are caused by all other
factors except for the catenary structure. In the residual, all the
anomalies that may exist in the pantograph and catenary or
occur in the pantograph-catenary interaction will be contained.
Therefore, this paper aims to develop a generic filtering
approach to extract the CSWs in PCCF. Considering the variety
of catenary structure, pantograph type, measuring method and
measurement condition in different areas and scenarios, the
extraction should be adaptive to any PCCF measurement data.
The required prior information are simply the ranges of span
and inter-dropper distance in the measured catenary structure,
which can also be substituted by the commonly designed ranges
of the two distances. Regarding to the extraction of specific
frequency components in a multicomponent signal, the
well-known Fourier transform [18] and wavelet transform [19]
are potential candidates. However, the major frequency
components of PCCF shift as the catenary structures are diverse
for different railway lines. Even for the same railway line, the
catenary structure is not absolutely uniform and consistent
along the entire line. If the Fourier transform or wavelet
transform were adopted in this case, the major frequency
components need to be identified prior to the decomposition of
PCCF, which is difficult to implement when dealing with signal
segments from a large dataset and sometimes with unavailable
measurement condition. Addressing this issue, with the
invention of empirical mode decomposition (EMD) [20], the
self-adaptive decomposition of multicomponent signal
provides a more suitable way for the purpose of CSW
extraction. Theoretically, EMD can decompose a PCCF signal
into several intrinsic mode functions (IMFs), which
automatically sifts out the major frequency components in the
signal, regardless of the various sources of PCCF. That is to say,
the generated IMF itself might be the exact CSW if the EMD is
properly performed on the PCCF signal. In this case, using the
enhanced EMD, i.e. the ensemble EMD (EEMD) [21], the
CSW extraction is automatically realized as an extension for
the convenience of anomaly detection in PCCF analysis [22]. It
can filter out the CSWs in PCCF and facilitates further
developments in the efficient design of maintenance strategies
for the pantograph-catenary system.
The rest of the paper is organized as follows. A theoretical
description of the CSW is given in detail in Section II. The
automatic extraction approach for the CSWs is proposed and
illustrated in Section III. Section IV presents some validations
and possible applications with the results from the extraction
approach. The conclusions are drawn and some future
developments are suggested in Section V.
II. THE CONCEPT OF CSW
Given a proper height of contact wire and initial force acting
on the contact wire from a pantograph, the pantograph-catenary
system can be functional during a long-distance and high-speed
(a)
(b)
Fig. 2. (a) Initial configuration of the simple catenary model. (b) The contact
wire elasticity under 100N static force.
Fig. 2. (a) Initial configuration of the simple catenary model and (b)
TABLE I
PARAMETERS OF THE SIMPLE CATENARY MODEL
Type Value Type Value
Span 48m Encumbrance 1.6m
Installation height 5.3m Stagger ±0.2m
Contact
wire
Tension 27kN Total distance 14 spans
Line
density 1.07kg/m
Maximum pre-sag
of contact wire 5‰Span
Tensile
rigidity 106N/m
Number of droppers
per span 5
Messenger
wire
Tension 21kN Element length 0.125m
Line
density 1.07kg/m
Dropper
Line
density 0.14kg/m
Tensile
rigidity 106N/m
Tensile
rigidity 105N/m
Inter-dropper distances
in a span 5m/9.5m/9.5m/9.5m/9.5m/5m
Please cite as: Z. Liu, H. Wang, R. Dollevoet, Y. Song, A. Núñez, J. Zhang, “Ensemble EMD-based automatic extraction of the catenary structure wavelength from the pantograph-catenary contact force”. Accepted IEEE Transactions on Instrumentation and Measurement, Jun. 2016. DOI: 10.1109/TIM.2016.2579360
IEEE TRANSACTIONS ON INSTRUMENTATION AND MEASUREMENT, VOL. , NO. , 2016
3
operation. The sliding contact between the contact wire and the
pantograph is maintained through the PCCF. To introduce the
concept of CSW to PCCF, a brief demonstration of the CSWs is
given below by adopting the catenary modelling approach
proposed in [3], which is previously verified according to the
European Standard EN 50318 [23] and the recent
pantograph-catenary simulation benchmark summarized in
[24].
The ideal configuration of a simple catenary model, which
adopts the actual structure parameters of the Beijing-Tianjin
HSR line in China given in Table I, is shown in Fig. 2(a). As
expected, the periodicity of catenary structure can be observed.
Since the pantograph-catenary sliding contact is partly
depending on the geometric configuration of catenary, the
PCCF should have a correlation with the static contact wire
height especially under high speed [15]. From another
perspective, by applying a static vertical force on each point of
the contact wire, the elasticity of the contact wire can be
calculated as the ratio of the force vs. the vertical displacement
of the contact point. As a result, the contact wire elasticity of
the catenary model is obtained and depicted in Fig. 2(b). It can
be concluded that, not only the geometry of the catenary, but
also the response of the contact wire under the action of static
force shows certain periodicity in spans and inter-dropper
distances.
Combing the catenary model with the three-level lumped
mass model of pantograph depicted in Fig.3, which contains
three lumped masses 1m , 2m and 3m representing the head,
frame and bottom of the pantograph respectively, and three
spring-damper elements between adjacent masses and 3m and
the ground, the PCCF can be computed using the frequently
adopted penalty function method as follows.
( ) ( ( ) ( )) ( ) ( )
( ) 0 ( ) ( )c p c p c
p c
F k K u k u k u k u k
F k u k u k
(1)
where ( )F k is the PCCF at the k th sampling point, ( )pu k
and ( )cu k are the vertical position of pantograph and contact
wire at the sampling point, respectively, and cK is the contact
stiffness between pantograph and catenary, which is 82300N/m
for this model. It can be seen that the PCCF is proportional to
the penetration depth that is calculated partly based on the
contact wire height. During an ideal operation with no contact
loss, the PCCF at each sampling point is depending on the
periodic variation of contact wire height, where the periodicity
is introduced to the PCCF directly.
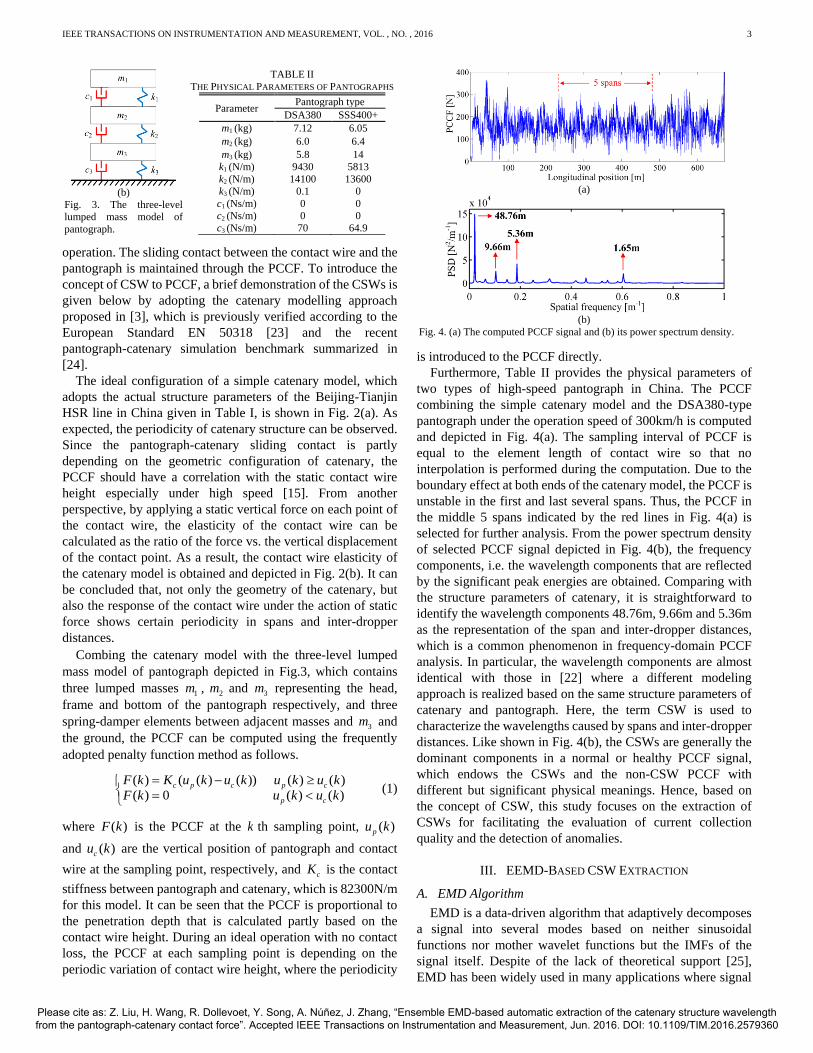
Furthermore, Table II provides the physical parameters of
two types of high-speed pantograph in China. The PCCF
combining the simple catenary model and the DSA380-type
pantograph under the operation speed of 300km/h is computed
and depicted in Fig. 4(a). The sampling interval of PCCF is
equal to the element length of contact wire so that no
interpolation is performed during the computation. Due to the
boundary effect at both ends of the catenary model, the PCCF is
unstable in the first and last several spans. Thus, the PCCF in
the middle 5 spans indicated by the red lines in Fig. 4(a) is
selected for further analysis. From the power spectrum density
of selected PCCF signal depicted in Fig. 4(b), the frequency
components, i.e. the wavelength components that are reflected
by the significant peak energies are obtained. Comparing with
the structure parameters of catenary, it is straightforward to
identify the wavelength components 48.76m, 9.66m and 5.36m
as the representation of the span and inter-dropper distances,
which is a common phenomenon in frequency-domain PCCF
analysis. In particular, the wavelength components are almost
identical with those in [22] where a different modeling
approach is realized based on the same structure parameters of
catenary and pantograph. Here, the term CSW is used to
characterize the wavelengths caused by spans and inter-dropper
distances. Like shown in Fig. 4(b), the CSWs are generally the
dominant components in a normal or healthy PCCF signal,
which endows the CSWs and the non-CSW PCCF with
different but significant physical meanings. Hence, based on
the concept of CSW, this study focuses on the extraction of
CSWs for facilitating the evaluation of current collection
quality and the detection of anomalies.
III. EEMD-BASED CSW EXTRACTION
A. EMD Algorithm
EMD is a data-driven algorithm that adaptively decomposes
a signal into several modes based on neither sinusoidal
functions nor mother wavelet functions but the IMFs of the
signal itself. Despite of the lack of theoretical support [25],
EMD has been widely used in many applications where signal
(b)
Fig. 3. The three-level
lumped mass model of
pantograph.
(a)
(b)
Fig. 4. (a) The computed PCCF signal and (b) its power spectrum density.
TABLE II
THE PHYSICAL PARAMETERS OF PANTOGRAPHS
Parameter Pantograph type
DSA380 SSS400+
m1 (kg) 7.12 6.05
m2 (kg) 6.0 6.4
m3 (kg) 5.8 14
k1 (N/m) 9430 5813
k2 (N/m) 14100 13600
k3 (N/m) 0.1 0
c1 (Ns/m) 0 0
c2 (Ns/m) 0 0
c3 (Ns/m) 70 64.9
Please cite as: Z. Liu, H. Wang, R. Dollevoet, Y. Song, A. Núñez, J. Zhang, “Ensemble EMD-based automatic extraction of the catenary structure wavelength from the pantograph-catenary contact force”. Accepted IEEE Transactions on Instrumentation and Measurement, Jun. 2016. DOI: 10.1109/TIM.2016.2579360
IEEE TRANSACTIONS ON INSTRUMENTATION AND MEASUREMENT, VOL. , NO. , 2016
4
decomposition is needed [26]-[29]. In some previous studies
[30], [31], it is specifically adopted to eliminate the useless or
noisy components of a signal. However, the extraction
approach in this paper considers both the CSWs and the
non-CSW PCCF useful components.
In brief, EMD decomposes a given signal ( )x t into a
number N of IMFs ( )jd t , 1,2,...,j N and a residual ( )r t .
The sum of all IMFs and the residual matches the original
signal perfectly as follows.
1
( ) ( ) ( )N
j
i
x t d t r t
(2)
where each IMF ( )jd t is obtained through an iterative sifting
process. For the first IMF 1( )d t , starting with a corresponding
estimated IMF ( )
1 ( )id t where the iteration number 1i and the
estimated IMF (1)
1 ( ) ( )d t x t , the sifting iteration is described
in five steps as follows.
Step 1: Find all the maxima and minima of the signal ( )
1 ( )id t .
Step 2: Connect all the adjacent maxima and minima
respectively using spline interpolation to form an upper
and a lower envelope ( )ue t and ( )le t of signal ( )
1 ( )id t .
Step 3: Compute the mean of upper and lower envelopes
( ) ( ) ( ) / 2m u le t e t e t .
Step 4: Update the estimated IMF ( 1) ( )
1 1( ) ( ) ( )i i
md t d t e t and
the number of iterations 1i i .
Step 5: Repeat Step 1 to Step 4 until a stopping criterion has
been satisfied so that the first IMF ( )
1 1( ) ( )id t d t .
For other IMFs ( )jd t , 1j , the corresponding estimated
IMF ( ) ( )i
jd t for their first sifting in Step 1 should be
1(1)
1
( ) ( ) ( ).j
j k
k
d t x t d t
(3)
The conventional stopping criterion in Step 5 for each IMF at
its i th iteration can be computed by the standard deviation
computed as
( ) ( 1) 2
( 1) 20
| ( ) ( ) |( )
| ( ) |
i iTj j
it j
d t d tSD i
d t
(4)
where is a positive number typically ranges from 0.2 to 0.3
[20] and T is the time duration of signal ( )x t . The last output
of the algorithm is actually the final residual ( )r t that
represents the mean trend of signal ( )x t .
From the algorithm above, it can be speculated that the
number of IMFs N is automatically determined by the signal
itself and the value in stopping criterion. As a result of the
empirical algorithm, the IMFs have proved to be approximately
zero-mean and both amplitude and frequency modulated.
Moreover, due to smoothing effect of iterative sifting, the IMFs
possess lower and lower frequencies as they are produced one
after another. Thus, it is possible for EMD to directly extract the
major frequency components in a multicomponent signal, e. g.
the PCCF.
B. EEMD Algorithm
As groundbreaking as it is, the conventional EMD still has
some shortcomings. In particular, the mode mixing problem
caused by signal intermittency leads to frequency aliasing in the
IMFs, which mixes disparate signal oscillations into IMFs and
impairs the physical meaning of each IMF. However, the
physical meaning of PCCF must be preserved in order to obtain
authentic CSWs. To resolve this problem, EEMD is proposed
based on the dyadic property of EMD when dealing with white
noise [21]. It utilizes additional white noise to ensure the full
physical meaning of IMFs as described in the following four
steps.
Step 1: Add a random white noise series with constant standard
deviation to the signal ( )x t to form a new signal.
Step 2: Perform the EMD on the new signal to get a set of IMFs.
Step 3: Repeat Step 1 and Step 2 for a number M of times.
Step 4: Compute the final IMFs by averaging all the M sets of
IMFs correspondingly.
The added white noises preserve the disparate signal
oscillations during every EMD and automatically cancel each
other through the averaging in Step 4, so that the final IMFs are
not contaminated by the white noises. Note that the final
number of IMFs might be different from EMD result due to the
added white noise, which is close to 2log ( )P with P the
number of total sample points. Comparing with the EMD, two
new parameters are introduced to the EEMD algorithm, namely
the standard deviation of the added white noise and the
number of ensemble members M . Both parameters should be
carefully chosen as they are relevant to the quality of the final
IMFs. Specifically, normally ranges from 0.1 to 0.5 times
the standard deviation of a given signal ( )x t , and M can be
from 10 to 100 depending on the tradeoff between the effect of
white noise cancelation and the requirement of
computational efficiency.
With the extracted IMFs from EMD or EEMD, the
Hilbert-Huang Transform (HHT) is developed based on the
concept of instantaneous frequency, which can provide the
Hilbert spectrum of original signal in an energy-
time-frequency distribution (TFD) [20]. Concretely, the
analytic form of each IMF can be obtained using the Hilbert
transform as follows.
i ( )( ) ( ) i [ ( )] ( )e j t
j j j jz t d t H d t a t
(5)
where [ ( )]jH d t denotes the Hilbert transform of the j th IMF
( )jd t and
2 2( ) ( ) [ ( )]
.[ ( )]( ) arctan
( )
j j j
j
j
j
a t d t H d t
H d tt
d t
= (6)
The instantaneous frequency is defined as
Please cite as: Z. Liu, H. Wang, R. Dollevoet, Y. Song, A. Núñez, J. Zhang, “Ensemble EMD-based automatic extraction of the catenary structure wavelength from the pantograph-catenary contact force”. Accepted IEEE Transactions on Instrumentation and Measurement, Jun. 2016. DOI: 10.1109/TIM.2016.2579360
IEEE TRANSACTIONS ON INSTRUMENTATION AND MEASUREMENT, VOL. , NO. , 2016
5
d ( )( )=
d
j
j
tt
t
. (7)
Then the Hilbert spectrum of the signal ( )x t can be computed
by
i ( )
1
( , ) Re[ ( )e ]j
Nt dt
j
j
S t a t
(8)
where Re denotes the real part of a complex signal. The
Hilbert spectrum reveals the physical meaning of
non-stationary data by computing the energy of the
instantaneous frequency at each time instant, which shows
favorable physical relevancy and high time-frequency
resolution in many cases [32]. Thus, it is utilized to quantify
and observe the physical meanings of IMFs of PCCF in the
following section.
C. EEMD-Based Extraction Approach
Using the PCCF signal adopted for power spectrum density
analysis in Fig. 4(a) as an example, both EMD and EEMD are
directly performed and the generated IMFs are depicted in Fig.
5(a) and Fig. 5(b), respectively. Despite that EEMD generates
one more IMF than EMD, it can be observed that the first to the
seventh IMFs from the two approaches share the similar
time-domain waveforms and declines in frequency ranges in
the same manner. Among the IMFs, the fifth and seventh IMFs
are notable for potential physical meanings that
correspondingly indicate the CSWs. Specifically, both seventh
IMFs show obvious periodicity in span cycles but local
difference in amplitude as circled by dashed lines in the figure.
The seventh IMF from EEMD possesses more complete and
continuous waveform than the one from EMD. Likewise, the
fifth IMF from EMD shows certain sign of intermittency as
circled by the dashed lines, which can be regarded as the mode
mixing phenomenon. Nevertheless, the corresponding IMF
from EEMD effectively alleviates the phenomenon as
expected.
Meanwhile, another common problem that occurs during the
decompositions is the boundary effect. In the two sets of IMFs
depicted in Fig. 5(a) and Fig. 5(b), the fourth to the seventh
IMFs show signs of boundary effects at both ends of the
waveforms, which means that partial signals at the ends are
somewhat distorted comparing with those in the middle. To
solve the problem, the simulation data outside of the 5-span
duration is used as the boundary extension for the PCCF signal.
In this case, the actual PCCF signal for EEMD is extended by
the 200 adjacent sample points, namely about half a span at
both ends of the 5-span signal. Comparisons between the
corresponding IMFs that are obtained with and without
boundary extension are depicted in Fig. 6. It can be seen that for
the fourth, fifth and seventh IMFs, the general signal oscillation
remain the same after boundary extension, whereas some
amplitudes, especially at the ends are mildly modified by the
extensions.
In the case of real-life measurements, because the PCCF
signal adopted for decomposition is normally a segment of a
long-duration PCCF measurement data, the boundary extension
can still be achieved by using the contiguous sample points
besides the segment. An illustration of the boundary extension
on a PCCF measurement data is shown in Fig. 7. The duration
of PCCF signal segment should be larger than 3 spans to reflect
its periodicity in spans and less than 10 spans (or a larger
number of spans depending on the sampling interval) for high
computational efficiency. Meanwhile, the length of boundary
Fig. 6. IMFs generated by EEMD with (solid lines) and without (dashed lines)
boundary extension.
Fig. 7. Boundary extensions on the segments of a long-duration measurement
data.
(a) (b)
Fig. 5. IMFs generated by (a) EMD and (b) EEMD with =0.2 and
100M .
Please cite as: Z. Liu, H. Wang, R. Dollevoet, Y. Song, A. Núñez, J. Zhang, “Ensemble EMD-based automatic extraction of the catenary structure wavelength from the pantograph-catenary contact force”. Accepted IEEE Transactions on Instrumentation and Measurement, Jun. 2016. DOI: 10.1109/TIM.2016.2579360
IEEE TRANSACTIONS ON INSTRUMENTATION AND MEASUREMENT, VOL. , NO. , 2016
6
extension should be at least half a span to preserve the integrity
of the span wavelength at the boundary of a signal segment.
After the decomposition, the CSWs need to be recognized
from all IMFs to accomplish the extraction. The HHT provides
the frequency-domain information of all IMFs, which can
identify the different frequency range of each IMF. Thus, the
CSWs with specific frequency characteristic can be recognized
correspondingly. From the above, it is presented that there are
two CSWs, namely the span and inter-dropper distance
wavelengths, in the decomposed PCCF signal. After applying
HHT on all IMFs, the Hilbert spectrum of the fifth and seventh
IMFs are selected and depicted in Fig. 8(a). Confirming the
physical meanings of the two CSWs, the corresponding
wavelengths are clearly shown in the figure. In detail, the span
wavelength component at around 0.02m-1 is constant and
continuous along the longitudinal direction, which occupies the
dominant energy in PCCF. The other wavelength component
oscillates between the dashed lines corresponding to 5m and
9.5m wavelengths with a certain pattern, which matches to the
distribution of the inter-dropper distance in each span given in
Table I. For comparison, the ideal TFD of the actual catenary
structure is computed based on corresponding longitudinal
position and depicted in Fig. 8(b). Although the PCCF is the
dynamic reflection of catenary structure, its TFD is unlikely to
be strictly identical to the TFD of static structure and may
deviates due to the dynamic interaction. Thus, it can be
speculated that, within a reasonable range, both CSWs are
properly reflected by the spectrum and confirming to the actual
structure parameters of catenary. As a result, the sum of the
fifth and seventh IMFs representing the CSWs and the rest of
IMFs representing the non-CSW residual are depicted in Fig. 9.
While the non-CSW residual shows no indication of significant
regularity, it should be noted that the waveform of CSWs is
highly similar to the variation of the contact wire elasticity
given in Fig. 2(b), which validates the extraction result.
To realize the extraction process automatically, the
frequency range of each IMF can be obtained by (7) and
adopted for frequency recognition. More specifically, the
structure parameters of catenary is variable but within a certain
range. Generally, the span is between 40m and 70m and the
inter-dropper distance is between 4m and 10m. Hence, the IMF
with the instantaneous frequency ranges from 0.1m-1 to 0.25m-1
or 0.014m-1 to 0.025m-1 can be recognized as the inter-dropper
distance wavelength or span wavelength respectively. Based on
(7), the recognition on whether the j th IMF is a CSW can be
judged by a Boolean variable
max[ ( )]< min[ ( )]>j j u j lt t (9)
where denotes logical conjunction and u and l are the
upper and lower boundary for a certain CSW respectively.
Since the signal decomposition based on EEMD and boundary
extension can avoid the mode mixing problem between IMFs
and ensure the validity of frequency segmentation of PCCF, the
automatic recognition process is theoretically feasible. To sum
up, Fig. 10 depicts the block diagram of the automatic
extraction approach, which is performed on several examples in
the following section. Note that in the step of EEMD, the
corresponding boundary extension must be performed on the
signal segment beforehand.
IV. VALIDATION AND POTENTIAL APPLICATIONS
According to the definition of CSW and non-CSW residual
in PCCF, this section shows some examples and potential
applications of the CSWs and the non-CSW residual separately.
The demonstration reflects both the validity and practicability
of the proposed extraction approach.
A. The CSWs
Since CSWs are essentially caused by the catenary structure
where the PCCF signal is measured from, it ought to change
with the specific parameters of catenary structure. Once the
catenary structure is determined, the speed and type of
pantograph should not influence the frequency characteristic of
CSW, although they may alter the amplitude of CSW.
Considering PCCF can be measured from different
pantograph-catenary interaction under various operation
conditions, it is crucial for the extracted CSWs to be consistent
and only sensitive to corresponding structure parameters.
Otherwise, the CSWs cannot be useful for reflecting the overall
quality of interaction. Thus, the following three cases intend to
(a)
(b)
Fig. 8. (a) Hilbert spectrum of the fifth and seventh IMFs comparing with (b)
the TFD of physical structure wavelengths of corresponding catenary.
Fig. 9. Extracted CSWs and non-CSW residual from the PCCF signal.
Fig. 10. Block diagram of the automatic CSW extraction approach.
Please cite as: Z. Liu, H. Wang, R. Dollevoet, Y. Song, A. Núñez, J. Zhang, “Ensemble EMD-based automatic extraction of the catenary structure wavelength from the pantograph-catenary contact force”. Accepted IEEE Transactions on Instrumentation and Measurement, Jun. 2016. DOI: 10.1109/TIM.2016.2579360
IEEE TRANSACTIONS ON INSTRUMENTATION AND MEASUREMENT, VOL. , NO. , 2016
7
show that the extraction approach is functioning properly as
expected. The 5-span PCCF signal depicted in Fig. 4(a) and its
extraction results are adopted as a reference for comparisons.
Case 1, Operation speed: In this case, the PCCF signals
adopted for extraction are from the same simulation as the
reference but with different operation speed. Fig. 11 depicts the
extracted CSWs of four PCCF signals under operation speed
200km/h, 250km/h, 300km/h and 350km/h, respectively. It can
be observed that, with the increase of operation speed, the
amplitude of CSWs becomes larger due to the higher vibration
between pantograph and contact wire. However, the peaks and
valleys of the oscillations appear at the same or adjacent
positions, which indicate that the periodicity of CSWs remains
similar despite of the change of speed. Thus, it shows that the
extraction approach works properly under different operation
speed. Note that for the PCCF signals measured under
nonconstant operation speed, the extraction approach can still
be functional because the instantaneous frequencies of CSWs
remain unaffected and can be recognized by (9).
Case 2, Pantograph type : In this case, the PCCF signal is
from the same simulation as the reference, but using the
SSS400+ pantograph given in Table II instead of the DSA380
pantograph. Fig. 12(a) depicts the comparison between the
extracted CSWs from the two types of pantograph. The new
CSWs generated by SSS400+ pantograph are similar in general
to the CSWs of the reference, but different at some locations
due to the differences of the physical parameters of the
pantographs. From the Hilbert spectrum of the new CSWs
depicted in Fig. 12(b), it can be seen that, comparing with the
reference spectrum in Fig. 8(a), the instantaneous frequencies
of CSWs are within the same and valid frequency range.
However, the frequency deviation in TFD is more severe than
the reference TFD, namely the new TFD is less similar to the
ideal TFD of catenary structure in Fig. 8(b) than the reference.
Considering the definition of CSW, since the reflection of
catenary structure in the new PCCF is weakened, this
phenomenon can be regarded as a sign of less favorable
pantograph-catenary contact quality. The same conclusion can
be drawn by comparing the means and standard deviations of
the new and reference PCCF signals. Concretely, the means are
155.3N and 155.2N respectively and nearly identical, whereas
the standard deviations are 33.8N and 40.7N respectively,
which indicate a relatively unfavorable contact quality in case
of SSS400+ pantograph.
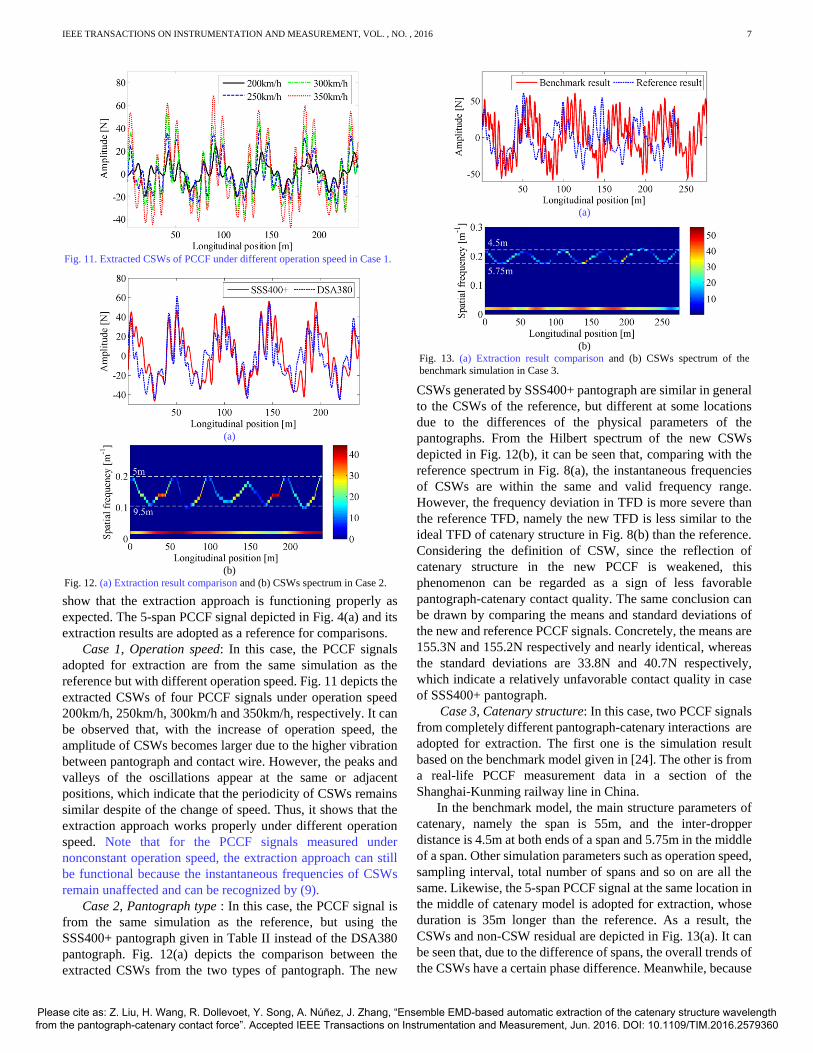
Case 3, Catenary structure: In this case, two PCCF signals
from completely different pantograph-catenary interactions are
adopted for extraction. The first one is the simulation result
based on the benchmark model given in [24]. The other is from
a real-life PCCF measurement data in a section of the
Shanghai-Kunming railway line in China.
In the benchmark model, the main structure parameters of
catenary, namely the span is 55m, and the inter-dropper
distance is 4.5m at both ends of a span and 5.75m in the middle
of a span. Other simulation parameters such as operation speed,
sampling interval, total number of spans and so on are all the
same. Likewise, the 5-span PCCF signal at the same location in
the middle of catenary model is adopted for extraction, whose
duration is 35m longer than the reference. As a result, the
CSWs and non-CSW residual are depicted in Fig. 13(a). It can
be seen that, due to the difference of spans, the overall trends of
the CSWs have a certain phase difference. Meanwhile, because
Fig. 11. Extracted CSWs of PCCF under different operation speed in Case 1.
(a)
(b)
Fig. 12. (a) Extraction result comparison and (b) CSWs spectrum in Case 2.
(a)
(b)
Fig. 13. (a) Extraction result comparison and (b) CSWs spectrum of the
benchmark simulation in Case 3.
Please cite as: Z. Liu, H. Wang, R. Dollevoet, Y. Song, A. Núñez, J. Zhang, “Ensemble EMD-based automatic extraction of the catenary structure wavelength from the pantograph-catenary contact force”. Accepted IEEE Transactions on Instrumentation and Measurement, Jun. 2016. DOI: 10.1109/TIM.2016.2579360
IEEE TRANSACTIONS ON INSTRUMENTATION AND MEASUREMENT, VOL. , NO. , 2016
8
there are four more droppers in each span of the benchmark
model than in the reference model, the oscillations of CSWs in
one span is clearly more intensive than the reference CSWs.
Therefore, in the corresponding Hilbert spectrum depicted in
Fig. 13(b), the instantaneous frequencies reflecting the
inter-dropper distances oscillate within a relatively narrow
frequency band that ranges from 4.5m to 5.75m in wavelength.
In general, the extraction approach shows certain adaptability
to the variation of catenary structure and pantograph
parameters.
In the other trial, a segment of PCCF measurement data
with 307.5m duration and 0.5m sampling interval is analyzed.
The PCCF signal is obtained from an inspection locomotive
with pressure and acceleration sensors installed under the
contact strip of the pantograph. During the measuring process,
the operation speed is consistent and approximately 125km/h.
There are five spans in the section where the PCCF is measured,
which are 65m, 57.5m, 55m, 65m and 65m long, respectively.
Along the five spans, the droppers are unevenly distributed
along the five spans and served a long-term operation. The
inter-dropper distances range from 4.5m to 8m approximately.
Fig. 14(a) depicts the PCCF measurement data with 98.9N
mean removed and its corresponding CSWs. As a result of the
extraction approach, the CSWs favorably exclude the
interference of several abnormally high forces and fit the
overall trend of PCCF. The result indicates that the non-CSW
residual contains the abnormal signal components in the PCCF
measurement data. Meanwhile, the amplitude of the CSWs
ranges from -15N to 15N that is much lower than the amplitude
of the reference CSWs in Fig. 9 due to the lower operation
speed. It agrees with the discussion regarding the operation
speed in Case 1. Furthermore, from the Hilbert spectrum of the
CSWs depicted in Fig. 14(b), it can be seen that the
instantaneous frequencies reflecting the inter-dropper distances
oscillate in the actual span cycles in longitudinal direction and
between 4.5m and 8m wavelengths in spatial frequency, which
meets the expectation of the frequency-domain characteristics
of CSWs. Although the energy distribution in the spectrum is
less regular comparing with the ones from simulation data due
to complex measurement conditions, the extraction approach
still produces the correct results.
To sum up, the proposed extraction approach could be
functional for most PCCF signals. Meanwhile, as the dominant
energy component in PCCF, the extracted CSWs can reflect the
overall trend of PCCF signal in both amplitude and frequency
adequately. Note that if certain anomaly happens to excites the
frequency component within the frequency range of CSWs, the
amplitude and energy of the CSWs will be higher than usual,
which can be an indicator of the anomaly.
B. The Non-CSW Residual
The non-CSW residual of a PCCF signal is mainly the
combined result of high-frequency vibration, measurement
noise, environmental disturbance and other possible anomalies
in pantograph-catenary system. Since it is essentially the PCCF
residual with the elimination of CSWs, it can facilitate the
analysis of signal components that are not dominant in PCCF,
which contain most hidden information on early-stage
anomalies or potential threats to the pantograph-catenary
interaction. Tentatively, the following examples show the
potential applications of non-CSW residual in the aspects of
noise tolerance and anomaly detection.
1) Noise tolerance: with the capability given by EEMD, the
extraction approach can preserve the CSWs from the
contamination of measurement noise. In other words, the
non-CSW residual shall automatically contain most of the
measurement noise, if there is any. Thus, the measurement
noises caused by different PCCF measuring system can hardly
affect the extraction results.
Using the same reference PCCF signal depicted in Fig. 4(a),
white Gaussian noise series with different signal-to-noise
power ratio (SNR) are added to the signal to test the tolerance
of extraction approach against noise. To quantify the effect of
noise on the extraction result, a variation coefficient is defined
as
0
1( )- ( )
= 100%max[ ( )] min[ ( )]
T
n r
t
r r
CSW t CSW tT
VCSW t CSW t
(10)
where ( )nCSW t and ( )rCSW t are the extracted CSWs from
the PCCF signals with and without additive noise, respectively,
and T is the total duration of the CSWs. The variation
coefficient calculates the average shifting rate of CSWs
comparing with noise-free CSW.
To show the approach performances under low and high
SNR noises in different measurement condition, the adopted
SNRs of noise range from 0.1dB to 20dB. Table III presents the
average variation coefficient of 20 trials for each SNR
TABLE III
VARIATION COEFFICIENTS UNDER THE CONTAMINATIONS OF NOISE WITH
DIFFERENT SNR
SNR (dB) 0.1 0.2 0.5 1 2 5 10 20
Variation
coefficient (%) 4.9 4.8 4.6 4.4 4.2 3.3 2.3 1.5
(a)
(b)
Fig. 14. (a) The mean-removed PCCF measurement data comparing with its
CSWs and (b) the CSWs spectrum of the PCCF in Case 3.
Please cite as: Z. Liu, H. Wang, R. Dollevoet, Y. Song, A. Núñez, J. Zhang, “Ensemble EMD-based automatic extraction of the catenary structure wavelength from the pantograph-catenary contact force”. Accepted IEEE Transactions on Instrumentation and Measurement, Jun. 2016. DOI: 10.1109/TIM.2016.2579360
IEEE TRANSACTIONS ON INSTRUMENTATION AND MEASUREMENT, VOL. , NO. , 2016
9
respectively. The variation coefficient remains below 5% at
low SNRs, which rarely exist in real-life PCCF measurements.
Considering the pressure or acceleration sensor employed in
PCCF measurement commonly has the capability to keep the
output SNR above 5dB, which is equivalent to 3.3% variation
coefficient at most, the influence of measurement noise on the
extraction approach could be negligible. Actually, it enhances
the practicability of the extraction approach.
2) Anomaly detection: normally, the catenary anomaly
cannot influence the CSWs in PCCF since the catenary
structure can hardly be altered and the energy of CSWs is too
high to be submerged by anomalies. The non-CSW residual can
usually preserve the signal components indicating anomalies.
As examples, the PCCF measurement data depicted in Fig. 14(a)
and some simulation PCCF data under contact wire irregularity
are discussed below with the help of the quadratic
time-frequency representation (TFR) for PCCF analysis [22].
In the time domain, the non-CSW residual contains most of
the concerned statistical characteristics in the original PCCF,
such as abnormal sample point and high standard deviation.
Using the same PCCF measurement data depicted in Fig. 14(a),
Fig. 15(a) depicts the PCCF with mean removed and its
corresponding non-CSW residual. When evaluating the
amplitude of PCCF, there is a common threshold criterion that
considers the PCCF exceeding three times of the standard
deviation as an abnormal sample point. Thus, two abnormal
points are obtained by the criterion as circled by the dashed red
line in the figure. After the extraction, the non-CSW residual
clearly preserves the two abnormal points and keeps the
corresponding CSWs unaffected as well. For comparison
purposes, some simulation PCCF data from [22] are adopted, in
which the contact wire irregularities simulated by
3m-wavelength cosine waveform with 1mm to 8mm amplitude
are added to the contact wire. Fig. 15(b) depicts the standard
deviations of the simulation PCCF, the corresponding CSWs
and non-CSW residual. It can be observed that as the
irregularity amplitude increases, the standard deviation of
PCCF becomes higher, which indicates the deterioration of
contact quality. As for the extraction results, while the standard
deviations of CSWs remains almost constant for all amplitudes,
the standard deviations of non-CSW residual show the same
increasing trend as the standard deviations of original PCCF.
Thus, the extracted non-CSW residual can also preserve the
fluctuation characteristic of PCCF properly.
In the frequency domain, Fig. 16(a) and (b) depicts the TFRs
of the two signals in Fig. 15(a). In the TFR of PCCF, the energy
of CSWs is so large that submerges other signal components
and leads to most energy locating at around the span
wavelength. But in the circled and numbered region 1, 2 and 3
in Fig. 16(b), there are still signs of other component exist. In
the TFR of the non-CSW residual depicted in Fig. 16(b), the
energy of CSWs at the bottom is eliminated and the signal
components in region 1, 2 and 3 are somehow fully revealed
and enhanced. In addition, some emerging signal components
appear at region 4 and 5. It should be noted that the enhanced or
emerging components are not necessarily representing
anomalies, because they may be caused by high-frequency
vibration and environmental disturbance too. The precise
(a)
(b)
Fig. 15. (a) The mean-removed PCCF measurement data and its non-CSW
residual. (b) Comparisons of the standard deviations (SDs) of PCCF, CSWs
and non-CSW residual with respect to the irregularity amplitude.
(a)
(b)
Fig. 16. Quadratic TFRs of (a) the mean-removed PCCF measurement data and
(b) the corresponding non-CSW residual.
Fig. 17. Quadratic TFRs of the healthy PCCF (left), the unhealthy PCCF
(middle) and the non-CSW residual of unhealthy PCCF (right).
Please cite as: Z. Liu, H. Wang, R. Dollevoet, Y. Song, A. Núñez, J. Zhang, “Ensemble EMD-based automatic extraction of the catenary structure wavelength from the pantograph-catenary contact force”. Accepted IEEE Transactions on Instrumentation and Measurement, Jun. 2016. DOI: 10.1109/TIM.2016.2579360
IEEE TRANSACTIONS ON INSTRUMENTATION AND MEASUREMENT, VOL. , NO. , 2016
10
anomaly detection depends on prior information of the normal
or previous components in PCCF. Take the PCCF adopted in
Fig. 15(b) as an example, the simulation PCCF signal, namely
the unhealthy PCCF signal under the global contact wire
irregularity with 3m wavelength and 8mm amplitude is
analyzed. The PCCF signal is the exact same one as in [22] to
demonstrate the advantage of proposed method. Note that in the
simulation, the contact wire irregularity is controlled to be the
only existing anomaly to test the performance of the extraction
approach. In Fig. 17, the quadratic TFRs of the healthy PCCF,
the unhealthy PCCF and the non-CSW residual of unhealthy
PCCF are depicted in the left, middle and right, respectively.
The color bar of TFR is not given for simplicity. Comparing the
middle TFR with the left one, the unhealthy PCCF is influenced
by the contact wire irregularity that leads to an emerging signal
component appearing at the corresponding wavelength of 3m.
However, as circled by the dashed line, the component is weak
in energy and short in duration, which does not meet the fact
that the contact wire irregularity is a global one throughout the
entire longitudinal position. In the TFR of non-CSW residual
on the right, it can be seen that the low-frequency part of
unhealthy PCCF is mostly eliminated after the extraction.
Consequently, the part above 0.2m-1 spatial frequency is largely
enhanced, particularly the signal component that indicates the
global irregularity as circled by the dashed line. Therefore, the
employment of non-CSW residual can certainly be helpful to
reveal the submerged components and make the anomalies
easier to detect.
V. CONCLUSION AND OUTLOOK
This paper presents a new signal extraction approach
specifically aiming at the dominant signal component, namely
the CSW in PCCF generated by the interaction between soft
catenary suspension and pantograph. The concept of CSW is
described based on a theoretical study on pantograph-catenary
interaction. To extract the CSWs automatically, the data-driven
EEMD algorithm is employed to decompose the PCCF signal
with proper boundary extension. Thereupon, the extraction of
CSWs and non-CSW residual is realized by utilizing the
property that all the decomposed signal components occupy
non-overlapping frequency bands. The preliminary results
based on simulation and measurement data indicate that the
extraction approach is adaptive to various sources of PCCF
with high tolerance against measurement noise and effective
preservation of the catenary anomalies. Some potential
applications of the extracted CSWs and non-CSW residual of
PCCF are also suggested for further developments. As for the
real-time application of the extraction approach in an on-board
measuring system, assuming the extraction will be performed
every 5 spans, which is equivalent to about every 3 seconds in
an operation under 300km/h speed, the time duration is more
than sufficient for the EEMD-based extraction with 100
ensemble members according to the EEMD implementation on
a laptop with 2.4 GHz GPU [33].
In future studies concerning the evaluation of current
collection quality, the extraction approach could be a useful
substitute for the conventional method that usually performs a
filter with cut-off frequency 20Hz on a PCCF signal to obtain
the low-frequency component of PCCF. It is more accurate
comparing with the partial elimination and preservation of the
full frequency band of PCCF. Meanwhile, the non-CSW
residual of PCCF can facilitate anomaly detections, especially
early-stage anomalies that may be submerged by CSWs.
ACKNOWLEDGMENT
The authors would like to thank the anonymous reviewers for
their valuable comments.
REFERENCES
[1] M. Givoni, “Development and impact of the modern high-speed train: A
review,” Transport Rev., vol. 26, no. 5, pp. 593–611, Sep. 2006.
[2] W. Zhang, Z. Shen, and J. Zeng, “Study on dynamics of coupled systems
in high-speed trains,” Veh. Syst. Dyn., vol. 51, no. 7, pp. 966-1016, Jun.
2013.
[3] Y. Song, Z. Liu, H. Wang, X. Lu, and J. Zhang, “Nonlinear modelling of
high-speed catenary based on analytical expressions of cable and truss
Please cite as: Z. Liu, H. Wang, R. Dollevoet, Y. Song, A. Núñez, J. Zhang, “Ensemble EMD-based automatic extraction of the catenary structure wavelength from the pantograph-catenary contact force”. Accepted IEEE Transactions on Instrumentation and Measurement, Jun. 2016. DOI: 10.1109/TIM.2016.2579360
IEEE TRANSACTIONS ON INSTRUMENTATION AND MEASUREMENT, VOL. , NO. , 2016
11
[19] S. Banerjee and M. Mitra, “Application of cross wavelet transform for ecg
pattern analysis and classification,” IEEE Trans. Instrum. Meas., vol. 63,
no. 2, pp. 326-333, Feb. 2014.
[20] N. E. Huang et al., “The empirical mode decomposition and the Hilbert
spectrum for nonlinear and non-stationary time series analysis,” Proc.
Roy. Soc. London A, vol. 454, pp. 903–995, Mar. 1998.
[21] Z. Wu and N. E. Huang, “Ensemble empirical mode decomposition: a
noise-assisted data analysis method,” Adv. Adapt. Data Anal., vol. 1, no. 1,
pp. 1-41, 2009.
[22] H. Wang, Z. Liu, Y. Song, X. Lu, Z. Han, J. Zhang, and Y. Wang,
“Detection of contact wire irregularities using a quadratic time-frequency
representation of the pantograph-catenary contact force,” IEEE Trans.
Instrum. Meas., vol. 65, no. 6, pp. 1385-1397, Jun. 2016.
[23] Railway Applications—Current Collection Systems—Validation of
Simulation of the Dynamic Interaction Between Pantograph and
Overhead Contact Line, European Standard EN 50318, Jul. 2002.
CENELEC, European Committee for Electrotechnical Standardization.
[24] S. Bruni, J. Ambrosio, A. Carnicero, Y. H. Cho, L. Finner, M. Ikeda, S. Y.
Kwon, J. Massat, S. Stichel, M. Tur, and W. Zhang, “The results of the
[31] A. Komaty, A. O. Boudraa, B. Augier, and D. Daré-Emzivat,
“EMD-based filtering using similarity measure between probability
density functions of IMFs,” IEEE Trans. Instrum. Meas., vol. 63, no. 1,
pp. 27-34, Jan. 2014.
[32] N. E. Huang and S. S. P. Shen, Eds., Hilbert-Huang Transform and Its
Applications. Singapore: World Scientific, 2005.
[33] Y. H. Wang, C. H. Yeh, H. W. V. Young, K. Hu, and M. T. Lo, “On the
computational complexity of the empirical mode decomposition
algorithm,” Physica A, vol. 400, pp. 159–167, 2014.
Zhigang Liu (M’06–SM’16) received the Ph.D.
degree in power system and automation from the
Southwest Jiaotong University, Chengdu, China, in
2003.
He is currently a Full Professor with the School of
Electrical Engineering, Southwest Jiaotong
University. His current research interests include
electrical relationship of vehicle-grid in high-speed
railway, power quality considering grid-connect of
new energies, pantograph-catenary dynamic, and
fault detection, status assessment and active control.
Hongrui Wang (S’15) received the B.S. degree in
electrical engineering and automation from Mao
Yisheng Class, Southwest Jiaotong University,
Chengdu, China, in 2012, where he is currently
pursuing the Ph.D. degree with the School of
Electrical Engineering. He is currently involved in a Joint PhD Program
sponsored by the China Scholarship Council with the
Section of Railway Engineering, Delft University of
Technology, Delft, The Netherlands. His research interests include signal
decomposition, time-frequency analysis, signal filtering, machine learning and
their applications in the assessment, detection, diagnosis and maintenance of
railway pantograph-catenary system.
Rolf Dollevoet received the M.Sc. degree in
mechanical engineering from Eindhoven University
of Technology, Eindhoven, The Netherlands, and the
Ph.D. degree from the University of Twente,
Enschede, The Netherlands, in 2010.
Since 2003, he has been with ProRail, Utrecht, The
Netherlands. Since 2012, he has been appointed as a
part-time Professor with the Section of Railway
Engineering, Delft University of Technology, Delft,
The Netherlands. He is also currently the leader of
scientific research on rolling contact fatigue and wheel–rail interface within
ProRail Civil Engineering and the Chair of the International Union of Railways
working group on wheel–rail conditioning and lubrication.
Dr. Dollevoet was a recipient of the Jan van Stappen Spoorprijs 2010 Award (a
yearly prize for contributions to the travel quality and service for passengers in
The Netherlands) from the railway sector for his Ph.D. research and its huge
potential to reduce track maintenance costs.
Yang Song (S’16) received the B.S. degree in
mechanical engineering from Shanghai University of
Electric Power, Shanghai, China, in 2011. He is
currently pursuing the Ph.D. degree with the School
of Electrical Engineering, Southwest Jiaotong
University.
He is currently involved in a Joint PhD Program
sponsored by the China Scholarship Council with the
School of Engineering, University of Liverpool,
Liverpool, The United Kingdom. His research
interests include modeling and aerodynamic of the
pantograph-catenary system, and active control of the pantograph.
Alfredo Núñez (M’02–SM’14) received the Ph.D.
degree in electrical engineering from the Universidad
de Chile, Santiago, Chile, in 2010.
He was a Postdoctoral Researcher with the Delft
Center for Systems and Control. He is currently with
the Section of Railway Engineering, Delft University
of Technology, Delft, The Netherlands. He authored
the book Hybrid Predictive Control for Dynamic
Transport Problems in the Series of Advances in
Industrial Control (Springer-Verlag, 2013). His
research interests include monitoring and
maintenance of railway infrastructure, modeling and control of traffic and
transportation systems, model predictive control, and fuzzy systems.
Jing Zhang received the Ph.D. degree in mechanical
manufacturing engineering and automation from
Southwest Jiaotong University, Sichuan, China, in
2008.
She is currently an Associate Professor with the
School of Electrical Engineering, Southwest
Jiaotong University. Her research interests include
optimization design of pantograph-catenary
parameters, aerodynamics of pantograph-catenary
system and control technology of high-speed
pantograph.
Please cite as: Z. Liu, H. Wang, R. Dollevoet, Y. Song, A. Núñez, J. Zhang, “Ensemble EMD-based automatic extraction of the catenary structure wavelength from the pantograph-catenary contact force”. Accepted IEEE Transactions on Instrumentation and Measurement, Jun. 2016. DOI: 10.1109/TIM.2016.2579360


![Virtual agent-mediated appraisal training: a single …pure.tudelft.nl/ws/files/33587579/Virtual_agent_Brinkman.pdfDownload by: [TU Delft Library] ... Además, proporciona una referencia](https://static.documents.pub/doc/80x56/5b3d37e87f8b9a560a8ddab7/virtual-agent-mediated-appraisal-training-a-single-pure-by-tu-delft-library.jpg)


