Delinking land rights from land use: Certification and migration in Mexico Alain de Janvry Kyle Emerick Marco Gonzalez-Navarro Elisabeth Sadoulet * August 11, 2014 Abstract We show that removing the link between land use and land rights through the issuance of certificates of property can result in large-scale adjustments to labor and land allocations. Using the rollout of the Mexican land certification program from 1993 to 2006, we find that households obtaining certificates were subsequently 28% more likely to have a migrant member. This response was differentiated by initial land endowments, land quality, outside wages, and initial land security. We also show that even though land certification induced migration, it did not result in decreases in cultivated area due to consolidation of larger farms. JEL Codes: Q15, O15 * de Janvry and Sadoulet: University of California at Berkeley; Emerick: Tufts University; Gonzalez-Navarro: University of Toronto. We thank Dalhia Robles from RAN for administrative data access. Andreas Steinmayr, Rachel Heath, and seminar participants at the Pacific Development Economics Conference, Midwest International Economic Development Conference, World Bank Development Impact Evaluation Initiative Seminar, International Conference on Migration and Development, Northeast Universities Development Consortium, Iowa State, CEDSG, Chinese Academy of Sciences, UC-Berkeley, and University of Toronto for valuable comments. 1
Transcript
Delinking land rights from land use: Certification and migration in
Mexico
Alain de JanvryKyle Emerick
Marco Gonzalez-NavarroElisabeth Sadoulet∗
August 11, 2014
Abstract
We show that removing the link between land use and land rights through the issuanceof certificates of property can result in large-scale adjustments to labor and land allocations.Using the rollout of the Mexican land certification program from 1993 to 2006, we find thathouseholds obtaining certificates were subsequently 28% more likely to have a migrant member.This response was differentiated by initial land endowments, land quality, outside wages, andinitial land security. We also show that even though land certification induced migration, it didnot result in decreases in cultivated area due to consolidation of larger farms.
JEL Codes: Q15, O15
∗de Janvry and Sadoulet: University of California at Berkeley; Emerick: Tufts University; Gonzalez-Navarro:University of Toronto. We thank Dalhia Robles from RAN for administrative data access. Andreas Steinmayr,Rachel Heath, and seminar participants at the Pacific Development Economics Conference, Midwest InternationalEconomic Development Conference, World Bank Development Impact Evaluation Initiative Seminar, InternationalConference on Migration and Development, Northeast Universities Development Consortium, Iowa State, CEDSG,Chinese Academy of Sciences, UC-Berkeley, and University of Toronto for valuable comments.
1
1 Introduction
Well-defined and secure property rights over land have long been recognized as essential for economic
development (Demsetz, 1967; North and Thomas, 1973; De Soto, 2000). There are however different
ways in which these rights can be established. Contrary to the norm in developed countries where
rights are established by land titles, in many developing countries they are established by contingent
use of the land. In this case, security of access requires evidence of productive use by the occupant
himself; i.e., leaving the land idle or letting it to others implies a substantial risk of loss of rights.
This can be inefficient to the occupant as it imposes conditions on the amount of labor used on the
land by requiring that it be kept in production at an accepted standard of use, ignoring the return
to labor in alternative activities. In addition, the common prohibition to land consolidation can
be inefficient for the community if plots are below optimal size and there are increasing returns to
scale. With a focus on increasing the efficiency of land use, land certification and titling programs
that remove constraints on land use and allow land transactions have been widely sponsored by
national governments and international development agencies (Heath, 1990).
While the impact of these titling programs on investment incentives has received significant
attention, this has not been the case for the potentially large effects on the spatial reallocation of
labor away from agriculture. The importance of this effect becomes clear once one considers that in
developing countries value added per worker is on average four times higher in the non-agricultural
sector than in agriculture (Gollin et al., 2014). At the same time, the labor share in agriculture is
often several orders of magnitude larger than agriculture’s share of value added. Recent literature
has argued that this apparent misallocation of workers is an important determinant of cross-country
income differences (Restuccia, Yang, and Zhu, 2008; Duarte and Restuccia, 2010; McMillan and
Harttgen, 2014). For the specific case of Mexico that we consider in this paper, in the early 1990s,
agriculture accounted for only 3.8% of GDP while 34.4% of the population lived in rural areas.
This begs the question of whether improving property rights to agricultural land can be a factor
that leads to a more efficient allocation of the work force.
In this paper, we argue that a pre-title regime where use-based property rights require presence
of the owner on the land and his active use of the land create a distortion, inefficiently tying labor
to the land, and causing too much labor to be allocated to agriculture.1 We use a simple household
model to show that implementation of a land certification program delinking land rights from land
use can lead to increased outmigration. In the model, the inefficient labor tying result rests on
1There are many examples of use-based property rights with implications on the efficiency of land use. In Brazil,cultivation of more than 50% of the potentially productive area in large farms is required by the constitution of1988 as a “social obligation” of land ownership, with the legal right to expropriation at the demand of spontaneousoccupants if deemed under-used. By contrast, occupants making active use of the land cannot be removed as longas they are growing crops (Navarro, 2009). In China, under the household responsibility system introduced in 1978,land belongs to the community and individual farmers have usufruct rights that can be subject to expropriation.Households engaging in off-farm employment are more likely to see part or all of their land reallocated to others(Rozelle and Li, 1998). In Ghana, Goldstein and Udry (2008) find that land cannot be left idle over long fallowperiods to restore soil fertility by occupants with less secure property rights due to their weaker social position in thecommunity.
2
two main conditions: a preexisting suboptimal farm size and the direct land use requirement. We
formalize the latter by requiring a minimum agricultural yield in order to maintain land ownership.
This contrasts with the classic model where tenure insecurity is modeled as a tax on output (Besley
and Ghatak, 2010). Under the traditional framework, improving property rights would be predicted
to increase the marginal products of agricultural land and labor, decreasing incentives to migrate.
We test the model’s predictions using data from Mexico’s large-scale land certification program,
the Programa de Certificacion de Derechos Ejidales y Titulacion de Solares, or Procede. The
program was rolled out nationwide from 1993 to 2006 to issue certificates of ownership over ejido
land. Ejidos are agrarian communities that were created over the 1914 to 1992 period as part of an
ambitious land reform program in which community members (ejidatarios) were granted use and
residual claimant rights over individual agricultural plots. Land plots were small to accommodate
the objective of meeting the demand for land of as large a population as possible, with prohibition
of both land consolidation through rental or sales and of land fragmentation by limiting inheritance
to only one child. Security of access for individuals has been shown to be closely linked to usage
(Gordillo, de Janvry, and Sadoulet, 1998). Land had to be used personally by the beneficiary and
his family, and any land left fallow for more than two years would be granted to another beneficiary.
Using land productively typically meant cultivating it in extensive rainfed corn.
Procede revoked this pattern of use-based property rights (Cornelius and Myhre, 1998). It gave
ejidatarios land certificates specifying the name of the owner of each agricultural plot alongside
with a GIS-based map of the plot. Certificates can be traded among community members and land
consolidated in larger farms through rentals and sales. Procede was massive in scale, providing
certificates to over 3.6 million families by the end of the program.
We use this large-scale land certification experiment to assess the migration and land reallo-
cation impacts of redefining property rights from use-based to title-based. We use a fixed-effects
econometric specification that compares changes in migration between households in early certi-
fied and later certified ejidos. Because the program provided certificates to the entire community
simultaneously, this process eliminates concerns about selection at the individual level.2 The main
threat to our strategy is time-trending unobservables that vary differentially between early and
later certified ejidos. We show identification tests that suggest that changes in migration over time
prior to the program were uncorrelated with the program’s rollout.3
Our main result is that redefining property rights to be based on formal certificates led to
increased migration out of rural areas. We establish this result using three independent datasets.
First, using panel data on rural households, we find that households in certified ejidos were sub-
sequently 28% more likely to have a migrant household member. Second, using locality level data
from two successive population censuses, we find that certification led to a 4% reduction in pop-
ulation. Third, we use a nationwide ejido census to confirm that certification led to more young
2This is contrary to typical land titling programs where allocation is demand driven. See for example, Alston,Libecap, and Schneider (1996).
3The robustness checks in section 5.1 provide further support for the parallel trends assumption necessary foridentification.
3
people leaving the ejido for work reasons. Our estimates imply that the departure of about 70,000
people – or some 20% of the total number of migrants from these communities – can be attributed
to the certification program.
With this main result established, we proceed to test four additional predictions of the model.
First, we document heterogeneity in migration responses, with larger effects for households with
ex-ante weaker property rights (associated with border conflicts and gender of the household head)
and with more attractive off-farm wage opportunities. Second, we document that migration effects
are smaller where land is more productive, consistent with the model where requiring productive use
was more onerous on lower quality land. This result suggests that part of the oft-cited productivity
effects of agricultural titling programs could be partly driven by selective migration. Third, we
find evidence of sorting at the community level regarding who migrates based on differential land
endowments. Farmers with more land were less likely to migrate as a result of the program than
smaller landholders. The model predicts this differential effect, as the use restriction in the previous
property rights regime was more binding for farmers with smaller landholdings. Finally, the model
suggests that the difference in migration responses between large and small landholders should be
sharper in areas with higher land productivity. We find clear evidence of this in the data. The
overall effect of certification on migration for land-rich households in high productivity areas is not
statistically different from zero. In contrast, in low land productivity regions the migration effect
is statistically significant for large and small landholders and of about the same magnitude.
We then build on our labor reallocation results to study the implications of certification for land
use patterns. A decrease in agricultural labor is naturally expected to decrease total area sown.
However, there are two countervailing forces that make this an empirical question. The first is land
consolidation in a context of increasing returns to scale. By allowing consolidation of farm units,
the certification program could help resolve the suboptimal farm size problem. The second is the
enhanced investment effect traditionally argued in the property rights literature. Investments that
are complementary to agricultural land could help expand cultivated area after the program.
We shed light on this question by using a large database on over 43 million farm support
payments made to Mexican farmers during the period from 1995-2012 under the PROCAMPO
program. The long time horizon of these data allow us to consider long-term changes that allow
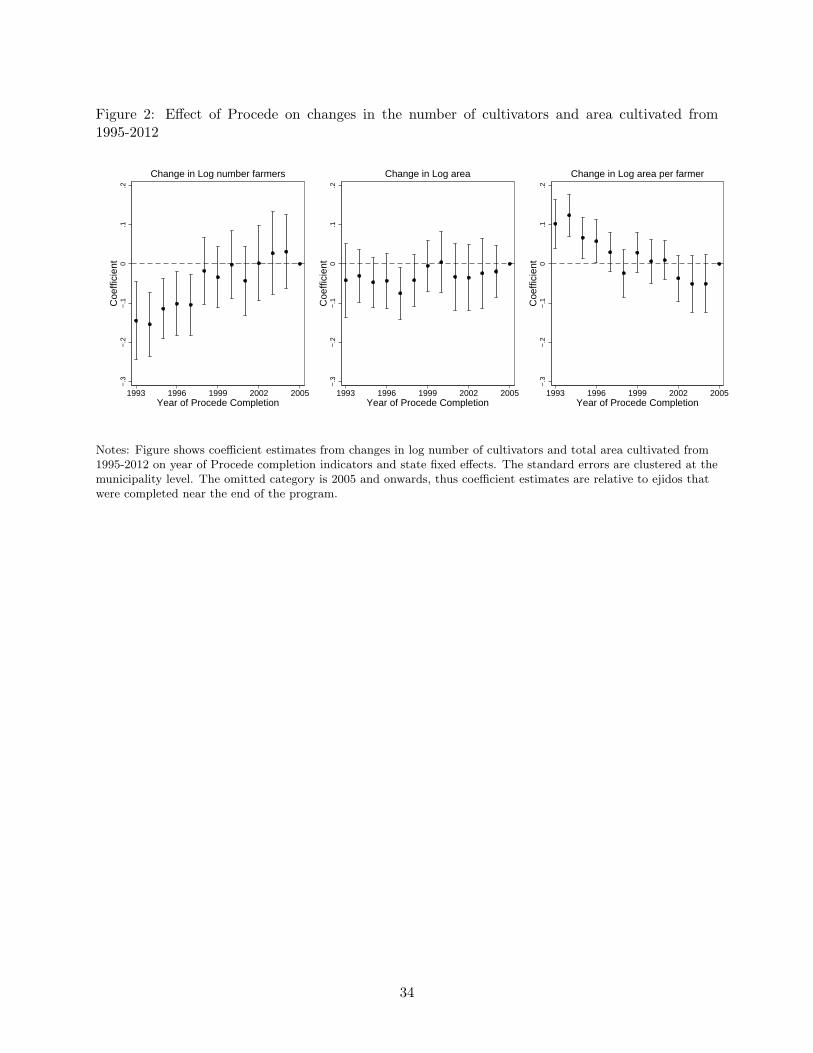
sufficient time for land consolidation or reallocation. We show that while ejidos that were certified
earlier experienced larger decreases in the number of farmers from 1995 to 2012, the effects on
cultivated area are much smaller and statistically insignificant. Combining these two results, average
farm size increased by approximately 5-10% when comparing ejidos certified during the first few
years of the program to those certified later. In addition, we use three rounds of satellite land
use data to confirm that, on average, cropland in ejidos did not decrease after introduction of the
program in spite of large population losses.
Our result that average farm size increased after Procede suggests that consolidation of land-
holdings represents an additional efficiency gain from improved property rights. However, policies
such as land reform in developing countries often make farm sizes inefficiently small. Data from
4
the 1990-1991 agricultural census are consistent with this. Area per producer was approximately
2.75 times larger in the non-ejido sector than in the ejido sector (World Bank, 2001). We therefore
expect that more efficient farm sizes is one of the channels through which land certification can
affect welfare.
While the heterogeneity results are generally consistent with our model, we must caveat the
exercise as there may be other models that could potentially explain the results. We conclude our
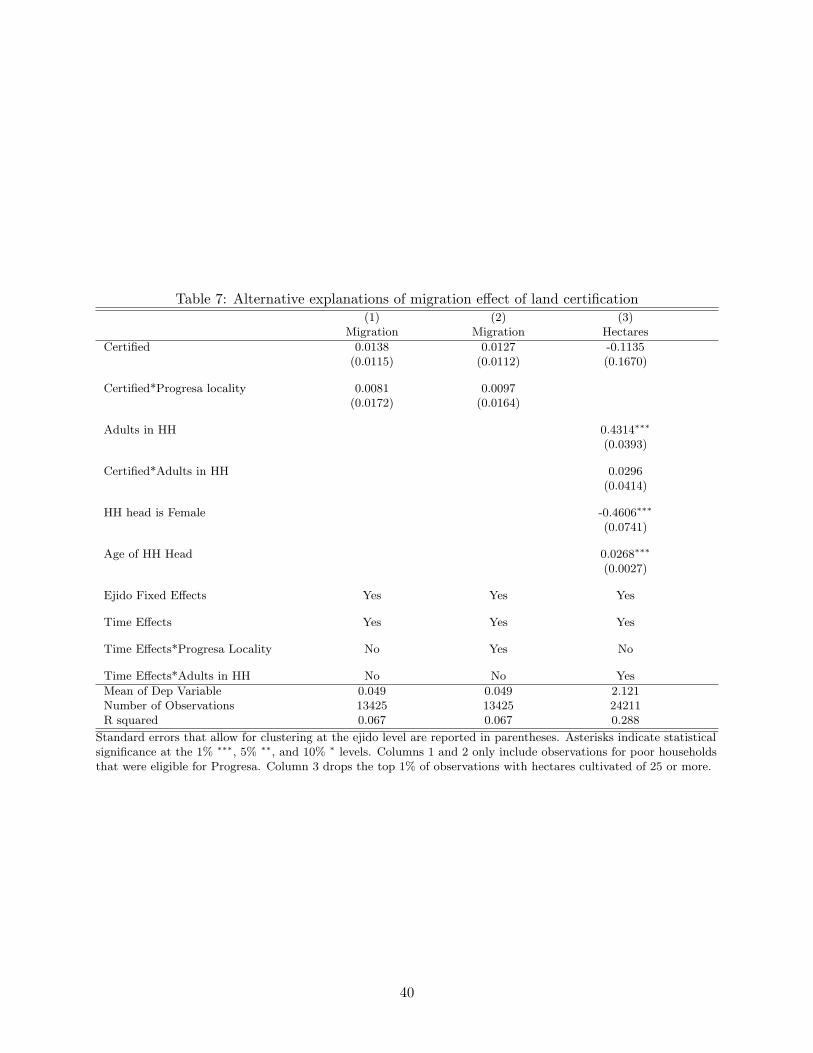
analysis by considering some of the alternative explanations for our findings. One notable alterna-
tive explanation for the increased migration result is that the certification program attracted funds
from outside the community through land transactions that helped finance migration by relaxing
liquidity constraints.4 We test and reject that this alternative mechanism explains increased mi-
gration after certification. We assess the role of credit constraints by comparing the effect of the
certification program between randomly assigned Progresa (a conditional cash transfer program)
and non-Progresa localities. Because the former experienced substantial exogenous cash inflows be-
fore certification, thereby mitigating liquidity constraints, the migration response should be smaller
in Progresa localities once certification occurred. We do not find evidence of this in the data.5
Our results add new empirical evidence on an important channel through which improved
property rights affect economic outcomes. In reviewing the property rights literature, Besley (1995),
Besley and Ghatak (2010) and Galiani and Schargrodsky (2011) show that the benefits from well-
defined and secure property rights over land can materialize through four channels: enhanced
investment incentives (Alchian and Demsetz, 1973; Lin, 1992), facilitation of land trades (Besley,
1995; Deininger, 2003), increased use of land as collateral in accessing credit (Feder, Onchan,
and Chalamwong, 1988; De Soto, 2000), and improved intra-household labor allocations (Field,
2007). The literature makes no clear distinction as to whether rights are established by use or by
certification/titling, as long as they are well defined and secure. Yet, the difference on labor and
land use can be very important: use-based rights can restrain migration out of agriculture and
keep inferior land in production (Feder and Feeny, 1991). Prohibition of land consolidation can
prevent capturing economies of scale and maintain low yields. We show that due to the existence
of use-based property rights, labor reallocation can be a quantitatively important result of formally
securing property rights with legal certificates.
Other work on property rights and labor allocation has focused on urban areas and found
mixed results. Field (2007) finds that providing land titles to urban squatters in Peru resulted in
an increase in the amount of labor allocated to work away from home, principally due to a reduction
in the need for guard labor. In contrast, Galiani and Schargrodsky (2010) find that the provision
of land titles to squatters in urban Argentina had no effect on labor market outcomes, possibly due
to unconstrained labor supply prior to the reform.
4Angelucci (2013) shows that conditional cash transfer programs alleviate credit constraints and allow for migrationof household members.
5Previous research has failed to document a credit access effect from banks using land as collateral after titling(Galiani and Schargrodsky, 2010; Field and Torero, 2006). The Mexican certification program was explicitly designedto limit mortgages (hence the term certification, not title) so we ignore this alternative in the paper. Early evidenceon Procede also failed to find any credit access effects (Deininger and Bresciani, 2001).
5
A new literature that considers the migration effects of land titling (Valsecchi, 2013; de Brauw
and Mueller, 2012; Chernina, Castaneda Dower, and Markevich, 2013) emphasizes the role of the
acquired transferability of land rights for rental, sales, or inheritance. Our focus on the transition
away from use-based rights suggests a different explanation for why households may migrate after
rural land titling programs. Requirements to use the land productively had put households in a
constrained optimum where too much labor was being used in agriculture. This is similar to the
mechanism described by Giles and Mu (2011) for China where land reallocation by village author-
ities is affected by the extent of urban work. In addition, the literature has not addressed whether
eliminating these requirements with formal property rights can decrease the share of labor in agri-
culture without affecting overall production. Our results on cultivated area and land consolidation
suggest exactly this.
The remainder of the paper is organized as follows. In section 2 we provide further details on the
history of land reform in Mexico. Section 3 develops a basic household model and derives testable
implications. Section 4 discusses the data and the identification strategy. Section 5 presents the
results. Section 6 provides robustness checks and section 7 concludes.
2 Land Reform in Mexico
We first discuss the conditions that existed as a result of Mexico’s first major land reform. These
conditions are useful in helping develop the setup for the theoretical framework that we outline in
the next section. We then describe the characteristics of the second major reform which we focus
on for the remainder of the paper.
2.1 The first reform
The first major land reform, carried out during the period from 1914 to 1992, was one of the largest
in the world (Yates, 1981). The reform consisted of government expropriation of large private
landholdings and redistribution of these tracts of land to groups of peasant farmers organized in
agrarian communities called ejidos (Sanderson, 1984).6 Once awarded, the land was managed by
the ejido assembly under the guiding hand of the state. Farmers received usufruct rights to a plot
for individual cultivation, access to common-use land (for forests, pastures, and surface water), and
a residential lot for housing. With the objective of limiting land concentration, ejidatarios were
prohibited from selling or renting their plots, even if it would have been efficient given increasing
returns to scale.7
Importantly for our model, a key constraint imposed during this first reform was that members
of ejidos had the social obligation of using land productively (Cordova, 1974). Furthermore, the
6The program also certified land in indigenous communities (de Janvry, Gordillo, and Sadoulet, 1997). In theremainder of the paper we do not differentiate ejidos from indigenous communities.
7There is evidence that a black market for ejido lands existed in some parts of the country (Cornelius and Myhre,1998) and that regulations on direct use were abused in many cases (Gordillo, de Janvry, and Sadoulet, 1998). In spiteof this, results from this study show that removing the regulations created a major discontinuity in labor allocationand land use.
6
Constitution itself ruled that any individual land plot that was not cultivated by its assignee in
two consecutive years was to be taken away, imposing a permanent “use-it-or-lose-it” restriction.
We impose this productive use constraint in our model by requiring that agricultural land meet a
minimum standard of productivity defined by crop yield.
Also important for our model, the requirement to use land productively was not determined
endogenously within the ejido. Rather, it was set and enforced externally to the ejido by a state-
level Mixed Agrarian Commission charged with implementing the federal land reform legislation
and composed of appointees of the Land Reform Secretariat, the State Governor, and the President
of the Republic. The commission decided on land expropriations and allocations for the creation
and operation of ejidos, and on the nomination and removal of individual beneficiaries. Land taken
away from a beneficiary failing to meet the use and residency obligations would be assigned to the
first person on a list of ejidatarios-at-wait.8 Thus, the minimum productive use constraint that we
impose can be considered as exogenous to local ejido conditions.
In addition to requiring physical presence and a minimum acceptable level of production, ben-
eficiaries of the first land reform were prohibited from reallocating land through sales or rentals.
The land market was therefore severely limited at the start of Procede.
2.2 The second reform
While the first reform achieved the social function of distributing small amounts of land to as many
rural inhabitants as possible, it eventually led to low agricultural productivity and high levels
of poverty among beneficiaries (de Janvry, Gordillo, and Sadoulet, 1997). With the impending
advent of NAFTA, the Mexican government introduced a major constitutional reform in 1992 to
improve efficiency in the ejido by certifying individual plots to current users. This second land
reform was clearly intended to improve security of access to land by delineating individual property
boundaries within the ejido, with the expectation of encouraging long-term productive investments
by ejidatarios (Heath, 1990). The reform created Agrarian Tribunals to resolve conflicts over the
issuance of certificates, established an ejido National Agrarian Registry where individuals would
be assigned parcels in the ejido, allowed land rental and sales between ejidatarios, and established
a well defined procedure to eventually turn ejido certificates into full titles that could be sold to
non-ejidatarios.9 By issuing land certificates, the program effectively delinked property rights from
use requirements.
The program was national in scope and took 13 years to complete. The registration process be-
gan with officials from the Agrarian Attorney’s Office (PA) approaching ejido officials and providing
information about Procede. An ejido assembly was called to approve initiation of the certification
process. After the first assembly, government officials from the National Institute of Statistics and
8Political scientists have argued that granting incomplete property rights with highly restrictive land use require-ments was purposefully designed by the ruling party to create a clientelistic relationship with farmers in spite of theeconomic inefficiencies it inevitably entailed (Magaloni, 2006). In a recent paper, we find evidence of voting behaviorconsistent with that hypothesis (de Janvry, Gonzalez-Navarro, and Sadoulet, 2013).
9See Appendini (2002) and de Ita (2006) for a description of the reforms.
7
Geography (INEGI) worked with the ejido to identify owners of plots and to produce GIS maps
of the ejido. Any disputes over property ownership had to be resolved during this stage of the
process by the agrarian courts especially created to resolve such conflicts (Deininger and Bresciani,
2001). After all conflicts had been resolved, the maps showing plots with individual ownership were
submitted for approval at a final ejido assembly. Final approval resulted in issuance of ownership
certificates by the National Agrarian Registry (RAN) simultaneously to all rights-holders in the
ejido. Except for a few conflict zones, the program progressed remarkably smoothly.
Turning to the implications of program implementation for our econometric identification, the
rollout progressed differentially over space. de Janvry, Gonzalez-Navarro, and Sadoulet (2013) in-
vestigate the correlates of program completion, showing that ejidos where the program was initiated
earlier were on average smaller, had more land in parcels, were closer to large cities, were wealthier,
had fewer non-voting members, and were more likely to be in municipalities politically aligned with
the party of the state governor. These differences between early and late certified ejidos are not
a threat to our identification strategy as long as they are largely uncorrelated with changes over
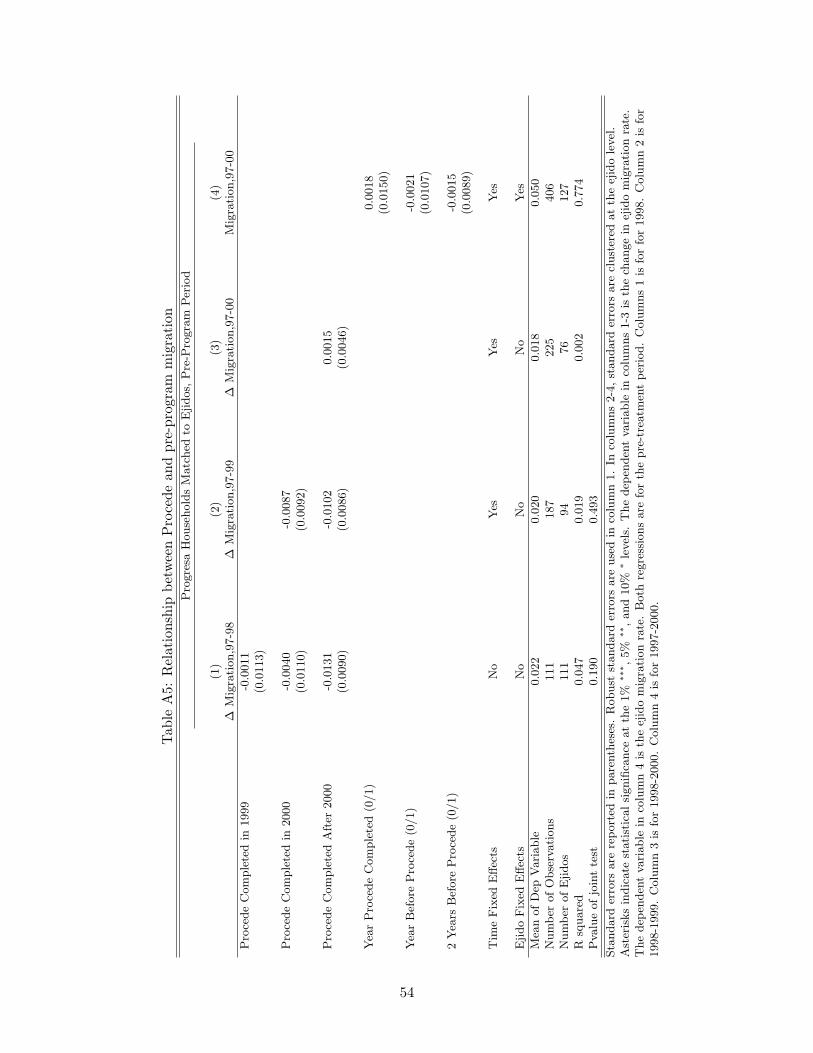
time in migration. To address this concern we verify that changes over time in migration prior to
the program were not correlated with the year of program completion in the online Appendix. We
also interact fixed ejido characteristics with time effects in our main analysis to account for the
possibility that migration changed over time due to these fixed characteristics that were correlated
with timing of land certification.
3 Theory
The traditional land insecurity model treats insecurity of property rights as a tax on production.
Because improving property rights in the canonical model generates a higher expected output,
this naturally leads a household to optimally allocate more labor to the farm, thus reducing the
equilibrium level of outmigration. Note that this result is based on the critical assumption that the
household is always efficiently allocating labor between uses.
The main innovation in our model is to introduce use requirements as a condition to maintain
property rights. In a context of small plot sizes (due to the initial allocation and the subsequent
prohibition of land transactions), this leads to spatial labor misallocation. The model makes clear
how these two conditions can cause inefficient tying of labor to land, and how relaxing the use
restriction can provoke increased outmigration. Once this is established, the model is used to
generate predictions about heterogenous effects which can be taken to the data. We also explore
the consequences of relaxing the constraint on land rentals that was enacted simultaneously with
land certification.
3.1 Setup
We use the standard agricultural production model in which farm labor he produces expected
output Ye according to Ye = γAαhβe , where 0 < α, β < 1, A is land, and γ is a total factor
8
productivity parameter. We incorporate migration as households having the option of supplying
labor hm in the non-farm labor market at the wage wm, from which they earn wmhm. Household
utility is quasi-linear:
u(C, ℓ) = C + v(ℓ),
where C is consumption, ℓ is leisure, and utility of leisure is concave (v′ > 0, v′′ < 0). Households
are endowed with time T which is spent working on the farm, on wage labor off the farm, and
on leisure, so that T = he + hm + ℓ is the time constraint. The household’s budget constraint is
C = γAαhβe + wmhm + I, where I is non-labor income.
3.2 When land use conditions property rights over land
Insecure property rights are usually modeled as reducing the expected product that the household
reaps from farm labor (for instance Besley and Ghatak, 2010). In particular, expected farm produc-
tion becomes Ye = (1−τ)γAαhβe , where τ ∈ [0, 1] reflects the degree of insecurity in property rights.
Obtaining the first order conditions of the household’s problem and differentiating with respect to
τ shows that improving property rights results in an increase in farm labor and a corresponding
decrease in migration.
In contrast, and in line with the nature of property rights in Mexican ejidos described above
and the common form of usufructory rights across the world, we formalize the condition imposed
on ejidatarios to maintain claim on the land as a minimum production level per unit of land:
YeA
≥ πms,
where πm is the minimum yield, and s ∈ (0, 1) is a parameter representing the household’s spe-
cific strength of property rights. The parameter s captures the idea that households with weaker
property rights have to maintain a higher production level to keep their land (Goldstein and Udry,
2008). Because we do not have stochastic output, the minimum yield requirement can alternatively
be thought of as a minimum labor requirement per unit of land, as shown in the online Appendix.
However, we use the minimum yield requirement as it closely describes the situation in Mexico.
As typical with use-based ownership, and in particular in Mexico’s pre-reform context, there is
neither a rental nor a sales markets for land, and farmers are not allowed to hire workers. Hence
A is the exogenously allotted land to the household during the initial phase of land reform, and he
can only be family labor. Lack of land markets and farm sizes below the optimal scale generate
non-decreasing return to scale (α+ β ≥ 1). Non-decreasing returns to scale can arise out of small
landholdings or production indivisibilities. In any case, there is evidence for this assumption in
Mexican ejidos.10
10The 1994 ejido survey was administered to around 1300 ejido households by the World Bank. We estimated aproduction function of the form ln(productionis) = β0 + β1ln(hectaresis) + β2ln(laboris) +αs + εis, where i indexeshouseholds and s indexes states. Standard errors were conservatively clustered at the state level. The estimates fromthis regression are β1 = 0.933 and β2 = 0.176. The sum of the two coefficients is significantly larger than 1 with a p-value of 0.048. While these estimates certainly cannot be interpreted causally, the results provide suggestive empirical
9
Without constraint, the optimal allocation of labor to farm production would be:
h∗e =
(γβ
wm
) 11−β
Aα
1−β , (1)
which is an increasing and convex function of A. Note that the condition β < 1 ensures that the
second order conditions for a maximum are satisfied. The minimum yield constraint requires the
household to allocate a minimum amount of labor (he) to agricultural production
he =
(πmsγ
) 1β
A1−αβ , (2)
or else lose its land. This minimum labor requirement is an increasing and concave function of A.
The restriction will bind for farm sizes that are smaller than the threshold A0 defined by h∗e = he:
A0 =
[1
γ
(πms
)1−β(wm
β
)β] 1
α+β−1
. (3)
At the constrained labor allocation, the average return to on-farm labor is:
Yehe
= γAαhβ−1e = γ
1β
(πms
)1− 1βA
α+β−1β ,
When the restriction binds, although households allocate more time to the farm than under un-
restricted optimization, it is still advantageous to allocate he to the farm as long as the average
return to farm labor is at least as large as the off farm wage, i.e., Ye/he ≥ wm. This defines a
threshold A1 below which households will prefer to relinquish their land and fully work off-farm:
A1 =
[1
γ
(πms
)1−βwm
β
] 1α+β−1
= ββ
α+β−1A0 (4)
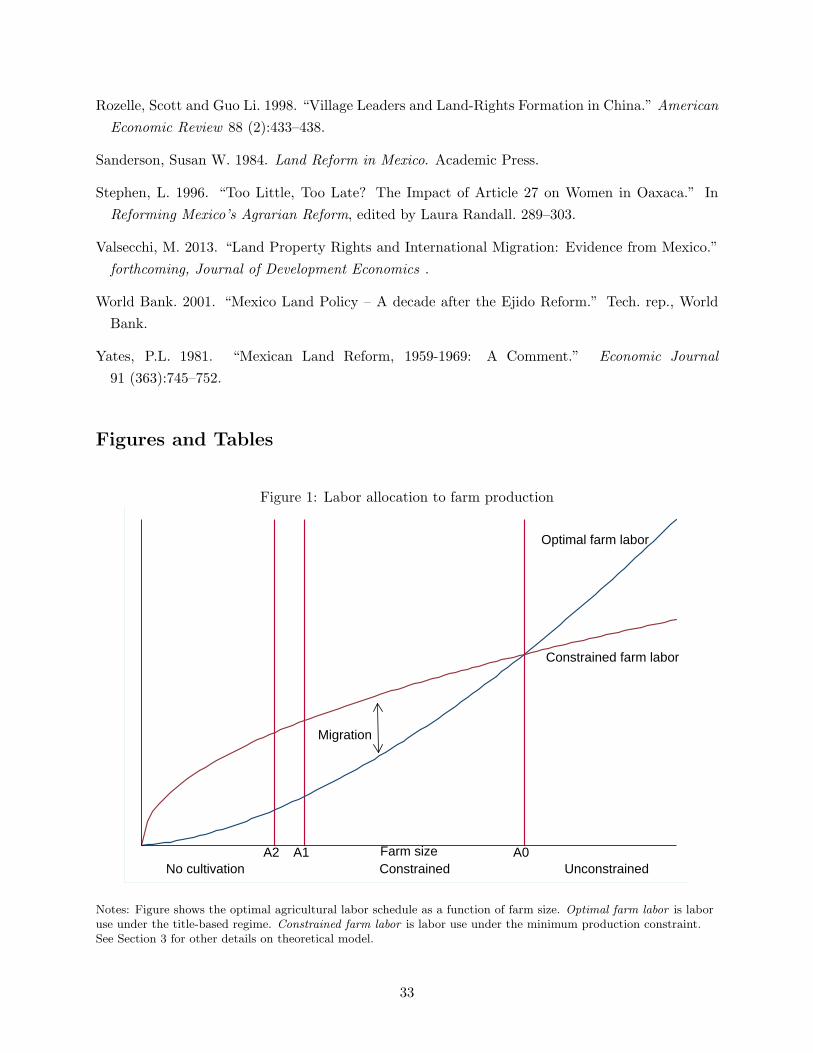
The labor allocation solution to this restricted optimization is represented in Figure 1 and
summarized as follows:
• Leisure is determined by: wm = v′(ℓ)
• On farm labor is given by:
(i) he = h∗e, if A ≥ A0
(ii) he = he, if A1 ≤ A ≤ A0
(iii) he = 0, if A ≤ A1,
where A0 is defined by h∗e = he, and A1 is defined by Ye/he = wm
evidence consistent with non-decreasing returns to scale in this context. See also Adamopoulos and Restuccia (2014)for estimates of the efficiency cost of small farms in developing countries.
10
• Migrant/off-farm labor is given by:
hm = T − he − ℓ (5)
For simplicity, we consider the case of a household having surplus labor relative to that needed to
cultivate its land (T − he − ℓ ≥ 0). Because of the existence of an off-farm labor market, labor
use in agriculture he (under either regime) solely depends on landholdings, not on family size.
It is the migrant/off-farm labor that absorbs the household’s surplus labor and depends on both
family size and landholding size. Households with larger families and/or smaller landholdings have
more members that either migrate or work in off-farm activities, but this difference is preexistent
relative to the certification. Hence, in this model the migration response to the certification is not
a function of family size.
The results have simple interpretations in terms of farm size since land is the key complementary
input to farm labor. Households with a sufficiently small land endowment cannot obtain their
opportunity cost by staying and cultivating land; they choose to surrender their land and work
off-farm. Households with a large land endowment have a high marginal product of labor and are
thus unaffected by the production constraint. These households optimally allocate all their labor
to agriculture while at the same time producing enough output to keep their land. Only households
with intermediate levels of land find themselves allocating more labor than would be optimal under
unrestricted optimization.
We argue that in the context of Mexican ejidos one can think of most households as belong-
ing to this intermediate range. First, consider that the objective of the original Mexican land
redistribution program was to provide land to as many landless people as possible. This gave the
government an incentive to minimize plot size subject to providing the household a livelihood (the
opportunity cost in the model). Second, because land transactions were not allowed prior to the
Procede program, farm sizes were maintained at the originally allocated size without allowing for
adjustments in response to the advent of mechanization in agriculture, which is thought to increase
the optimal farm size. Third, further evidence of excess labor in ejidos comes from the 1991 agricul-
tural census which indicates that the number of workers per hectare of land in the Mexican private
sector (non-ejido) was 40% of that in the ejido sector (World Bank, 2001).
3.3 Land certificates and migration
We now study the effect of relaxing the land use constraint on labor use, abstracting from the other
elements of the certification reform. We will see in sections 3.5 and 3.6 how other features of the
law, including relaxing constraints on the land and labor markets and a one time incorporation of
new members and conversion of land use, affect these predictions.
Procede certificates can be interpreted as allowing farmers to move from the restricted opti-
mization situation to the unrestricted situation. If the minimum labor allocation restriction was
11
binding (regime (ii) with A1 ≤ A ≤ A0), farm labor decreases with land certificates:
∆he = h∗e − he
while migrant labor increases by the opposite amount:
∆hm = he − h∗e =
(πmsγ
) 1β
A1−αβ −
(γβ
wm
) 11−β
Aα
1−β . (6)
In Figure 1, certification is represented by a vertical move from the restricted to the unrestricted
on-farm labor schedule. Leisure is unaffected because it is solely determined by the outside wage
wm. Note that, while the level of migration hm of a household depends on family size (equation 5),
this is not the case for the out-migration ∆hm induced by the land certificate (equation 6).
3.4 Heterogeneity in migration response to certification
This simple framework can be used to obtain comparative statics predictions resulting from house-
hold level heterogeneity. We show that the predicted migration response varies with strength of
the use-based property rights previously enjoyed, outside wages, farm size, and land productivity.
All comparative statics results are obtained by simple differentiation of equation (6).
- More insecure property rights are reflected as a lower s and thus a larger he. This shows that,
ceteris paribus, there is a higher migration response when property rights in the use-based
regime are more insecure.
- Higher wages lead to a higher level of migration hm through lower optimal leisure. Higher
off-farm wages also lead to larger migration responses to land certification. To see this, note
that constrained agricultural labor he does not depend on wages, while optimal agricultural
labor (h∗e) decreases with wages.
- Variation in land quality is captured by the productivity parameter γ. Higher land quality
reduces the minimum amount of labor necessary to reach the required yield under use-based
rights and increases the optimal farm labor. Both effects contribute to a reduction in the
excess labor imposed by use-based property rights. This suggests that farms with lower land
productivity have more outmigration when moving from a use-based to a title-based property
rights regime.
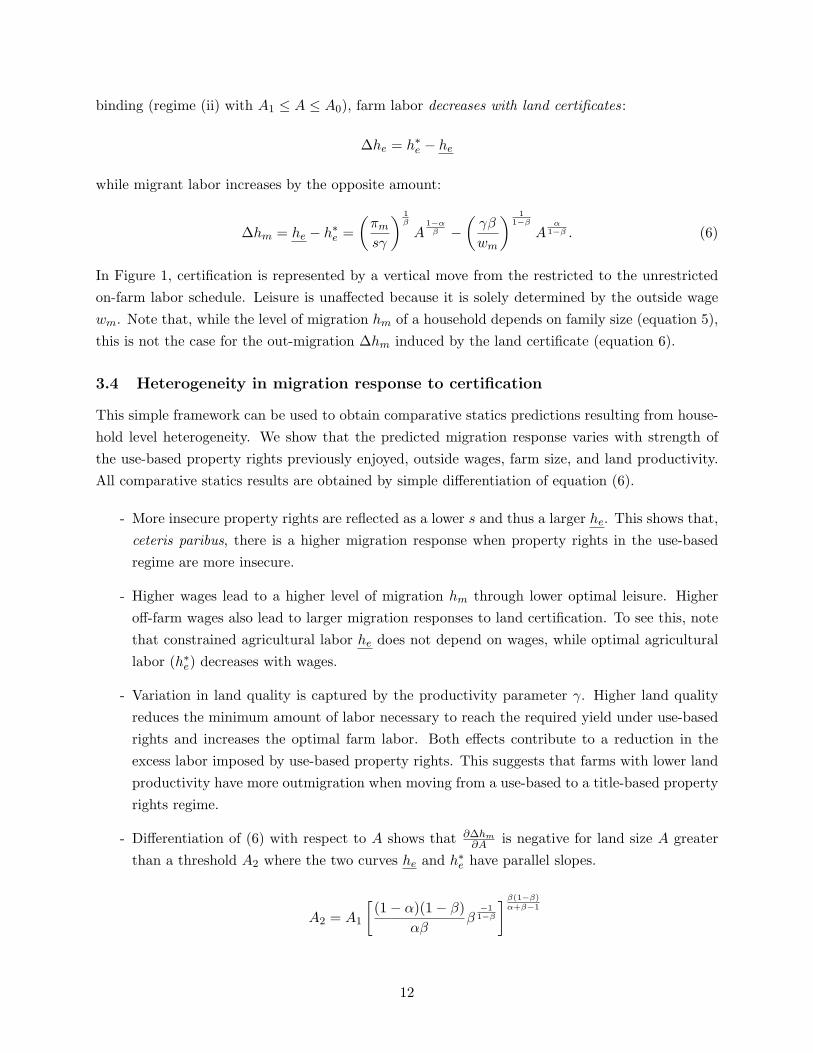
- Differentiation of (6) with respect to A shows that ∂∆hm∂A is negative for land size A greater
than a threshold A2 where the two curves he and h∗e have parallel slopes.
A2 = A1
[(1− α)(1− β)
αββ
−11−β
] β(1−β)α+β−1
12
The first term in the square brackets is smaller than 1, while the second term is greater than
1, meaning that A2 can either be greater or smaller than A1. Hence, migration induced by
relaxing the yield constraint decreases with farm size, except possibly for the smallest farms
still operating with A ∈ [A1, A2], if it is the case that A1 < A2. The case where A2 < A1
is depicted in Figure 1. In this case the vertical distance between the two curves is clearly
decreasing in A. This expression suggests that if there is heterogeneity in landholdings (A)
within ejidos, then the larger landholders should migrate less in response to certification.
This can be thought of as a sorting effect in which the larger farmers are more likely to stay
behind while the smaller farmers migrate more.
This expression also implies that the differential induced migration across farm sizes is sharper
in areas with higher land quality:
∂2∆hm∂γ∂A
< 0.
This prediction is economically important. It can be interpreted as saying that the migration
response of larger landholders in high productivity areas is lower than the migration response
of larger landholders in low productivity areas. An equivalent interpretation is that in low
productivity areas, the difference in migration response between small and large landholders
is not as different as that which arises in high productivity ones.
3.5 Land markets and land use
It is important to account for the legalization of land rentals when considering the effects of the
reform on land use. The model we presented considered how a household with a fixed land endow-
ment chooses between agricultural and non-agricultural labor. Under this framework, eliminating
the constraint imposed by usufructory rights leads to increased outmigration and an increase in
land fallowing would be a logical byproduct. In reality, Procede also made land rental and sale
transactions legal.11 While this was a formal aspect of the Mexican land reform, a more active
rental market is an oft-cited result of agricultural titling programs.
Allowing for land to change hands after Procede has two effects. First, it can reduce or fully
eliminate any decline in cultivated area that was expected due to the reallocation of labor away
from agriculture. To see this, note that farmers with intermediate landholdings between A1 and
A0 would be expected to increase migration and decrease cultivated area if the land market is
unavailable. However, introducing the opportunity to rent land makes it optimal for some farms
to increase cultivated area above their originally allotted landholdings. Under increasing returns
to scale, the farmers with the largest landholdings are those with the largest marginal gains from
cultivating additional area. Thus, efficiency would entail reallocation of land from smaller to larger
farmers.
11Deininger and Bresciani (2001) report observing an increase in land rentals in 1997 compared to 1994.
13
Allowing land transactions, together with the commonly recognized investment incentive brought
about by improved property rights, could also induce concentration of land in farm sizes beyond A0.
In this case, labor demand would further increase, and this would attenuate the migration effect
that we estimate. This is the outcome suggested by the standard property rights model in section
3.2 above. The fact that we still observe a large migration effect suggests that the land reallocation
from small to medium size farmers (up to A0 in the model) dominated the land concentration in
more labor intensive operations.
Second, allowing for land transactions will induce further heterogeneity in migration across
households according to landholdings. The demand for additional land by larger farmers increases
optimal agricultural labor use, thus decreasing the off-farm labor induced by certification. Con-
versely, smaller farmers that choose to rent out land will increase migration relative to the situation
where the land market was unavailable.
In summary, allowing for land reallocation has the potential to undo some of the inefficiency
imposed by the small farm sizes that were a feature of Mexico’s first land reform. We test this
explicitly in section 5.6 by estimating how the certification program affected the number of farmers,
area cultivated, and average farm sizes.
3.6 Labor markets and other provisions of the reform
Before moving to the data, we should explicitly acknowledge that the model focuses on the use
constraint and its effects in an environment with small landholdings (increasing returns to scale).
In doing so, it leaves out several additional factors that, while relevant, cannot explain the migration
responses to the reform.
Legalization of hiring labor is a feature of the reform that is not included in the model. Procede
eliminated the requirement that ejidatarios must use only family labor for cultivation. If hired labor
simply substituted for family labor, this would not affect aggregate community level migration.
Thus, our use of locality-level data is helpful in determining whether the opening of the labor
market offers an explanation for our migration results. We consider this issue in the empirical
analysis.
In addition, if Procede allowed for more efficient labor markets, we would expect it to induce
greater separation between household endowments and production decisions, as in Benjamin (1992).
We test for this in Section 5.8, and cannot reject that the correlation between household size and
cultivation was unchanged after Procede. It thus seems that the labor market has not played an
important role in explaining the migration effects of the reform.
A further provision of the reform is to allow for incorporation of new members into the ejido,
and on conversion of common property land into agricultural land that could be allocated to these
new members as well as original members. Munoz Pina, de Janvry, and Sadoulet (2003) show
that this opportunity has been taken up by a large number of ejidos: 35% of them converted and
divided some of their common property land and 42% incorporated new members. Note however
that neither can explain migration. To the contrary, allowing ejidatarios to increase the size of their
14
agricultural plots can only reduce their potential migration. And incorporation of new members
can only increase land use and demand for agricultural labor. By considering only ejidos that did
not have common area to divide, Figure A4 in the online Appendix12 shows evidence that division
of the commons is not responsible for the effects we observe on migration and land use.
Finally, the view we take in the model is that credit constraints are not the mechanism through
which Procede influenced migration. Some have argued that the existence of wage differentials
between urban and rural areas may be explained by credit constraints to migration (Levy and
Van Wijnbergen, 1995). By allowing land transactions to take place, certification could have allevi-
ated credit constraints and allowed for more migration. We investigate this alternative mechanism
empirically in section 5.8, but fail to find evidence for it.
4 Data
We use a total of six datasets in our analysis. First, our source of information on the rollout
of Procede is a set of ejido digital maps created during the certification process by INEGI and
managed by RAN. GIS ejido boundaries are available for the 26,481 ejidos that completed the
program during the period from 1993-2006.13 The rollout of the program was quite rapid. Nearly
half of all ejidos were fully certified by 1997 while all but a small subset of ejidos had completed the
program by 2006 (see Figure A1). Figure A2 in the online appendix maps the rollout of Procede
at the national level, helping visualize the extensiveness and national scope of the program.
The second dataset we use is the 1998-2000 Encuesta Evaluacion de los Hogares (ENCEL)
surveys administered in the evaluation of the anti-poverty program Progresa.14 The ENCEL data
consist of a panel of approximately 25,000 households from 506 poor localities that qualified for the
program in the states of Guerrero, Hidalgo, Michoacan, Puebla, Queretaro, San Luis Potosi, and
Veracruz. We matched the localities to ejidos using the coordinates of the centroid of the locality.
We considered the locality to match an ejido if the centroid of the locality was located inside the
boundaries of one of the ejidos in the GIS database. This process matched 200 localities to 195
different ejidos. Of these ejidos, 68 were certified in 1993-1996, 51 in 1997-1999, and 76 after 1999.
Our final data consist of an unbalanced panel of 7,577 households from ejidos that were certified
after 1996.15 Approximately 2.2% of these households had a migrant leave during 1997. Between
1998 and 2000 an additional 5.9% of households sent a migrant.
12Figures and Tables preceded by the letter A can be found in the online Appendix to the paper.13These data also include 246 ejidos that were in the process of certification but had not yet completed the program
during 2007. They do not include the remaining 2500 ejidos that were left to a special program after Procede closedin 2006.
14Progresa is the Mexican conditional cash transfer program started in 1997. The program is now referred to asOportunidades. Progresa localities were selected to have more than 50 but less than 2,500 inhabitants and have ahigh marginality index as computed from the 1990 population census and the 1995 population count information. Weuse the October/November 1998, 1999, and 2000 ENCEL surveys. The 1997 migration data were derived from recallsin the 1998 ENCEL survey. The 1997 ENCASEH baseline survey did not have comparable migration information.
15The panel is unbalanced due to attrition as well as addition of a small number of households to the sample in1999 and 2000. Our migration result is robust to estimation with a fully balanced panel of households.
15
Third, for the community level analysis, we use the 1990 and 2000 population censuses at the
locality level from INEGI. Approximately 75% of ejidos completed the program between these two
censuses. We matched locality centroids to ejidos using the spatial matching technique mentioned
above. The final data used in the regressions is a balanced two year panel of population and
certification status for 17,328 localities.16 These data cover all states of Mexico and therefore have
broader geographic coverage than the panel of Progresa households. Approximately 62% of the
localities in ejidos experienced a decline in population during the period from 1990-2000.
Fourth, we use the Ejido Census (Censo Ejidal) from INEGI that was administered to all ejidos
in Mexico in the years 1991 and 2007. The 1991 and 2007 matched surveys are not publicly available
and were merged by INEGI specifically for this study. Because the census data that were made
available to us did not identify the ejido by name, we created a matching algorithm that builds on
common variables in the two censuses and the ejido GIS maps to construct a matched dataset of
19,713 ejidos. The details of the matching algorithm are given in the online Appendix.
Fifth, we use data on farm support payments for the program PROCAMPO to study land cul-
tivation and consolidation. PROCAMPO is a flagship program that was established to compensate
farmers negatively affected by NAFTA. Plots that had been cultivated with major crops in the
1991-1993 production cycles were enrolled in the program (the period immediately preceding Pro-
cede) and owners were to receive fixed monetary payments per acre regardless of future crop choice
(if any). This allows us to track land use among a fixed set of plots that were cultivated prior to
the program and that account for much of the land in ejidos. Furthermore, because PROCAMPO
payments include the name of the person claiming the payment for every plot we can track changes
in farm size by summing claimed area for each owner/operator.
These data consist of approximately 45 million support payments that were made during the
period from 1995 to 2012. For each payment, we observe the beneficiary’s identification number, the
ejido, the crop cultivated, the area cultivated, and the amount received. The data are informative
of cultivation patterns in ejidos, as over 80% of ejidatarios claim PROCAMPO benefits. We
successfully matched 19,409 ejidos from these data to the data on the rollout of Procede.
Finally, we use INEGI GIS land use maps for the whole country. The data consist of Series
II, III, and IV of the INEGI land use/land cover maps. The data are based on a combination of
Landsat imagery taken during 1993, 2002, and 2007 and a series of field verifications by INEGI.
The digital ejido boundaries were overlaid on the land use maps to create a panel of land use at
the ejido level for the years 1993, 2002, and 2007. The median amount of agricultural land in 1993
among ejidos certified in 1993-2006 is roughly 240 hectares, while the median share of total ejido
area that is in agriculture is 27%. These figures rose slightly to 275 hectares and 32% by 2007.
16All regressions at the community level exclude localities that had population of 20 or less individuals in 1990.Small localities often disappear or are regrouped over time and we therefore drop them from the analysis.
16
5 Results
We start by describing in section 5.1 how the migration effect of certification is established using
three independent datasets. Following our model, sections 5.2 to 5.5 consider heterogeneous effects.
We then give in section 5.6 evidence that certification led to migration without a decline in cul-
tivated area. Finally, we consider effects on household consumption (section 5.7) and alternative
mechanisms (section 5.8) that could potentially explain our results.
5.1 Impact of certification on migration
First, we consider the panel of households from Progresa, which contains detailed demographic
variables and migration status of household members over the four years 1997-2000. The unit of
analysis is the household and the dependent variable is an indicator for whether the household has
a permanent migrant that left the ejido since the onset of our observations. The main estimating
equation is:
yijt = δCertifjt + γj + αt + xijtβ + εijt, (7)
where yijt is an indicator for whether household i in ejido j has a permanent migrant by year t,
Certifjt is an indicator for whether ejido j was certified at the beginning of year t, γj is an ejido fixed
effect, αt is a time fixed effect, xijt is a vector of household level covariates, and εijt is a random error
term. Standard errors are clustered at the ejido level for estimation. This is a standard fixed effects
regression where identification is coming from changes in migration behavior correlated to changes
in certification status. Any time-invariant ejido characteristic that is correlated with the program
rollout is accounted for by the ejido fixed effects. The identifying assumption is therefore that
any time-varying ejido characteristic that affects migration is uncorrelated with the distribution of
certificates. We provide support for the validity of this identification assumption in section 6 and
through the robustness checks reported in this section.
The Progresa dataset shows that land certification led to increased migration of individual
household members. In the first column of Table 1, the probability of a household having a migrant
increases by 0.015 after being reached by Procede. The average rate of migration during the sample
period is 5.3%, indicating that the effect of the program was to increase permanent migration by
28%.
This result is not sensitive to a variety of robustness checks. The second column shows that
the estimated program effect is almost identical when household level covariates are included in
the regression. This minimal change is consistent with the fact that certificates were distributed
to all ejidatario households in the ejido. Importantly, the regression in column 2 also controls
for an ejido-level time-varying measure of the value of agricultural production per hectare. One
concern with our identification is that the opening of the Mexican economy due to NAFTA may
confound our estimate. In particular, our estimate could be confounded by NAFTA if ejidos were
affected differentially over time in a way that was correlated with the rollout of the land certification
program. Since the influence of NAFTA on ejidos would operate through agricultural prices, we
17
use a measure of potential agricultural revenue per hectare that proxies for the impact of prices
on each ejido.17 The limited change in our main estimate when controlling for this measure of
potential agricultural value suggests that NAFTA is not a confounding factor.
The third column shows that the estimated coefficient is robust to replacing ejido fixed effects by
household fixed effects. A key concern for our identification strategy is the possibility of differential
time trends that would be correlated with the timing of certification. In columns (4)-(6) we show
that the results are robust to controlling for specific time trends more flexibly. In column (4)
we allow the time effects to be specific by state. Column (5) includes interaction terms between
each time effect and the household-level covariates. In column (6) we include interactions between
time effects and some ejido-level characteristics that are shown in de Janvry, Gonzalez-Navarro,
and Sadoulet (2013) to be correlated with the rollout of Procede. The purpose of this robustness
check is to control for the possibility that the program was initiated earlier in certain types of
ejidos that experienced differential changes in migration after the program due to reasons other
than land certification. For example, the program was completed on average earlier in ejidos that
are located closer to large cities. The fixed effects in our specification obviously account for time
invariant differences due to proximity to major cities. Allowing the time effects to depend on
proximity to cities further controls for differences in migration over time that are due to earlier
program areas being closer to cities rather than certification. Our main result remains economically
large and statistically significant after introducing several additional controls for differential time
trends. Overall, the behavior of households in the Progresa dataset firmly points to land certificates
increasing the probability that a household member migrates.
The second data source we use is the matched 1990 and 2000 locality-level population censuses.
The locality level analysis captures both migration of individuals and entire families. Three key
characteristics of this alternate dataset are its inclusion of localities of all sizes and levels of income,
its geographical coverage (nationwide), and its longer time span (up to 7 years with a certificate).
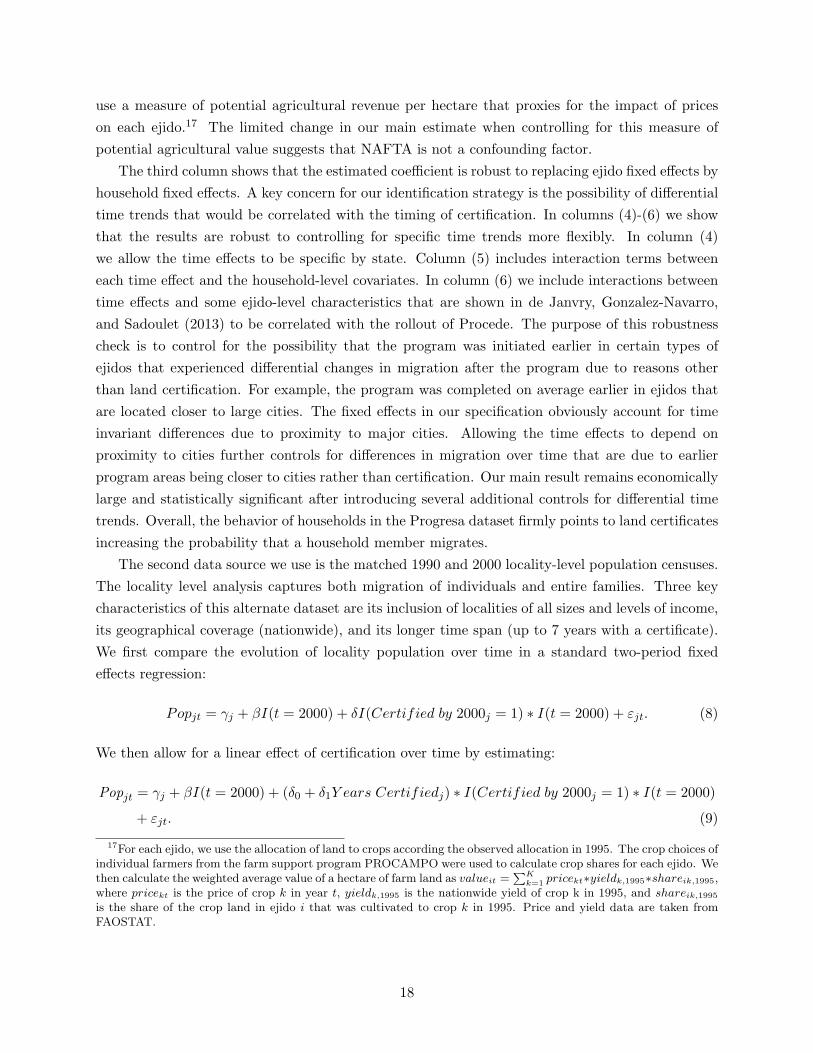
We first compare the evolution of locality population over time in a standard two-period fixed
17For each ejido, we use the allocation of land to crops according the observed allocation in 1995. The crop choices ofindividual farmers from the farm support program PROCAMPO were used to calculate crop shares for each ejido. Wethen calculate the weighted average value of a hectare of farm land as valueit =
∑Kk=1 pricekt∗yieldk,1995∗shareik,1995,
where pricekt is the price of crop k in year t, yieldk,1995 is the nationwide yield of crop k in 1995, and shareik,1995is the share of the crop land in ejido i that was cultivated to crop k in 1995. Price and yield data are taken fromFAOSTAT.
18
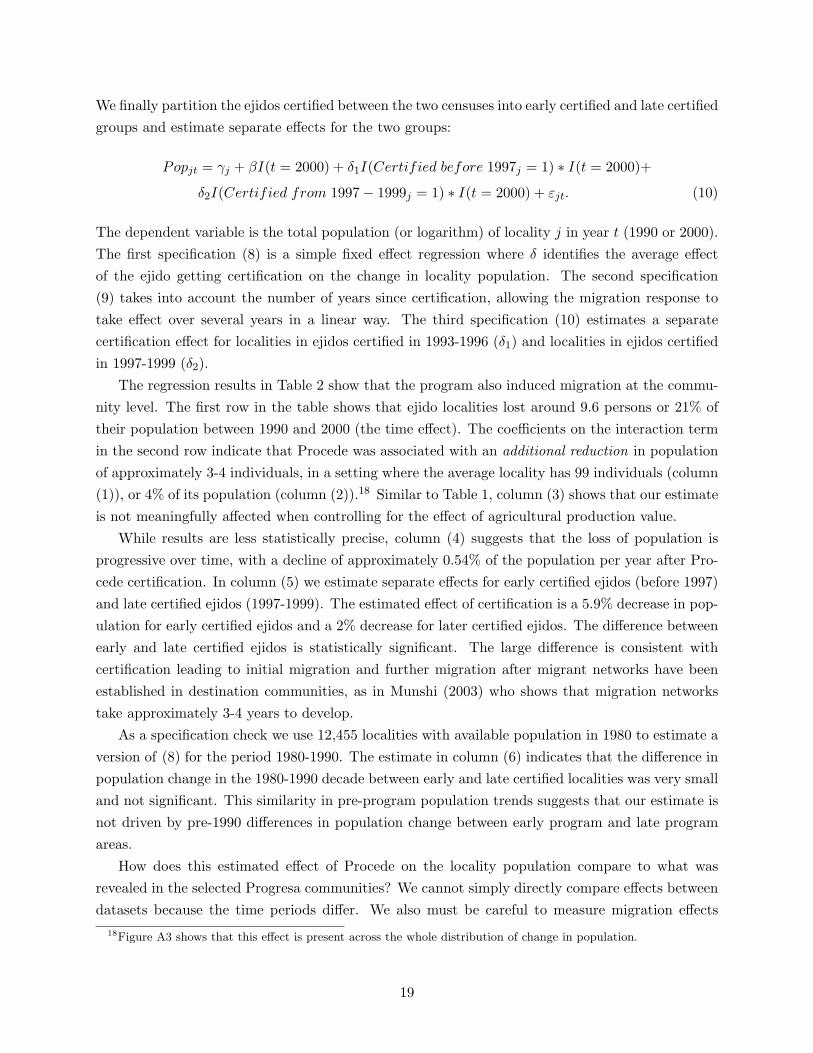
We finally partition the ejidos certified between the two censuses into early certified and late certified
groups and estimate separate effects for the two groups:
The dependent variable is the total population (or logarithm) of locality j in year t (1990 or 2000).
The first specification (8) is a simple fixed effect regression where δ identifies the average effect
of the ejido getting certification on the change in locality population. The second specification
(9) takes into account the number of years since certification, allowing the migration response to
take effect over several years in a linear way. The third specification (10) estimates a separate
certification effect for localities in ejidos certified in 1993-1996 (δ1) and localities in ejidos certified
in 1997-1999 (δ2).
The regression results in Table 2 show that the program also induced migration at the commu-
nity level. The first row in the table shows that ejido localities lost around 9.6 persons or 21% of
their population between 1990 and 2000 (the time effect). The coefficients on the interaction term
in the second row indicate that Procede was associated with an additional reduction in population
of approximately 3-4 individuals, in a setting where the average locality has 99 individuals (column
(1)), or 4% of its population (column (2)).18 Similar to Table 1, column (3) shows that our estimate
is not meaningfully affected when controlling for the effect of agricultural production value.
While results are less statistically precise, column (4) suggests that the loss of population is
progressive over time, with a decline of approximately 0.54% of the population per year after Pro-
cede certification. In column (5) we estimate separate effects for early certified ejidos (before 1997)
and late certified ejidos (1997-1999). The estimated effect of certification is a 5.9% decrease in pop-
ulation for early certified ejidos and a 2% decrease for later certified ejidos. The difference between
early and late certified ejidos is statistically significant. The large difference is consistent with
certification leading to initial migration and further migration after migrant networks have been
established in destination communities, as in Munshi (2003) who shows that migration networks
take approximately 3-4 years to develop.
As a specification check we use 12,455 localities with available population in 1980 to estimate a
version of (8) for the period 1980-1990. The estimate in column (6) indicates that the difference in
population change in the 1980-1990 decade between early and late certified localities was very small
and not significant. This similarity in pre-program population trends suggests that our estimate is
not driven by pre-1990 differences in population change between early program and late program
areas.
How does this estimated effect of Procede on the locality population compare to what was
revealed in the selected Progresa communities? We cannot simply directly compare effects between
datasets because the time periods differ. We also must be careful to measure migration effects
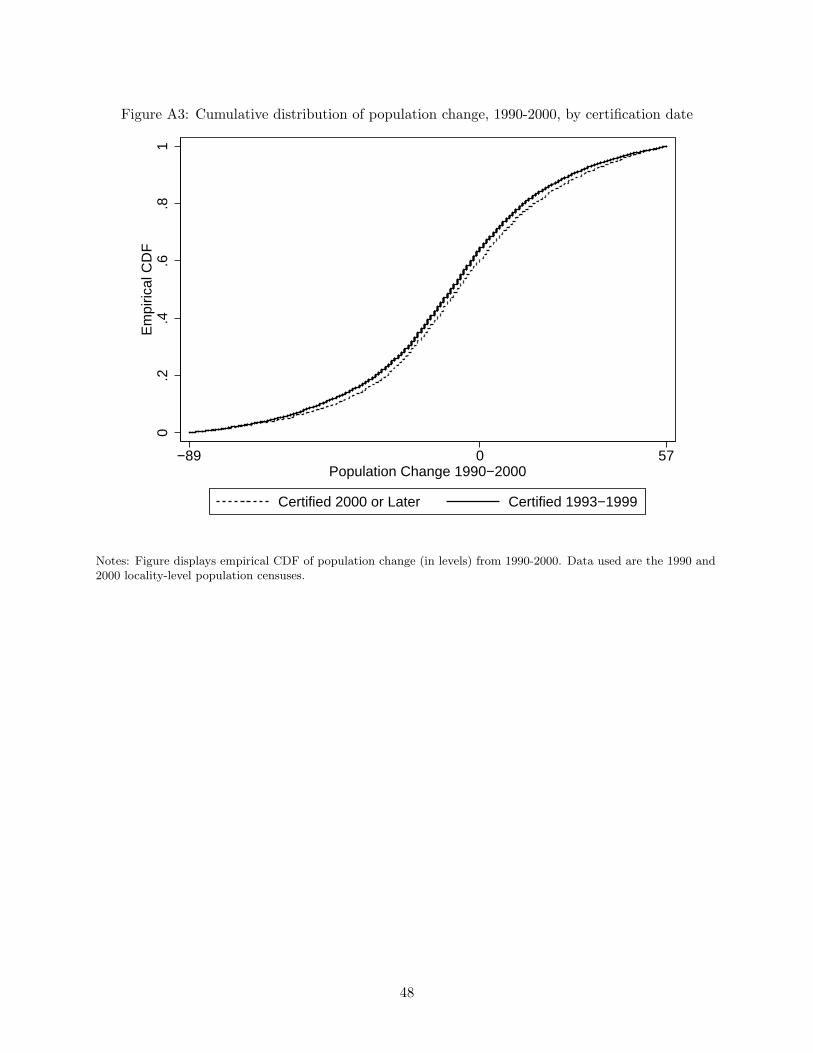
18Figure A3 shows that this effect is present across the whole distribution of change in population.
19
annually, rather than over a period of several years. The Progresa data document annual emigration
from 1997 to 2000, in localities that were certified from 1997 onwards. The most direct comparison
can thus be drawn with column (5) of Table 2 where we also estimate the program effect during
this time period. The time effect shows a baseline migration of 20.7% of the population over 10
years, which corresponds to an average annual rate of 2.3%. The certification effect for those ejidos
certified in 1997-99 is an additional effect of 1.96% over these 3 years, or an average annual effect of
0.7%. Hence Procede led to an increase of the annual loss of population of 29% (=0.7/2.3). Recall
that the average annual effect in the Progresa dataset was an increase in migration by 28%. So
while we looked at different measures of migration in the two datasets (households sending off one
permanent migrant in the Progresa dataset and population change in the locality dataset), we find
that Procede has had the same relative effect of increasing migration by an additional 28-29%.
As a third dataset, we use the 1991 and 2007 ejido censuses. By 2007, all the ejidos in our
dataset had been certified. Hence we can only identify the effect of certification coming from the
differential number of years an ejido has been certified in 2007. Furthermore, because the migration
question was not asked in the first round, we can only perform a cross sectional regression. Our
dependent variable is the response to a question from the 2007 census asking if the majority of
young people leave the ejido. We simply regress this indicator on the number of years the ejido
was certified in 2007, and a set of control variables, including state fixed effects.
This is obviously a less well identified regression than those reported using the previous two
datasets. However, this specification is justified by the result in Table 2 suggesting that the effect
of certification is increasing over time. Second, the ejido census has the advantage that the unit of
observation coincides perfectly with the population of interest, because questions are asked about
the group of ejidatarios in each particular ejido. Finally, this is the only dataset we use that does
not necessitate a geographical merge. Hence, we see this as an important verification of the results
presented in the previous two tables.
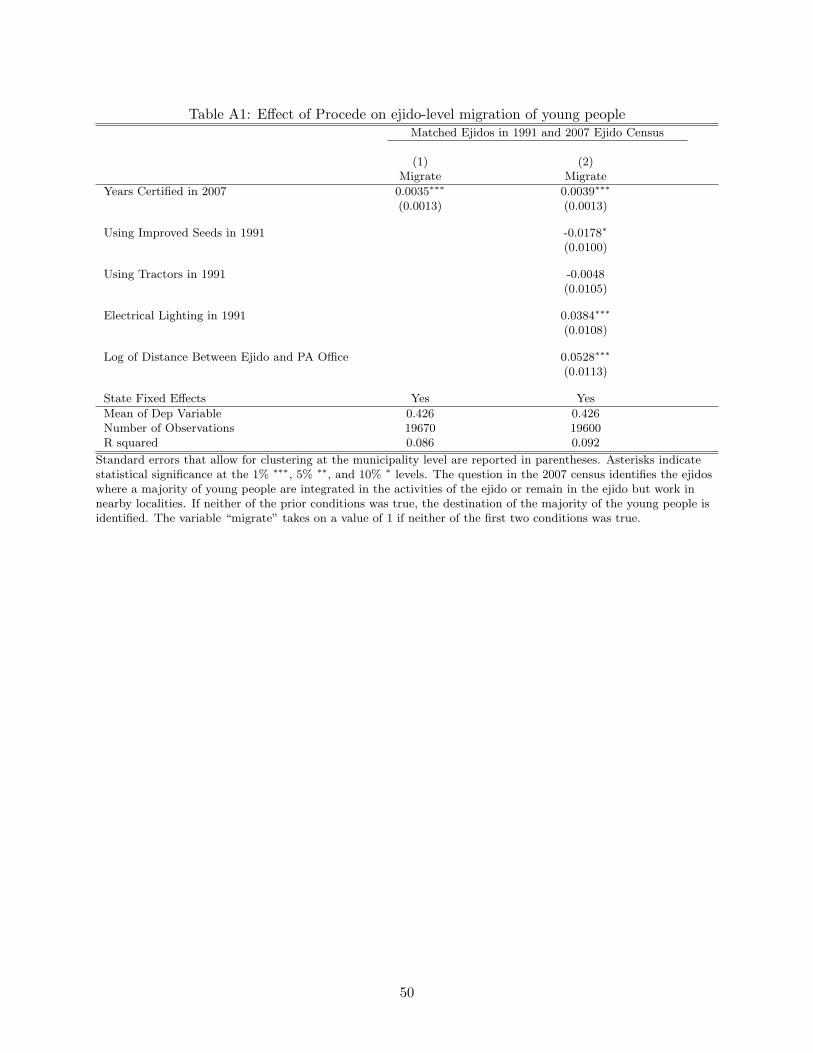
Results in Table A1 show a positive association between the years since certification and the
probability that the majority of young people migrate from the ejido. More specifically, certified
ejidos are 0.35% more likely to respond that a majority of their young people emigrate from the ejido
for every year since certification. The average ejido had been certified 9.5 years in 2007, meaning
that for the average ejido, the probability that a majority of young people would be leaving the
ejido increased by 7.8 percentage points due to the Procede program.
By presenting results from three independent datasets, we seek to credibly establish that delink-
ing property rights from use requirements generated by the assignment of land certificates led to
increased migration from agrarian communities. The number of households having a migrant in-
creased by 28%, the locality population declined by 4%, and ejidos were 0.35% more likely to report
that a majority of their youth were leaving the community for every year they had been certified.
Applying these migration effects to the 1.7 million population of the localities matched to ejidos
(17,328 localities with average population of 99.1 as reported in Table 2 column(1)) suggests that
Procede would have been responsible for an outmigration of about 4% of them or almost 70,000
20
people. This should be compared to the natural trend of a loss of 20.7% or 350,000 people in these
communities over 10 years.
Before considering heterogeneity, we explicitly acknowledge that the exercise will not allow us
to validate our model. Rather, we consider the exercise as a useful way of understanding whether
the data are consistent with the model we have proposed.
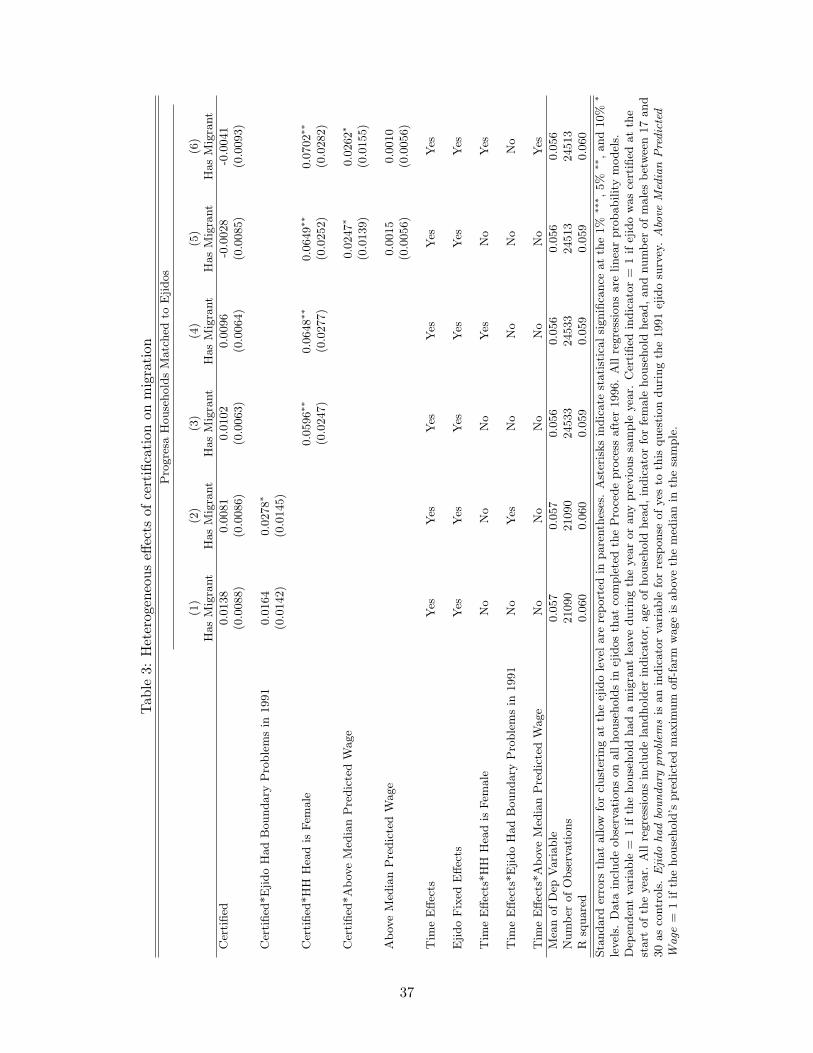
5.2 Heterogeneity in pre-reform property rights security
The model predicts that the migration response to land certification should be larger when pre-
reform property rights were weaker (∂∆hm∂s < 0). As a measure of between ejido security, we
use a question from the 1991 ejido census on the presence of boundary problems with neighbors.
Column (1) of Table 3 shows that the point estimate of the migration effect of certification is
more than double for households in ejidos where boundary problems were present. A concern
with this specification is that migration could increase over time in ejidos with boundary problems
independent of certification. We control for differential time effects in column (2). The difference
between ejidos with and without boundary issues becomes larger with the addition of specific
time effects. The effect of certification on the probability of having a migrant household member
increases from 0.008 for households in ejidos without boundary problems to 0.036 for households
in ejidos with problems. This difference is significant at the 10% level.
Next, as a measure of within ejido insecurity, we use an indicator for a female headed household.
Work by social observers indicates that, prior to Procede, female ejidatarias held low status inside
the ejido (Stephen, 1996; Deere and Leon, 2001; Hamilton, 2002). For example Stephen (1996,
p.291) quotes an ejidataria from Oaxaca as stating, “Women don’t participate in ejido assemblies.
The men in our community don’t let us participate in meetings.” Based on interviews conducted in
four ejidos in northern and central Mexico, Hamilton (2002) points out that women were susceptible
to expropriation by male relatives or friends of high-level ejido officials. This anecdotal evidence
prompted the use of a female-headed household dummy as a proxy for weaker ex-ante property
rights. We must however interpret our result with caution since female headed households are
almost certainly different for reasons other than s in our model.
Columns (3) and (4) show that indeed the effect of certification on migration of household
members is significantly larger for female headed households. The magnitude of the coefficient
is quite large. The subset of households with female heads is small but not trivial, consisting of
around 10% of the population. The marginal effect of certification for these households represents
an approximate doubling in the probability that the household has a migrant (marginal effect of
Procede of 0.065 compared to the mean value of 0.056). These effects contrast with the smaller
impact for male-headed households.
These results are consistent with improvements in property rights brought about by land certifi-
cates having much larger effects for households with weaker rights prior to certification. In terms
of the model, we interpret this as individuals with weaker property rights (lower s) being more
constrained prior to the program and thus having to dedicate more labor to the farm to maintain
21
their land. Hence, receipt of land certificates resulted in a larger migration response for these
households.19
5.3 Heterogeneity in off-farm wages
We derive an empirical measure of off-farm wage opportunities by using the 1994 Encuesta Nacional
de Ingresos y Gastos de los Hogares (ENIGH) household survey to estimate off-farm wages as a
function of gender, years of education, the interaction between gender and years of education, a
quadratic function of age, and a state fixed effect. We limit this estimation to wage earners that
were 18-50 years old since this population is more representative of the population of potential
migrants. We then used the wage equation to predict wages for each adult in the set of Progresa
households matched to ejidos. The maximum predicted off-farm wage amongst adults 18-50 was
taken as the household’s off-farm wage opportunity.20 In columns (5) and (6) of Table 3 we
estimate a separate certification effect for households above and below median values of off-farm
wage opportunity. The difference in migration response to certification between households with
high and low wage opportunities is statistically significant at the 10% level. Using the results from
column (6), the estimated increase in the certification effect for male headed households that have
above median off-farm wage opportunities is 0.026 and is statistically significant at the 10% level.
These results are consistent with the theoretical prediction that the migration response should be
larger for households that have higher wage opportunities outside of agriculture (∂∆hm∂wm
> 0).
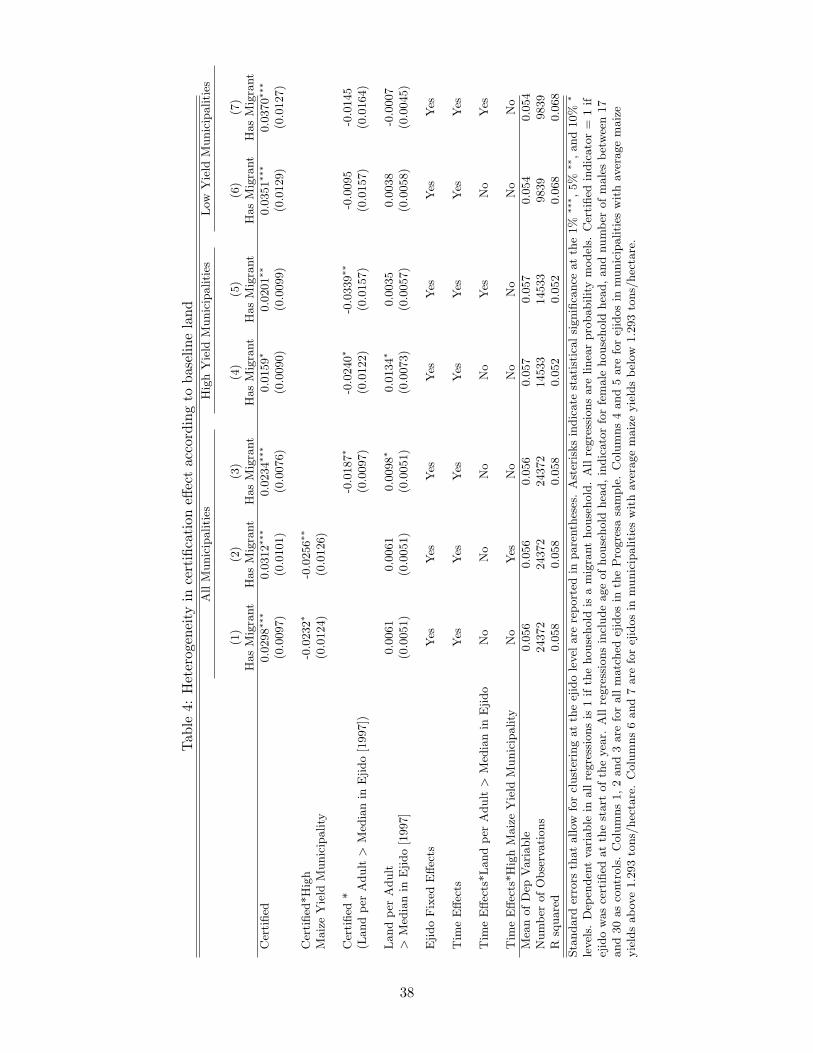
5.4 Heterogeneity in land productivity
The theory predicts that certification leads to a smaller migration response in places with higher
land productivity (∂∆hm∂γ < 0). A commonly used measure of land productivity in Mexico is rainfed
corn yield. This measure has the advantage of its geographical coverage, as corn is the staple food
grown all over the country. However it is only systematically available at the municipality level
and since 2002 from SAGARPA (Ministry of Agriculture). We use the average corn yield over
the period 2002-2008 as the measure of land productivity, and partition agricultural land as high
or low productivity at the median yield of 1.29 tons per hectare. Columns (1) and (2) of Table
4 show that, as predicted, the migration response to certification is weaker (and almost null) in
ejidos where land is more productive.
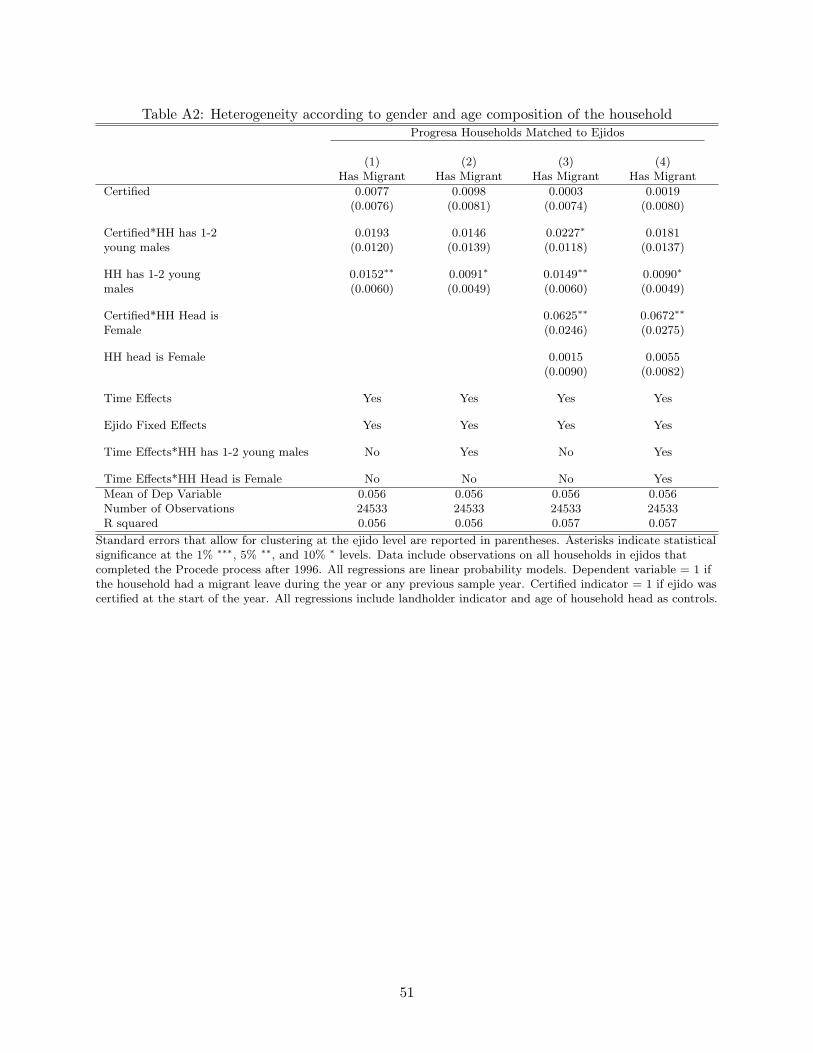
19One potential issue with this interpretation is that the gender of the household head may reflect the availableoff-farm labor of the household. In Table A2, we show that households with 1-2 young males in the age range from17-30 are if anything, more likely to respond to the program with migration. We also show that controlling for anindicator for whether the household has 1-2 young males and an interaction between this variable and the certificationindicator does not change the female household head results. Thus, the result does not appear to be due to availabilityof potential migrants.
20Predicted wage was set to 0 if the household did not have any individuals in the 18-50 years old range.
22
5.5 Heterogeneity in land endowments
The model predicts a smaller migration effect for farmers with more land. Column 3 in Table 4
shows evidence that this holds in the data. The coefficient for relatively large landholders21 is only
1/5 of that for small landholders.
The final prediction derived in the model is that large farmers in productive regions are expected
to respond the least to certification with labor re-allocation (∂2∆hm∂γ∂A < 0). We test for this by
splitting the sample into low and high productivity areas (using the maize yield variable defined
above) and estimating the effect of the program for large and small landholders (using the large
landholder variable defined above). The results are striking. In low productivity areas, columns
(6) and (7), larger landholders are not significantly less likely to migrate than land poor farmers.
The coefficient is negative but insignificant. In contrast, in high productivity areas, columns (4)
and (5), larger landholders increase their migration significantly less than land poor farmers. In
fact, the overall effect of certification for land-rich households in high productivity areas is not
statistically different from zero. In sum, these results are consistent with the prediction of the
model that households are sorted according to the size and quality of their landholdings: larger,
more productive farmers stay on the farm, whereas smaller more marginal farmers respond to the
removal of use requirements by having more members migrate.
5.6 Impact of certification on land use
Section 3.5 pointed out that the effects of Procede on cultivated area are more ambiguous than
our model predicts on the surface. The model considered an autonomous household deciding how
to allocate labor on and off the farm. The freedom provided by certification makes constrained
households allocate less labor to the farm. Decreasing cultivated area is a potential byproduct of
the decreasing labor share in agriculture.
However, the opening of the land market leads to two reasons why land reallocation after
Procede can be expected. First, the program alleviates the problem of inefficiently small farm sizes
by allowing consolidation of production units in a context of increasing returns to scale. Second, if
some farmers are more productive than others, certification can allow for realization of gains from
trade through land markets.
We use the data on PROCAMPO beneficiaries to investigate land consolidation. These data
allow us to measure both the number of farmers actively cultivating and the total area sown at the
ejido-year level. In order to allow time for potential consolidation to occur, we compare long-term
changes in the number of cultivators and area between the two sample endpoints. The empirical
specification is
∆ln(yjs) = αs +2004∑
τ=1993
βτ ∗ ProcedeY earτ,js + εjs, (11)
21We use an indicator variable which is equal to one if a family has more land per adult than the median in theejido in 1997.
23
where yjs is the outcome (either number of producers, total area, or average farm size) for ejido j
in state s, and ProcedeY earτ,js is an indicator for whether the ejido had the program completed
in year τ . The estimates of β are identified from variation in program completion within states.22
The data show evidence of migration after Procede, but also show evidence consistent with
consolidation of agricultural land. Figure 2 shows the estimates of βτ for total number of farmers,
total area, and area per farmer. The left panel shows a clear pattern of migration – or at least
exit from agriculture – where declines in the number of farmers cultivating land were largest in
ejidos that had the program completed earliest. The same pattern is however not apparent when
considering area cultivated, as shown in the second panel. The third panel shows that relative to
ejidos certified at the end of the program, farm sizes increased by around 10% for ejidos certified
during 1995 or earlier. We interpret this as evidence of farm consolidation, suggesting that an
important consequence of land certification is to reduce the prevalence of inefficiently small farms.23
Our second strategy to assess changes in land use is to test for aggregate changes in the amount
of cultivated land in the ejido using satellite imagery from 1993, 2002, and 2007.24 We estimate the
reduced form impact of certification on the logarithm of cultivated area in a standard fixed effects
where j indexes ejidos and t refers to the year of the land use observation. The longer duration
between satellite observations makes this analysis akin to the analysis of differences in (11).
Results reported in column (1) of Table 5 show that these data produce a similar result that
certification had no significant effect on the total area used for agriculture within the ejido. The
coefficient is actually positive, very small (0.1%), and statistically insignificant.
There is however some evidence that the area response differs by land quality. Column (2)
shows that cultivated land actually increased with certification in agriculturally favorable regions
but decreased (though not significant) in lower land quality areas. In column (3), we add controls
for differential time trends in high and low yield areas.25 The estimated coefficient shows that
certification is associated with an insignificant decline of cultivated land in low-yield regions. Point
estimates range from -0.8 to -1.8%. In contrast, agricultural land increases with certification in
high agricultural productivity areas. The point estimate ranges from 1.3 to 1.6%, and the difference
between favorable and non-favorable areas is significant.26
22The base group is ejidos for which the program was completed during 2005 or later.23One alternative interpretation discussed in section 3.6 is that division of areas previously held in common led to
increases in cultivated area that offset any decreases due to migration and land fallowing. Figure A4 shows that thisis not the case by showing the the effects are very similar for the 25% of ejidos that did not have any common landat baseline.
24These data correspond to INEGI GIS land use series II, III and IV.25As another robustness check on the resolution of the Landsat images, we ran all the regressions in Table 5 after
dropping the smallest 5% of ejidos. The coefficients change only minimally and statistical significance is unaffected(results not reported).
26In additional analysis, we use satellite images on the overall change in cultivated area from 1993-2007 to verifythat the population declines after Procede are largest in areas where cultivated area declined the most (see Table
24
Taking all results together, the additional analysis on land use demonstrates that the multiple
features of the reform interact to produce migration at the same time as land consolidation. In
particular, relaxation of the minimum production constraint produces migration and a declining
labor share in agriculture, while the opening of the land market induces farmers to reallocate land
rather than take it out of production. Therefore, the reform succeeded in shifting labor out of
agriculture without affecting overall levels of production and redirecting agriculture toward the
better endowed areas.
5.7 Effects of land certification on household consumption expenditures
How does land certification affect household-level consumption? If more secure rights to land allow
households to allocate labor more optimally, then this could translate into increased consumption.
To investigate this, we use the consumption modules in four rounds of the ENCEL surveys from
Progresa. The specific surveys were carried out in May 1998, October 1998, June 1999, and
November 2000, hence they allow us to capture any short run effects on consumption. Each survey
had a detailed consumption module that allows us to calculate monthly expenditures per household
member for both food and nonfood items.27 43% of the households from our main sample had the
program completed in this interval.
While we do not observe an effect on overall consumption across both categories, the data
show a moderate increase in consumption in areas of low land quality where migration effects were
the strongest. This is seen in column (2) of Table 6, with certification inducing a 7.5% increase
(p=0.07) in monthly consumption per capita in low-productivity areas.
In addition, certification led to a large increase in consumption of nonfood items. While the
overall effect of 4.7% in column (3) is not statistically significant, column (4) shows that nonfood
consumption rose by 16.7% for households in ejidos that had been certified for at least six months
at the time of the survey. In contrast to nonfood consumption, columns (5) and (6) show that
Procede had no effect on the consumption of food items.
These consumption results, although modest, should be interpreted as being short term. They
are also useful in ruling out a political economy story in which the most powerful ejidatarios
obtained a disproportionate share of ejido lands during the land registration process by driving out
weaker ejido members. Increased consumption is inconsistent with this. While we can’t definitively
say that consumption effects are due to migration, the result is consistent with land certification
allowing for a more efficient allocation of labor and thus an increase in welfare.
A3). These results suggest that migration effects correlate with land use change, but on average, the legalization ofland reallocation allows for consolidation and limits effects on overall cultivated area.
27Nonfood items include transportation, medicine, fuel and electricity, hygiene products, clothing, and home ac-cessories.
25
5.8 Alternative mechanisms from certification to migration
While the view taken in this paper has been that increased migration caused by land certification
is a result of relaxing the land use constraint, there is an alternative mechanism that would also
be consistent with increased migration. Namely, land certification could have relaxed liquidity
constraints by allowing poor households to sell or rent their land and use those funds to finance
migration.28 While this would not invalidate the link between certification and migration, it refers
to a completely different cause of increased migration. In particular, it would imply that credit
constraints were the critical factor holding people in agriculture, not the land use requirement.
One way to distinguish between these two competing explanations is by taking advantage of
the Progresa experiment. Progresa randomly allocated cash transfers across villages in our sample
to poor households equivalent to 140% of monthly food consumption per adult (Angelucci and
De Giorgi, 2009). Because the cash payments were awarded to the poorest families, Progresa
would have alleviated liquidity constraints in households where the restriction was more likely
to be binding. Evidence consistent with Progresa alleviating liquidity constraints and inducing
migration is shown in Angelucci (2013). Table A4 verifies that this same result holds in our sample
of households located in ejidos.
We exploit this variation in liquidity constraints created by Progresa to investigate whether
Procede induced more migration in areas where liquidity constraints were more binding. More
specifically, liquidity constraints would have been less binding in Progresa treatment villages when
Procede arrived.29 Hence if liquidity constraints explain our results, then we should observe smaller
effects of certification in Progresa treatment villages. We test for this by estimating the following
regression for the sample of poor households that were eligible for Progresa:
An estimate of δ2 < 0 would be evidence that liquidity is the mechanism causing certification
to increase migration. Note that the ejido fixed effects allow for the direct effect of Progresa on
migration that is shown in Table A4.30
The results in columns (1) and (2) of Table 7 do not support the liquidity constraints explanation
of our results. The specification in column (1) shows that if anything, the migration effect is larger
in Progresa treatment villages. The same story holds in column (2) where we allow for differential
28In the context of Mexico, McKenzie and Rapoport (2007) have shown that migration to the U.S. is related towealth.
29Note that in our Progresa estimation sample we are only using the survey rounds in which Progresa had alreadybeen implemented -the baseline round had no information on migration outcomes-, whereas Procede occurs withinthe sample period, hence any effects of Progresa are absorbed by the ejido fixed effects.
30We use ejido fixed effects to maintain consistency with our previous specification. Fully absorbing the directeffect of Progresa would require locality fixed effects. The practical difference between ejido and locality fixed effectsis minimal because the match between localities and ejidos is near one to one. To demonstrate this more clearly,we regressed the Progresa treatment locality indicator on the set of ejido fixed effects for the period from 1998-2000when payments were distributed to treatment localities. Ejido fixed effects explain 98% of the variation in Progresatreatment at the locality level.
26
time trends in Progresa treatment villages. We hence reject the hypothesis that Procede simply
relaxed liquidity constraints and allowed people to migrate.
5.9 Rural labor markets
Hiring outside labor was technically illegal prior to Procede. One possibility is therefore that ejido
households substituted hired labor for family labor, thus allowing family members to migrate.
However, recall that the estimates from the locality level regressions (which correspond to net
migration) were of similar order of magnitude to the individual household estimates. This suggests
that substituting hired labor for family labor was not an important phenomenon in the data.
We can nonetheless inquire whether Procede led to more efficient rural labor markets. Benjamin
(1992) shows that frictions in rural labor markets generate non-separation between production and
consumption decisions. In our context, the correlation between household size and the amount of
land cultivated can be expected to decrease after completion of Procede. The intuition is that a
large labor endowment was necessary to cultivate a large amount of land prior to the program. If
the program had a significant impact on the labor market, then this correlation should decrease
where yjt is average migration at the ejido level, and other variables are indicators for the year
of, year before, and two years before program completion. The β coefficients indicate whether
migration levels were significantly different than average in the ejido during the years directly
before the program.
We do not find evidence of this. Column (4) of Table A5 gives the results. The point estimates
are very small and statistically insignificant (the smallest p-value is 0.84), yet the standard errors
are large. An ideal result of the regression would be a set of precisely estimated zeros on the three
indicator variables. While we cannot reject large coefficients, it is reassuring that there are no
obvious significant changes in migration in the years leading up to completion of the program. We
interpret the combined results in the table as providing no clear evidence that our identification
strategy is biased by correlation between program completion and pre-program migration.
Finally, another potential issue of concern is attrition of households from the ENCEL survey.
11.2% of households with an interview completed in 1998 did not have an interview completed in
1999. The percentage rose slightly to 12.7% in 2000.32 In Table A6 we run the basic regression
used to identify the role of Procede on migration, equation (7), on attrition. The coefficient of
the certified variable is both insignificant and very small. There is therefore no evidence that the
31The base group is composed of ejidos certified in 1998 since we require the ejido to be certified at the start ofthe year to be considered as certified for that year.
32We define attrition as the interview not being conducted for any purpose.
28
migration effect we estimate could be due to selective attrition.
7 Conclusions
Delinking land rights from land use has been the focus of a number of large land certification
programs. In this paper, we showed that if property rights were tied to land use requirements
in the previous regime, these policy reforms can induce increased outmigration from agricultural
communities. We provided evidence on this phenomenon by analyzing the Mexican ejido land
certification program which, from 1993 to 2006, awarded ownership certificates to farmers on about
half the country’s farm land.
We used three independent datasets to document a strong migration response in agricultural
communities where certificates were issued. Families that obtained certificates were subsequently
28%more likely to have a migrant household member and the locality’s overall population fell by 4%.
The estimated effect increased over time. In addition, we documented heterogeneity in migration
effects according to the ex-ante level of property rights insecurity, level of off-farm opportunities,
initial farm size, and land quality.
Building on our migration results, we also considered whether total cultivated acreage decreased
after the program. We found that, on average, the program did not lead to decreases in cultivated
area. Combining this with the migration results, land certification led to consolidation and larger
average farm sizes.
Overall, the evidence shows that certification of ownership increases the efficiency of labor
allocation across space by inducing smaller and lower productivity farmers to migrate, while leaving
higher productivity farmers in place and allowing them to cultivate more land. Because smallholder
farmers are the ones most likely to leave after certification, efficiency gains are accompanied by
immediate benefits for them. These results are consistent with a model where the key constraint
imposed by insecure property rights is the requirement of continued presence and cultivation . The
empirical evidence is not consistent with alternative explanations such as liquidity constraints or
better-functioning labor markets.
Our results suggest that the permanent reallocation of labor between sectors of the economy
can be an important pathway through which formal land rights affect economic performance. This
adds to the literature on property rights which focuses on investment and increased access to credit
as key pathways between rural land reform and economic growth (Galiani and Schargrodsky, 2011).
The importance of agricultural labor productivity in explaining variation in aggregate output across
countries suggests that enhancing agricultural labor productivity and allowing for consolidation of
farmland into larger units can possibly have large effects on growth (Restuccia, Yang, and Zhu, 2008;
Adamopoulos and Restuccia, 2014). Our results indicate that removing the barriers to migration
through property rights reforms is one way to achieve this.
29
References
Adamopoulos, Tasso and Diego Restuccia. 2014. “The Size Distribution of Farms and International
Productivity Differences.” American Economic Review 104 (6):1667–1697.
Alchian, A.A. and H. Demsetz. 1973. “The Property Right Paradigm.” Journal of Economic
History 33 (1):16–27.
Alston, L.J., G.D. Libecap, and R. Schneider. 1996. “The Determinants and Impact of Property
Rights: Land Titles on the Brazilian Frontier.” Journal of Law, Economics, and Organization
12 (1):25–61.
Angelucci, Manuela. 2013. “Migration and Financial Constraints: Evidence from Mexico.” forth-
coming, Review of Economics and Statistics .
Angelucci, Manuela and Giacomo De Giorgi. 2009. “Indirect Effects of an Aid Program: How Do
Cash Transfers Affect Ineligibles’ Consumption?” American Economic Review 99 (1):486–508.
Appendini, Kirsten. 2002. “Land Regularization and Conflict Resolution: The Case of Mexico.”
Land Reform, Land Settlement and Cooperatives 2:37–50.
Ashenfelter, Orley. 1978. “Estimating the Effect of Training Programs on Earnings.” Review of
Economics and Statistics 60 (1):47–57.
Benjamin, D. 1992. “Household Composition, Labor Markets, and Labor Demand: Testing for
Separation in Agricultural Household Models.” Econometrica 60 (2):287–322.
Besley, T. 1995. “Property Rights and Investment Incentives: Theory and Evidence from Ghana.”
Journal of Political Economy 103 (5):903–937.
Besley, T. and M. Ghatak. 2010. “Property Rights and Economic Development.” In Handbook of
Development Economics, vol. 5. 4525–4595.
Chernina, Eugenia, Paul Castaneda Dower, and Andrei Markevich. 2013. “Property Rights, Land
Liquidity and Internal Migration.” forthcoming, Journal of Development Economics .
Cordova, Arnaldo. 1974. La politica de masas del Cardenismo. Ediciones Era.
Cornelius, W.A. and D. Myhre. 1998. The Transformation of Rural Mexico: Reforming the Ejido
Sector. Center for U.S.-Mexican Studies, University of California, San Diego.
de Brauw, Alan and Valerie Mueller. 2012. “Do Limitations in Land Rights Transferability Influence
Mobility Rates in Ethiopia?” Journal of African Economies 21 (4):548–579.
de Ita, A. 2006. Land Concentration in Mexico after PROCEDE. Oakland, CA: Institute for Food
and Development Policy.
30
de Janvry, A., M. Gonzalez-Navarro, and E. Sadoulet. 2013. “Are Land Reforms Granting Com-
plete Property Rights Politically Risky? Electoral Outcomes of Mexico’s Certification Program.”
forthcoming, Journal of Development Economics .
de Janvry, A., G. Gordillo, and E. Sadoulet. 1997. Mexico’s Second Agrarian Reform: Household
and Community Responses, 1990-1994. Center for US-Mexican Studies, University of California,
San Diego.
De Soto, Hernando. 2000. The Mystery of Capital: Why Capitalism Triumphs in the West and
Fails Everywhere Else. New York: Basic books.
Deere, Carmen Diana and Magdalena Leon. 2001. Empowering women: Land and property rights
in Latin America. University of Pittsburgh Press.
Deininger, Klaus. 2003. Land Policies for Growth and Poverty Reduction. Washington D.C.: World
Bank Publications.
Deininger, Klaus and F. Bresciani. 2001. “Mexico’s Second Agrarian Reform: Implementation and
Impact.” World Bank, Washington D.C. .
Demsetz, H. 1967. “Toward a Theory of Property Rights.” American Economic Review 57 (2):347–
359.
Duarte, Margarida and Diego Restuccia. 2010. “The Role of the Structural Transformation in
Aggregate Productivity.” The Quarterly Journal of Economics 125 (1):129–173.
Feder, G. and D. Feeny. 1991. “Land Tenure and Property Rights: Theory and Implications for
Development Policy.” The World Bank Economic Review 5 (1):135–153.
Feder, G., T. Onchan, and Y. Chalamwong. 1988. “Land Policies and Farm Performance in Thai-
land’s Forest Reserve Areas.” Economic Development and Cultural Change 36 (3):483–501.
Field, E. 2007. “Entitled to Work: Urban Property Rights and Labor Supply in Peru.” Quarterly
Journal of Economics 122 (4):1561–1602.
Field, E. and M. Torero. 2006. “Do Property Titles Increase Credit Access Among the Urban Poor?
Evidence from a Nationwide Titling Program.” Harvard University Department of Economics,
Working Paper .
Galiani, S. and E. Schargrodsky. 2010. “Property Rights for the Poor: Effects of Land Titling.”
Journal of Public Economics 94 (9–10):700–729.
Galiani, Sebastian and Ernesto Schargrodsky. 2011. “Land Property Rights and Resource Alloca-
tion.” Journal of Law and Economics 54 (4):S329–S345.
Giles, J. and R. Mu. 2011. “Village Political Economy, Land Tenure Insecurity and the Rural to
Urban Migration Decision: Evidence from China.” Working Paper .
31
Goldstein, M. and C. Udry. 2008. “The Profits of Power: Land Rights and Agricultural Investment
in Ghana.” Journal of Political Economy 116 (6):981–1022.
Gollin, Douglas, David Lagakos, and Michael Waugh. 2014. “The Agricultural Productivity Gap
in Developing Countries.” Quarterly Journal of Economics 129 (2):939–993.
Gordillo, G, Alain de Janvry, and Elisabeth Sadoulet. 1998. “Entre el Control Politico y la Eficien-
cia: Evolucion de los Derechos de Propriedad Agraria en Mexico.” CEPAL Review 66:149–166.
Hamilton, S. 2002. “Neoliberalism, Gender, and Property Rights in Rural Mexico.” Latin American
Research Review 37 (1):119–143.
Heath, J.R. 1990. “Enhancing the Contribution of Land Reform to Mexican Agricultural Develop-
ment.” World Bank Policy Research Working Paper .
Levy, S. and S. Van Wijnbergen. 1995. “Transition Problems in Economic Reform: Agriculture in
the North American Free Trade Agreement.” American Economic Review 85 (4):738–754.
Lin, J.Y. 1992. “Rural Reforms and Agricultural Growth in China.” American Economic Review
82 (1):34–51.
Magaloni, Beatriz. 2006. Voting for Autocracy: Hegemonic Party Survival and its Demise in
Mexico. Cambridge University Press.
McKenzie, D. and H. Rapoport. 2007. “Network Effects and the Dynamics of Migration and
Inequality: Theory and Evidence from Mexico.” Journal of Development Economics 84 (1):1–
24.
McMillan, Margaret S and Kenneth Harttgen. 2014. “What is driving the African Growth Miracle?”
NBER Working Paper .
Munoz Pina, C., A. de Janvry, and E. Sadoulet. 2003. “Recrafting Rights over Common Property
Resources in Mexico.” Economic Development and Cultural Change 52 (1):129–158.
Munshi, Kaivan. 2003. “Networks in the Modern Economy: Mexican Migrants in the U.S. Labor
Market.” Quarterly Journal of Economics 118 (2):549–599.
Navarro, Zander. 2009. “Expropriating Land in Brazil.” In Agricultural Land Redistribution:
Toward Greater Consensus, edited by Hans Binwanger-Mkhize, Camille Bourguignon, and Rogier
van den Brink. The World Bank.
North, Douglass and Robert Thomas. 1973. The Rise of the Western World: A New Economic
History. Cambridge: Cambridge University Press.
Restuccia, Diego, Dennis Tao Yang, and Xiaodong Zhu. 2008. “Agriculture and Aggregate Produc-
tivity: A Quantitative Cross-Country Analysis.” Journal of Monetary Economics 55 (2):234–250.
32
Rozelle, Scott and Guo Li. 1998. “Village Leaders and Land-Rights Formation in China.” American
Economic Review 88 (2):433–438.
Sanderson, Susan W. 1984. Land Reform in Mexico. Academic Press.
Stephen, L. 1996. “Too Little, Too Late? The Impact of Article 27 on Women in Oaxaca.” In
Reforming Mexico’s Agrarian Reform, edited by Laura Randall. 289–303.
Valsecchi, M. 2013. “Land Property Rights and International Migration: Evidence from Mexico.”
forthcoming, Journal of Development Economics .
World Bank. 2001. “Mexico Land Policy – A decade after the Ejido Reform.” Tech. rep., World
Bank.
Yates, P.L. 1981. “Mexican Land Reform, 1959-1969: A Comment.” Economic Journal
91 (363):745–752.
Figures and Tables
Figure 1: Labor allocation to farm production
A2 A1 A0No cultivation Constrained Unconstrained
Optimal farm labor
Constrained farm labor
Migration
Farm size
Notes: Figure shows the optimal agricultural labor schedule as a function of farm size. Optimal farm labor is laboruse under the title-based regime. Constrained farm labor is labor use under the minimum production constraint.See Section 3 for other details on theoretical model.
33
Figure 2: Effect of Procede on changes in the number of cultivators and area cultivated from1995-2012
−.3
−.2
−.1
0.1
.2C
oeffi
cien
t
1993 1996 1999 2002 2005Year of Procede Completion
Change in Log number farmers
−.3
−.2
−.1
0.1
.2C
oeffi
cien
t
1993 1996 1999 2002 2005Year of Procede Completion
Change in Log area
−.3
−.2
−.1
0.1
.2C
oeffi
cien
t
1993 1996 1999 2002 2005Year of Procede Completion
Change in Log area per farmer
Notes: Figure shows coefficient estimates from changes in log number of cultivators and total area cultivated from1995-2012 on year of Procede completion indicators and state fixed effects. The standard errors are clustered at themunicipality level. The omitted category is 2005 and onwards, thus coefficient estimates are relative to ejidos thatwere completed near the end of the program.
34
Tab
le1:
Effectof
Procedeonhousehold
migrationbehav
ior
Progresa
HouseholdsMatched
toEjidos
(1)
(2)
(3)
(4)
(5)
(6)
HasMigrant
HasMigrant
HasMigrant
HasMigrant
HasMigrant
HasMigrant
Certified
0.0149∗∗
0.0147∗∗
0.0153∗∗
0.0172∗∗
∗0.0157∗∗
0.0130∗∗
(0.0061)
(0.0066)
(0.0062)
(0.0059)
(0.0063)
(0.0062)
HH
isLandholder
0.0136∗∗
∗0.0048
(0.0046)
(0.0053)
Number
Males17-30in
HH
0.0185∗∗
∗0.0088∗∗
(0.0046)
(0.0037)
HH
Headis
Fem
ale
0.0132
0.0092
(0.0106)
(0.0082)
AgeofHH
Head
0.0009∗∗
∗0.0004∗∗
∗
(0.0002)
(0.0001)
Agricu
lturalva
lue(100USD/ha)
0.0227
(0.0230)
Tim
eFixed
Effects
Yes
Yes
Yes
Yes
Yes
Yes
EjidoFixed
Effects
Yes
Yes
No
Yes
Yes
Yes
HH
Fixed
Effects
No
No
Yes
No
No
No
State
xTim
eEffects
No
No
No
Yes
No
No
HH
Characteristics
xTim
eEffects
No
No
No
No
Yes
No
EjidoCharacteristics
xTim
eEffects
No
No
No
No
No
Yes
MeanofDep
Variable
0.053
0.055
0.053
0.053
0.056
0.053
Number
ofObservations
27189
23421
27189
27189
24533
27189
Rsquared
0.047
0.058
0.043
0.048
0.059
0.048
Standard
errors
thatallow
forclusteringattheejidolevel
are
reported
inparentheses.Asterisksindicate
statisticalsignificance
atthe1%
∗∗∗,5%
∗∗,and10%
∗
levels.
Data
includeobservationsonallhouseholdsin
ejidosthatcompletedtheProcedeprocess
after
1996.Allregressionsare
linearprobabilitymodels.
The
dep
enden
tva
riable
is1ifthehousehold
hadamigrantleav
eduringtheyearoranyprevioussample
year.
Certified
indicator=
1ifejidowascertified
atthe
start
oftheyear.
Ejidoch
aracteristics
incolumn6are
distance
tonearest
largecity
(population>
100,000),
number
ofejidatarios,
number
ofposesionarios+
avecindados,
totalsize
oftheejido,share
ofejidolandin
parcels,
locality
marginalizationindex,longitude,
andlatitude.
35
Tab
le2:
Effectof
Procedeonlocality-level
population
Cen
susLocalities
Matched
toEjidos
(1)
(2)
(3)
(4)
(5)
(6)
Population
ln(P
opulation)
ln(P
opulation)
ln(P
opulation)
ln(P
opulation)
ln(P
opulation),1980-1990
Year=
2000
-9.6309∗∗
∗-0.2069∗∗
∗-0.1986∗∗
∗-0.2069∗∗
∗-0.2069∗∗
∗
(1.0014)
(0.0105)
(0.0184)
(0.0105)
(0.0105)
Certified
-3.6893∗∗
∗-0.0404∗∗
∗-0.0341∗∗
-0.0206
1993-1999*Year=
2000
(1.1485)
(0.0128)
(0.0167)
(0.0195)
Agricu
lturalva
lue
0.0036
(100USD/ha)
(0.0077)
Years
Certified
in-0.0054
2000*Certified
1993-1999*Year=
2000
(0.0039)
Certified
Before
-0.0592∗∗
∗
1997*Year=
2000
(0.0144)
Certified
-0.0196
1997-1999*Year=
2000
(0.0151)
Year=
1990
-0.2094∗∗
∗
(0.0125)
Certified
-0.0082
1993-1999*Year=
1990
(0.0148)
EjidoFixed
Effects
Yes
Yes
Yes
Yes
Yes
Yes
MeanofDep
Variable
99.111
4.271
4.277
4.271
4.271
4.416
Number
ofObservations
34656
34656
24170
34656
34656
24910
Rsquared
0.014
0.035
0.035
0.036
0.036
0.033
Standard
errors
thatallow
forclusteringattheejidolevel
are
reported
inparentheses.Asterisksindicate
statisticalsignificance
atthe1%
∗∗∗,5%
∗∗,and10%
∗
levels.
Regressionsin
columns1-5
basedon17,328localities
thatwerematched
toejidos,
hadpopulationdata
inboth
the1990and2000censuses,
andhada
populationofmore
than20individuals
in1990.Regressionin
column6is
basedon12,455localities
withavailable
populationdata
in1980andwitha
populationlarger
than20in
1980.
36
Tab
le3:
Heterogeneouseff
ects
ofcertificationonmigration
Progresa
HouseholdsMatched
toEjidos
(1)
(2)
(3)
(4)
(5)
(6)
HasMigrant
HasMigrant
HasMigrant
HasMigrant
HasMigrant
HasMigrant
Certified
0.0138
0.0081
0.0102
0.0096
-0.0028
-0.0041
(0.0088)
(0.0086)
(0.0063)
(0.0064)
(0.0085)
(0.0093)
Certified
*EjidoHadBoundary
Problemsin
1991
0.0164
0.0278∗
(0.0142)
(0.0145)
Certified
*HH
Headis
Fem
ale
0.0596∗∗
0.0648∗∗
0.0649∗∗
0.0702∗∗
(0.0247)
(0.0277)
(0.0252)
(0.0282)
Certified
*Abov
eMed
ianPredictedWage
0.0247∗
0.0262∗
(0.0139)
(0.0155)
Abov
eMed
ianPredictedWage
0.0015
0.0010
(0.0056)
(0.0056)
Tim
eEffects
Yes
Yes
Yes
Yes
Yes
Yes
EjidoFixed
Effects
Yes
Yes
Yes
Yes
Yes
Yes
Tim
eEffects*HH
Headis
Fem
ale
No
No
No
Yes
No
Yes
Tim
eEffects*EjidoHadBoundary
Problemsin
1991
No
Yes
No
No
No
No
Tim
eEffects*Abov
eMed
ianPredictedWage
No
No
No
No
No
Yes
MeanofDep
Variable
0.057
0.057
0.056
0.056
0.056
0.056
Number
ofObservations
21090
21090
24533
24533
24513
24513
Rsquared
0.060
0.060
0.059
0.059
0.059
0.060
Standard
errors
thatallow
forclusteringattheejidolevel
are
reported
inparentheses.Asterisksindicate
statisticalsignificance
atthe1%
∗∗∗,5%
∗∗,and10%
∗
levels.
Data
includeobservationsonallhouseholdsin
ejidosthatcompletedtheProcedeprocess
after
1996.Allregressionsare
linearprobabilitymodels.
Dep
enden
tva
riable
=1ifthehousehold
hadamigrantleav
eduringtheyearoranyprevioussample
year.
Certified
indicator=
1ifejidowascertified
atthe
start
oftheyear.
Allregressionsincludelandholder
indicator,
ageofhousehold
head,indicatorforfemale
household
head,andnumber
ofmalesbetween17and
30ascontrols.Ejidohadboundary
problem
sis
anindicatorva
riable
forresp
onse
ofyes
tothis
questionduringthe1991ejidosurvey.Above
MedianPredicted
Wage
=1ifthehousehold’s
predictedmaxim
um
off-farm
wageis
abov
ethemed
ianin
thesample.
37
Tab
le4:
Heterogeneity
incertificationeff
ectaccordingto
baselineland
AllMunicipalities
HighYield
Municipalities
Low
Yield
Municipalities
(1)
(2)
(3)
(4)
(5)
(6)
(7)
HasMigrant
HasMigrant
HasMigrant
HasMigrant
HasMigrant
HasMigrant
HasMigrant
Certified
0.0298∗∗
∗0.0312∗∗
∗0.0234∗∗
∗0.0159∗
0.0201∗∗
0.0351∗∗
∗0.0370∗∗
∗
(0.0097)
(0.0101)
(0.0076)
(0.0090)
(0.0099)
(0.0129)
(0.0127)
Certified
*High
-0.0232∗
-0.0256∗∗
MaizeYield
Municipality
(0.0124)
(0.0126)
Certified
*-0.0187∗
-0.0240∗
-0.0339∗∗
-0.0095
-0.0145
(Landper
Adult
>Med
ianin
Ejido[1997])
(0.0097)
(0.0122)
(0.0157)
(0.0157)
(0.0164)
Landper
Adult
0.0061
0.0061
0.0098∗
0.0134∗
0.0035
0.0038
-0.0007
>Med
ianin
Ejido[1997]
(0.0051)
(0.0051)
(0.0051)
(0.0073)
(0.0057)
(0.0058)
(0.0045)
EjidoFixed
Effects
Yes
Yes
Yes
Yes
Yes
Yes
Yes
Tim
eEffects
Yes
Yes
Yes
Yes
Yes
Yes
Yes
Tim
eEffects*Landper
Adult
>Med
ianin
Ejido
No
No
No
No
Yes
No
Yes
Tim
eEffects*HighMaizeYield
Municipality
No
Yes
No
No
No
No
No
MeanofDep
Variable
0.056
0.056
0.056
0.057
0.057
0.054
0.054
Number
ofObservations
24372
24372
24372
14533
14533
9839
9839
Rsquared
0.058
0.058
0.058
0.052
0.052
0.068
0.068
Standard
errors
thatallow
forclusteringattheejidolevel
are
reported
inparentheses.Asterisksindicate
statisticalsignificance
atthe1%
∗∗∗,5%
∗∗,and10%
∗
levels.
Dep
enden
tva
riable
inallregressionsis
1ifthehousehold
isamigranthousehold.Allregressionsare
linearprobabilitymodels.
Certified
indicator=
1if
ejidowascertified
atthestart
oftheyear.
Allregressionsincludeageofhousehold
head,indicatorforfemale
household
head,andnumber
ofmalesbetween17
and30ascontrols.Columns1,2and3are
forallmatched
ejidosin
theProgresa
sample.Columns4and5are
forejidosin
municipalities
withav
eragemaize
yieldsabov
e1.293tons/hectare.Columns6and7are
forejidosin
municipalities
withav
eragemaizeyieldsbelow
1.293tons/hectare.
38
Table 5: Effect of Procede on agricultural land useLANDSAT Satellite Data
Mean of Dep Variable 5.718 5.714 5.714Number of Observations 63392 58763 58763R squared 0.012 0.012 0.012
Standard errors that allow for clustering at the ejido level are reported in parentheses. Asterisks indicate statisticalsignificance at the 1% ∗∗∗, 5% ∗∗, and 10% ∗ levels. The dependent variable is the log of the area in agriculture inthe ejido. High Yield is 1 if average maize yield in the municipality of the ejido is larger than 1.293 tons/ha.
Table 6: Effect of Procede on household consumptionLog consumption Log nonfood consumption Log food consumption
Certified 6 months -0.036 -0.028or less (0.059) (0.039)
Certified more than 0.167∗∗∗ 0.0116 months (0.063) (0.037)
Ejido Fixed Effects Yes Yes Yes Yes Yes Yes
Time Effects Yes Yes Yes Yes Yes Yes
Mean of Dep Variable 4.838 4.838 3.435 3.435 4.470 4.470Number of Observations 25482 25482 24965 24965 25373 25373R squared 0.234 0.235 0.186 0.187 0.226 0.227
Standard errors that allow for clustering at the ejido level are reported in parentheses. Asterisks indicate statisticalsignificance at the 1% ∗∗∗, 5% ∗∗, and 10% ∗ levels. The dependent variable is the log of monthly expenditures perhousehold member – either for all goods or food and nonfood items separately. High Yield Municipality is 1 ifaverage maize yield in the municipality of the ejido is larger than 1.293 tons/ha.
39
Table 7: Alternative explanations of migration effect of land certification(1) (2) (3)
Mean of Dep Variable 0.049 0.049 2.121Number of Observations 13425 13425 24211R squared 0.067 0.067 0.288
Standard errors that allow for clustering at the ejido level are reported in parentheses. Asterisks indicate statisticalsignificance at the 1% ∗∗∗, 5% ∗∗, and 10% ∗ levels. Columns 1 and 2 only include observations for poor householdsthat were eligible for Progresa. Column 3 drops the top 1% of observations with hectares cultivated of 25 or more.
40
Appendix - For Online Publication
In this appendix we provide additional details on construction of some of the data used in the
analysis. We also provide additional analysis supporting some of the main findings in the paper.
Progresa Data
Household level migration was taken from the 1998-2000 fall versions of the ENCEL survey. The
survey was conducted each fall from 1998-2000 in the 506 localities that were part of the experi-
mental evaluation of Progresa. Since no ejido identifiers were included in these data, we matched
the 506 localities to ejidos using a spatial join in ARCGIS. We only observe the coordinates of
the centroid of each locality and therefore match localities to ejidos if the center of the locality is
located inside the boundaries of the ejido. The digital maps of all ejidos certified from 1993-2006
were obtained from RAN. The spatial merge resulted in 234 of the localities falling into one of 219
different ejidos.33 The number of households from the 1998 survey that fell inside ejidos as a result
of this process is 13,212. Another 4,893 households were removed from the sample as a result of be-
ing in ejidos that were certified before 1997. Since permanent migration is being measured, trends
in migration are unlikely to be the same in ejidos certified prior to 1997 as those certified later.
These ejidos are removed for this reason. It is also important to note that the spatial matching
approach does not result in a perfect match between households and ejidos. It is possible that while
the centroid of a locality falls into a particular ejido, the outskirts of the locality fall into a different
ejido. This is more likely to be an issue in localities that are large. We used census population
data to construct the ratio of the population of the locality to the number of ejidatarios in the
matched ejido. The matching is more likely to be inaccurate when the locality is large relative to
the ejido. We therefore retained only the 200 localities with the lowest values of this metric. This
amounted to removing an additional 742 households from the sample. The total number of ejidos
in the sample is 127.
1991 and 2007 Ejido Census
The 1991 and 2007 ejido censuses consist of a set of 28,752 ejidos that were surveyed in both
1991 and 2007. We were unable to obtain the name of each ejido due to confidentiality concerns.
Further, the 2007 census did not contain information on the time of completion of Procede. A
matching process was therefore necessary to make these data usable. The key information used
were the state, municipality, and name of the locality where the majority of the ejidatarios live.
We used this information along with some common key variables between the census data and the
GIS database from RAN to match ejidos based on a 4-step process:
1. There were 22,473 ejidos for which the locality where a majority of the ejidatarios live is
33This number is roughly consistent with half of Mexico’s land being in ejidos. The large number of localities thatwere not matched to ejidos is therefore not a concern. The matching rate of 46% is actually in line with 50% of landbeing in ejidos.
41
located inside the boundaries of the ejido. For these ejidos we were able to use our spatial
merge between localities and ejidos to identify the corresponding ejido in the GIS database.
There are of course numerous instances where the boundaries of an ejido contain more than
one locality centroid. We were unable to include these ejidos in this matching round. This
round matched a total of 14,128 ejidos.
2. The second round of matching is meant to partially correct for the fact that matching localities
to ejidos in the previous step using only the centroid of the locality is imperfect. The reason
for this is that the centroid of the locality could fall outside of the boundaries of the ejido even
if there is substantial overlap between the locality and ejido. Further, ejidos with multiple
disjoint patches of land pose problems to matching based on locality centroids and ejido
boundaries. The distance between the locality centroid for each unmatched census ejido and
the center of each unmatched ejido from the GIS database was calculated using a simple
distance calculation in ARCGIS. An ejido from the GIS data was matched to an ejido from
the census data if the locality where the majority of the ejidatarios live was the closest locality
to the center of the ejido. Since this match is not perfect, we attempt to minimize errors by
only retaining matches where the percentage difference between the number of ejidatarios in
the 1991 census and the GIS database was between -46.8% and 29%.34 This round generated
an additional 1,787 matches.
3. In this round we considered the remaining unmatched ejidos for which the locality where the
majority of the ejidatarios live is located inside the boundaries of the ejido. We defined a
potential candidate match from the GIS database as an unmatched ejido that was located
in the same state and municipality. For each of these potential matches we considered 4
metrics of comparison. The first was the similarity between the name of the locality where
the ejidatarios live and the name of the ejido in the GIS database.35 We generated a spelling
similarity index using a combination of the COMPARE and SPEDIS functions in SAS. A
match was identified for sufficiently low values of this index. The second metric was the
distance between the centroid of the locality and ejido. The ejidos were considered to match
if the distance was less than 5.1 kilometers.36 The third metric was the number of ejidatarios.
A match was determined using the same cutoffs as in the previous round. The final metric was
the difference between the size of the ejido (in hectares) in the two datasets. The percentage
cutoffs were -32.4 and 41.6. We required at least two of these criteria to be satisfied to identify
a match between the ejidos. For each census ejido we selected the ejido from the GIS database
which matched on the most of these criteria (from 2 to 4). In order to break ties we used
the percentage difference in the number of ejidatarios. This round generated a total of 1,878
matches.
34These numbers were chosen as the 10th and 90th percentiles of the percentage difference from the ejidos matchedin the previous round.
35It is common for ejido names to be the same as locality names in Mexico.36This value was chosen since it was the 10th percentile in the list of candidate matches.
42
4. The fourth round of matches considers the census ejidos where it was stated that the locality
where the majority of ejidatarios live is not inside the boundaries of the ejido. We used a
similar process as in the previous round with only two modifications. First, similarities be-
tween the name of the locality and the ejido were not used. Second, the distance requirement
was relaxed to 8.6 kilometers (25th percentile). This round generated 1,920 matches.
Data on PROCAMPO beneficiaries
We use publicly available data from Mexico’s secretariat of agriculture (SAGARPA) on the farm
support program PROCAMPO to analyze land use changes after Procede. PROCAMPO entitles
farmers that cultivated land during the period from 1991-1993 decoupled payments per hectare
cultivated. The first payments were made to approximately 3.2 million beneficiaries during the
main spring/summer growing season in 1995.
We observe each claim made by each of these beneficiaries during the period from 1995 to
2012.37 Overall, the data contain information on 45.6 million support payments over the 18 year
period. Each observation consists of the name of the farmer, numeric farmer identifier, the location
as defined by state, municipality, and ejido, the crop, and area cultivated. These payments track
closely the cultivation patterns of the land cultivated during the base period because the only
requirement for receiving payment was cultivation of the land.
Ejidos are not identified numerically and the data are not spatially referenced. This necessitated
a name match where we were able to successfully match farmers from 19,409 different ejidos to our
data on program completion. The ejido-level analysis in Figure 2 uses 18,437 of the 19,409 ejidos
that had observations from both 1995 and 2012.
Alternative form of land use constraint
Our model in the main text formalizes the minimum productive use constraint by requiring that
ejidatarios attain a minimum yield such that YeA > πm
s . While this corresponds to the situation
resulting from Mexico’s first major land reform that requires that ejidatarios put land to use
productively, another constraint that corresponds closely with usufructory rights in general is for
farmers to be required to allocate a minimum amount of labor to agricultural land. In other words,
the farmer must use the land or it is lost. In this section we describe how our predictions on
heterogeneity would be affected by an alternative form of the constraint that requires heA ≥ µ,
where µ is a positive constant that measures the severity of the constraint.
The equilibrium allocation is nearly identical to that in the main text. That is, there are three
regimes. First, agricultural labor is optimized at he = h∗e for the largest farmers that are unaffected
by the use constraint. Second, he = µA for the intermediate sized farmers for which the constraint
is binding. Finally, he = 0 for the farmers that have such little land that YeµA < wm.
37We don’t observe payments for the main growing season during 1998.
43
The migration effect of certification is
∆hm = µA− h∗e = µA−(γβAα
wm
) 11−β
. (17)
We now consider how this modified form of the constraint affects the predictions on heterogeneity
that we derive in the main text.
Tenure security
Since µ only increases the amount of labor required to meet the minimum use constraint, we have
that∂∆hm∂µ
= A > 0.
Thus, migration responses are also predicted to be larger for households that were more constrained
under the pre-certification situation.
Off-farm wages
Similar to the case in the main text, wages affect the decision of whether to stay in agriculture
prior to reform. However, non-farm wages only affect the allocation of labor to agriculture under
the optimal allocation after land is certified. Thus, we see directly that
∂∆hm∂wm
= − ∂h∗e∂wm
> 0.
Land productivity
Since total factor productivity does not affect the constrained labor allocation to agriculture, we
see directly from the expression for ∆hm that
∂∆hm∂γ
= −∂h∗e∂γ
< 0.
Farm size
Differentiating ∆hm with respect to A gives:
∂∆hm∂A
=∂he
∂A− ∂h∗e
∂A=
(πmsγ
) 1β 1− α
βA
1−α−ββ −
(γβ
wm
) 11−β α
1− βA
α+β−11−β
∂∆hm∂A
= µ−(γβ
wm
) 11−β
(α
1− β
)A
α+β−11−β
Similar to the case in the main text, this expression can be shown to be negative except for the
smallest farm sizes where A <
[µ(1−β)
α
(γβwm
) 1β−1
] 1−βα+β−1
.
Also similar to the main text, we see that this heterogeneity with respect to landholdings is
44
more prominent in higher productivity areas:
∂2∆hm∂γ∂A
< 0.
Additional analysis on land use
We show that there is a correlation between population changes and cultivated area changes. In
order to do this, we consider the overall change in log agricultural land between 1993 and 2007
using the Landsat data. The median change in log of agricultural land in these data is .0001
while the mean is 0.111. To limit the influence of outliers, we use the rank of the ejidos in the
distribution of change in cultivated land.38 The first two columns of Table A3 repeat the fixed
effects regression of locality population on whether the ejido has been certified separately for the
localities with agricultural land use change below and above the median value. The table shows
that the negative effect of certification on population size is much stronger in localities that also
saw the largest decreases in agricultural land.
Column (3) shows that localities with the most pronounced declines in agricultural land (rank
=0) experienced a decline in population of 9.2% in response to certification, while ejidos with the
largest increases in agricultural land saw no significant effect of certification on population.
38The value of the variable Rank corresponds to the empirical distribution function of the change in the logarithmof agricultural land.
45
Figure A1: Correspondence between data and rollout of Procede
0.2
.4.6
.81
Sha
re o
f Cer
tifie
d E
jidos
1990 1992 1994 1996 1998 2000 2002 2004 2006 2008Year of Program Completion
LANDSAT Land Use Locality CensusProgresa Data Ejido Census
Notes: Figure shows cumulative share of ejidos certified over time. Vertical lines represent observations for each ofthe datasets used in the analysis. The Progresa ENCEL data are from 1998-2000. Migration recall data were usedfor 1997. Locality level census data are from 1990 and 2000. Ejido level census data are from 1991 and 2007.LANDSAT land use data are from 1993, 2002, and 2007.
46
Figure
A2:
RolloutofProcedeacross
timeandspace
19
93
20
00
19
96
20
06
Notes:
Shaded
ejidosare
those
thatcompletedtheProcedeprogram
duringorbefore
thelisted
year.
Stateswithbold
outlines
are
7Progresa
statesforwhich
wehavemigrationoutcomes
(Guerrero,Hidalgo,Michoacan,Pueb
la,Queretaro,SanLuis
Potosi,andVeracruz).
47
Figure A3: Cumulative distribution of population change, 1990-2000, by certification date
0.2
.4.6
.81
Em
piric
al C
DF
−89 0 57Population Change 1990−2000
Certified 2000 or Later Certified 1993−1999
Notes: Figure displays empirical CDF of population change (in levels) from 1990-2000. Data used are the 1990 and2000 locality-level population censuses.
48
Figure A4: Analysis of migration and land consolidation for subset of ejidos without any commonland at baseline
−.4
−.2
0.2
.4C
oeffi
cien
t
1993 1996 1999 2002 2005Year of Procede Completion
Change in Log number farmers
−.4
−.2
0.2
.4C
oeffi
cien
t
1993 1996 1999 2002 2005Year of Procede Completion
Change in Log area
−.4
−.2
0.2
.4C
oeffi
cien
t
1993 1996 1999 2002 2005Year of Procede Completion
Change in Log area per farmer
Notes: Figures show coefficient estimates from changes in log number of cultivators and total area cultivatedfrom1995-2012 on year of Procede completion indicators and state fixed effects. Data are limited to areas wherethere was no common area prior to Procede. The standard errors are clustered at the municipality level. Theomitted category is 2005 and onwards, thus coefficient estimates are relative to ejidos that were completed near theend of the program.
49
Table A1: Effect of Procede on ejido-level migration of young peopleMatched Ejidos in 1991 and 2007 Ejido Census
(1) (2)Migrate Migrate
Years Certified in 2007 0.0035∗∗∗ 0.0039∗∗∗
(0.0013) (0.0013)
Using Improved Seeds in 1991 -0.0178∗
(0.0100)
Using Tractors in 1991 -0.0048(0.0105)
Electrical Lighting in 1991 0.0384∗∗∗
(0.0108)
Log of Distance Between Ejido and PA Office 0.0528∗∗∗
(0.0113)
State Fixed Effects Yes Yes
Mean of Dep Variable 0.426 0.426Number of Observations 19670 19600R squared 0.086 0.092
Standard errors that allow for clustering at the municipality level are reported in parentheses. Asterisks indicatestatistical significance at the 1% ∗∗∗, 5% ∗∗, and 10% ∗ levels. The question in the 2007 census identifies the ejidoswhere a majority of young people are integrated in the activities of the ejido or remain in the ejido but work innearby localities. If neither of the prior conditions was true, the destination of the majority of the young people isidentified. The variable “migrate” takes on a value of 1 if neither of the first two conditions was true.
50
Table A2: Heterogeneity according to gender and age composition of the householdProgresa Households Matched to Ejidos
(1) (2) (3) (4)Has Migrant Has Migrant Has Migrant Has Migrant
HH has 1-2 young 0.0152∗∗ 0.0091∗ 0.0149∗∗ 0.0090∗
males (0.0060) (0.0049) (0.0060) (0.0049)
Certified*HH Head is 0.0625∗∗ 0.0672∗∗
Female (0.0246) (0.0275)
HH head is Female 0.0015 0.0055(0.0090) (0.0082)
Time Effects Yes Yes Yes Yes
Ejido Fixed Effects Yes Yes Yes Yes
Time Effects*HH has 1-2 young males No Yes No Yes
Time Effects*HH Head is Female No No No Yes
Mean of Dep Variable 0.056 0.056 0.056 0.056Number of Observations 24533 24533 24533 24533R squared 0.056 0.056 0.057 0.057
Standard errors that allow for clustering at the ejido level are reported in parentheses. Asterisks indicate statisticalsignificance at the 1% ∗∗∗, 5% ∗∗, and 10% ∗ levels. Data include observations on all households in ejidos thatcompleted the Procede process after 1996. All regressions are linear probability models. Dependent variable = 1 ifthe household had a migrant leave during the year or any previous sample year. Certified indicator = 1 if ejido wascertified at the start of the year. All regressions include landholder indicator and age of household head as controls.
51
Table A3: Population regressions by change in agricultural areaRank>0.5 Rank<0.5 All
Rank of Ag Change * Certified 1993-1999 * Year=2000 0.0876∗
(0.0461)
Ejido Fixed Effects Yes Yes Yes
Mean of Dep Variable 4.240 4.324 4.278Number of Observations 15200 12420 27624R squared 0.035 0.041 0.038
Dependent variable in all regressions is log of locality population. Standard errors that allow for clustering at theejido level are reported in parentheses. Asterisks indicate statistical significance at the 1% ∗∗∗,5% ∗∗, and 10% ∗
levels. Data come from the 1990 and 2000 locality population censuses. Localities located in ejidos with noagricultural land during either 1993 or 2007 are excluded from the regressions, thus explaining the difference inobservations from Table 2. The first column limits to localities in ejidos that experienced above the median changein log agricultural area from 1993-2007. The second column limits to localities in ejidos that experienced below themedian changes. The final column is for all localities in ejidos that had nonzero agricultural land area in both 1993and 2007.
52
Table A4: Direct effect of Progresa on household-level migrationMigration in:
HH is Landholder 0.0196∗∗∗ 0.0138 -0.0064(0.0073) (0.0102) (0.0100)
Number Males 17-30 in HH 0.0096 0.0148∗ 0.0175∗
(0.0063) (0.0081) (0.0092)
HH head is Female 0.0140 0.0071 0.0205(0.0169) (0.0207) (0.0215)
Age of HH Head 0.0010∗∗∗ 0.0017∗∗∗ 0.0017∗∗∗
(0.0002) (0.0003) (0.0003)
Mean of Dep Variable 0.041 0.061 0.078Number of Observations 3509 3107 3205R squared 0.013 0.014 0.011
Data are for all poor households that were eligible to receive Progresa payments. Dependent variable = 1 if thehousehold had a migrant leave during the year or any previous sample year. Standard errors that allow forclustering at the locality level are reported in parentheses. Asterisks indicate statistical significance at the 1% ∗∗∗,5% ∗∗, and 10% ∗ levels.
53
Tab
leA5:
Relationship
betweenProcedeandpre-program
migration
Progresa
HouseholdsMatched
toEjidos,
Pre-P
rogram
Period
(1)
(2)
(3)
(4)
∆Migration,97-98
∆Migration,97-99
∆Migration,97-00
Migration,97-00
ProcedeCompletedin
1999
-0.0011
(0.0113)
ProcedeCompletedin
2000
-0.0040
-0.0087
(0.0110)
(0.0092)
ProcedeCompletedAfter
2000
-0.0131
-0.0102
0.0015
(0.0090)
(0.0086)
(0.0046)
YearProcedeCompleted(0/1)
0.0018
(0.0150)
YearBefore
Procede(0/1)
-0.0021
(0.0107)
2Years
Before
Procede(0/1)
-0.0015
(0.0089)
Tim
eFixed
Effects
No
Yes
Yes
Yes
EjidoFixed
Effects
No
No
No
Yes
MeanofDep
Variable
0.022
0.020
0.018
0.050
Number
ofObservations
111
187
225
406
Number
ofEjidos
111
94
76
127
Rsquared
0.047
0.019
0.002
0.774
Pvalueofjointtest
0.190
0.493
Standard
errors
are
reported
inparentheses.Robust
standard
errors
are
usedin
column1.In
columns2-4,standard
errors
are
clustered
attheejidolevel.
Asterisksindicate
statisticalsignificance
atthe1%
∗∗∗,5%
∗∗,and10%
∗levels.
Thedep
enden
tva
riable
incolumns1-3
isthechangein
ejidomigrationrate.
Thedep
enden
tva
riable
incolumn4is
theejidomigrationrate.Both
regressionsare
forthepre-treatm
entperiod.Columns1is
forfor1998.Column2is
for
1998-1999.Column3is
for1998-2000.Column4is
for1997-2000.
54
Table A6: Regressions of attrition on certification status and household covariates(1)
Attrition
Certified -0.003(0.025)
HH is Landholder -0.043∗∗∗
(0.010)
Number Males 17-30 in HH 0.005(0.004)
HH Head is Female 0.030∗∗
(0.012)
Age of HH Head -0.000(0.000)
Ejido Fixed Effects Yes
Time Fixed Effects Yes
Mean of Dep Variable 0.112Number of Observations 12895R squared 0.115
Standard errors that allow for clustering at the ejido level are reported in parentheses. Asterisks indicate statisticalsignificance at the 1% ∗∗∗, 5% ∗∗, and 10% ∗ levels. Data are for all households that were surveyed in the Fall 1998ENCEL survey. Observations are from 1999 and 2000. Dependent variable = 1 if household did not have surveycompleted. Certified indicator = 1 if household had a certificate at the start of the year. 446 households attrited in1999 but not in 2000. 331 households attrited in both 1999 and 2000. 554 households attrited in 2000 but not in1999.