1 Deliverable 4.1: Competitiveness of CIS and EU agrifood chains Quantifying Porter’s diamond Submission date: November 2015 Jo H.M. Wijnands, Siemen van Berkum and David Verhoog LEI Wageningen UR The Hague, The Netherlands This project has received funding from the European Union’s Seventh Framework Programme for Research, Technological Development and Demonstration under Grant Agreement no 612755
Transcript
1
Deliverable 4.1: Competitiveness of CIS and EU agrifood chains Quantifying Porter’s diamond Submission date: November 2015
Jo H.M. Wijnands, Siemen van Berkum and David Verhoog LEI Wageningen UR The Hague, The Netherlands
This project has received funding from the European Union’s Seventh Framework Programme for Research, Technological Development and Demonstration under Grant Agreement no 612755
2
Acknowledgement We gratefully acknowledge the work done by Bibiana M. Armenta Gutiérrez, who made first steps in elaborating the approach of quantifying Porter’s diamond, together with her supervisor Jo Wijnands, when drafting her master thesis (unpublished master thesis, 2011). Next, we like to thank Inna Levkovich and Aaron Grau from IAMO (Germany), and Stephan von Cramon-Taubadel (University of Göttingen) for their constructive comments while reviewing a first draft of this report.
Contents Abbreviations and Acronyms ....................................................................................................................... 4
Abbreviations and Acronyms CIS Commonwealth of Independent States. Member states are:
AM Armenia AZ Azerbaijan BY Belarus GE Georgia KZ Kazakhstan MD Moldova RU Russia UA Ukraine
EU European Union. Member states are: AT Austria
BE Belgium BG Bulgaria HR Croatia CY Cyprus CZ Czech Republic DK Denmark EE Estonia FI Finland FR France DE Germany GR Greece HU Hungary IE Ireland IT Italy LV Latvia LT Lithuania LU Luxembourg MT Malta NL Netherlands PL Poland PT Portugal RO Romania SK Slovak Republic SI Slovenia ES Spain SE Sweden UK United Kingdom
EU-xx Refers to the number of EU member states in order of accession. HDR Human Development Report IDI ICT Development Index LPI Logistics performance index RMA Relative iMport Advantage index RTA Relative Trade Advantage index RXA Relative eXport Advantage index UNDP United Nations Development Programme WDI World Development Indicators WEF Word Economic Forum
5
Executive summary
This study evaluates the competitiveness of the agrifood sectors in CIS countries benchmarked against EU countries, using Porters’ diamond framework of determinants of competitiveness to analyse the competitive strength of agrifood sectors. In the quantification of performance indicators, the study focuses on nine agrifood sectors and the CIS countries Russia, Ukraine, Kazakhstan and Belarus, which together account for over 90% of CIS’ total production value of these agrifood sectors. At EU level, major producers of each agrifood sector are selected for benchmarking.
Conclusions on Porter’s diamond determinants of competitiveness
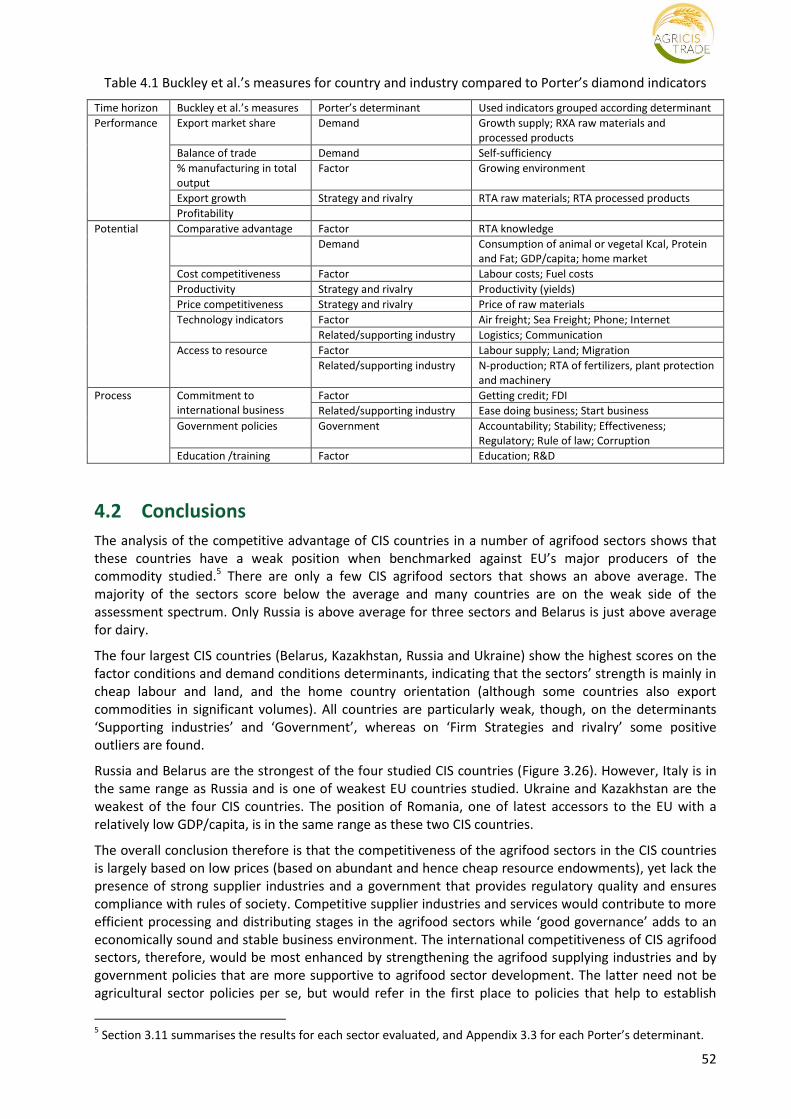
Competitiveness of the agrifood sectors in the CIS countries is largely based on low prices (based on abundant and hence cheap land and labour). The competitive position of the CIS agrifood sector is weak, as it lacks the presence of strong supplier industries and a government that provides regulatory quality and ensures compliance with rules of society (including formal laws and informal norms). More competitive supplier industries and services enhance efficiency in processing and distributing stages in the agrifood sectors while ‘good governance’ adds to an economically sound and stable business environment. The international competitiveness of the CIS agrifood sectors, therefore, would benefit from strengthening the agrifood supplying industries and from government policies that create an enabling business environment which is more supportive to the agrifood sectors’ development.
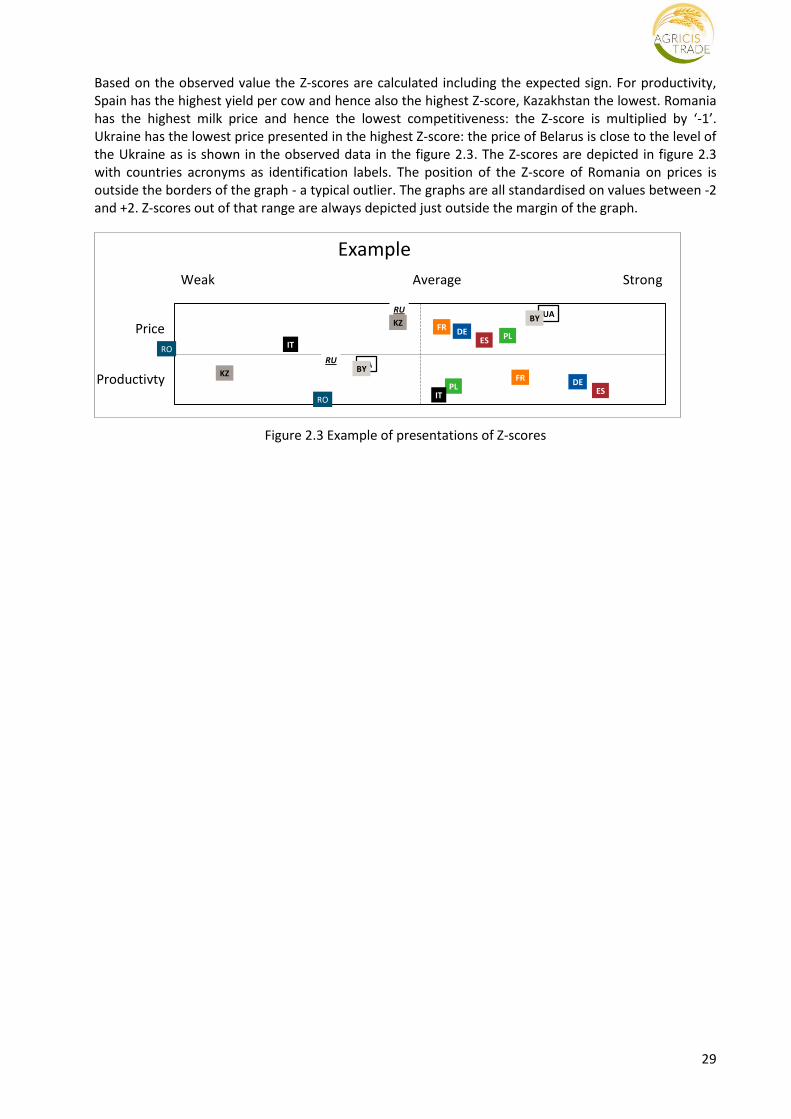
Figure S1 Scores on Porter’s diamond determinants for all food sectors (Z-scores of presented countries) See Section 2.6 on how to interpret the figure.
The four largest CIS countries (see figure S1: Russia RU, Belarus BY, Ukraine UA, Kazakhstan KZ) show the highest scores on the Factor Conditions and Demand Conditions determinants, indicating that the food sectors’ strength is mainly in cheap labour and land, and the home country orientation (although all of these countries also export agricultural commodities in significant volumes). All CIS countries are
RU
RU
RU
RU
RU
RU
UA
UA
UA
UA
UA
UA
BY
BY
BY
BY
BY
BY
KZ
KZ
KZ
KZ
KZ
KZ
FR
FR
FR
FR
FR
FR
DE
DE
DE
DE
DE
DE
PL
PL
PL
PL
PL
PL
ES
ES
ES
ES
ES
ES
IT
IT
IT
IT
IT
IT
RO
RO
RO
RO
RO
RO
Factor conditions
Demand conditions
Supporting industries
Firm strategy
Government
Overall
All sectors
Weak Average Strong
6
particularly weak, though, on the determinants Supporting industries and Government, whereas on Firm Strategies there are some positive outliers.
Competitiveness of sectors
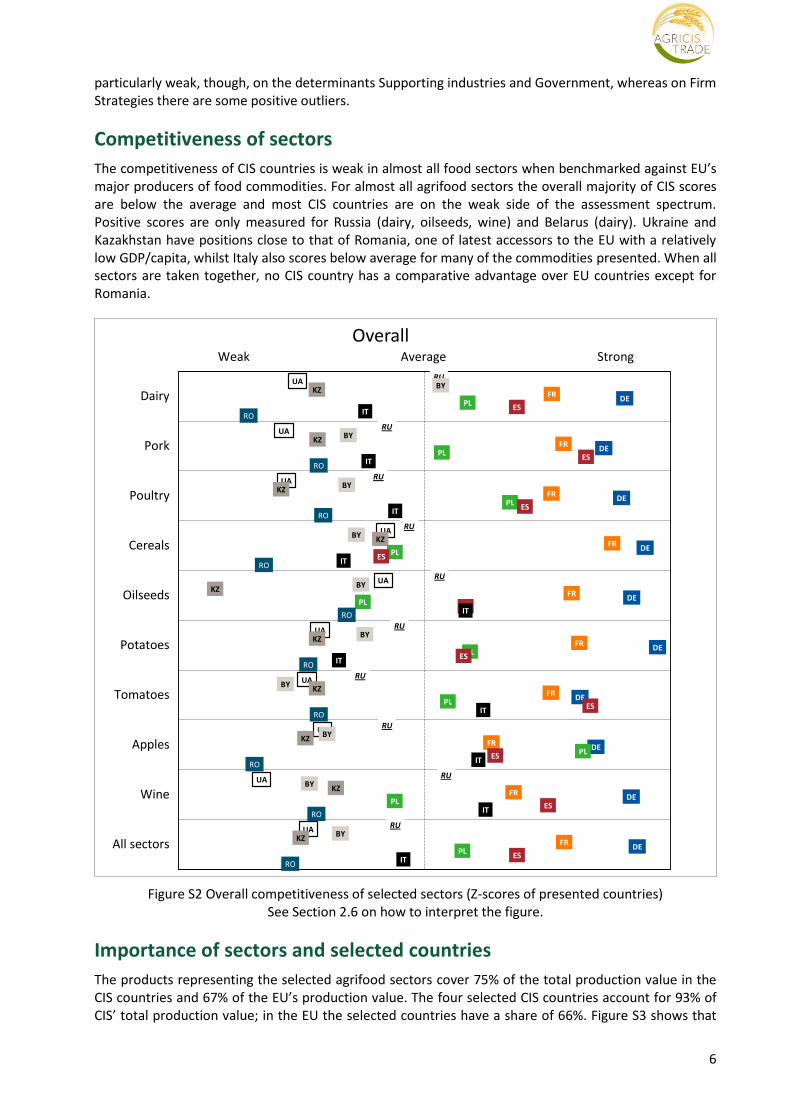
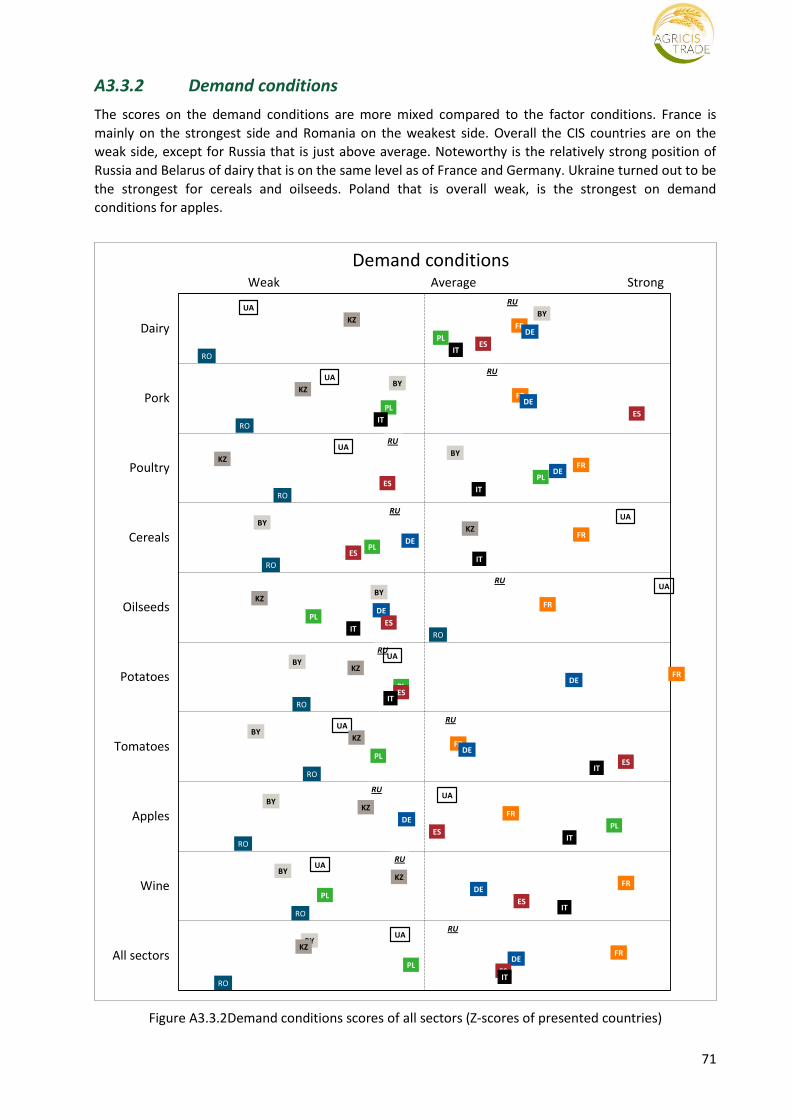
The competitiveness of CIS countries is weak in almost all food sectors when benchmarked against EU’s major producers of food commodities. For almost all agrifood sectors the overall majority of CIS scores are below the average and most CIS countries are on the weak side of the assessment spectrum. Positive scores are only measured for Russia (dairy, oilseeds, wine) and Belarus (dairy). Ukraine and Kazakhstan have positions close to that of Romania, one of latest accessors to the EU with a relatively low GDP/capita, whilst Italy also scores below average for many of the commodities presented. When all sectors are taken together, no CIS country has a comparative advantage over EU countries except for Romania.
Figure S2 Overall competitiveness of selected sectors (Z-scores of presented countries) See Section 2.6 on how to interpret the figure.
Importance of sectors and selected countries
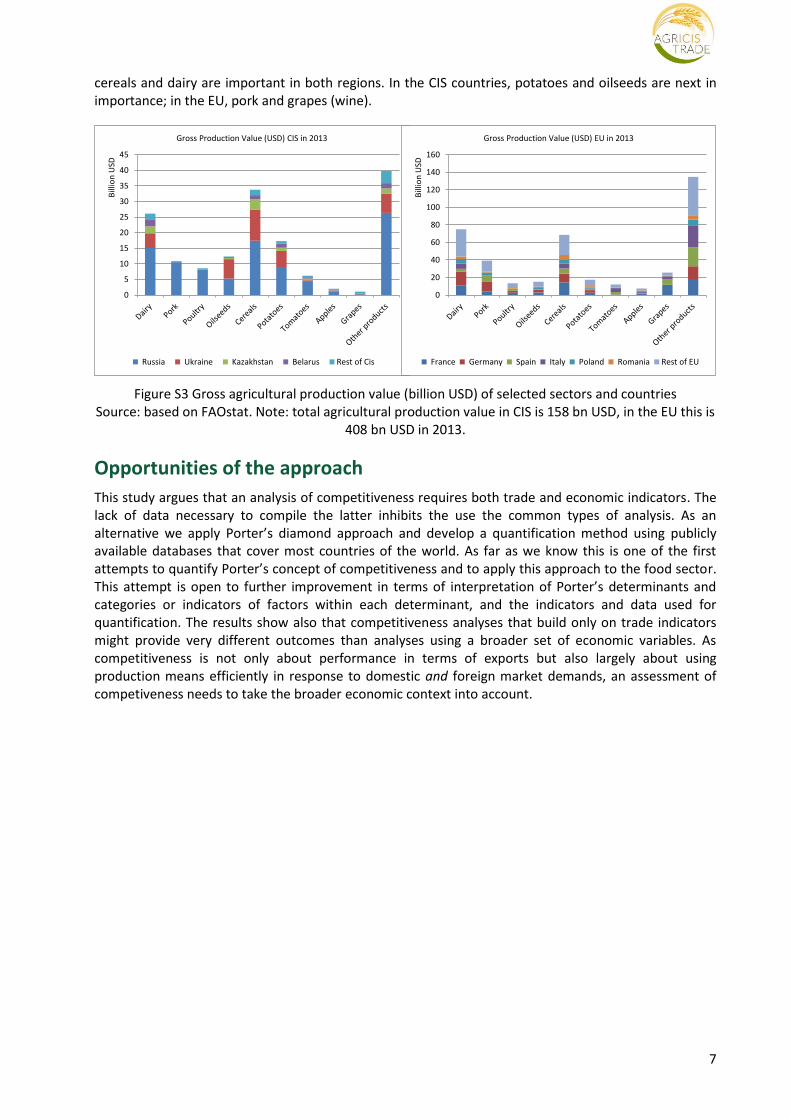
The products representing the selected agrifood sectors cover 75% of the total production value in the CIS countries and 67% of the EU’s production value. The four selected CIS countries account for 93% of CIS’ total production value; in the EU the selected countries have a share of 66%. Figure S3 shows that
RU
RU
RU
RU
RU
RU
RU
RU
RU
RU
UA
UA
UA
UA
UA
UA
UA
UA
UA
UA
BY
BY
BY
BY
BY
BY
BY
BY
BY
BY
KZ
KZ
KZ
KZ
KZ
KZ
KZ
KZ
KZ
KZ
FR
FR
FR
FR
FR
FR
FR
FR
FR
FR
DE
DE
DE
DE
DE
DE
DE
DE
DE
DE
PL
PL
PL
PL
PL
PL
PL
PL
PL
PL
ES
ES
ES
ES
ES
ES
ES
ES
ES
ES
IT
IT
IT
IT
IT
IT
IT
IT
IT
IT
RO
RO
RO
RO
RO
RO
RO
RO
RO
RO
Dairy
Pork
Poultry
Cereals
Oilseeds
Potatoes
Tomatoes
Apples
Wine
All sectors
OverallWeak Average Strong
7
cereals and dairy are important in both regions. In the CIS countries, potatoes and oilseeds are next in importance; in the EU, pork and grapes (wine).
Figure S3 Gross agricultural production value (billion USD) of selected sectors and countries Source: based on FAOstat. Note: total agricultural production value in CIS is 158 bn USD, in the EU this is
408 bn USD in 2013.
Opportunities of the approach
This study argues that an analysis of competitiveness requires both trade and economic indicators. The lack of data necessary to compile the latter inhibits the use the common types of analysis. As an alternative we apply Porter’s diamond approach and develop a quantification method using publicly available databases that cover most countries of the world. As far as we know this is one of the first attempts to quantify Porter’s concept of competitiveness and to apply this approach to the food sector. This attempt is open to further improvement in terms of interpretation of Porter’s determinants and categories or indicators of factors within each determinant, and the indicators and data used for quantification. The results show also that competitiveness analyses that build only on trade indicators might provide very different outcomes than analyses using a broader set of economic variables. As competitiveness is not only about performance in terms of exports but also largely about using production means efficiently in response to domestic and foreign market demands, an assessment of competiveness needs to take the broader economic context into account.
0
5
10
15
20
25
30
35
40
45
Bill
ion
USD
Gross Production Value (USD) CIS in 2013
Russia Ukraine Kazakhstan Belarus Rest of Cis
0
20
40
60
80
100
120
140
160
Bill
ion
USD
Gross Production Value (USD) EU in 2013
France Germany Spain Italy Poland Romania Rest of EU
8
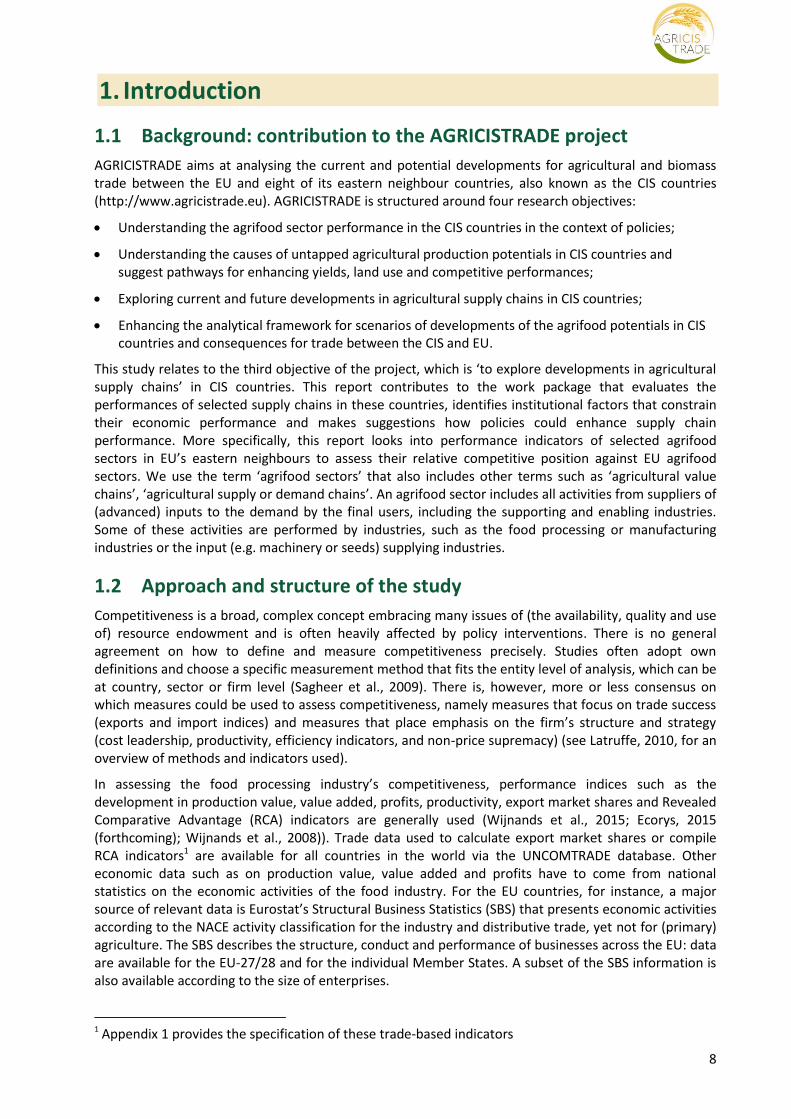
1. Introduction
1.1 Background: contribution to the AGRICISTRADE project
AGRICISTRADE aims at analysing the current and potential developments for agricultural and biomass trade between the EU and eight of its eastern neighbour countries, also known as the CIS countries (http://www.agricistrade.eu). AGRICISTRADE is structured around four research objectives:
Understanding the agrifood sector performance in the CIS countries in the context of policies;
Understanding the causes of untapped agricultural production potentials in CIS countries and suggest pathways for enhancing yields, land use and competitive performances;
Exploring current and future developments in agricultural supply chains in CIS countries;
Enhancing the analytical framework for scenarios of developments of the agrifood potentials in CIS countries and consequences for trade between the CIS and EU.
This study relates to the third objective of the project, which is ‘to explore developments in agricultural supply chains’ in CIS countries. This report contributes to the work package that evaluates the performances of selected supply chains in these countries, identifies institutional factors that constrain their economic performance and makes suggestions how policies could enhance supply chain performance. More specifically, this report looks into performance indicators of selected agrifood sectors in EU’s eastern neighbours to assess their relative competitive position against EU agrifood sectors. We use the term ‘agrifood sectors’ that also includes other terms such as ‘agricultural value chains’, ‘agricultural supply or demand chains’. An agrifood sector includes all activities from suppliers of (advanced) inputs to the demand by the final users, including the supporting and enabling industries. Some of these activities are performed by industries, such as the food processing or manufacturing industries or the input (e.g. machinery or seeds) supplying industries.
1.2 Approach and structure of the study
Competitiveness is a broad, complex concept embracing many issues of (the availability, quality and use of) resource endowment and is often heavily affected by policy interventions. There is no general agreement on how to define and measure competitiveness precisely. Studies often adopt own definitions and choose a specific measurement method that fits the entity level of analysis, which can be at country, sector or firm level (Sagheer et al., 2009). There is, however, more or less consensus on which measures could be used to assess competitiveness, namely measures that focus on trade success (exports and import indices) and measures that place emphasis on the firm’s structure and strategy (cost leadership, productivity, efficiency indicators, and non-price supremacy) (see Latruffe, 2010, for an overview of methods and indicators used).
In assessing the food processing industry’s competitiveness, performance indices such as the development in production value, value added, profits, productivity, export market shares and Revealed Comparative Advantage (RCA) indicators are generally used (Wijnands et al., 2015; Ecorys, 2015 (forthcoming); Wijnands et al., 2008)). Trade data used to calculate export market shares or compile RCA indicators1 are available for all countries in the world via the UNCOMTRADE database. Other economic data such as on production value, value added and profits have to come from national statistics on the economic activities of the food industry. For the EU countries, for instance, a major source of relevant data is Eurostat’s Structural Business Statistics (SBS) that presents economic activities according to the NACE activity classification for the industry and distributive trade, yet not for (primary) agriculture. The SBS describes the structure, conduct and performance of businesses across the EU: data are available for the EU-27/28 and for the individual Member States. A subset of the SBS information is also available according to the size of enterprises.
1 Appendix 1 provides the specification of these trade-based indicators
9
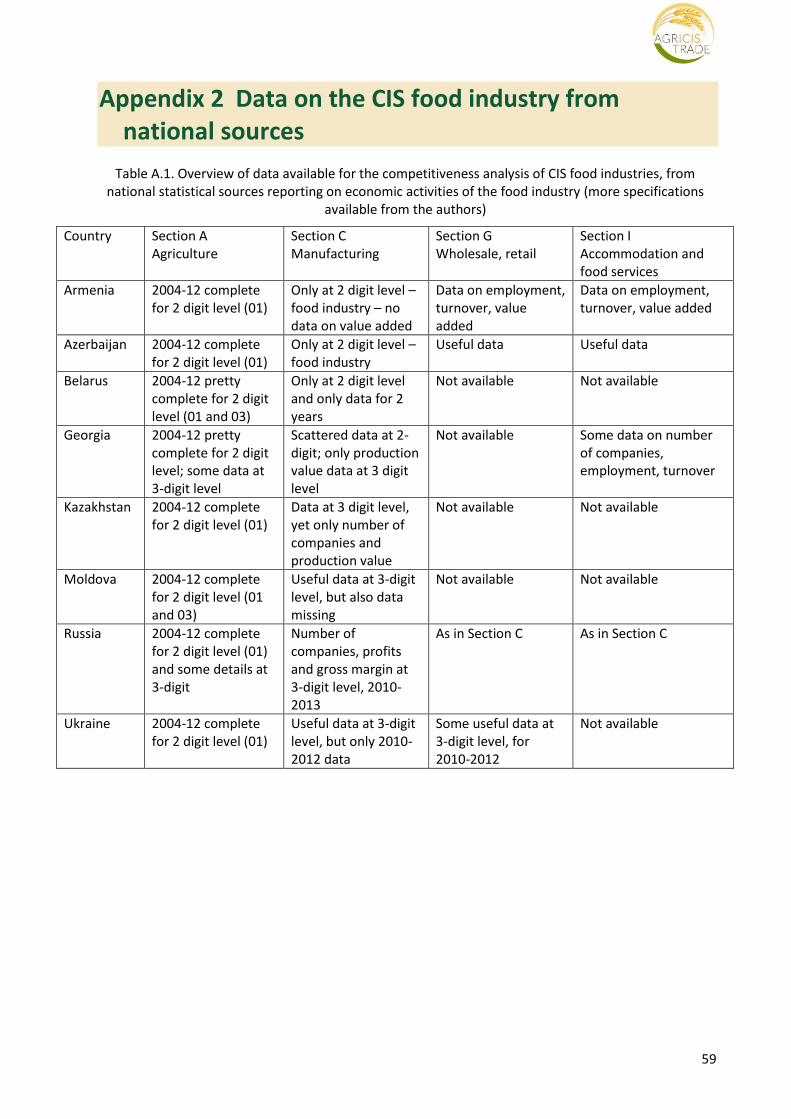
Our survey exploring the national statistical sources of the eight CIS countries, however, did not provide the details necessary for a food industry analyses that differentiates among subsectors within the food industry in detail. Appendix 2 provides an overview of data available in each of the countries, indicating that for Armenia, Azerbaijan, Belarus and Georgia, some data at the level of the total food industry (at 2-digit NACE level) is available but not the full set we are looking for. Next, where countries have information on specific sectors in the food industries, data are scattered. Hence, although trade data are available to compile relevant trade indicators, data to build the economic indicators of performance of the food industry in CIS countries are too incomplete for making a useful country comparison with the aim to evaluating competiveness. Therefore, in this study we explored an alternative approach for assessing the competitiveness of agrifood sectors in CIS countries.
This paper presents an alternative approach that is based on Michael Porter’s study (1990) on the international competitive advantage of nations. This approach includes several indicators that cover trade, structure and strategy as well as institutions. We will use Porter’s diamond approach to compile a national indicator of advantage, based on a country’s score on 1) factor conditions; 2) demand conditions; 3) firm strategy, structure and rivalry; 4) related and supporting industries. Most of these indicators are of a general nature, that is, they refer to macroeconomic variables related to sectors, while others are or can be interpreted as agrifood sector (commodity) specific. Porter’s framework has, however, a highly qualitative and abstract nature and lacks a methodology for measuring competitiveness (e.g (Rugman and Verbeke, 1993)). We couldn’t retrieve literature that operationalises and quantifies the determinants and the underlying categories of Porter’s Diamond. In this paper we consistently follow Porter’s argument and assign a quantitative indicator to each aspect, and by this build a composite index for each determinant and finally for Porter’s full set of determinants of competitiveness. This quantification adds a new dimension to the extensive literature on Porter’s diamond.
This report, therefore, contributes to the literature in two ways: it proposes a quantitative measurement of competitiveness based on the determinants of a nation’s competitiveness according to Porter’s theoretical framework, and applies this quantitative approach to assessing the competitive position of CIS food industries benchmarked against EU countries, something which to the authors’ knowledge has not been done in a similar structured way.
To that end we carried out the following activities:
1. Identifying indicators for measuring Porter’s diamond determinants. We briefly summarise Porter’s diamond approach and the determinants of competitiveness identified in that concept. Next, we present an overview of competitiveness’ indicators that we identified as appropriate proxies to measure the factors that are important in determining competitiveness according to Porter’s approach. These indicators can have a general and a sector specific nature. The selection of indicators and the methodology of quantifying these indicators are presented in Chapter 2.
2. Selecting agrifood sectors. The selection is based on the production value at primary producer level and covers the full agricultural sector: livestock, arable crops, horticulture and perennial crops. Our analysis focuses on the following selected agrifood sectors: dairy, pork, poultry, cereals, oilseeds, wine, potatoes, tomatoes and apples. These are the most important agricultural products of the agrifood sector in the CIS countries. This means they are not all equally important in all countries, but each product is important to the agricultural sector in at least several countries. The overview of the sectors included in this study is provided in Chapter 3.
3. Assessing the competitiveness of the selected agrifood sectors by applying our operationalisation of Porter’s determinants. These results are the topic of Chapter 3.
The three steps of activities are reported in the next two chapters. Chapter 4 concludes with discussing some issues that put our results in perspective and a brief list of major findings.
10
2. Methodology and indicators
This chapter presents the methodology and data sources used to operationalise our approach. In the first section we illustrate the many aspects associated with the concept of competitiveness. In the next section, we clarify Porter’s approaches of explaining competitiveness and motivate the choice for using Porter’s diamond as a base for our analyses of competitiveness of CIS agrifood sectors. The third section briefly presents the attributes of Porter’s diamond and explains the operationalizing of the determinants of competitiveness and specifies data sources that will be used for quantification. As our application of Porter’s diamond model entails quite a number of indicators, Section 4 wraps up the indicators and presents the scoring methodology. Finally, Section 5 clarifies how the scores will graphically be presented.
2.1 Competitiveness: a relative and multidimensional concept
Although competitiveness is not precisely defined in economic theory, it is generally understood as the ability to successfully face competition. Competitiveness would then be the ability to sell products that meet demand requirements (price, quality, quantity) and, at the same time, ensure profits over time that enable the firm to thrive. However, there is an extensive library of literature on the determinants of competitiveness and how it is (or should be) measured (e.g Crouch and Ritchie, 1999; Krugman, 1994; Metcalfe et al., 1992; Gorton et al., 2013; Latruffe, 2010; Buckley et al., 1988). Spence and Hazard (1998) illustrate the complexity of the concept as follows (on (p. xvii):
“The problem of international competitiveness has been defined in highly diverse ways. These definitions (and the proposed solutions to the problem) are partially inconsistent, and thoroughly confusing to most academics, politicians, policy-makers, and business managers. There is good reason for this confusion. The collection of problems alluded to as “competitiveness” is genuinely complex. Disagreements frequently occur not only at the level of empirical effects and of policies, but also in the very definition of the problem. Well-intentioned and reasonable people find themselves talking at cross purposes; sometimes it almost seems they are addressing different subjects.”
The literature referenced above singles out different aspects and dimensions of competitiveness. From that we learn that competitiveness (Wijnands and Verhoog, 2015 (forthcoming)):
is a relative concept. Latruffe (2010: 50) states that “competitiveness should be measured with
respect to a benchmark.” Competitiveness is a comparison of their ability to face competition and
sell products between entities, such as firms, industries or nations (Siggel, 2006). The outcome
depends on who is compared with whom: being successful in competition with one specific entity
does not mean that you are also successful in competing with other entities. Hence,
competitiveness will differ with the selection of entities.
can be expressed at different aggregation levels, such as at goods or services, people, firms,
industries or countries.
has multi-dimensional features. The World Economic Forum, for instance, distinguishes over 100
indicators divided into 12 pillars to assess the global competitiveness of countries (Schwab, 2014).
Several authors stress that competitiveness is not measured by a singly indicator (Sagheer et al.,
2009, Metcalfe et al., 1992). Porter argues that five forces determine the long run competition,
whether on the international or domestic market, of any industry. Each force is measured by several
indicators (Porter, 1980b). Porter’s diamond model for analysing competition between nations
distinguishes four determinants, each with several sub-determinants for determining the
competitiveness between nations (Porter, 1990). Buckley et al. (1988) also propose several
indicators, depending on the (aggregation) level of analysis and time horizon. Siggel (2006) as well as
Latruffe (2010) underline the need to include not only economic (costs, productivity, value added)
and trade indicators (unit values, export indicators) but also institutional factors such as
infrastructure or government policies. The dimensions depend on the aim of the study. Krugman
11
(1994), for example, argues that it makes little sense to measure an industry’s competitiveness on
the export market if it is (almost) fully focused on the domestic market. The dimensions or
indicators also depend on the focus of the study. Argote and Ingram stress that competitive
advantage of firms is based on the creation and transfer of knowledge (Argote and Ingram, 2000),
highlighting innovation and knowledge as determinants of competitive potential.
is measured in many different ways. Several theories or schools of thought defining and analysing
competitiveness point at different indicators to measure it. From a strategic management
perspective, competitiveness refers to the conduct of companies in shaping organizational
advantages (Thompson and Strickland, 2003, Wright et al., 1998) and/or market advantages (Hamel
and Prahalad, 1994). Financial ratios (profit margin, current ratio, return on assets, debtor and
collector period) are the metrics in accounting (Fleisher and Bensoussan, 2003). Measuring
competitiveness with international economic indicators has its roots in Adam Smith’s trade theory,
which explains differences in competitiveness by way of absolute cost differences between
countries. However, the application of new trade theories entails incorporating a wider array of
aspects in the analysis such as product differentiation, innovation, economies of scale and
productivity (Van Berkum and Van Meijl, 2000). O'Mahoney and Van Ark focus on productivity,
explaining that productivity differences explain largely differences in competitiveness (O'Mahoney
and Van Ark, 2003).
may point at time horizons (Siggel, 2006). Several authors use sustainable gain in e.g. market share:
hence a comparison between two periods. According to Porter (1980, 1990) sustainable competitive
advantage is the fundamental source for above-average performance in the long run. Buckley et al.
(1988) also introduce the dynamic aspect in the measurement of competitiveness by three
characteristics: competitive performance (what it is), potential (what can be) and process (how to
reach potential), each with different indicators.
often has ambiguous linkages with policies. In her overview of studies on competitiveness in the
agricultural and agrifood sectors, Latruffe (2010) points to several authors indicating that the
measurements of competitiveness have to be interpreted with care as they may be distorted by
policy measures. Latruffe therefore argues that that competitiveness research should give more
attention to potential effects of agricultural policies and should investigate whether government
funds used to protect a country’s agriculture or agrifood sector and to support its competitiveness
could generate greater social welfare if they were used differently, either in other policies or in
other sectors of the economy. For instance, public investments in innovation, education or
infrastructure, or tax or labour policies may be more effective in enhancing competitiveness of the
agrifood sector than price support to the sector.
The previously presented considerations on the complexity of the concept of competitiveness would indeed suggest that it is impossible to define competitiveness. Still, we try and use a definition that combines several of the aspects mentioned above in the following: “Competitiveness of the agrifood (sub)sector in a CIS country is the sustained ability of that (sub)sector to achieve profitable gain and market share in domestic and export markets in which the industry is active, benchmarked against agrifood (sub)sectors in EU countries and over a period 2004-2012.” The wording “sustained ability” includes aspects of (ex-post) competitive performance as well as future potential, hence of what can be given the factor resources available and technology (investments) to use them efficiently. We will argue below that by applying Porter’s approach, we will capture these aspects. These aspects are also nicely structured in the framework developed by Buckley et al. (1988) and we will show how these two approaches are related in Chapter 4.
2.2 Porter’s models
Michael Porter, specialist in business strategy and industrial economics, developed several frameworks to analyse competitiveness. The industry and the firm are the principle units of analysis in his earlier work, and the nation plays a larger role in his later publications. In his book Competitive Strategy
12
(1980a) Porter analyses the competitiveness of an industry and develops a theoretical framework in which five forces are recognised as defining the nature and degree of competition in an industry. This approach constitutes an analytical framework to understand industries and competitors. Later on, in Competitive Advantage (1985) Porter focuses on competition of firms. In this book he introduces the concept of a value chain and elaborates principles of corporate competitive advantage based on the concepts of cost advantage, product differentiation and technology. Finally, in his book The Competitive Advantage of Nations, Porter’s focus is on national competitive advantage (Porter, 1990). In this book, he explains why some nations achieve disproportionate worldwide success in particular industries; apparently some national environments seem more stimulating to advancement and progress than others. Porter claims that, basically, four factors determine the competitive strength of a nation’s particular industry. The graphical arrangement of these factors as four points of a diamond gave the name to the model: Porter’s diamond. The diamond has been recognised as a breakthrough in the analysis of competitiveness (Tong-sŏng Cho, 2000). Porter’s key developed models are listed in Table 2.1.
Table 2.1 Porter’s main theories and approaches
Book Model Approach Level of analysis
Competitive Strategy (1980a)
Five forces framework
Five forces shape an industry structure. These determine industry attractiveness and profitability
Industry
Competitive Advantage (1985)
Generic strategies
Three strategies for achieving sustainable competitive advantage: differentiation, cost leadership and focus
Firm
Value chain framework
The firm is divided into the discrete activities it performs. These value chain activities are the building blocks of competitive advantage
Firm
The Competitive Advantage of Nations (1990)
The diamond
Competitive advantage of nations are influenced by four attributes that shape the environment in which firms compete
Nation
In principle, both of Porter’s theoretical frameworks - the five forces and the diamond - would suit the present research because they permit to examine competitiveness of industries. However, Porter’s two theories differ in scope. The five forces (industry competitors, substitutes, potential entrants, suppliers and buyers) present a comprehensive framework to help a firm analyse its industry as a whole and forecast that industry’s future evolution, to understand its competitors and its own position, and to translate this analysis into a competitive firm strategy. This framework is used to assess how firms achieve superior profitability, how they can best position themselves in order to maintain competitive in the long run, and how to respond to rivals’ actions (Porter, 1980a). Porter’s framework of five forces, however, has received criticism. Grundy (2006), for instance, lists a number of drawbacks to the five forces framework, such as being (too) abstract and rigid, highly analytical and prescriptive. Moreover, Porter’s framework does not stipulate a methodology for measuring competitiveness; it is qualitative rather than quantitative, which would imply a need for further thinking how to effectively operationalise the framework. A more operationalised framework would be very useful for firms to assess their position in an industry. However, we also need a broader focus, as we want to examine the world market and government policies as the arena in which agrifood sectors compete.
The diamond model has this broader view. The diamond model examines industries as well, but at the same time defines four broad attributes of a nation that shape the environment in which industries compete and that promote or impede the creation of their competitive advantage. The framework allows the assessment of why some companies based in some nations innovate more than others, and why some nations’ environments enable companies to improve and innovate faster than foreign rivals (Porter, 1990). As Grundy (2006) summarises: the diamond works on a macro level while the five forces framework is formulated in microeconomic language. For our purposes, the diamond model is better suited as an analytical framework for assessing the competitive positions of food industries among competing countries.
13
2.3 Porter’s diamond approach and operationalisation
2.3.1 Porter’s diamond
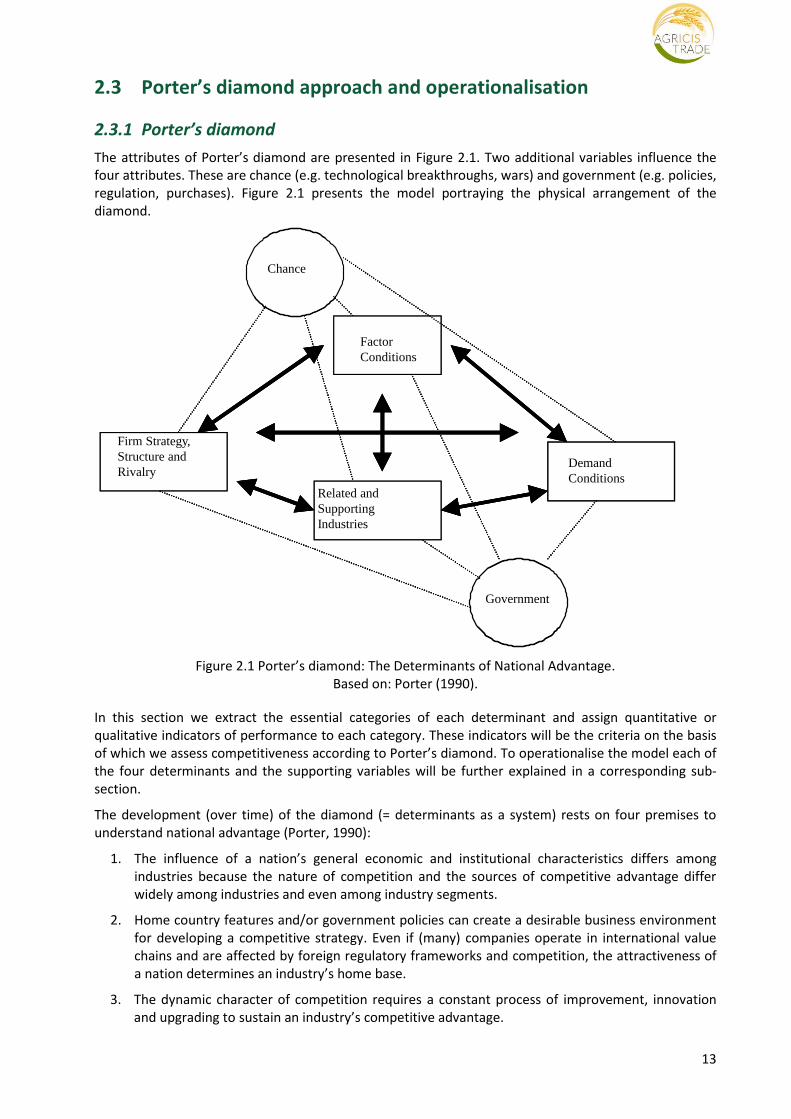
The attributes of Porter’s diamond are presented in Figure 2.1. Two additional variables influence the four attributes. These are chance (e.g. technological breakthroughs, wars) and government (e.g. policies, regulation, purchases). Figure 2.1 presents the model portraying the physical arrangement of the diamond.
Figure 2.1 Porter’s diamond: The Determinants of National Advantage. Based on: Porter (1990).
In this section we extract the essential categories of each determinant and assign quantitative or qualitative indicators of performance to each category. These indicators will be the criteria on the basis of which we assess competitiveness according to Porter’s diamond. To operationalise the model each of the four determinants and the supporting variables will be further explained in a corresponding sub-section.
The development (over time) of the diamond (= determinants as a system) rests on four premises to understand national advantage (Porter, 1990):
1. The influence of a nation’s general economic and institutional characteristics differs among industries because the nature of competition and the sources of competitive advantage differ widely among industries and even among industry segments.
2. Home country features and/or government policies can create a desirable business environment for developing a competitive strategy. Even if (many) companies operate in international value chains and are affected by foreign regulatory frameworks and competition, the attractiveness of a nation determines an industry’s home base.
3. The dynamic character of competition requires a constant process of improvement, innovation and upgrading to sustain an industry’s competitive advantage.
binnenlandse
vraag
aanbod
netwerk
bedrijvenstructuur
en strategie
kansen
overheid
Demand
Conditions
Factor
Conditions
Related and
Supporting
Industries
Firm Strategy,
Structure and
Rivalry
Chance
Government
14
4. Firms with an international competitive advantage are often those that innovate and/or invest in market opportunities.
In next subsections we will use the following terminology:
1. Determinants are the four attributes of Porters’ diamond as well as the two additional variables. 2. Categories are elements of the determinants. 3. Sub-categories are more detailed categories, at which level indicators of performance are assigned. 4. Indicators are metrics of these (sub-)categories.
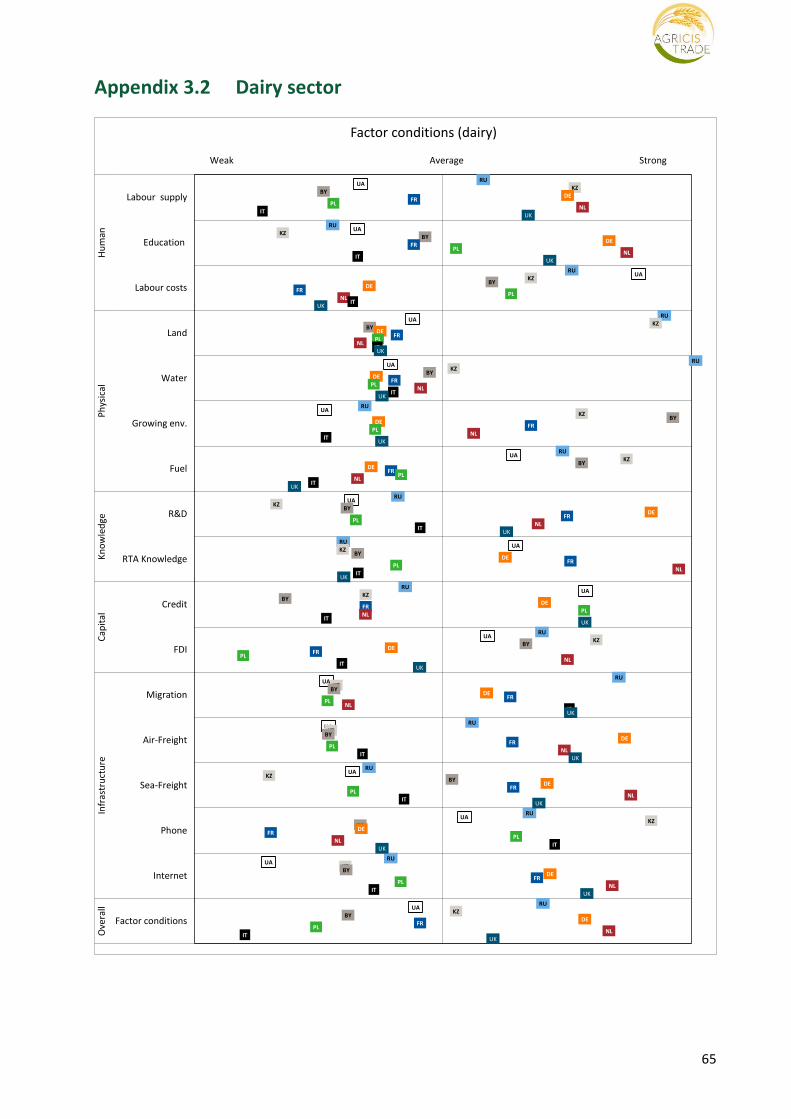
2.3.2 Determinant: Factor conditions
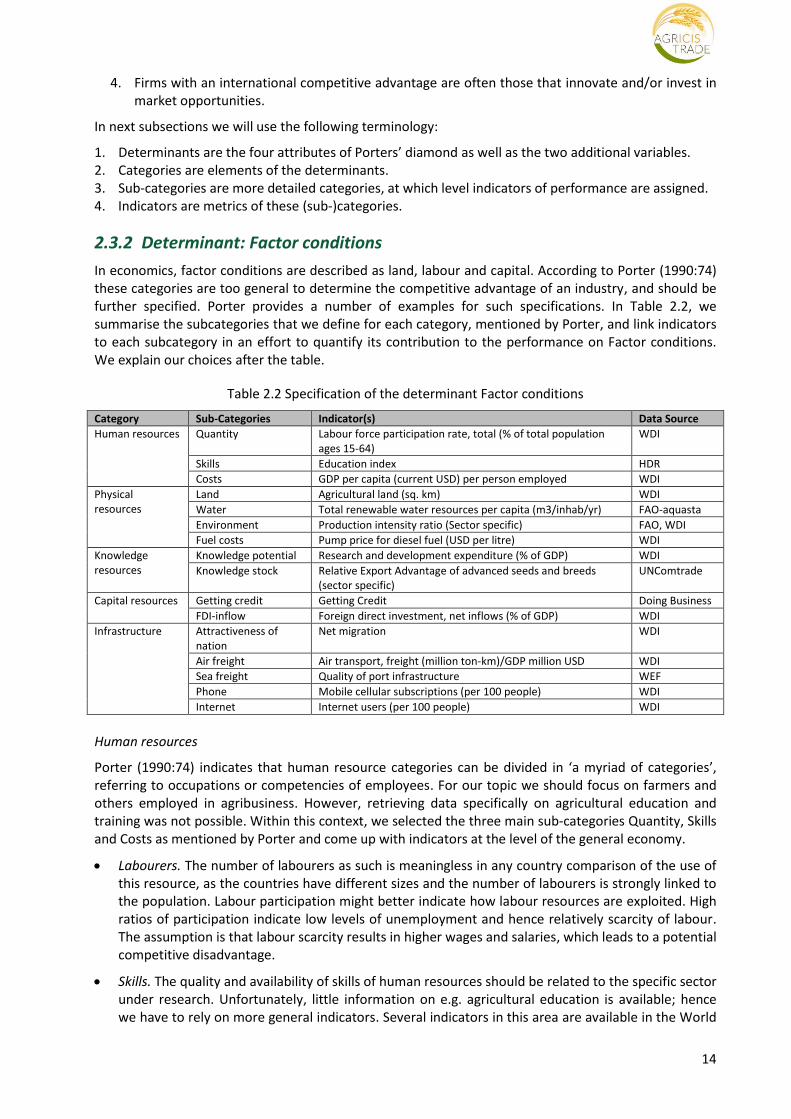
In economics, factor conditions are described as land, labour and capital. According to Porter (1990:74) these categories are too general to determine the competitive advantage of an industry, and should be further specified. Porter provides a number of examples for such specifications. In Table 2.2, we summarise the subcategories that we define for each category, mentioned by Porter, and link indicators to each subcategory in an effort to quantify its contribution to the performance on Factor conditions. We explain our choices after the table.
Table 2.2 Specification of the determinant Factor conditions
Category Sub-Categories Indicator(s) Data Source
Human resources Quantity Labour force participation rate, total (% of total population ages 15-64)
WDI
Skills Education index HDR
Costs GDP per capita (current USD) per person employed WDI
Physical resources
Land Agricultural land (sq. km) WDI
Water Total renewable water resources per capita (m3/inhab/yr) FAO-aquasta
Environment Production intensity ratio (Sector specific) FAO, WDI
Fuel costs Pump price for diesel fuel (USD per litre) WDI
Knowledge resources
Knowledge potential Research and development expenditure (% of GDP) WDI
Knowledge stock Relative Export Advantage of advanced seeds and breeds (sector specific)
UNComtrade
Capital resources Getting credit Getting Credit Doing Business
FDI-inflow Foreign direct investment, net inflows (% of GDP) WDI
Infrastructure Attractiveness of nation
Net migration WDI
Air freight Air transport, freight (million ton-km)/GDP million USD WDI
Sea freight Quality of port infrastructure WEF
Phone Mobile cellular subscriptions (per 100 people) WDI
Internet Internet users (per 100 people) WDI
Human resources
Porter (1990:74) indicates that human resource categories can be divided in ‘a myriad of categories’, referring to occupations or competencies of employees. For our topic we should focus on farmers and others employed in agribusiness. However, retrieving data specifically on agricultural education and training was not possible. Within this context, we selected the three main sub-categories Quantity, Skills and Costs as mentioned by Porter and come up with indicators at the level of the general economy.
Labourers. The number of labourers as such is meaningless in any country comparison of the use of this resource, as the countries have different sizes and the number of labourers is strongly linked to the population. Labour participation might better indicate how labour resources are exploited. High ratios of participation indicate low levels of unemployment and hence relatively scarcity of labour. The assumption is that labour scarcity results in higher wages and salaries, which leads to a potential competitive disadvantage.
Skills. The quality and availability of skills of human resources should be related to the specific sector under research. Unfortunately, little information on e.g. agricultural education is available; hence we have to rely on more general indicators. Several indicators in this area are available in the World
15
Development Indicators (WDI) database of the World Bank, such as literacy or participation in primary education. To limit the number of indicators we will use the Education Index from the Human Development Report (HDR) that includes among others literacy, population with secondary education, gross enrolment ratio, trained teachers or education expenditures ((UNDP, 2014), p192). A high index indicates a high level of skills that contributes to a country’s competitive advantage.
Costs. Little specific information on factor costs is available, such as labour costs for agricultural workers. To include labour costs in our overview we use GDP per person employed as indicator. Generally, wages are linked to the gross domestic products. However, labour costs are the largest item of production costs in agribusiness. To be able to make comparisons between countries a proxy for wages used in this research is the GDP constant in 2,000 USD per person economically active. A high level of GDP/capita (as the interpretation of high wages) indicates a competitive disadvantage.
Physical resources
Physical resources refer to natural resources (agricultural land, water resources), climate but also to a nation’s location, geographical size and other physical traits. Abundance, quality, accessibility and costs determine a nations advantage (Porter (1990),p74).
Land. The availability of agricultural land is an inappropriate indicator for potential production, as quality should be included. However, there is little information on land quality in world covering databases. Therefore, we include the area of agricultural land as the indicator for the potential to increase production. A large agricultural area indicates a country’s competitive advantage in agrifood production. We did not chose countries’ total area surface as mountains, lakes, deserts or urban areas add little to agricultural production potential.
Water. Water availability affects agricultural production importantly: plant growth potentials are seriously limited in arid areas. Total annual renewable water resources per inhabitant measured by the FAO gives a measure of water availability in the country considering its size. A high index is a positive indicator of a country’s availability of renewable water resources, and hence of a competitive advantage in agriculture.
Environment. Favourable growing conditions depend on the requirements of the crops regarding days of sunshine, light intensity, humidity and temperatures. Effects of climate on agricultural production are influenced by several factors such as latitude, altitude, winds, distance from the sea and soil. To classify world’s climates there are several systems, from which the Köppen climate classification is popular (Peel et al., 2007). It is based on native vegetation as expression of the climate of the zone. The largest areas of the CIS countries (Belarus, Russia and Ukraine) as well a part of the EU (Central and East European countries, Scandinavian countries and Eastern part Germany) have a continental climate with warm to cool summers and cold winters. Other countries have mainly a temperate climate with warm and humid summers with mild winters. We will, however, not include a climate classification in our analyses, as the climatic features may not be distinguishing enough for the countries subject to our study. Moreover, the impact of climate can be mitigated by technology, as for instance the examples of Dutch vegetable and floriculture sector show where the ‘inhospitable climate’ resulted in upgrading the cultivation techniques in greenhouses, artificial heating and light.
To recognise the suitability of growing crops or animal husbandry we introduce a production specialisation ratio (table 2.3). The ratio is the harvested area (for crops) and/or stocks of animals per inhabitant. The ratio expresses a degree of specialisation, it recognises a country’s production abilities and is independent of the country or population size. Large ratios point at countries having favourable natural resources or at being able to adapt to unfavourable natural conditions, for instance through greenhouse production and/or irrigation works. The ratio also points to the ability of upgrading the natural resources from basic to advantage production factors as is shown by the abovementioned Dutch example.
16
Table 2.3 Production intensity ratio per sector
Sector Indicator*
Dairy Stocks of live cattle per inhabitant
Pork Stocks of live pigs per inhabitant Poultry Stocks of live chickens per inhabitant Cereals Area harvested cereals total+ (Total per inhabitant
Oilseeds Area harvested oil crops primary+ (Total) per inhabitant Wine Area harvested grapes per inhabitant Potatoes Area harvested potatoes per inhabitant Tomatoes Area harvested tomatoes per inhabitant Apples Area harvested apples per inhabitant
*Databases: FAOstat databases on production and WDI for inhabitants
Fuel costs. The availability of energy resources is important to agriculture as an major input for the logistics of its rather bulky and/differentiated (e.g. cold chain) products, for producing fertilizers and for energy for machinery either for land cultivation or husbandry. As indicator we use the price at the gasoline pump. Higher prices indicate a disadvantage. As a note we acknowledge the strong influence that government policies may have on energy prices (via taxes, subsidies), but assume that differences in the value of the indicator across countries are primarily caused by availability of energy as a natural resource in the country.
Knowledge resources
This category refers to a nation’s stock of scientific, technical and market knowledge on goods and services.
Knowledge potential. A suitable indicator for measuring the level of knowledge would be the Technology achievement index developed for the Human Development Report 2001. That index covers the creation of technology, diffusion of innovation and human skills (Desai et al., 2002). However, that index has not been updated since 1999, so we have to look for an alternative. Data on patents are available, but not on a global scale, nor for all EU and CIS countries subject to this study. Moreover, agribusiness-related patents are not always registered in a way it is clear that they are specifically related to the agribusiness sector. Furthermore, agricultural and food processing have relatively low levels of patents application (Lippoldt, 2015). For that reason, the share of expenditure on research and development in the GDP is taken as a measure of a country’s knowledge base and its potential: assuming that it also affects agrifood sectors. This indicator includes the input for knowledge development. High levels are considered to add to a country’s agrifood sector competitive advantage.
Advanced Knowledge stock. Not all factors contribute to competitive advantage in the same proportion; indicators should measure the performance of factors, according to its relative importance on competitive advantage. Porter distinguishes a hierarchy among factors as follows:
1. Basic versus advanced factors:
a. Basic factors include inhere factors of a country, like natural resources, climate and geographical location. They are important in the primary sector in general. They must be of sufficient quantity and quality to allow the creation of related advanced factors.
b. Advanced factors: are often build on basic factors and the result of large and often sustained investments in human and physical capital. Examples are differentiated products, proprietary production technology, and infrastructure.
2. Generalised versus specialized factors:
a. Generalised factors: can be deployed in a wide range of industries.
b. Specialised factors: factors with relevance to a limited range or to just a single industry like narrowly skilled personnel, infrastructure with specific properties, knowledge bases
17
in particular fields. They are scarce because they require focused and often risky private and social investment.
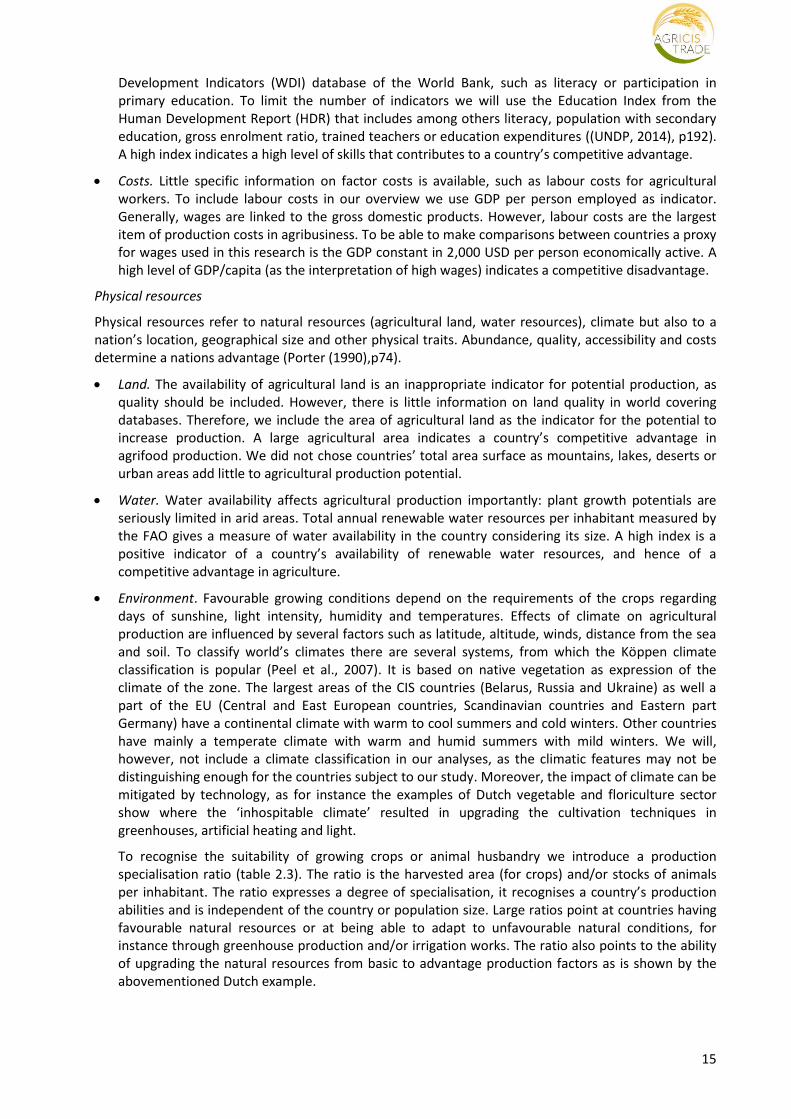
Figure 2.2 shows the interlinkage of basic/advantage factors versus generalised/specialised factors and its impact on a country’s competitive advantage.
Specialised Most significant and
sustainable competitive advantage
Generalised
Basic Advanced
Figure 2.2 Interlinkage of basic/advanced factors versus generalised/specialised factors (Based on Porter, 1990)
Important assets in agriculture are advanced seeds in crop production and advanced breeds in animal husbandry. These products are examples of embedded technology: knowledge that is being put in the development of a product: hence specialised and advanced. International trade statistics provide information on the exports and imports of such advanced inputs. We use export data, based on the Relative Export Advantage (RXA) indicator, as proxy for the availability of such knowledge (Table 2.4).
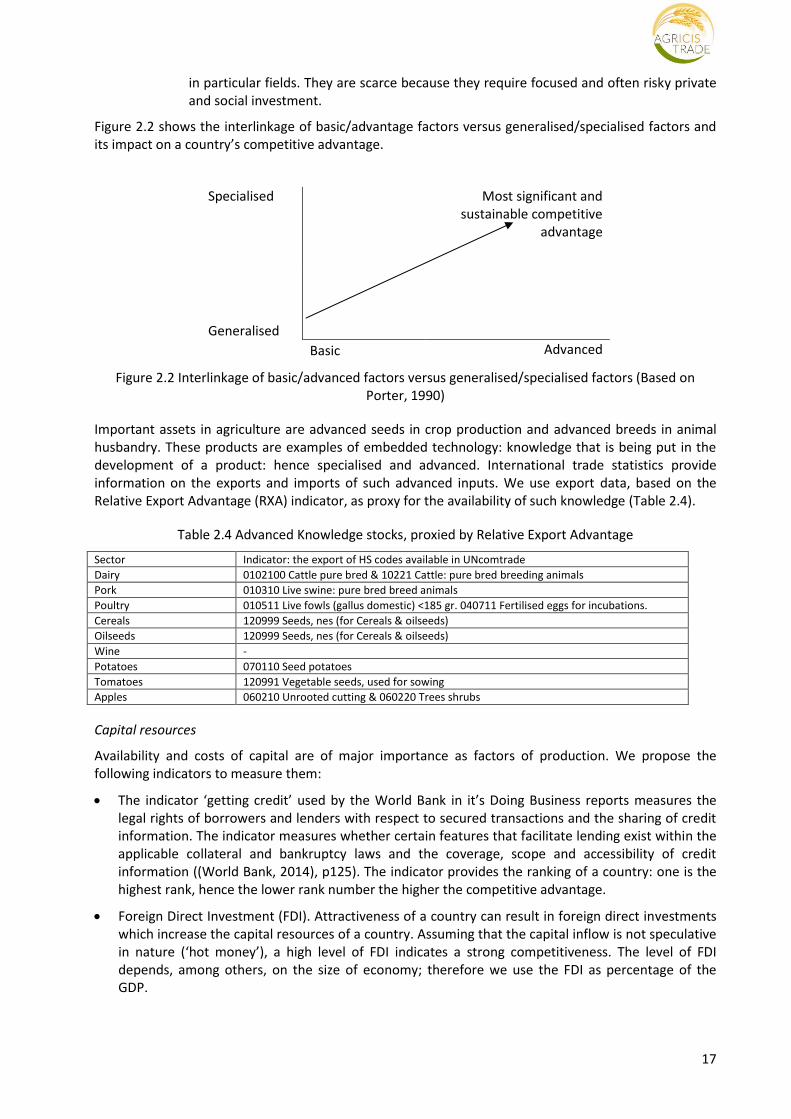
Table 2.4 Advanced Knowledge stocks, proxied by Relative Export Advantage
Sector Indicator: the export of HS codes available in UNcomtrade
Dairy 0102100 Cattle pure bred & 10221 Cattle: pure bred breeding animals
Pork 010310 Live swine: pure bred breed animals
Poultry 010511 Live fowls (gallus domestic) <185 gr. 040711 Fertilised eggs for incubations.
Cereals 120999 Seeds, nes (for Cereals & oilseeds)
Oilseeds 120999 Seeds, nes (for Cereals & oilseeds)
Wine -
Potatoes 070110 Seed potatoes
Tomatoes 120991 Vegetable seeds, used for sowing
Apples 060210 Unrooted cutting & 060220 Trees shrubs
Capital resources
Availability and costs of capital are of major importance as factors of production. We propose the following indicators to measure them:
The indicator ‘getting credit’ used by the World Bank in it’s Doing Business reports measures the legal rights of borrowers and lenders with respect to secured transactions and the sharing of credit information. The indicator measures whether certain features that facilitate lending exist within the applicable collateral and bankruptcy laws and the coverage, scope and accessibility of credit information ((World Bank, 2014), p125). The indicator provides the ranking of a country: one is the highest rank, hence the lower rank number the higher the competitive advantage.
Foreign Direct Investment (FDI). Attractiveness of a country can result in foreign direct investments which increase the capital resources of a country. Assuming that the capital inflow is not speculative in nature (‘hot money’), a high level of FDI indicates a strong competitiveness. The level of FDI depends, among others, on the size of economy; therefore we use the FDI as percentage of the GDP.
18
Infrastructure
Type, quality and cost of infrastructure affects competitiveness. Infrastructures includes transport systems, communication and mail systems as well cultural institutions that affect quality of life ((Porter, 1990) p.75).
For the quality of cultural institutions we use the net-migration index (published in the World Bank’s WDI) as a proxy to measure the attractiveness to live in a country and to assess the possibility of brain drain. The WDI net-migration index measures the difference between the number of persons leaving and entering a country during the year. A positive index means there is net immigration while negative figures mean there is net emigration. A high index is a positive indicator of a country’s attractiveness to live and to work, although a high positive net-migration does not signal a comparative advantage if it is the result of conflicts, e.g. the high levels of refugees in Turkey and Lebanon in 2015. Such emergency cases did not occur in the period and countries subject to this study.
World Bank’s WDI provides among others indicators for the performance of transport:
Air transport. For air transport, freight (million ton-km) will be used as a performance indicator instead of registered departure of carriers. The latter does not provided information on the quantity, where the former does. The indicator will take into account the size of the economy: we propose to use as indicator freight ton-km /GDP USD. The GDP expresses the level of economic activity of a country which we prefer above freight ton-km /inhabitants. A higher level is seen as being more competitive.
Seaport. For (sea-)port performance indicators several options are available such as container port traffic (performance indicator), Liner shipping connectivity index (based on among others number and size of vessels, number of service and companies) or the quality of port infrastructure assessed by the World Economic Forum (1=extremely underdeveloped to 7=well developed and efficient by international standards). The latter two show a strong correlation and for that reason only one will be selected. The first one - container port traffic - is correlated with the level of economic activity in the country. We prefer the quality of port infrastructure as this indicates the potential of the country and this data is available for most countries.
Roads. World Bank’s WDI used to but no longer provides information on paved roads. Hence we will not use that variable.
Communications infrastructure is related to ICT. We selected two indicators for which high(er) levels (compared to benchmark countries) indicate better competitiveness:
Mobile phones. Phones enable direct communication between people on a long distance. We selected the mobile cellular subscriptions per 100 people instead of fixed lines. The investments for cellular phones networks are lower and cellular phones are widely used as main phone connections.
Internet access. Internet access enables retrieving information (e.g. market prices, documentation) and written communication (e.g. contract) between people. For this purpose we use Internet users per 100 people.
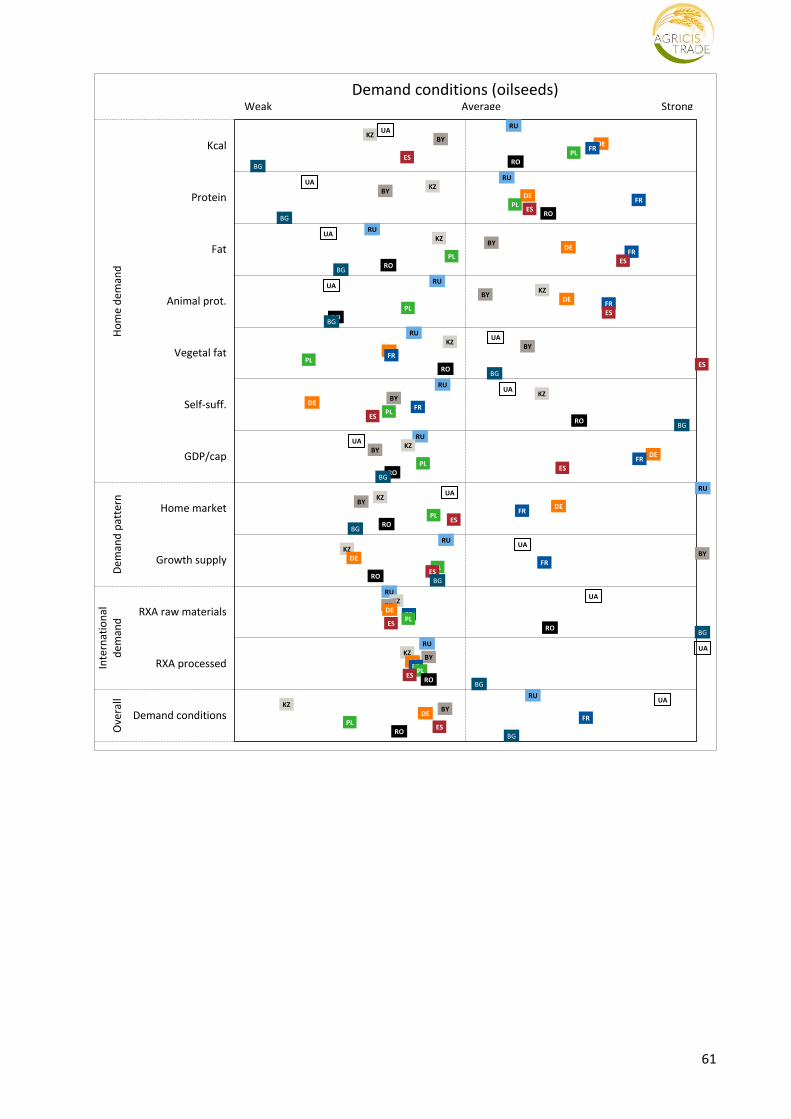
2.3.3 Determinant: Demand conditions
In Porter’s analytical framework (1990:86) home market demand conditions also play an important role in determining competitive advantage of a nation. Home market demand shapes how domestic firms perceive, interpret and respond to buyers’ preferences. The basic hypothesis is that domestic firms understand more quickly changes in these preferences due to cultural nearness of these buyers. Home market demand is also less prone to fluctuations such as those caused on external markets by exchange rate changes or trade policy changes in destination countries. This provides a more dependable base and can reduce risk, thus fostering investment We will discuss below the categories and subcategories Porter distinguishes within this determinant and which indicators can be used to measure the agribusiness’ responsiveness to home market demand developments. However, quantifying indicators
19
of the categories and subcategories that Porter enumerates requires detailed information that is not always easily available in databases covering all countries in the world. Home demand composition
Segment structure of demand. The demand for particular food varieties segments markets. In agribusiness, a wide range of differentiated products can be distinguished. For example, consumers can buy potatoes fresh in bulk, fresh washed and bagged, processed in French fries or in chips, part of ready-to-eat meal or in other forms when eating out-of-home. Detailed information on how much of each differentiated product consumers demand is not available in global databases. The hypothesis is that consumers with high incomes demand quality and differentiated products in line with the pyramid of Maslow's hierarchy of needs. Consumers want products that satisfy basic needs but also contribute to self-actualization and self-fulfilment needs. Indicators that serve our purpose of measuring demand segmentation are derived from FAOstat’s food supply balances. These indicators are levels of protein consumption from animal origin (which are seen as higher valued products), and fat consumption (in many processed and ready-to eat food products, fat is an essential ingredient for sensory and taste aspects of the food). Furthermore, the consumption of vegetable fats are increasing with increasing demand for differentiated products e.g. low levels saturated fatty acids in vegetable oil compared to animal fats or cooking oils with specific tastes (olive oil, sesame oil).
Table 2.5 Specification of the determinant demand conditions
Category Subcategories Indicator(s) Data Source
Home demand composition
Segment structure of demand Food supply (kcal/capita/day)
FAOstat
Protein supply (g/capita/day) FAOstat
Fat supply (g/capita/day) FAOstat
Share animal protein (%) FAOstat
Share vegetable fat (%) FAOstat
Sophisticated and demanding buyers Self-sufficiency (Production/domestic consumption)
FAOstat
GDP/capita WDI
Anticipatory buyer needs None
Demand size and pattern of growth
Size of the home market Population size WDI
Number of independent buyers None
Rate of growth of home demand Annual growth domestic supply (% over 10 years)
Table 2.6
Early home demand None -
Early saturation None -
Internationalisation of domestic demand
Mobile or multinational local buyers Relative Export Advantage (RXA) index Table 2.7
Influences on foreign needs Idem
Sophisticated and demanding buyers.
Porter argues that if domestic buyers are among the most demanding and sophisticated buyers, a nation will gain competitive advantage. At their home market domestic suppliers have a major advantage over foreign suppliers concerning anticipation of buyer needs and proximity to the actual buyer. Little or no public and standardised databases are available that measure these benefits, though. For this reason we use two proxies, one that indicates to what extent domestic production covers domestic demand (self-sufficiency) and one that indicates the extent of sophistication (income per capita).
Self-sufficiency
The self-sufficiency ratio measures the relation between the domestic production and the demand and can serve as a proxy for serving domestic demand. A high(er) level of self-sufficiency (share of domestic demand covered by domestic production) indicates a high(er) performance in meeting the domestic consumer’s requirements. These requirements are not only quantity but also quality oriented. If the quality does not match with the consumer preferences, imports will occur. GDP/capita. GDP/capita works through its effects on the demand for complementary goods and services that go into processing
20
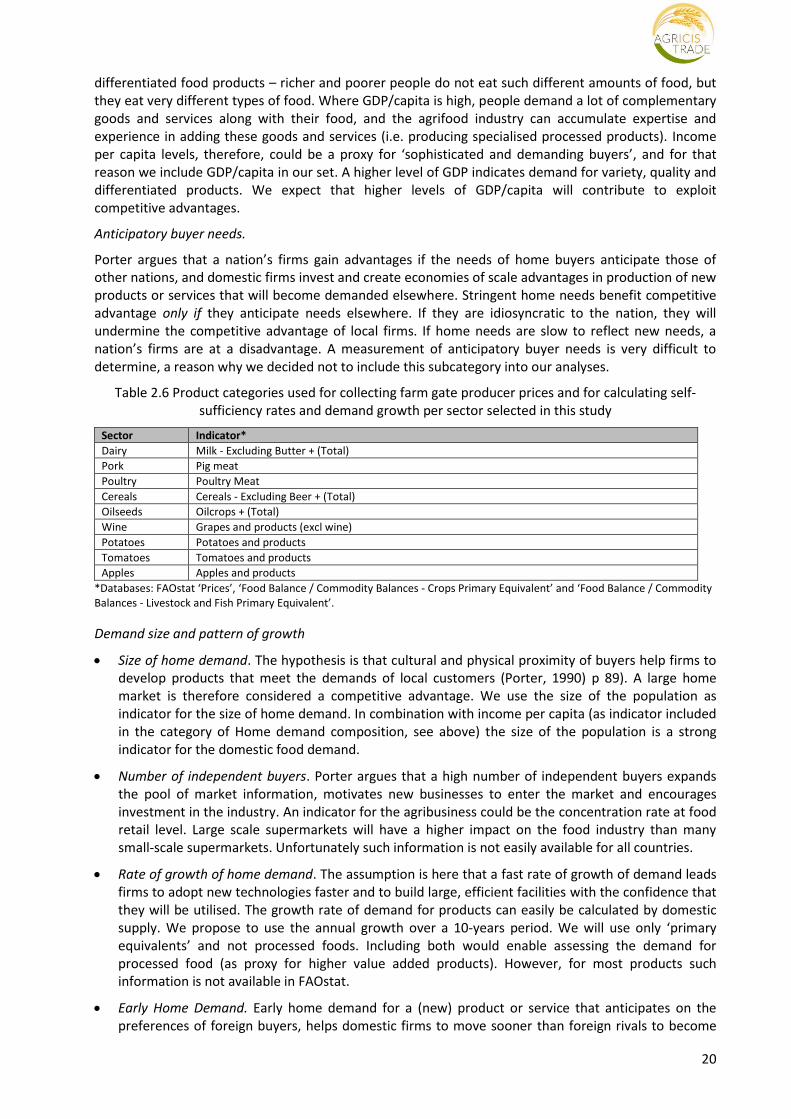
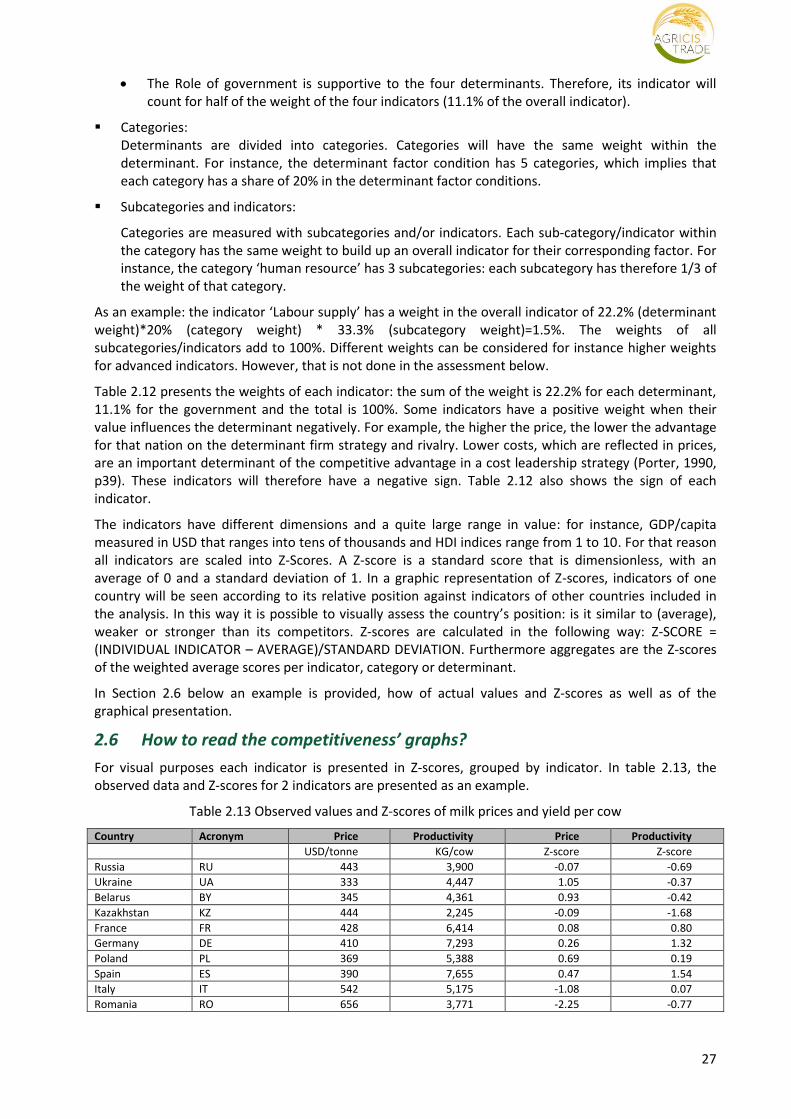
differentiated food products – richer and poorer people do not eat such different amounts of food, but they eat very different types of food. Where GDP/capita is high, people demand a lot of complementary goods and services along with their food, and the agrifood industry can accumulate expertise and experience in adding these goods and services (i.e. producing specialised processed products). Income per capita levels, therefore, could be a proxy for ‘sophisticated and demanding buyers’, and for that reason we include GDP/capita in our set. A higher level of GDP indicates demand for variety, quality and differentiated products. We expect that higher levels of GDP/capita will contribute to exploit competitive advantages.
Anticipatory buyer needs.
Porter argues that a nation’s firms gain advantages if the needs of home buyers anticipate those of other nations, and domestic firms invest and create economies of scale advantages in production of new products or services that will become demanded elsewhere. Stringent home needs benefit competitive advantage only if they anticipate needs elsewhere. If they are idiosyncratic to the nation, they will undermine the competitive advantage of local firms. If home needs are slow to reflect new needs, a nation’s firms are at a disadvantage. A measurement of anticipatory buyer needs is very difficult to determine, a reason why we decided not to include this subcategory into our analyses.
Table 2.6 Product categories used for collecting farm gate producer prices and for calculating self-sufficiency rates and demand growth per sector selected in this study
Sector Indicator*
Dairy Milk - Excluding Butter + (Total)
Pork Pig meat
Poultry Poultry Meat
Cereals Cereals - Excluding Beer + (Total)
Oilseeds Oilcrops + (Total)
Wine Grapes and products (excl wine)
Potatoes Potatoes and products
Tomatoes Tomatoes and products
Apples Apples and products
*Databases: FAOstat ‘Prices’, ‘Food Balance / Commodity Balances - Crops Primary Equivalent’ and ‘Food Balance / Commodity Balances - Livestock and Fish Primary Equivalent’.
Demand size and pattern of growth
Size of home demand. The hypothesis is that cultural and physical proximity of buyers help firms to develop products that meet the demands of local customers (Porter, 1990) p 89). A large home market is therefore considered a competitive advantage. We use the size of the population as indicator for the size of home demand. In combination with income per capita (as indicator included in the category of Home demand composition, see above) the size of the population is a strong indicator for the domestic food demand.
Number of independent buyers. Porter argues that a high number of independent buyers expands the pool of market information, motivates new businesses to enter the market and encourages investment in the industry. An indicator for the agribusiness could be the concentration rate at food retail level. Large scale supermarkets will have a higher impact on the food industry than many small-scale supermarkets. Unfortunately such information is not easily available for all countries.
Rate of growth of home demand. The assumption is here that a fast rate of growth of demand leads firms to adopt new technologies faster and to build large, efficient facilities with the confidence that they will be utilised. The growth rate of demand for products can easily be calculated by domestic supply. We propose to use the annual growth over a 10-years period. We will use only ‘primary equivalents’ and not processed foods. Including both would enable assessing the demand for processed food (as proxy for higher value added products). However, for most products such information is not available in FAOstat.
Early Home Demand. Early home demand for a (new) product or service that anticipates on the preferences of foreign buyers, helps domestic firms to move sooner than foreign rivals to become
21
established in an industry ((Porter, 1990), p95). As we could not find any information on innovative products, we will not include this subcategory.
Early saturation. Saturation forces local firms to continue innovating and upgrading. Saturation escalates local rivalry. It may also give a reason to export, especially when combined with growth of foreign markets. Early saturation is an advantage if home demand composition directs a nation’s firms to products and products features that are desired abroad. Again, no information in publicly available database has been found to measure ‘saturation’ meaningfully.
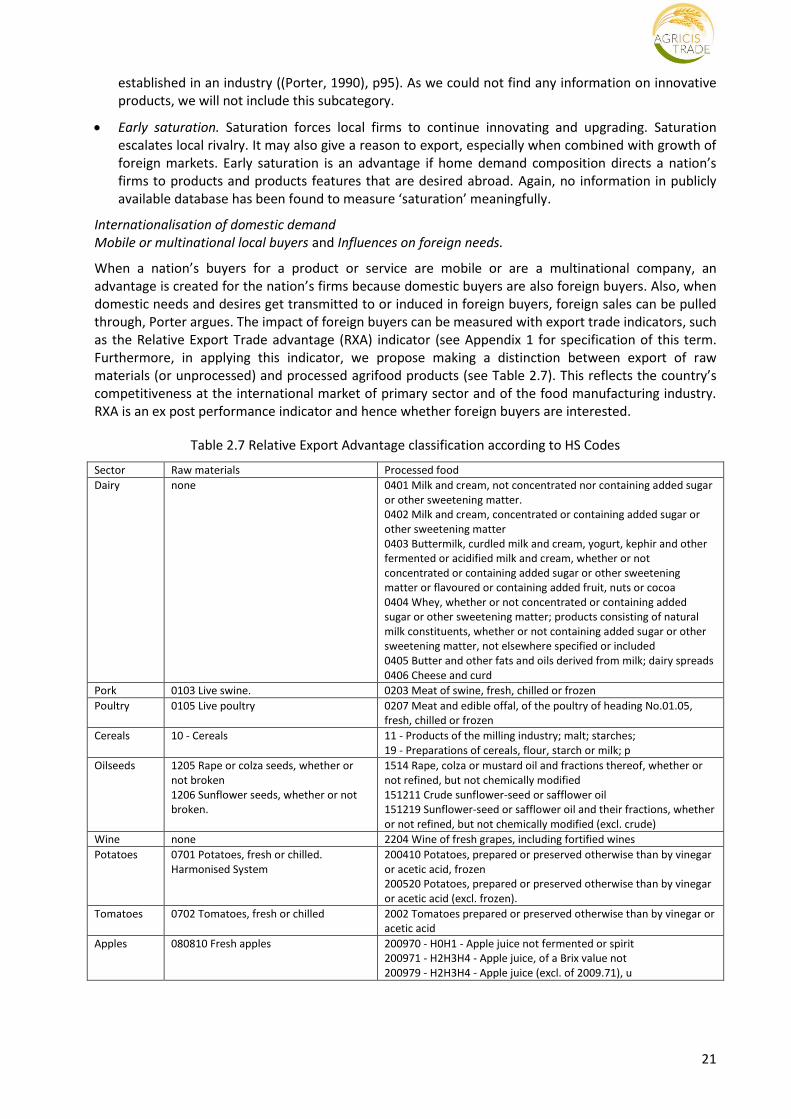
Internationalisation of domestic demand Mobile or multinational local buyers and Influences on foreign needs.
When a nation’s buyers for a product or service are mobile or are a multinational company, an advantage is created for the nation’s firms because domestic buyers are also foreign buyers. Also, when domestic needs and desires get transmitted to or induced in foreign buyers, foreign sales can be pulled through, Porter argues. The impact of foreign buyers can be measured with export trade indicators, such as the Relative Export Trade advantage (RXA) indicator (see Appendix 1 for specification of this term. Furthermore, in applying this indicator, we propose making a distinction between export of raw materials (or unprocessed) and processed agrifood products (see Table 2.7). This reflects the country’s competitiveness at the international market of primary sector and of the food manufacturing industry. RXA is an ex post performance indicator and hence whether foreign buyers are interested.
Table 2.7 Relative Export Advantage classification according to HS Codes
Sector Raw materials Processed food
Dairy none 0401 Milk and cream, not concentrated nor containing added sugar or other sweetening matter. 0402 Milk and cream, concentrated or containing added sugar or other sweetening matter 0403 Buttermilk, curdled milk and cream, yogurt, kephir and other fermented or acidified milk and cream, whether or not concentrated or containing added sugar or other sweetening matter or flavoured or containing added fruit, nuts or cocoa 0404 Whey, whether or not concentrated or containing added sugar or other sweetening matter; products consisting of natural milk constituents, whether or not containing added sugar or other sweetening matter, not elsewhere specified or included 0405 Butter and other fats and oils derived from milk; dairy spreads 0406 Cheese and curd
Pork 0103 Live swine. 0203 Meat of swine, fresh, chilled or frozen
Poultry 0105 Live poultry 0207 Meat and edible offal, of the poultry of heading No.01.05, fresh, chilled or frozen
Cereals 10 - Cereals 11 - Products of the milling industry; malt; starches; 19 - Preparations of cereals, flour, starch or milk; p
Oilseeds 1205 Rape or colza seeds, whether or not broken 1206 Sunflower seeds, whether or not broken.
1514 Rape, colza or mustard oil and fractions thereof, whether or not refined, but not chemically modified 151211 Crude sunflower-seed or safflower oil 151219 Sunflower-seed or safflower oil and their fractions, whether or not refined, but not chemically modified (excl. crude)
Wine none 2204 Wine of fresh grapes, including fortified wines
Potatoes 0701 Potatoes, fresh or chilled. Harmonised System
200410 Potatoes, prepared or preserved otherwise than by vinegar or acetic acid, frozen 200520 Potatoes, prepared or preserved otherwise than by vinegar or acetic acid (excl. frozen).
Tomatoes 0702 Tomatoes, fresh or chilled 2002 Tomatoes prepared or preserved otherwise than by vinegar or acetic acid
Apples 080810 Fresh apples 200970 - H0H1 - Apple juice not fermented or spirit 200971 - H2H3H4 - Apple juice, of a Brix value not 200979 - H2H3H4 - Apple juice (excl. of 2009.71), u
22
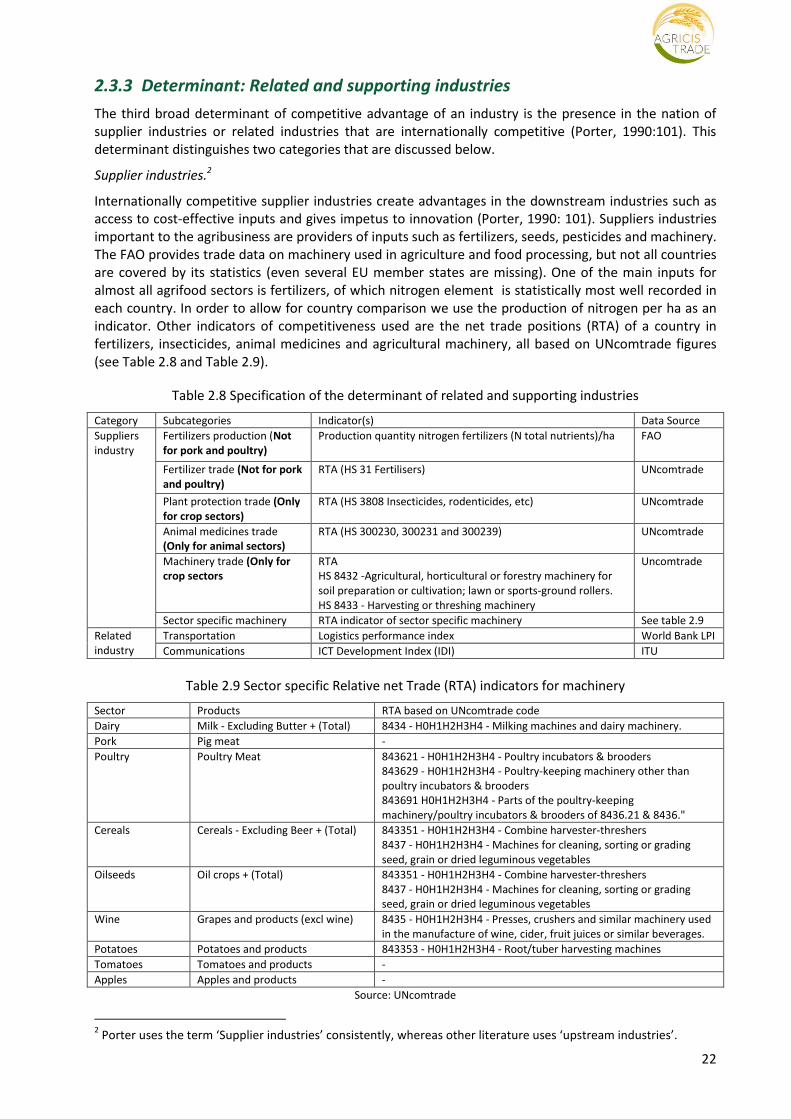
2.3.3 Determinant: Related and supporting industries
The third broad determinant of competitive advantage of an industry is the presence in the nation of supplier industries or related industries that are internationally competitive (Porter, 1990:101). This determinant distinguishes two categories that are discussed below.
Supplier industries.2
Internationally competitive supplier industries create advantages in the downstream industries such as access to cost-effective inputs and gives impetus to innovation (Porter, 1990: 101). Suppliers industries important to the agribusiness are providers of inputs such as fertilizers, seeds, pesticides and machinery. The FAO provides trade data on machinery used in agriculture and food processing, but not all countries are covered by its statistics (even several EU member states are missing). One of the main inputs for almost all agrifood sectors is fertilizers, of which nitrogen element is statistically most well recorded in each country. In order to allow for country comparison we use the production of nitrogen per ha as an indicator. Other indicators of competitiveness used are the net trade positions (RTA) of a country in fertilizers, insecticides, animal medicines and agricultural machinery, all based on UNcomtrade figures (see Table 2.8 and Table 2.9).
Table 2.8 Specification of the determinant of related and supporting industries
Category Subcategories Indicator(s) Data Source
Suppliers industry
Fertilizers production (Not for pork and poultry)
Production quantity nitrogen fertilizers (N total nutrients)/ha FAO
RTA HS 8432 -Agricultural, horticultural or forestry machinery for soil preparation or cultivation; lawn or sports-ground rollers. HS 8433 - Harvesting or threshing machinery
Uncomtrade
Sector specific machinery RTA indicator of sector specific machinery See table 2.9
Related industry
Transportation Logistics performance index World Bank LPI
Communications ICT Development Index (IDI) ITU
Table 2.9 Sector specific Relative net Trade (RTA) indicators for machinery
Poultry Poultry Meat 843621 - H0H1H2H3H4 - Poultry incubators & brooders 843629 - H0H1H2H3H4 - Poultry-keeping machinery other than poultry incubators & brooders 843691 H0H1H2H3H4 - Parts of the poultry-keeping machinery/poultry incubators & brooders of 8436.21 & 8436."
Cereals Cereals - Excluding Beer + (Total) 843351 - H0H1H2H3H4 - Combine harvester-threshers 8437 - H0H1H2H3H4 - Machines for cleaning, sorting or grading seed, grain or dried leguminous vegetables
Oilseeds Oil crops + (Total) 843351 - H0H1H2H3H4 - Combine harvester-threshers 8437 - H0H1H2H3H4 - Machines for cleaning, sorting or grading seed, grain or dried leguminous vegetables
Wine Grapes and products (excl wine) 8435 - H0H1H2H3H4 - Presses, crushers and similar machinery used in the manufacture of wine, cider, fruit juices or similar beverages.
2 Porter uses the term ‘Supplier industries’ consistently, whereas other literature uses ‘upstream industries’.
23
Related industries.
Related industries that are internationally competitive may strengthen the position of the agrifood sector when activities such as technology development, manufacturing, distribution and marketing are being shared or when there are opportunities to benefit from information flows (Porter, 1990:100). To some extent the topic of related industries is already included in the categories describing the factor conditions of a country, discussed above. Infrastructure and communications are discussed too, but pointing mainly at the physical existence of transport and communication systems. Here, in the vein of Porter’s argumentation, we add performance indicators that indicate institutional strengths of logistic and communicational aspects. Logistics is important for agricultural products that are bulky with a relative low value per tonne. Information and communication technology enhance the information transparency in the value chains such as price information. For that reason we include two indicators for this category:
• Logistics performance index (LPI). The index, compiled by the World Bank, is a benchmarking tool on trade logistics allowing for comparisons across 160 countries (LPI.worldbank.org). The score ranges between 1 (the lowest score, competitive disadvantage) and 5 (the highest score), and is a weighted average of the country scores on six dimensions, such as the
- efficiency of the clearance process (i.e., speed, simplicity and predictability of formalities) by border control agencies, including customs, the quality of trade and transport related infrastructure (e.g., ports, railroads, roads, information technology); and, the
- competence and quality of logistics services (e.g., transport operators, customs brokers);
In 2014, Ukraine ranked number 61 and highest among the CIS subject in this study. All EU member states had a higher LPI score than Ukraine (http://lpi.worldbank.org/international/global/2014)
• ICT Development Index (IDI) from the International Telecommunication Union. IDI is an overall indicator on the measurement of availability of ICT infrastructure and individual’s access to basic ICTs. Data are available for the CIS and EU countries ((ITU, 2014:95-101). A high index is a positive indicator of a country’s availability of ICT (competitive advantage). The index is based on 11 indicators grouped in 3 sub-indices: a) ICT infrastructure and access indicators; b) ICT use indicators and c) ICT skills indicators. The last one shows some overlap with the education index mentioned under the category human resources. The weighting of this ICT skills indicator is 20% in the IDI, compared to 40% each for the other 2.
The food retail sector is an important related sector to the food sector - in many cases it is considered as part of the food supply chain. Ideally some indicators of the development of the food retail sector should have been included in this analysis. However, the lack of consistent and comparable data, for instance on turnover, on this sector made inclusion of such an indicator not useful.
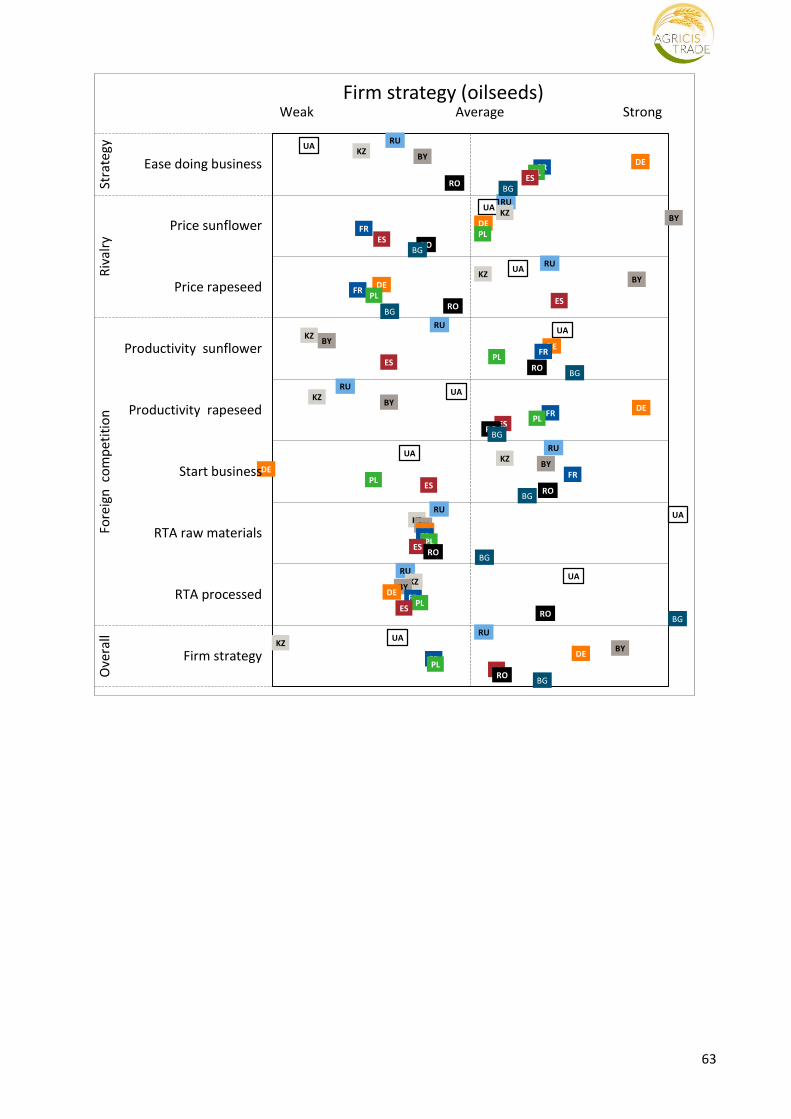
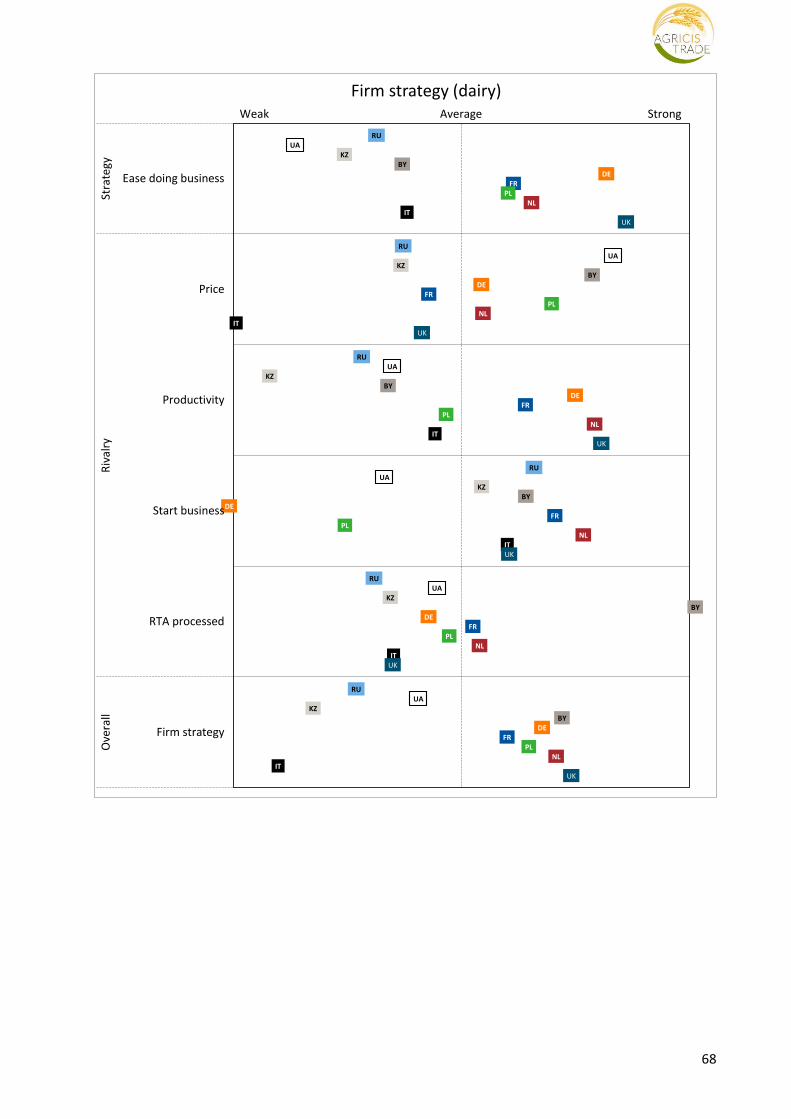
2.3.4 Determinant: Firm strategy, structure and rivalry
This fourth determinant addresses the context in which firms are ‘created, organised as well as the nature of domestic rivalry’ (Porter, 1990:107).The categories are:
Strategy and structure of domestic firms.
The national context of resource endowments and policy environment determines critically the way firms are managed and compete for production means and markets. Nations will tend to succeed in industries in which the management practices and modes of organization favoured by the national business environment are well suited to the industries’ sources of competitive advantage.
Distinctive management practices of the agribusiness are world-wide sparsely available and make assessment difficult. A wider assessment of country conditions for governance of firms is the Ease of
24
Doing Business ranking from The World Bank Group. This indicator measures the favourability of the business environment in a country to run a firm. The ranking benchmarks 181 countries on 10 topics i.e.: starting a business, dealing with construction permits, employing workers, registering property, getting credit, protecting investors, paying taxes, trading across borders, enforcing contracts and closing a business. Because a low ranking indicates a good business environment the indicator will have a negative sign.
Goals.
Nations will succeed in industries where their goals are aligned with the determinants of competitive advantage. Nations will succeed in industries where the goals of owners and managers match the needs of the industry. This factor requires an in-depth study on needs of the industry, goals of companies and of individuals, and alignment of all of them. Such an assessment is beyond the scope of this study and will not be included.
Table 2.10 Specification of the determinant firm strategy, structure and rivalry
Category Subcategories Indicator(s) Data Source
Strategy and structure of domestic firms
-
Ease of doing business World Bank, Doing business
Goals Company goals None
Goals of individuals None
The influence of national prestige/priority of goals
None
Importance of sustained commitment None
Domestic rivalry Domestic competition Price of products FAO (see Table 2.6 for definition of products
Productivity Yield per ha or animal FAO
New business formation Starting a business World Bank, Doing business
Geographic concentration Area of crops/agricultural land Heads of animals/agricultural land
FAO
Foreign suppliers Relative Net Trade Advantage index FAO, see Table 2.7
Domestic rivalry.
Rivalry sharpens advantages at home and stimulates domestic firms to sell abroad in order to grow. It creates pressure on firms to improve and innovate. It can also upgrade the competitive advantage of a nation’s firms by nullifying the advantages that come from only being in the nation.
Domestic competition results first in higher efficiency and lower prices. As indicator we use the price of the products mentioned in Table 2.6.
Productivity. Competition creates pressure to improve and to innovate. This results in a better performance for the industry. For example: the yield of tomatoes per ha indicates the technology used in the sector, such as around 5 kg/sqm is mainly open air production, between 9 and 20 in protected cultivation conditions and above 40 kg in high-tech greenhouses. For the agribusiness we will use yields as proxy for this (sub) category (e.g. yield per ha, milk production per cow). Unfortunately we have no indicator for poultry and pigs. The metrics would be the feed-conversion into meat.
New business formation means new competitors in the industry which will bring new approaches and will drive upgrading of competitive advantage. We use the indicator ‘Starting a business’, an element of the Doing business indicator to measure the ease to create a new business in a country. The main issues addressed for this indicator refer to the number of all procedures required to register a firm, the average time spent during each procedure, the official cost of each procedure, and the minimum capital required as a percentage of income per capita. Although part of the Ease of Doing Business indicator already used in ranking countries in the ‘strategy’
25
category, we use this specific indicator to highlight the importance of market entry possibilities for exploiting comparative advantage.
Geographic concentration. According to Porter (1990, p120), this category reflects and magnifies the power of domestic rivalry. An evaluation of the concentration ratio for regions where firms are located in each country is, however, unfeasible for the number of countries included in this research. We use as proxy the production intensity ratio: the relative importance of each agrifood sector on the total available agricultural land. The assumption is that higher ratios imply higher concentrations and create a competitive advantage. The ratios are evaluated against those of other countries.
Foreign competitors. Porter (1990) does not include foreign competition based on imports from other countries. If a country has a relatively high import level of some products, the domestic performance is considered weak. However, an intensive Intra Industry Trade may exist, based on specialisation or on the advantage to produce a differentiated product. To show this aspect of specialisation, we use the Relative Net Trade Advantage(RTA) indicator, of which a high number shows a strong competitiveness performance. The Grubel-Lloyd index (Grubel and Lloyd, 1971) has been considered as indicator, however this indicator is less suitable for this study as it based on trade between two specific countries, whereas our approach is based on benchmarking several countries.
2.3.5 The role of government
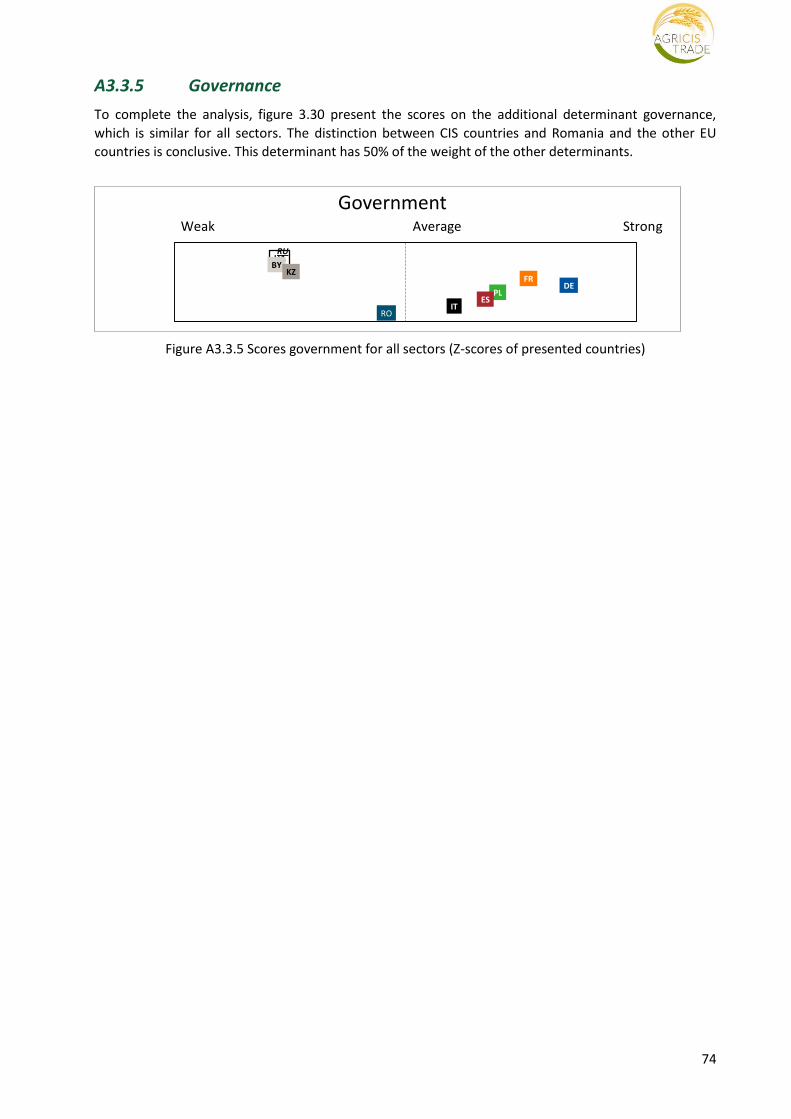
Government influences each of the four determinants above, with an either positive or negative effect on the competitive advantage. Governments shape the playing field for the business community by, for instance, changing the regulatory framework, providing subsidies or taxing activities. On the other hand, government policies might also by influenced by stakeholders that have an interest in changing the performance of a determinant of competitive advantage to their benefit (Porter, 1990:126-128). The latter may result, for instance, in agricultural policies that provide subsidies to inputs used or to exports, protect the domestic market by import tariffs, or reduce taxes to encourage investments in the agrifood sector. In this study we do not address these policies as separate factors affecting the competitive position of the CIS food sectors, but assume that the impacts of these policies are embodied in the performances measured by the indicators of each of the determinants of competitiveness. We will measure the impact of the government on competitive advantage by taking a broad and general scope of the government’s role on the economy by selecting a number of Worldwide Governance Indicators (WGIs), provide by World Bank (see Table 2.11).
Table 2.11 Specification of the determinant role of government
Category Subcategories Indicator(s) Data Source
The role of government - Voice and Accountability www.govindicators.org
- Political Stability and Absence of Violence
www.govindicators.org
- Government Effectiveness www.govindicators.org
- Regulatory Quality www.govindicators.org
- Rule of Law www.govindicators.org
- Control of Corruption www.govindicators.org
www.govindicators.org
World Bank’s Worldwide Governance Indicators measure six dimensions of governance for 212 countries. The dimensions measured are (info.worldbank.org):
• Voice and Accountability measures the extent to which citizens are free to select their government. Also measures freedom of expression, of association and of media.
• Political Stability and Absence of Violence measures the perceptions of likelihood of political stability.
• Government Effectiveness measures the quality of public and civil services, of policy formulation and implementation, their independence from political pressures and the commitment of government to these issues.
• Regulatory Quality measures government capacity to establish policies that promote private sector development.
• Rule of Law measures confidence and obedience to rules of society i.e. contract enforcement, police, and courts. It also measures likelihood of crime and violence.
• Control of Corruption measures the degree of exercise of public power for private gain.
The measurement of each indicator uses a scale from -2.5 to 2.5 with higher values corresponding to better governance. The indicators also give a ranking among all the countries in percentile ranks. This indicates the percentage of worldwide countries (from the 212) that are below the country. 0 corresponds to the lower rank and 100 to the highest.
2.3.6 The role of chance
Chance refers to external events that are not possible to control by firms. Unexpected changes can give disadvantages to industries where the diamond is not in equilibrium, while they can give competitive advantage to nations with a favourable diamond. Chances are possibilities of occurrences with the following elements (Porter, 1990, p124):
Acts of pure invention.
Major technological discontinuities.
Discontinuities in input costs.
Significant shifts in world financial markets or exchanges rates.
Surges of world or regional demand.
Political decisions by foreign governments.
It is difficult to assess the role of chance in this study for two main reasons. First, an analysis of the influence of chance in the competitive arena requires to study the equilibrium of the diamond for every country under study and to assess which industry will lose or gain competitiveness accordingly. Second, we should assess the possibility of occurrence of the listed elements above. Both are beyond the scope of this study. Therefore we do not include the role of chance in our analysis.
2.4 Scoring methodology
The purpose of this research is to quantify Porter’s framework of the determinants of nations’ competitive advantage in an agrifood sector. For this, we have developed an operational set of indicators that quantify the importance to and the impact of each of the determinants on the competitive performance of agrifood sectors in CIS and EU countries, including the role of government in the process of creating competitive advantage.
We bring all the results together in an overview that allows for comparing the performance indicators, and to weigh each of the categories in order to come to an overall score of performance of each of the four determinants and the role of government.
To determine quantitatively the competitive position of each country (per food industry, or for the total food industry) an overall indicator will be derived in a cascade model:
Determinants:
Each of the four determinants are aggregated and will have the same weight in order to build an overall indicator that positions the country with regard to its competitive advantage (each determinant counts for 22.2% of the overall weight).
27
The Role of government is supportive to the four determinants. Therefore, its indicator will count for half of the weight of the four indicators (11.1% of the overall indicator).
Categories: Determinants are divided into categories. Categories will have the same weight within the determinant. For instance, the determinant factor condition has 5 categories, which implies that each category has a share of 20% in the determinant factor conditions.
Subcategories and indicators:
Categories are measured with subcategories and/or indicators. Each sub-category/indicator within the category has the same weight to build up an overall indicator for their corresponding factor. For instance, the category ‘human resource’ has 3 subcategories: each subcategory has therefore 1/3 of the weight of that category.
As an example: the indicator ‘Labour supply’ has a weight in the overall indicator of 22.2% (determinant weight)*20% (category weight) * 33.3% (subcategory weight)=1.5%. The weights of all subcategories/indicators add to 100%. Different weights can be considered for instance higher weights for advanced indicators. However, that is not done in the assessment below.
Table 2.12 presents the weights of each indicator: the sum of the weight is 22.2% for each determinant, 11.1% for the government and the total is 100%. Some indicators have a positive weight when their value influences the determinant negatively. For example, the higher the price, the lower the advantage for that nation on the determinant firm strategy and rivalry. Lower costs, which are reflected in prices, are an important determinant of the competitive advantage in a cost leadership strategy (Porter, 1990, p39). These indicators will therefore have a negative sign. Table 2.12 also shows the sign of each indicator.
The indicators have different dimensions and a quite large range in value: for instance, GDP/capita measured in USD that ranges into tens of thousands and HDI indices range from 1 to 10. For that reason all indicators are scaled into Z-Scores. A Z-score is a standard score that is dimensionless, with an average of 0 and a standard deviation of 1. In a graphic representation of Z-scores, indicators of one country will be seen according to its relative position against indicators of other countries included in the analysis. In this way it is possible to visually assess the country’s position: is it similar to (average), weaker or stronger than its competitors. Z-scores are calculated in the following way: Z-SCORE = (INDIVIDUAL INDICATOR – AVERAGE)/STANDARD DEVIATION. Furthermore aggregates are the Z-scores of the weighted average scores per indicator, category or determinant.
In Section 2.6 below an example is provided, how of actual values and Z-scores as well as of the graphical presentation.
2.6 How to read the competitiveness’ graphs?
For visual purposes each indicator is presented in Z-scores, grouped by indicator. In table 2.13, the observed data and Z-scores for 2 indicators are presented as an example.
Table 2.13 Observed values and Z-scores of milk prices and yield per cow
Country Acronym Price Productivity Price Productivity
USD/tonne KG/cow Z-score Z-score
Russia RU 443 3,900 -0.07 -0.69
Ukraine UA 333 4,447 1.05 -0.37
Belarus BY 345 4,361 0.93 -0.42
Kazakhstan KZ 444 2,245 -0.09 -1.68
France FR 428 6,414 0.08 0.80
Germany DE 410 7,293 0.26 1.32
Poland PL 369 5,388 0.69 0.19
Spain ES 390 7,655 0.47 1.54
Italy IT 542 5,175 -1.08 0.07
Romania RO 656 3,771 -2.25 -0.77
28
Table 2.12 Indicators, signs and weights
Det. Category Subcategories Indicator(s) Short name Sign Weight
Factor co
nd
ition
s
Human resources Quantity Labour force participation rate, total (% of total population ages 15-64)
Labour supply 1 1.5%
Skills Education index Education 1 1.5%
Costs GDP per person employed (constant 1990 PPP $)
Labour costs -1 1.5%
Physical resources Land Agricultural land (sq. km) Land 1 1.1%
Water Total renewable water resources per capita (m3/inhab/yr)
Water 1 1.1%
Environment Production specialisation ratio (oilseeds) Growing environm. 1 1.1%
Fuel costs Pump price for diesel fuel (US$ per litre) Fuel -1 1.1%
Knowledge resources
Knowledge potential
Research and development expenditure (% of GDP)
R&D 1 2.2%
Knowledge stock Relative Export Advantage of seeds and breeds for oilseeds
RTA Knowledge 1 2.2%
Capital resources Getting credit Getting Credit (part o Credit 1 2.2%
FDI-inflow Foreign direct investment, net inflows (% of GDP)
FDI 1 2.2%
Infrastructure Attract. of nation Net migration Migration 1 0.9%
Air-freight Air transport, freight (million ton-km)/GDP million USD
Air-Freight 1 0.9%
Sea-freight Quality of port infrastructure Sea-Freight 1 0.9%
Phone Mobile cellular subscriptions (per 100 people)
Phone 1 0.9%
Internet Internet users (per 100 people) Internet 1 0.9%
Dem
and
con
ditio
ns
Home demand composition
Segment structure of demand;
Food supply (kcal/capita/day) Kcal 1 0.7%
Protein supply (g/capita/day) Protein 1 0.7%
Fat supply (g/capita/day) Fat 1 0.7%
Share animal protein (%) Animal prot 1 0.7%
Share vegetable fat (%) Vegetal fat 1 0.7%
Sophisticated and demanding buyers
Self-sufficiency (oilseeds) Self-suff. 1 1.9%
GDP per capita (current USD) GDP/cap 1 1.9%
Demand size and pattern of Growth
Size home market Population size Home market 1 3.7%
Rate Growth of home demand
Annual growth domestic supply oilseeds (% over 10 years)
Growth supply 1 3.7%
Internationalization of domestic demand
Mobile or Multinational local buyers
Relative Export Advantage (RXA) oilseeds raw material ( index)
Production Quantity Nitrogen Fertilizers (N total nutrients)/ha
N-production ha 1 2.2%
Fertilizers trade RTA Net trade advantage for fertilizers RTA fertilizers 1 2.2%
Plant protection net trade
RTA Net trade advantage for plant protection
RTA plant/animal protect.
1 2.2%
Machinery trade RTA Net trade advantage for machinery RTA machinery 1 2.2%
Sector specific machinery trade
RTA Net trade advantage for oilseeds machinery
RTA sector machinery
1 2.2%
Related industry Transportation Logistics performance index Logistics 1 5.6%
Communications ICT Development Index (IDI) Communication 1 5.6%
Firm strategy, stru
cture an
d
rivalry
Strat. and structure - Ease of doing business (EoDB) EoDB 1 7.4%
Domestic rivalry Domestic compet. Price of products Price -1 7.4%
Foreign competition Productivity yield/ha or yield/animal Productivity 1 1.9%
New business formation
Starting a business Start business 1 1.9%
Foreign suppliers processed food
Relative Net Advantage (RTA) index, processed food
RTA raw materials 1 1.9%
Foreign suppliers raw material
Relative Net Advantage (RTA) index, raw material
RTA processed 1 1.9%
The ro
le of
govern
men
t
- Voice and Accountability Accountability 1 1.9%
- Political Stability and Absence of Violence Stability 1 1.9%
- Government Effectiveness Effectiveness 1 1.9%
- Regulatory Quality Regulatory 1 1.9%
- Rule of Law Rule of law 1 1.9%
- Control of Corruption Corruption 1 1.9%
29
Based on the observed value the Z-scores are calculated including the expected sign. For productivity, Spain has the highest yield per cow and hence also the highest Z-score, Kazakhstan the lowest. Romania has the highest milk price and hence the lowest competitiveness: the Z-score is multiplied by ‘-1’. Ukraine has the lowest price presented in the highest Z-score: the price of Belarus is close to the level of the Ukraine as is shown in the observed data in the figure 2.3. The Z-scores are depicted in figure 2.3 with countries acronyms as identification labels. The position of the Z-score of Romania on prices is outside the borders of the graph - a typical outlier. The graphs are all standardised on values between -2 and +2. Z-scores out of that range are always depicted just outside the margin of the graph.
Figure 2.3 Example of presentations of Z-scores
RU
RU
UA
UA
BY
BY
KZ
KZ
FR
FR
DE
DE
PL
PL
ES
ES
IT
IT
RO
RO
Price
Productivty
Example
Weak Average Strong
30
3. Competitiveness of CIS and EU agrifood sectors
In this chapter we present the results using graphs with Z-scores to depict the countries’ overall performance and of each determinant of competitiveness. The results will be explained most extensively for the first two sectors - oilseeds and dairy - in the main text, and Appendix 3 presents further detailed background information for each indicator of these two sectors. Similar background information and explanations with regard to the other sectors are available from the authors.
3.1 Key characteristics of the agricultural sector and food industry
The study reports on a number of subsectors in the agrifood industry. The selection of the sectors is based on three criteria:
1. The production value of the primary products in the CIS countries
2. A diversity of sectors. For that reason we selected at least two products in each of the categories livestock, crops, horticulture crops and perennial crops.
3. The importance of food industries. In the trade indicators we made a distinction between trade in raw materials and processed products. Lacking data on the food industry, as mention before, forced us to use only these variables.
Table 3.1 presents an overview of products with a total production value of at least 1 billion USD in 2013 in the CIS-countries. The selected sectors are:
1. Livestock:
a. Dairy. Fresh cow milk production has the highest production value of all products in the CIS countries and in the EU.
b. Pork. Pig meat production is in value terms the fourth largest category of all agricultural products in the CIS countries and second in the EU.
c. Poultry. Production value of poultry meat ranks almost equally to cattle meat in the CIS countries, but is less important than cattle meat in the EU. We selected poultry above cattle meat, as cattle meat is largely a valuable by-product of dairy and hence might already have been captured when considering the milk/dairy sector.
2. Crops:
a. Cereals. This sector includes several products. Wheat is alone already the second product in the CIS countries and third in the EU. Together with others cereals the sector is the most important in the CIS-countries
b. Oilseeds. Sunflowers are as important as poultry in the CIS countries and together with other oilseeds, this product group has a higher share in agricultural production value than pork. In the EU, oilseeds (with rapeseed as most important product) account for only 3.5% of the total agricultural production value.
3. Horticulture
a. Potatoes. In the CIS region this product is the third largest agricultural product and even more important than both meat sectors.
b. Tomatoes. This product ranks in both region on the tenth place and can be seen as the horticulture commodity that is important in international trade.
4. Perennials:
a. Apples. This product has a rather small share in the total agricultural production of CIS countries. However, it is important in Armenia (3.3% of total agricultural production), Azerbaijan (3.4%) and Moldavia (2.7%).
31
b. Wine/Grapes. This product is also a rather small category in CIS’ agricultural sector, but rather important in Armenia (6.1% of total agricultural production), Georgia (11.6%) and Moldavia (9.4%). It is also an important product in the EU.
Table 3.1 Gross Production Value in million USD in 2013 of primary production
Vegetables, fresh not elsewhere mentioned 1,169 0.7 2,221 0.5
Honey, natural 1,102 0.7 1,116 0.3
Currants 1,001 0.6 233 0.1
Others not elsewhere mentioned. 10,619 6.7 77,725 19.0
Total 39,790 25.2 134,728 33.0
Source: FAOstat
The food processing industry is an important part of the manufacturing sector, accounting for about one third (Moldova, Georgia and Armenia) to on-fifth (Belarus and Ukraine) in terms of production value and employment. In countries rich in minerals and with a large mining industry - Russia, Azerbaijan and Kazakhstan - the food sector’s industrial share is more around the EU average which is about 10% (AGRICISTRADE Synthesis report WP2).
Food sectors in the eight countries are rather diverse (see WP2 country reports). In Russia, for instance, meat, dairy and bakery production are the most important food processing industries in terms of production value. In Kazakhstan, the grain milling industry is the largest food industry, next to meat and dairy. In Moldova and Azerbaijan, processed fruits and vegetables have the largest shares. Oils and fats (mainly based on oilseed production) and ‘other food products’ (consisting of sugar, sugar confectionery and chocolate products) are the major food subsectors in Ukraine, next to meat and dairy. The latter two are also the major food processing industries in Belarus. Beverages (e.g. wine) play a distinctive role in Georgia, Armenia and Moldova. The diversity of the food industry in the region justifies a broad scope of a study analysing the competitive position of the industry. Aforementioned selection of sectors (based on primary production data) covers rather well the importance of the food industry. Missing is the category ‘other food’ that is rather diverse and based on many products that are already included in other sectors, with exception of sugar.
32
Table 3.2 below presents data from the survey that is based on national statistics and collected by the CIS partners. To make a useful country comparison, data refer to the total food industry. For some countries, beverages and tobacco (NACE 11 and 12 respectively) are also included.
The table indicates the differences in size of the food industry in the countries and provides first insights into performance. The main observations from the table are:
The Russian food industry is by far the largest in the region, with a turnover that is four times the level of Ukraine’s food industry, which is ranked second. The food industry in Armenia has the lowest production value of all food manufacturing sectors in the region;
All food industries (except for the one in Moldova) recorded a significant growth in production value/turnover (in nominal euros) over the period 2004-2012, with double digit annual growth figures. This expansion follows a transition period of decline after the collapse of the communist regime in these countries.
The size of firms (in terms of turnover per firm) is rather different in the CIS countries, from especially small in Georgia, to medium (Armenia, Azerbaijan, Moldova) to large (Kazakhstan, Russia, Ukraine) and very large (Belarus). For comparison: the EU28’s average turnover per enterprise in the food and drink industry was 3.7m euros in 2012 (ECSIP, 2015:16), hence less than in Belarus and Ukraine, but more than in the other CIS countries.
Developments in employment in the food industry show mixed results with declining figures in Moldova, Kazakhstan and Armenia to very small growth in Belarus and Ukraine. Employment growth is significant in Azerbaijan and Georgia only.
Turnover per employee is highest in Azerbaijan, followed Kazakhstan, Russia and Belarus. Turnover per employee in Ukraine, Moldova, Georgia and Armenia are relatively similar. For comparison: EU28’s average turnover per employee in the food and drink industry was 58,000 euro (ECSIP, 2015:16).3
Table 3.2 Key data of CIS Food industry3, 2012
Country Turnover (in million euro)
Growth in turnover (annual % change 2004-12)
Number of enterprises
Turnover per enterprise (in 1,000 euros)
Number of employees (1,000 persons)
Growth in number of employees (annual % change 2004-12)
Turnover per employee (in 1,000 euros)
Armenia 485 10.5 793 611.5 13.6 -0.1 35.7
Azerbaijan 2,4901
29.6 3792 656.7 18.8 7.9 132.5
Belarus 10,315 27.0 805 12,814.3 150.9 0.32
68.4
Georgia 1,085 25.1 27,801 39.0 28.8 5.1 37.7
Kazakhstan
5,9801
24.6 2440 2450.8 69.7 -2.9 85.8
Moldova
1,7431
7.0 1474 1182.7 35.4 -4.9 49.2
Russia 100,1811
9.42
41,274 2427.2 1,400 n.a. 71.6
Ukraine 24,776 17.42
5,768 4295.3 417 0.32
59.4
Note 1: production value. 2: annual growth 2010-2012; 3: Kazakhstan, Moldova, Russia and Ukraine report on Food, Beverages and Tobacco (NACE 10, 11 and 12); data of other countries refers to NACE 10 only. Source: National data by country partners, except for Russia, for which data are from FAS/USDA GAIN report 29 December 2014.
3 Turnover is not a measure of competitiveness: value added in turnover or value added per employee is a better
indicator of profit generating capacities of an enterprise. Unfortunately, data on value added in the food industry is not available (see Appendix 2).
33
3.2 Oilseeds sector
3.2.1 Country selection and overview
This section presents the performance of the oilseeds sector in selected CIS countries and EU benchmark countries. Oilseeds are defined as all oilseeds listed by FAOstat and mainly consist of sunflowers and rapeseed in these regions.
Figure 3.1 presents the production levels and annual growth rates over the last decade of rape and sunflower seeds in 5 CIS and in 8 EU countries. The total production of sunflower seeds in the CIS8 is 23mn tonnes in 2013, largely produced in Ukraine and Russia. The EU produces 9m tonnes, or about 40% of the production level in CIS. Main production countries in the EU are Romania, Bulgaria, France, Hungary and Spain. Over the period 2003-2013 the annual production growth rate in the CIS has been 9%, which is significantly higher than EU’s 4% growth rate. In the EU, Bulgaria (9%) achieved a similar oilseeds production growth rate as in the Ukraine (10%) or Russia (8%).
For rapeseed, the EU is a more important producer (21m tonnes) than the CIS countries (5mn tonnes). Compared to sunflowers, production growth rates are much higher: several countries both in the CIS and EU report double digit growth figures. Germany, France, Poland and the UK are the largest producers of rapeseed in the EU, together accounting for 2/3 of the EU production. Growth rates of production in these (large) production countries are relatively modest.
Based on these production levels we selected the four largest producers in the CIS region and the six largest in the EU for the Porter competitiveness analysis. Included are Russia, Ukraine, Kazakhstan and Belarus from CIS and German, France, Spain, Poland, Bulgaria and Romania from the EU.
Figure 3.1 Production (2013) and annual growth rates (2003-2013) of sunflower and rape seeds Source: Own calculation based on FAOstat data
3.2.2 Porter’s diamond
Overall
Figure 3.2 shows that the overall competitiveness (row at the bottom of the figure) of Russia and Belarus is slightly above average, while Ukraine and especially Kazakhstan have a weak competitive position at the oilseed market compared with the selected EU countries. This overall score of the CIS countries is further explained by detailing the assessments on the five determinants below. The explanation follows in the main text below, whereas the detailed scores for each determinant are presented in Appendix 3.
-10
0
10
20
30
40
50
60
-2,000
0
2,000
4,000
6,000
8,000
10,000
12,000
UA
RU
KZ
BY
MD
Ro
CIS
FR
DE
ES
RO PL
BG IT UK
Ro
EU
%
1,0
00
to
nn
es
oilseeds
sunflower Rape Growth sunflower Growth rape
34
Factor conditions
The CIS countries score relatively well on a number of indicators building the scores for factor conditions, showing that the four countries included have the advantage of sufficient and cheap labour supply, of abundant land and water, and of relatively low energy costs. However, their scores are weak with respect to indicators measuring the two categories of knowledge/skills and infrastructural facilities. On the capital category, the CIS countries are particularly weak on the ‘getting credit’ indicator, except Ukraine, while all CIS countries show high scores on the FDI indicator.
Figure 3.2 Overall Porter’s diamond competitiveness of the oilseed sector (Z-scores of presented countries) Demand conditions
Demand conditions indicate industries’ advantages of the size of a home market, its responsiveness to international demand (via exports) and demand growth. Ukraine and Russia are relatively strong on the various demand conditions included, with the Russian oilseeds sector more home market oriented and the Ukrainian sector more export-oriented. Ukraine shows an above average supply growth and also a good performance on exporting both raw materials as well as of processed products. On these indicators most EU countries have weak scores: most EU countries included in this overview are assessed as strong on home market indicators. The oilseeds sector in Kazakhstan scores particularly weak on the home market indicator, although its oilseeds exports have increased rapidly over the last few years.
Supporting Industries
Supporting industries covered by this analysis are suppliers of important inputs for production, and facilitators of transport and information exchange (logistics and communication) in the supply chain. The EU countries outperform the CIS countries on almost all indicators quantifying this determinant.
RU
RU
RU
RU
RU
RU
UA
UA
UA
UA
UA
UA
KZ
KZ
KZ
KZ
KZ
KZ
BY
BY
BY
BY
BY
BY
DE
DE
DE
DE
DE
DE
FR
FR
FR
FR
FR
FR
PL
PL
PL
PL
PL
PL
ES
ES
ES
ES
ES
ES
RO
RO
RO
RO
RO
RO
BG
BG
BG
BG
BG
BG
Factor conditions
Demand conditions
Supporting industries
Firm strategy
Government
Porter's diamond
Porter's diamond (oilseeds)Weak Average Strong
35
With respect to suppliers industries, the EU countries appear stronger when it comes to the supply of advanced technologies (relative net trade advantage indicators for plant protection and machinery). CIS countries (Belarus in particular) are stronger in the production and trade of fertilizers, which is a bulk input for agriculture. On logistics and communication CIS countries are weak or score at most average, while all EU countries are at the ‘strong’ side of the spectrum. The overall evaluation demonstrates a much better performance of EU countries on this determinant of competitiveness compared to the CIS included in this analysis.
Firm strategy and rivalry
This determinant reflects the way companies compete, such as on price/costs and how much competition they face. Countries’ positions on each of the elements of the determinant vary among subcategories and indicators to measure these subcategories, picturing a very mixed outcome of the determinant’s contribution to the competitiveness of the oilseeds sector of each of the countries. The CIS countries are relatively strong in competitive prices as well as the ease in starting a business. They are, however, weak in indicators measuring productivity and (net) trade performance. Yet, Ukraine is strong in net trade advantage of raw materials and of processed products. The overall low score of the Ukraine on this determinant is strongly influenced by the low scores on the (strategy) indicators of the ease of doing business. Kazakhstan’s low score is caused by low productivity and export performances, two indicators that point at a low capability to face foreign competition. Scores on these indicators also determine Russia’s position on this determinant, but the Russian oilseeds sector overall assessment is positive and close to average. Belarus has a high overall score, basically because of very competitive prices of sunflower and rapeseeds.
Government
The role of government is shaping the level playing field, through policies and decisions that affect the country’s regulatory framework. The CIS countries are all on the weak side of the spectrum, in comparison with the six EU countries.
3.3 Dairy sector
3.3.1 Country selection and overview
This section presents in a systematic way the performance of the dairy sector in selected CIS countries and EU benchmark countries.
Figure 3.4 presents the production levels and annual growth rates over the last decade of cow milk in 5 CIS and in 9 EU countries. The total production of cow milk in the CIS8 is 56m tonnes in 2013, largely produced in Russia. The EU produces 152m tonnes, or 3 times the production level in the CIS countries. The annual production growth rate in the CIS is -0.3%, which is significantly lower than EU’s 0.1% growth rate in the EU (which is limited because of the milk production quota). Based on these production levels we selected the four largest producers in the CIS region and the six largest in the EU for the Porter competitiveness analysis.
3.3.2 Porter’s diamond
Overall
Figure 3.5 shows that the overall competitiveness (row at the bottom of the figure) of all CIS countries is below average. The dairy sector in Russia and Belarus is close to the average, but the sector in Kazakhstan and Ukraine show to have a particularly weak competitive position. This overall score needs further explanation as the assessments on the five determinants show varied outcomes. The explanation follows in the main text below, whereas the detailed scores for each determinant of competitiveness are provided in Appendix 3. Note that the Z-scores depend on the selected countries;
36
the scores on the determinant ‘government’ therefore also differ for each sector, because different benchmark countries are selected.
Figure 3.4 Production (2013) and annual growth rates (2003-2013) of milk Source: Own calculation based on FAOstat data.
Factor conditions
The Russian and Kazakh dairy sectors achieve above-average scores on several indicators that measure factors conditions. For example, the dairy sector in these countries benefits from cheap labour and energy, abundant land availability and some infrastructural facilities that appear beneficial to the sector. Ukraine’s dairy sector scores well on (low) labour costs and credit availability, but is weak on many of the other categories that comprise this determinant. Belarus shows a weak score on all indicators except labour costs.
Demand conditions
Demand conditions indicate sectors’ advantages of the size of a home market, its responsiveness to international demand (via exports) and demand growth. Belarus and Russia are relatively strong on the several demand indicators. Russia scores high on the size of the home market and the growth of domestic supply (in fact, this is domestic consumption) and, thus, is home market oriented. Belarus is more export-oriented, illustrated by a relatively high relative export advantage index. Overall, EU countries are slightly weaker than these two CIS countries, whereas Ukraine and Kazakhstan achieve low scores on most of the demand indicators.
Supporting Industries
Supporting industries are suppliers of important inputs for production and facilitators of transport and information exchange (logistics and communication) in the supply chain. The EU countries outperform the CIS countries on almost all of the indicators that comprise this determinant. With respect to suppliers industries, the EU countries are stronger when it comes to the supply of advanced technologies (relative net trade advantage indicators for plant protection and machinery). On logistics and communication, CIS countries are weak, while most EU countries (except Poland and Italy) are at the ‘strong’ side of the spectrum. The overall evaluation demonstrates a much better performance of EU countries compared to the CIS included in this analysis.
Firm strategy and rivalry
This determinant reflects the way companies compete, such as on price/costs and how much competition they face. Countries’ positions on each of the elements of the determinant vary among sub-categories and indicators to measure these subcategories, picturing a very mixed outcome of the determinant’s contribution to the competitiveness of the dairy sector of each of the countries. The dairy
-2%
-1%
0%
1%
2%
3%
4%
5%
6%
-5
0
5
10
15
20
25
30
35
RU UA BY KZ AZ RoCIS DE FR UK PL NL IT ES IE DK RoEU
Pro
du
ctio
n (
m t
on
nes
)
Production (m tonnes) Growth (2003-2013)
37
sector in Ukraine and Belarus are relatively strong in competitive prices and score well on the ‘ease of starting a business’ indicating that the sectors performance benefits from domestic competition. As depicted in the figure below, the milk prices (off-farm) are converging: in Russia and Kazakhstan average milk prices are close to those in France, UK and Netherlands (in 2011 and 2012), Belarus and Ukraine show still relatively low milk prices. However, the comparison of milk prices among countries is fraught with difficulties, as milk prices reported might refer to milk different in content and/or quality.4 The CIS countries are weak in indicators measuring productivity and trade performance, except for Belarus that is a substantial exporter of processed dairy products. The strong overall score of Belarus is mainly influenced by this trade advantage score.
Government
The CIS countries are all on the weak side of the spectrum in comparison with the six EU countries.
Figure 3.5 Overall Porter’s diamond competitiveness of the dairy sector (Z-scores of presented countries)
3.4 Pork sector
This section presents concisely the performance of the pork sector in selected CIS countries and EU benchmark countries. Figure 3.7 presents the major producing countries in the two blocks. Based on these figures the country selection comprises of Belarus, Kazakhstan, Russia and Ukraine from the CIS region and EU countries Germany, Spain, France, Netherlands, Denmark and Poland.
Figure 3.8 shows that the overall competitiveness (row at the bottom of the figure) of the CIS countries is below average or weak. Of all four CIS countries, the pork sector in Russia has the best score, near the average but on the negative side. Belarus, Kazakhstan and Ukraine have particularly weak scores. The overall score for these three countries is explained by the low performance on all five determinants of competitiveness: without exception these three CIS countries score low on each determinant. Russia’s
4 This issue is not unique to dairy products but holds for all price comparisons of agricultural products.
RU
RU
RU
RU
RU
RU
UA
UA
UA
UA
UA
UA
KZ
KZ
KZ
KZ
KZ
KZ
BY
BY
BY
BY
BY
BY
DE
DE
DE
DE
DE
DE
FR
FR
FR
FR
FR
FR
PL
PL
PL
PL
PL
PL
NL
NL
NL
NL
NL
NL
IT
IT
IT
IT
IT
IT
UK
UK
UK
UK
UK
UK
Factor conditions
Demand conditions
Supporting industries
Firm strategy
Government
Overall
Overall (dairy)Weak Average Strong
38
somewhat higher score is related to relatively high scores on factor conditions (indicating cheap labour and land) and (home) demand indicators. With regard to the determinant of Supporting industries, the pork sector in the four CIS countries score particularly low, showing the weak connecting of the producers with suppliers and service providers as well as the weak performance of these supporting industries by themselves. In evaluating the determinant Firm strategy, the analysis was limited as there were no easily available and comparable prices, yields (production per animal) and/or feed conversion rates that would provide a useful judgement of price levels and productivity performance. Note that the Z-scores depend on the selected countries; the scores on the determinant ‘government’ therefore also differ for each sector, because different benchmark countries are selected.
Figure 3.7 Production (2013) and annual growth rates (2003-2013) of pork
Figure 3.8 Overall Porter’s diamond competitiveness of the pork sector (Z-scores of presented countries)
-6%
-4%
-2%
0%
2%
4%
6%
-12
-10
-8
-6
-4
-2
0
2
4
6
8
10
12
RU UA BY KZ MD RoCIS DE ES FR NL DK PL IT BE UK RoEU
An
nu
al g
row
th
Pro
du
ctio
n (
m t
on
nes
)
pork
Production (m tonnes) Growth (2003-2013)
RU
RU
RU
RU
RU
RU
UA
UA
UA
UA
UA
UA
KZ
KZ
KZ
KZ
KZ
KZ
BY
BY
BY
BY
BY
BY
DE
DE
DE
DE
DE
DE
FR
FR
FR
FR
FR
FR
PL
PL
PL
PL
PL
PL
ES
ES
ES
ES
ES
ES
NL
NL
NL
NL
NL
NL
DK
DK
DK
DK
DK
DK
Factor conditions
Demand conditions
Supporting industries
Firm strategy
Government
Overall
Overall (pork)Weak Average Strong
39
3.5 Poultry sector
This section presents concisely the performance of the poultry sector in selected CIS countries and EU benchmark countries. Figure 3.9 presents the major producing countries in the two blocks. Based on these figures the country selection comprises of Belarus, Kazakhstan, Russia and Ukraine from the CIS region and EU countries Poland, UK, Spain, France, Germany and Italy.
Figure 3.10 below shows that the overall competitiveness (row at the bottom of the figure) of the CIS countries in the poultry sector is equally weak as in the pork sector. The overall score for the four countries is explained by the low performance on all five determinants of competitiveness: as the figure shows only Russia scores above average on factor conditions, whilst that country is also weak on the other determinants, like the other three. Looking at factor conditions in more detail indicates that the CIS countries benefit from low-cost labour and abundant land (the latter providing opportunities to cultivate feed and use manure from the intensive livestock sector), yet knowledge and credit are lacking.
Figure 3.9 Production (2013) and annual growth rates (2003-2013) of poultry
All countries are home market-oriented, except Belarus which exports a larger share of its production. With regard to the determinant of Supporting industries, the same situation as in the pork sector holds for the poultry sector in the four CIS, with low performance indicators. Also for this sector, the assessment of the Firm strategy determinant was limited due to a lack of appropriate data.
3.6 Cereals sector
This section presents concisely the performance of the cereals sector in selected CIS countries and EU benchmark countries. Figure 3.11 presents the major producing countries in the two blocks. Based on these figures the country selection comprises of Russia, Ukraine, Kazakhstan and Belarus from the CIS region and EU countries France, Germany, Poland, Spain and Romania and the UK.
The competitiveness of the cereals sector of the four CIS countries is, compared with that sector in the UK, France and Germany, below average (Figure 3.12). For several determinants, CIS countries score well. For instance, Russia and Kazakhstan score relatively high on factor conditions (abundant land), and Ukraine and Kazakhstan perform well looking at demand conditions (exporting to foreign markets), and Firm strategies. In the latter, the relatively low prices of cereals exported by these countries (see figure 3.13) contribute importantly to the evaluation of their competitive position based on this determinant. However, the CIS countries are particular weak when assessing the scores on the Supporting industries and Government determinants.
-2%
0%
2%
4%
6%
8%
10%
12%
14%
16%
-0.5
0.0
0.5
1.0
1.5
2.0
2.5
3.0
3.5
4.0
RU UA BY KZ AZ RoCIS PL UK ES FR DE NL IT BE RO RoEU
Pro
du
ctio
n (
m t
on
nes
)
poultry
Production (m tonnes) Growth (2003-2013)
40
Figure 3.10 Overall Porter’s diamond competitiveness of the poultry sector (Z-scores of presented countries)
Figure 3.11 Production (2013) and annual growth rates (2003-2013) of cereals
RU
RU
RU
RU
RU
RU
UA
UA
UA
UA
UA
UA
KZ
KZ
KZ
KZ
KZ
KZ
BY
BY
BY
BY
BY
BY
DE
DE
DE
DE
DE
DE
FR
FR
FR
FR
FR
FR
PL
PL
PL
PL
PL
PL
ES
ES
ES
ES
ES
ES
IT
IT
IT
IT
IT
IT
UK
UK
UK
UK
UK
UK
Factor conditions
Demand conditions
Supporting industries
Firm strategy
Government
Overall
Overall (poultry)Weak Average Strong
-1%
1%
3%
5%
7%
9%
11%
13%
-10
0
10
20
30
40
50
60
70
80
90
100
110
120
130
RU UA KZ BY AZ RoCIS FR DE PL ES RO UK IT HU DK RoEU
Pro
du
ctio
n (
m t
on
nes
)
cereals
Production (m tonnes) Growth (2003-2013)
41
Figure 3.12 Overall Porter’s diamond competitiveness of the cereals sector (Z-scores of presented countries)
3.7 Wine sector
Total wine production of all included CIS countries levelled 2.3mn tonnes in 2013; a mere 9% of total EU production. The EU countries Italy and Spain produce each over 3 times the total volume of the CIS-countries (Figure 3.14). Moldavia is the largest producer in the CIS region, but production is declining. Wine production is increasing in all other CIS countries, but, except for Ukraine, is still low compared to many EU countries.
Figure 3.14 Production (2013) and annual growth rates (2003-2013) of grape production
-4%
-2%
0%
2%
4%
6%
8%
10%
12%
14%
16%
-2
-1
0
1
2
3
4
5
6
7
8
MD UA RU AM GE RoCIS IT ES FR DE RO GR PT HU BG RoEU
Pro
du
ctio
n (
m t
on
nes
)
grapes (wine sector)
Production (m tonnes) Growth (2003-2013)
RU
RU
RU
RU
RU
RU
UA
UA
UA
UA
UA
UA
KZ
KZ
KZ
KZ
KZ
KZ
BY
BY
BY
BY
BY
BY
DE
DE
DE
DE
DE
DE
FR
FR
FR
FR
FR
FR
PL
PL
PL
PL
PL
PL
ES
ES
ES
ES
ES
ES
RO
RO
RO
RO
RO
RO
UK
UK
UK
UK
UK
UK
Factor conditions
Demand conditions
Supporting industries
Firm strategy
Government
Overall
Overall (cereals)Weak Average Strong
42
Figure 3.15 shows that the overall competitiveness (row at the bottom of the figure) of the wine sector in CIS countries is weak except for Russia. The overall above average score of Russia is based on the highest score on the determinant factor conditions, mainly based on the abundancy of land, water, cheap fuel and some other non-specific indicators. Moldavia, the largest wine producer of the CIS countries, scores above average on demand conditions (due to growth of domestic supply and wine export advantage (RXA)) and on firm strategy (due to relative low prices, a high trade advantage (RTA)). However, the country scores lowest on supporting industry resulting in an overall low competitiveness. Out of the six selected EU countries the four largest producers score overall above average. Germany is the strongest of all countries on almost all indicators. For ‘firm strategy, the analysis was limited as prices were not easily available and comparable for all countries. Again the issue of quality differences reflecting price differences should be mentioned again. For instance, high prices in France determined partly its low score on this determinant, but high average prices might be the result of a successful strategy aimed at capturing premium markets. Data used for price comparisons, however, are not specific enough to take quality differences and premium market strategies into account.
Figure 3.15 Overall Porter’s diamond competitiveness of the wine sector (Z-scores of presented countries)
3.8 Potato sector
The total potato production of all included CIS countries reached 64mn tonnes in 2013 and is well above the total EU production that amounts 53m tonnes in that year. Russia and Ukraine together produce the same amount as the EU28. The production is decreasing in Russia, though, whereas it has grown substantially in Ukraine over the period 2003-2013. Potato production in Kazakhstan and in Azerbaijan has also increased in that period, but is still at a relatively low absolute level. In most EU countries, with exception of Belgium, France and the Netherlands, potato production has declined.
RU
RU
RU
RU
RU
RU
UA
UA
UA
UA
UA
UA
MD
MD
MD
MD
MD
MD
BY
BY
BY
BY
BY
BY
DE
DE
DE
DE
DE
DE
FR
FR
FR
FR
FR
FR
GR
GR
GR
GR
GR
GR
ES
ES
ES
ES
ES
ES
IT
IT
IT
IT
IT
IT
RO
RO
RO
RO
RO
RO
Factor conditions
Demand conditions
Supporting industries
Firm strategy
Government
Overall
Overall (wine)Weak Average Strong
43
Figure 3.17 Production (2013) and annual growth rates (2003-2013) of potatoes
Figure 3.18 shows that the overall competitiveness (row at the bottom of the figure) of all CIS countries is weak. Some countries show strengths on some of the determinants. Russia, for instance, scores high on the Factor condition determinant due to its abundancy of land and water. Belarus, on its turn, scores above average on Firm strategy, based on a relatively low price (Figure 3.19) and a high RTA for raw materials. Poland’s competitiveness is also weak, despite that the country is evaluated almost on the same level as the other selected EU countries on the determinants Firms strategy and Government. The Netherlands has the strongest position of all countries presented in this overview. The Netherlands is a renowned seed potato exporter, depicted in very high level of the RTA knowledge indicator (trade in seeds and breeds), and high Export advantage indices both for raw materials and processed products. German’s second strongest position is derived from above average scores on most indicators.
Figure 3.18 Overall Porter’s diamond competitiveness of the potato sector (Z-scores of presented countries)
-8%
-6%
-4%
-2%
0%
2%
4%
-80
-70
-60
-50
-40
-30
-20
-10
0
10
20
30
40
RU UA BY KZ AZ RoCIS DE FR NL PL UK BE RO ES DK RoEU
Pro
du
ctio
n (
m t
on
nes
)
potatoes
Production (m tonnes) Growth (2003-2013)
RU
RU
RU
RU
RU
RU
UA
UA
UA
UA
UA
UA
KZ
KZ
KZ
KZ
KZ
KZ
BY
BY
BY
BY
BY
BY
DE
DE
DE
DE
DE
DE
FR
FR
FR
FR
FR
FR
PL
PL
PL
PL
PL
PL
NL
NL
NL
NL
NL
NL
BE
BE
BE
BE
BE
BE
UK
UK
UK
UK
UK
UK
Factor conditions
Demand conditions
Supporting industries
Firm strategy
Government
Overall
Overall (potatoes)Weak Average Strong
44
3.9 Tomato sector
The total tomato production of all CIS countries included is 6.4m tonnes, which is around 40% of the total EU production of 15m tonnes in 2013. Italy produces more and Spain slightly less than the production in Russia and Ukraine together. Over the period 2003-2013, the production has increased in the largest producing CIS countries, whilst production in Italy and Spain (EU’s largest production countries) is decreasing. Portugal, the third largest producer in the EU, and other countries like the Netherlands and Poland, has a significant production growth. Spain and the Netherlands are well known large exporters.
Figure 3.20 Production (2013) and annual growth rates (2003-2013) of tomatoes
Figure 3.21 Overall Porter’s diamond competitiveness of the tomato sector (Z-scores of presented countries)
-6%
-4%
-2%
0%
2%
4%
6%
8%
-6
-4
-2
0
2
4
6
8
RU UA KZ AZ AM RoCIS IT ES PT GR NL PL RO FR BE RoEU
Pro
du
ctio
n (
m t
on
nes
)
tomatoes
Production (m tonnes) Growth (2003-2013)
RU
RU
RU
RU
RU
RU
UA
UA
UA
UA
UA
UA
KZ
KZ
KZ
KZ
KZ
KZ
BY
BY
BY
BY
BY
BY
GR
GR
GR
GR
GR
GR
NL
NL
NL
NL
NL
NL
PL
PL
PL
PL
PL
PL
ES
ES
ES
ES
ES
ES
IT
IT
IT
IT
IT
IT
PT
PT
PT
PT
PT
PT
Factor conditions
Demand conditions
Supporting industries
Firm strategy
Government
Overall
Overall (tomatoes)Weak Average Strong
45
Figure 3.21 shows that the overall competitiveness (row at the bottom of the figure) of all CIS countries is weak. Russia, Ukraine and Kazakhstan score high on the determinant factor conditions: Russia due to the abundancy of land and water. Ukraine and Kazakhstan have favourable fuel prices and above average production growth. Also Belarus scores on one determinant above average: on supporting industry based on relatively high Relative Trade Advantages for fertilizers and machinery. Russia and Belarus have rather high off-farm prices, which hampers the competitiveness.
Of the EU countries the Netherlands has the strongest position. The Netherlands is a renowned horticulture seed producer and exporter, depicted in very high level of the RTA knowledge indicator (trade in seeds), and high Export advantage indices both for raw materials and high productivity. Spain’s second strongest position is derived from above average scores on most indicators. Portugal thirds position is underpinned by its relative high scores on most determinants except factor conditions, on which the country scores low on several indicators for this determinant.
3.10 Apple sector
The total apple production of all included CIS countries is 3.9m tonnes, around one third of the total EU production that amounts 11.3m tonnes in 2013. Poland (3.1m tonnes) on its own produces almost the same quantity of all CIS countries together. The production has grown strongly in Belarus, Azerbaijan and Ukraine over the last ten years, far above the levels of the largest EU production countries. France, Germany and some other EU countries showed even a decreasing production of apples over the period 2003-2013.
Figure 3.23 Production (2013) and annual growth rates (2003-2013) of apples
Figure 3.24 shows that the overall competitiveness (row at the bottom of the figure) of all CIS countries is weak. Russia is just slightly above average, due to its high score on the determinant Factor conditions (water and land) and above average on the demand conditions. As Russia, Ukraine and Kazakhstan score high on the determinant Factor conditions due to the abundancy of land and water. Ukraine and Kazakhstan have favourable fuel prices and show above average production growth. Also Belarus scores above average on one determinant, namely on Supporting industry based on its revealed Relative Trade Advantages for fertilizers and machinery. Russia and Belarus have rather high off-farm prices (figure 3.25), which hampers the competitiveness of their sector. Italy, the second largest EU producer, scores below average, especially on the determinant Factor conditions.
-6%
-3%
0%
3%
6%
9%
-2
-1
0
1
2
3
RU UA BY MD AZ RoCIS PL IT FR DE HU ES RO AT NL RoEU
Pro
du
ctio
n (
m t
on
nes
)
apples
Production (m tonnes) Growth (2003-2013)
46
Figure 3.24 Overall Porter’s diamond competitiveness of the apple sector (Z-scores of presented countries)
3.11 Overview of competitiveness of the selected agrifood sectors
In the previous sections the competitive position was elaborated for ten countries with the largest production levels, choosing the four largest in the CIS region and six ‘giants’ in the EU. This selection criterion implies that the countries selected were not the same for all sector studied afore. That makes it difficult to summarise the results for all sectors in one overview. In order to conclude with such a sectoral overview, we limited our selection to include the CIS countries Belarus, Kazakhstan, Russia and Ukraine, and the EU countries Germany and France (representing North-West EU), Italy and Spain (representing the Mediterranean countries) and Poland and Romania (previously centrally-planned and relatively new EU member states). Looking at income levels of these countries, Germany, France, Italy and Spain are on the upper end while Poland, Romania, Russia, Kazakhstan and Belarus have income levels in a similar range of 18,000-25,000 USD PPP (WDI database).
As competitiveness is a relative concept, the selection of countries affects their position in a mutual comparison. Positions presented below, therefore, may differ slightly from what has been shown in the previous sections when other countries (e.g. Moldova, Netherlands) were part of the benchmarking.
Figure 3.26 indicates that in the current context of factor and market conditions, the links with supporting industry and the firms’ competition and business environment the agrifood sector of the CIS countries are not able to compete with that in EU countries. There are only a few sectors in CIS countries with a score that is above the average. In majority, the CIS scores are below the average and many countries are on the weak side of the assessment spectrum. Positive scores are only measured for Russia (dairy, oilseeds, wine) and Belarus (dairy). Ukraine and Kazakhstan are performing relatively poor, with scores close to that of Romania, one of the countries that joined the EU only recently, whilst Italy also scores below average for many of the commodities presented. Poland, that joined the EU in 2004, does relatively well in this comparison, showing an above average position for 6 out of 9 sectors, mainly due to its good performance on the determinant firm strategy and rivalry.
RU
RU
RU
RU
RU
RU
UA
UA
UA
UA
UA
UA
MD
MD
MD
MD
MD
MD
BY
BY
BY
BY
BY
BY
DE
DE
DE
DE
DE
DE
FR
FR
FR
FR
FR
FR
PL
PL
PL
PL
PL
PL
ES
ES
ES
ES
ES
ES
IT
IT
IT
IT
IT
IT
HU
HU
HU
HU
HU
HU
Factor conditions
Demand conditions
Supporting industries
Firm strategy
Government
Overall
Overall (apples)Weak Average Strong
47
A further detailed overview of results for each of the determinants indicates that CIS countries have a relative advantage when it comes to factor conditions and demand conditions, yet not for all sectors this is true (see Appendix 3.3). Overall, all four CIS countries are rather weak in the supporting industry and in firm strategy, whereas the role of the government is evaluated to be particularly poor.
Figure 3.26 Overall scores on Porter’s diamond determinants for all sectors (Z-scores of presented
countries)
RU
RU
RU
RU
RU
RU
RU
RU
RU
RU
UA
UA
UA
UA
UA
UA
UA
UA
UA
UA
BY
BY
BY
BY
BY
BY
BY
BY
BY
BY
KZ
KZ
KZ
KZ
KZ
KZ
KZ
KZ
KZ
KZ
FR
FR
FR
FR
FR
FR
FR
FR
FR
FR
DE
DE
DE
DE
DE
DE
DE
DE
DE
DE
PL
PL
PL
PL
PL
PL
PL
PL
PL
PL
ES
ES
ES
ES
ES
ES
ES
ES
ES
ES
IT
IT
IT
IT
IT
IT
IT
IT
IT
IT
RO
RO
RO
RO
RO
RO
RO
RO
RO
RO
Dairy
Pork
Poultry
Cereals
Oilseeds
Potatoes
Tomatoes
Apples
Wine
All sectors
OverallWeak Average Strong
48
4 Conclusions and discussion
4.1 Discussion
Data and indicators used
The presented approach is based on data available in publicly available databases covering the EU and CIS countries at least, next to many other countries in the world. These are mainly databases from FAO on production, UN on trade and World Bank on several other issues. The advantages of such data are the harmonised definitions and internationally quality control of national data delivered to these institutions. These aspects and the richness of information and data in these databases make them very useful sources for international comparisons and benchmarking. Our approach of quantifying Porter’s determinants of competitiveness is a novel attempt to measure country’s competitive position for agrifood sectors. We emphasise the difficulty in selecting indicators that grasp the determinants and their underlying categories and acknowledge that work should continue on looking for more appropriate indicators that would better reflect Porter’s framework of competitiveness. The disadvantage of relying on the international databases used is that there is rather little sector specific information related to agrifood firms and institutions. The translation of Porter’s approach towards a more sector specific one, with sector specific sector indicators, therefore remains a challenge for improvement in this type of research.
Agricultural and trade policies
Government interventions in agricultural markets are widespread around the world, and so they are in the EU and CIS countries. Farmers in the EU benefit from CAP support policies. Volk et al. (2015; D2.3 paper of the AGRICISTRADE project) provides a concise overview of agricultural policies pursued in CIS countries, showing that CIS countries use a broad range of policy measures such as prices support, import protection and a specific tax regime favouring agriculture. Government policies supporting agricultural production affects producers’ production decisions, and subsequently product prices and trade performances. In short, agricultural support policies make the sector appear (much) more competitive than it really is. Our approach of measuring competitiveness in this paper has in common with many other studies on this topic that it does not address agricultural policies as a separate factor affecting competitiveness, but assumes impacts of these policies are embodied in the performances measured by the indicators. Hence, we repeat what is stated in many other competitiveness studies that our results should be interpreted with care as they may be distorted by government policies.
Trade data indicators versus a broader set of economic indicators
Trade data can be detailed and made very sector specific, and are often used to show the international strength of a sector or value chain. A mainstream of measuring competitiveness in the economic literature is the use of trade indicators like the Revealed Comparative export or import Advantage index. In this study the Relative net trade advantage (RTA) has been used for both raw materials and processed products (both are an indicator of the determinant Firm strategy and rivalry), and as such contribute to the overall evaluation of competitiveness but only as one of the many indicators. It would be interesting to see whether our conclusions based on the broad concept of Porter’s diamond would be very different from what the single indicator of an RTA tells us about the competitive position of nations and sectors. Therefore, the two next figures show the outcomes of the RTA indices of competitiveness only.
Figure 4.1 presents the RTA for raw materials. For raw milk and grapes (wines) this index could not be calculated as these products are hardly internationally traded. If the RTA indicator would have been the sole indicator for competitiveness, the position of several CIS countries would have been stronger. Comparing Figure 4.1 with Figure 3.26 shows that the RTA of all four CIS countries are rather strong in pork, poultry (RU, KZ), cereals and oilseeds (both UA), potatoes (UA and BY) and tomatoes (BY).
Germany is by far the strongest in the Porter’s approach, but rather weak in RTA of raw materials.
49
Figure 4.2 shows RTAs of processed products. Comparing Figure 4.1 (RTA of raw materials) and Figure 4.2 (RTA of processed products) shows some interesting observations:
1. All CIS countries have a strong trade position in raw materials of pork but all are weak on the RTA of processed products of pork.
2. Belarus and Ukraine are weak in the RTA of raw materials of poultry, but strong in processed poultry. The opposite applies for Russia and Kazakhstan.
3. For cereals and oilseeds Ukraine and Kazakhstan are both strong in raw and processed products. Processing of cereals and oilseeds does not need advanced technology.
4. Ukraine has a relative trade advantage in raw and processed potatoes. Furthermore, this country has a strong position in processed oilseeds and apples.
Based on these observations we conclude that high export levels of raw materials do not always result in high levels of processed products. Some countries are specialised in exporting raw, unprocessed products, others concentrate on exporting processed products.
A comparison of the outcome of the RTA indicator with Porter’s analyses indicates a much better overall position of Ukraine. The results also show quite remarkable changes for some of the EU countries ‘position. In Porter’s analyses, Germany and France are the strongest countries. Based on the one dimensional indicator of RTA processed products, Germany is on the weak side. The weak position of Germany based on RTA is fully in line with the fact that Germany is among the largest importers of agrifood products. At the same time, Germany is the largest food producer of the selected countries.
The aforementioned analyses show that competitiveness is a broad concept that includes many aspects. To capture these, a more integrated approach, such as Porter’s diamond, to measure competitiveness would better reflect the performance of a nation or a sector than solely using trade indicators. Export is in most cases only a small part of the total production. For example: the EU food industry has a turnover of around 1,000bn euros, and exports 220bn euros to other member states and only 80bn euros to third countries or a mere 8% of the total production. This shows that the domestic market is of major importance (Ecorys, 2015 (forthcoming)). Competitiveness on domestic markets is determined by a firm or a sector’s productivity with which a nation’s resources such as land and labour are employed. Therefore, economy wide variables that measure value added and labour productivity should be included in competitiveness analysis of agrifood sectors.
Robustness of our approach: Porter’s Diamond indicating competitiveness in the past and in the future
Reviewing concepts of competitiveness is not the topic of this study. Nevertheless, it may be tempting to point at the strength of the approach we used in this study by comparing it with other approaches. In Section 2.1, we already did so, indicating that several schools of thought can be used for measuring competitiveness. We also explained that our motivation to apply Porter’s diamond approach is for its ability to combine industry attributes with those of a nation that shape the environment in which industries compete and that promote or impede the creation of their competitive advantage attributes. In further specifying the determinants of competitiveness we find that Porter’s approach allows us to capture indications of past performances, such as export positions or growth (using RTAs for instance) as well as providing indications of future potential, by measuring knowledge levels or (quality of) infrastructure. It is again for its broad approach, taking into account economic, trade and institutional indicators that we find Porter’s determinants of competitiveness useful for this study on competitiveness of the food industries in CIS countries.
Among the many other approaches in literature on competitiveness measurement, Buckley et al. (1988) also defines competitiveness in terms of past performance and future potential and therefore shows much resemblance with how we elaborated Porter’s diamond in this study. In Table 4.1 we show the measures listed and structured by Buckley et al. (1988), and indicate how these match with the one’s we used based on Porter. Similar to Porter Buckley et al. consider several levels of analyses, such as national and industry level. Table 4.1 shows that for all measures proposed by Buckley et al. (second column in
50
Table 4.1) our approach based on Porter’s diamond has at least one indicator, except for profitability; that one is lacking. Our conclusion is that the indicators of used for Porter’s diamond, matches with the dimensions Buckley et al. (1988) denotes: not only the competitive performance but also the competitive potential and process measured are included in our evaluation of competitiveness based on Porter.
Figure 4.1 Relative net Trade Advantage for raw materials (Z-scores of presented countries)
The Porter approach can also be compared with other approaches measuring competitiveness, such as Siggel (2006) that uses an international macroeconomic framework, Latruffe et al. (2010) focusing especially on international economic (mainly performance) indicators and on policies, or Sagheer and Yadav (2009) that include indicators, mainly based on governance aspects. However, Buckley et al. (1988) distinguish not only different aggregation levels, but include ex-post performance measures as
RU
RU
RU
RU
RU
RU
RU
RU
UA
UA
UA
UA
UA
UA
UA
UA
BY
BY
BY
BY
BY
BY
BY
BY
KZ
KZ
KZ
KZ
KZ
KZ
KZ
KZ
FR
FR
FR
FR
FR
FR
FR
FR
DE
DE
DE
DE
DE
DE
DE
DE
PL
PL
PL
PL
PL
PL
PL
PL
ES
ES
ES
ES
ES
ES
ES
ES
IT
IT
IT
IT
IT
IT
IT
IT
RO
RO
RO
RO
RO
RO
RO
RO
Pork
Poultry
Cereals
Oilseeds
Potatoes
Tomatoes
Apples
All sectors
RTA raw materialsWeak Average Strong
51
well as governance (=process) and future (potential) competitiveness in their framework. Given this broad scope we made only a comparison with his concept.
Figure 4.1 Relative net Trade Advantage for processed products (Z-scores of presented countries)
RU
RU
RU
RU
RU
RU
RU
RU
RU
RU
UA
UA
UA
UA
UA
UA
UA
UA
UA
UA
BY
BY
BY
BY
BY
BY
BY
BY
BY
BY
KZ
KZ
KZ
KZ
KZ
KZ
KZ
KZ
KZ
KZ
FR
FR
FR
FR
FR
FR
FR
FR
FR
FR
DE
DE
DE
DE
DE
DE
DE
DE
DE
DE
PL
PL
PL
PL
PL
PL
PL
PL
PL
PL
ES
ES
ES
ES
ES
ES
ES
ES
ES
ES
IT
IT
IT
IT
IT
IT
IT
IT
IT
IT
RO
RO
RO
RO
RO
RO
RO
RO
RO
RO
Dairy
Pork
Poultry
Cereals
Oilseeds
Potatoes
Tomatoes
Apples
Wine
All sectors
RTA processedWeak Average Strong
52
Table 4.1 Buckley et al.’s measures for country and industry compared to Porter’s diamond indicators
Time horizon Buckley et al.’s measures Porter’s determinant Used indicators grouped according determinant
Performance Export market share Demand Growth supply; RXA raw materials and processed products
Balance of trade Demand Self-sufficiency
% manufacturing in total output
Factor Growing environment
Export growth Strategy and rivalry RTA raw materials; RTA processed products
Demand Consumption of animal or vegetal Kcal, Protein and Fat; GDP/capita; home market
Cost competitiveness Factor Labour costs; Fuel costs
Productivity Strategy and rivalry Productivity (yields)
Price competitiveness Strategy and rivalry Price of raw materials
Technology indicators Factor Air freight; Sea Freight; Phone; Internet
Related/supporting industry Logistics; Communication
Access to resource Factor Labour supply; Land; Migration
Related/supporting industry N-production; RTA of fertilizers, plant protection and machinery
Process Commitment to international business
Factor Getting credit; FDI
Related/supporting industry Ease doing business; Start business
Government policies Government Accountability; Stability; Effectiveness; Regulatory; Rule of law; Corruption
Education /training Factor Education; R&D
4.2 Conclusions
The analysis of the competitive advantage of CIS countries in a number of agrifood sectors shows that these countries have a weak position when benchmarked against EU’s major producers of the commodity studied.5 There are only a few CIS agrifood sectors that shows an above average. The majority of the sectors score below the average and many countries are on the weak side of the assessment spectrum. Only Russia is above average for three sectors and Belarus is just above average for dairy.
The four largest CIS countries (Belarus, Kazakhstan, Russia and Ukraine) show the highest scores on the factor conditions and demand conditions determinants, indicating that the sectors’ strength is mainly in cheap labour and land, and the home country orientation (although some countries also export commodities in significant volumes). All countries are particularly weak, though, on the determinants ‘Supporting industries’ and ‘Government’, whereas on ‘Firm Strategies and rivalry’ some positive outliers are found.
Russia and Belarus are the strongest of the four studied CIS countries (Figure 3.26). However, Italy is in the same range as Russia and is one of weakest EU countries studied. Ukraine and Kazakhstan are the weakest of the four CIS countries. The position of Romania, one of latest accessors to the EU with a relatively low GDP/capita, is in the same range as these two CIS countries.
The overall conclusion therefore is that the competitiveness of the agrifood sectors in the CIS countries is largely based on low prices (based on abundant and hence cheap resource endowments), yet lack the presence of strong supplier industries and a government that provides regulatory quality and ensures compliance with rules of society. Competitive supplier industries and services would contribute to more efficient processing and distributing stages in the agrifood sectors while ‘good governance’ adds to an economically sound and stable business environment. The international competitiveness of CIS agrifood sectors, therefore, would be most enhanced by strengthening the agrifood supplying industries and by government policies that are more supportive to agrifood sector development. The latter need not be agricultural sector policies per se, but would refer in the first place to policies that help to establish
5 Section 3.11 summarises the results for each sector evaluated, and Appendix 3.3 for each Porter’s determinant.
53
institutional infrastructures that a market driven agricultural system needs (see also(Liefert and Liefert, 2012)).
This study argues that an analysis of competitiveness requires both trade and economic indicators. The availability of the latter describing the performances of the food industry in CIS countries were, however, insufficient to use the common types of analysis. As an alternative we apply Porter’s diamond approach and develop a quantification method using publicly available databases that cover most countries of the world. As far as we know this is one of the first attempts to quantify Porter’s concept of competitiveness and to apply this approach in the food sector. This attempt is open to further improvement in terms of interpretation of Porter’s determinants and categories of factors within each determinant, and the indicators and data used for quantification. The results show also that competitiveness analyses that build only on trade indicators might result in quite different outcomes than analyses using a broader set of economic variables. As competitiveness is not only about performance in terms of exports but also largely about using production means efficiently in response to market demands, an assessment of competiveness needs to take the broader economic context into account.
54
References ARGOTE, L. & INGRAM, P. 2000. Knowledge transfer: A basis for competitive advantage in firms.
Organizational behavior and human decision processes, 82, 150-169.
BUCKLEY, P. J., PASS, C. L. & PRESCOTT, K. 1988. Measures of international competitiveness: A critical survey∗†. Journal of marketing management, 4, 175-200.
COLLINS 2006. Collins COBUILD advanced learner's English dictionary, Collins Cobuild.
CROUCH, G. I. & RITCHIE, J. B. 1999. Tourism, competitiveness, and societal prosperity. Journal of business research, 44, 137-152.
DESAI, M., FUKUDA-PARR, S., JOHANSSON, C. & SAGASTI, F. 2002. Measuring the technology achievement of nations and the capacity to participate in the network age. Journal of Human Development, 3, 95-122.
ECORYS 2015 (forthcoming). Study on the competitive position of the European food and drink industry, Rotterdam, Ecorys/ECSIP Consortium.
FERTÖ, I. & HUBBARD, L. J. 2003. Revealed Comparative Advantage and Competitiveness in Hungarian Agri–Food Sectors. The World Economy, 26, 247–259.
FLEISHER, C. S. & BENSOUSSAN, B. E. 2003. Strategic and competitive analysis: methods and techniques for analyzing business competition, Prentice Hall Upper Saddle River, NJ.
FROHBERG, K. & HARTMANN, M. 1997. Comparing measures of competitveness. Halle: Institute of Agricultural Development in Central and Eastern Europe.
GORTON, M., HUBBARD, C. & FERTŐ, I. 2013. Theoretical background and conceptual framework. Halle: Leibniz Institute of Agricultural Development in Transition Economies (IAMO).
GRUBEL, H. G. & LLOYD, P. J. 1971. The Empirical Measurement of Intra-Industry Trade*. Economic Record, 47, 494-517.
GRUNDY, T. 2006. Rethinking and reinventing Michael Porter’s five forces model. Strategic Change, 15, 213-229.
HAMEL, G. & PRAHALAD, C. K. 1994. Competing for the future: Breakthrough strategies for seizing control of your industries and creating the markets of tomorrow., Harvard, Harvard Business School Press.
ITU 2014. Measuring the Information Society Report 2014, Geneva, International Telecommunication Union.
KRUGMAN, P. 1994. Competitiveness: a dangerous obsession. FOREIGN AFFAIRS-NEW YORK-, 73, 28-28.
LATRUFFE, L. 2010. Competitiveness, Productivity and Efficiency in the Agricultural and Agri-Food Sectors”, OECD Food, Agriculture and Fisheries Working Papers No. 30. Paris: OECD Publishing.
LIEFERT, W. M. & LIEFERT, O. 2012. Russian agriculture during transition: performance, global impact, and outlook. Applied economic perspectives and policy, 34, 37-75.
METCALFE, J. S., GEORGHIOU, L., CUNNINGHAM, P. & CAMERON, H. M. 1992. Evaluation of the impact of European Community research programmes upon the competitiveness of European industry-Concepts and approaches. EUR 14198 EN. Research evaluation. Science and Technology Policy Series.
O'MAHONEY, M. & VAN ARK, B. 2003. EU-productivity and competitiveness: an industry perspective. Luxembourg: Office for Official Publication of the European Community.
PEEL, M. C., FINLAYSON, B. L. & MCMAHON, T. A. 2007. Updated world map of the Köppen-Geiger climate classification. Hydrol. Earth Syst. Sci., 11, 1633-1644.
55
PORTER, M. E. 1980a. Competitive Strategy: techniques for analysing industrial and competitors New York, The Free Press.
PORTER, M. E. 1980b. Competitive strategy: Techniques for Analyzing Industries and Competitiors, New York, The Free Press.
PORTER, M. E. 1985. Competitive Advantage, New York, Free Press.
PORTER, M. E. 1990. The competitive advantage of nations, London, The MacMillam Press Ltd.
RUGMAN, A. M. & VERBEKE, A. 1993. How to operationalize Porter's diamond of international competitiveness. The International Executive, 35, 283-299.
SAGHEER, S., YADAV, S. S. & DESHMUKH, S. G. 2009. Developing a conceptual framework for assessing competitiveness of India's agrifood chain. International Journal of Emerging Markets, 4, 137-159.
SCHWAB, K. 2014. The Global Competitiveness Report 2014–2015. Geneva: World Economic Forum.
SCOTT, L. & VOLLRATH, T. 1992. Global Competitive Advantages and Overall Bilateral Complementarity in Agriculture: A Statistical Review. Washington: Economic Research Service,U.S. Department of Agriculture.
SIGGEL, E. 2006. International competitiveness and comparative advantage: a survey and a proposal for measurement. Journal of Industry, Competition and Trade, 6, 137-159.
SPENCE, A. M. & HAZARD, H. A. 1998. International Competitiveness, Cambridge, MA, Ballinger Publishing Company.
THOMPSON, A. A. & STRICKLAND, A. J. 2003. Strategic management. Concepts and Cases, New York, McGraw Hill.
TONG-SŎNG CHO, H.-C. M. 2000. From Adam Smith to Michael Porter: evolution of competitiveness theory. Korea: World Scientific.
UNDP 2014. Human Development Report 2014, New York, United Nations Development Programme.
WIJNANDS, J. H. M., BREMMERS, H. J., POPPE, K. J. & VAN DER MEULEN, B. M. J. 2008. An economic and legal assessment of the EU food industry's competitiveness. Agribusiness, 24, 417 - 439.
WIJNANDS, J. H. M. & VERHOOG, D. 2015 (forthcoming). Competitiveness of the EU food industry. An ex-post assessment of the performance embedded in international economic theory. The Hague: LEI Wageningen UR.
WIJNANDS, J. H. M., VERHOOG, D. & BERKUM, S. V. 2015. Measuring Competitiveness of Agro-Food Industries: The Swiss Case, Paris, OECD Publishing.
WORLDBANK 2014. Doing Business 2015. Going Beyond Efficiency, Washington, World Bank.
WRIGHT, P., KROLL, M. J. & PARNELL, J. 1998. Strategic Management Concepts, London, Prentice Hall.
56
Websites Doing business
http://www.doingbusiness.org/custom-query
FAOstat Food production and balances: http://faostat.fao.org/ Nitrogen production: http://faostat3.fao.org/download/R/RF/E
The Worldwide Governance Indicators www.govindicators.org
Human Development Report http://hdr.undp.org/en/data
ITU ICT Development Index (IDI) http://www.itu.int/en/ITU-D/Statistics/Pages/publications/wtid.aspx
World Bank LPI http://lpi.worldbank.org/international/global/2014
WDI: World Development Indicators http://data.worldbank.org/data-catalog/world-development-indicators
WEF: Word Economic Forum http://www3.weforum.org/docs/GCR2011-12/14.GCR2011-2012DTIIInfrastructure.pdf
57
Appendix 1 Specification of Trade indicators
Relative Export advantage index
The relative importance of an industry in the total trade is usually measured by the Revealed Comparative Advantage (RCA), Relative Export Advantage (RXA), Balassa index or specialisation index (Latruffe, 2010, Wijnands et al., 2008, Fertö and Hubbard, 2003). This index measures the export share of a product of one country in the total export of the world relative to the country’s export share in the world of all products. The relative export advantage index is as follows:
(1)
wt
ct
iwt
ict
ict
XTXT
XX
RXA Export value of specific industry i from country c in period t.
ictRXA The relative export advantage index for industry i, country c in period t.
ictX viz/ ictX The export value of industry i, country c or world w in period t.
ctXT viz. wtXT The total export value of all industries of country c or world w in period t.
The total export value of all industries from one country is the total of all exports: unprocessed or
processed agriculture commodities, or industrial products or services. A RXA index of 1 indicates that a
country is equally specialised as the total world exports. A level below 1 means relatively unspecialised
and above 1 relatively specialised. The latter indicates an export advantage, as relatively more is
exported than the world average. In fact it indicates the export focus of an industry and is therefore
externally oriented. Again the annual growth between the first and last time period will be used. The
index is only relevant for exporting industries.
The flaw of this index is that re-export might suggest high competitiveness of one industry. These transit
activities might be influenced by a good performance of another sector i.e. logistics or by beneficial
natural and infrastructural conditions like sea- or airports.
Relative import Advantage index
The opposite of the relative export advantage index is the relative import advantage index:
(2)
wt
ct
iwt
ict
ict
MTMT
MM
RMA The import value of specific industry i from country c in period t.
ictRMA The relative import advantage index for industry i, country c in period t.
ictM viz. ictM The import value of industry i of country c or of the world w in total in period t.
ctMT viz. wtMT The import value of all industry i of country c or of the world w in total in period t.
The interpretation of the index is reversed from that of RXA. A value below unity (=1) shows that the
industry i of a country imports relatively less than the world average and can be indicated as having a
competitive advantage; a value above unity indicates a relative higher import level.
High levels of re-export of products, due to comparative advantage of other sectors or country’s
location, might explain a high value.
Relative Trade Advantage index
The Relative Trade Advantage index is defined by Scott and Vollrath as difference between the RXA and
RMA (Scott and Vollrath, 1992).
58
(3) ictictict RMARXARTA
A positive RTA indicates a competitive advantage: the exports exceed the imports. Negative values
signify competitive disadvantages (Scott and Vollrath, 1992).
The advantage of these indices is that the data for calculating these indicators are well accessible the
UNCOMTRADE database. In this report, the values of all three indices will be presented. As metrics in
the assessment of the competiveness, the absolute growth rate between two periods of the Relative
Trade Advantage will be used as this index summarises the export and import developments. This index
has an advantage above the indices based on either export or imports (Frohberg and Hartmann, 1997).
This indicator is a modification of the approach of Wijnands et al. (2008). A positive growth rate
indicates the industry gains competitiveness compared to other countries.
59
Appendix 2 Data on the CIS food industry from national sources
Table A.1. Overview of data available for the competitiveness analysis of CIS food industries, from
national statistical sources reporting on economic activities of the food industry (more specifications available from the authors)
Country Section A Agriculture
Section C Manufacturing
Section G Wholesale, retail
Section I Accommodation and food services
Armenia 2004-12 complete for 2 digit level (01)
Only at 2 digit level – food industry – no data on value added
Data on employment, turnover, value added
Data on employment, turnover, value added
Azerbaijan 2004-12 complete for 2 digit level (01)
Only at 2 digit level – food industry
Useful data Useful data
Belarus 2004-12 pretty complete for 2 digit level (01 and 03)
Only at 2 digit level and only data for 2 years
Not available Not available
Georgia 2004-12 pretty complete for 2 digit level; some data at 3-digit level
Scattered data at 2-digit; only production value data at 3 digit level
Not available Some data on number of companies, employment, turnover
Kazakhstan 2004-12 complete for 2 digit level (01)
Data at 3 digit level, yet only number of companies and production value
Not available Not available
Moldova 2004-12 complete for 2 digit level (01 and 03)
Useful data at 3-digit level, but also data missing
Not available Not available
Russia 2004-12 complete for 2 digit level (01) and some details at 3-digit
Number of companies, profits and gross margin at 3-digit level, 2010-2013
As in Section C As in Section C
Ukraine 2004-12 complete for 2 digit level (01)
Useful data at 3-digit level, but only 2010-2012 data
Some useful data at 3-digit level, for 2010-2012
Not available
60
Appendix 3 Specification of Porter’s determinants
Appendix 3.1 Oilseeds sector
RU
RU
RU
RU
RU
RU
RU
RU
RU
RU
RU
RU
RU
RU
RU
RU
RU
UA
UA
UA
UA
UA
UA
UA
UA
UA
UA
UA
UA
UA
UA
UA
UA
UA
KZ
KZ
KZ
KZ
KZ
KZ
KZ
KZ
KZ
KZ
KZ
KZ
KZ
KZ
KZ
KZ
KZ
BY
BY
BY
BY
BY
BY
BY
BY
BY
BY
BY
BY
BY
BY
BY
BY
BY
DE
DE
DE
DE
DE
DE
DE
DE
DE
DE
DE
DE
DE
DE
DE
DE
DE
FR
FR
FR
FR
FR
FR
FR
FR
FR
FR
FR
FR
FR
FR
FR
FR
FR
PL
PL
PL
PL
PL
PL
PL
PL
PL
PL
PL
PL
PL
PL
PL
PL
PL
ES
ES
ES
ES
ES
ES
ES
ES
ES
ES
ES
ES
ES
ES
ES
ES
ES
RO
RO
RO
RO
RO
RO
RO
RO
RO
RO
RO
RO
RO
RO
RO
RO
RO
BG
BG
BG
BG
BG
BG
BG
BG
BG
BG
BG
BG
BG
BG
BG
BG
BG
Labour supply
Education
Labour costs
Land
Water
Growing env.
Fuel
R&D
RTA Knowledge
Credit
FDI
Migration
Air-Freight
Sea-Freight
Phone
Internet
Factor conditions
Hu
man
Ph
ysic
alK
no
wle
dge
Cap
ital
Infr
astr
uct
ure
Ove
rall
Factor conditions (oilseeds)
Weak Average Strong
61
RU
RU
RU
RU
RU
RU
RU
RU
RU
RU
RU
RU
UA
UA
UA
UA
UA
UA
UA
UA
UA
UA
UA
UA
KZ
KZ
KZ
KZ
KZ
KZ
KZ
KZ
KZ
KZ
KZ
KZ
BY
BY
BY
BY
BY
BY
BY
BY
BY
BY
BY
BY
DE
DE
DE
DE
DE
DE
DE
DE
DE
DE
DE
DE
FR
FR
FR
FR
FR
FR
FR
FR
FR
FR
FR
FR
PL
PL
PL
PL
PL
PL
PL
PL
PL
PL
PL
PL
ES
ES
ES
ES
ES
ES
ES
ES
ES
ES
ES
ES
RO
RO
RO
RO
RO
RO
RO
RO
RO
RO
RO
RO
BG
BG
BG
BG
BG
BG
BG
BG
BG
BG
BG
BG
Kcal
Protein
Fat
Animal prot.
Vegetal fat
Self-suff.
GDP/cap
Home market
Growth supply
RXA raw materials
RXA processed
Demand conditions
Ho
me
dem
and
Dem
and
pat
tern
Inte
rnat
ion
ald
eman
dO
vera
ll
Demand conditions (oilseeds)Weak Average Strong
62
RU
RU
RU
RU
RU
RU
RU
UA
UA
UA
UA
UA
UA
UA
KZ
KZ
KZ
KZ
KZ
KZ
KZ
BY
BY
BY
BY
BY
BY
BY
DE
DE
DE
DE
DE
DE
DE
FR
FR
FR
FR
FR
FR
FR
PL
PL
PL
PL
PL
PL
PL
ES
ES
ES
ES
ES
ES
ES
RO
RO
RO
RO
RO
RO
RO
BG
BG
BG
BG
BG
BG
BG
N-production ha
RTA fertilizers
RTA plant/animal protect.
RTA machinery
Logistics
Communication
Supporting industries
Sup
plie
rs in
du
stri
esR
elat
ed in
du
stri
esO
vera
llSupporting industries (oilseeds)
Weak Average Strong
63
RU
RU
RU
RU
RU
RU
RU
RU
RU
UA
UA
UA
UA
UA
UA
UA
UA
UA
KZ
KZ
KZ
KZ
KZ
KZ
KZ
KZ
KZ
BY
BY
BY
BY
BY
BY
BY
BY
BY
DE
DE
DE
DE
DE
DE
DE
DE
DE
FR
FR
FR
FR
FR
FR
FR
FR
FR
PL
PL
PL
PL
PL
PL
PL
PL
PL
ES
ES
ES
ES
ES
ES
ES
ES
ES
RO
RO
RO
RO
RO
RO
RO
RO
RO
BG
BG
BG
BG
BG
BG
BG
BG
BG
Ease doing business
Price sunflower
Price rapeseed
Productivity sunflower
Productivity rapeseed
Start business
RTA raw materials
RTA processed
Firm strategy
Stra
tegy
Riv
alry
Fore
ign
co
mp
etit
ion
Ove
rall
Firm strategy (oilseeds)Weak Average Strong
64
RU
RU
RU
RU
RU
RU
RU
UA
UA
UA
UA
UA
UA
UA
KZ
KZ
KZ
KZ
KZ
KZ
KZ
BY
BY
BY
BY
BY
BY
BY
DE
DE
DE
DE
DE
DE
DE
FR
FR
FR
FR
FR
FR
FR
PL
PL
PL
PL
PL
PL
PL
ES
ES
ES
ES
ES
ES
ES
RO
RO
RO
RO
RO
RO
RO
BG
BG
BG
BG
BG
BG
BG
Accountability
Stability
Effectiveness
Regulatory
Rule of law
Corruption
Government
Ro
le g
ove
rnm
ent
Ove
rall
Government (oilseeds)Weak Average Strong
65
Appendix 3.2 Dairy sector
RU
RU
RU
RU
RU
RU
RU
RU
RU
RU
RU
RU
RU
RU
RU
RU
RU
UA
UA
UA
UA
UA
UA
UA
UA
UA
UA
UA
UA
UA
UA
UA
UA
UA
KZ
KZ
KZ
KZ
KZ
KZ
KZ
KZ
KZ
KZ
KZ
KZ
KZ
KZ
KZ
KZ
KZ
BY
BY
BY
BY
BY
BY
BY
BY
BY
BY
BY
BY
BY
BY
BY
BY
BY
DE
DE
DE
DE
DE
DE
DE
DE
DE
DE
DE
DE
DE
DE
DE
DE
DE
FR
FR
FR
FR
FR
FR
FR
FR
FR
FR
FR
FR
FR
FR
FR
FR
FR
PL
PL
PL
PL
PL
PL
PL
PL
PL
PL
PL
PL
PL
PL
PL
PL
PL
NL
NL
NL
NL
NL
NL
NL
NL
NL
NL
NL
NL
NL
NL
NL
NL
NL
IT
IT
IT
IT
IT
IT
IT
IT
IT
IT
IT
IT
IT
IT
IT
IT
IT
UK
UK
UK
UK
UK
UK
UK
UK
UK
UK
UK
UK
UK
UK
UK
UK
UK
Labour supply
Education
Labour costs
Land
Water
Growing env.
Fuel
R&D
RTA Knowledge
Credit
FDI
Migration
Air-Freight
Sea-Freight
Phone
Internet
Factor conditions
Hu
man
Ph
ysic
alK
no
wle
dge
Cap
ital
Infr
astr
uct
ure
Ove
rall
Factor conditions (dairy)
Weak Average Strong
66
RU
RU
RU
RU
RU
RU
RU
RU
RU
RU
RU
UA
UA
UA
UA
UA
UA
UA
UA
UA
UA
UA
KZ
KZ
KZ
KZ
KZ
KZ
KZ
KZ
KZ
KZ
KZ
BY
BY
BY
BY
BY
BY
BY
BY
BY
BY
BY
DE
DE
DE
DE
DE
DE
DE
DE
DE
DE
DE
FR
FR
FR
FR
FR
FR
FR
FR
FR
FR
FR
PL
PL
PL
PL
PL
PL
PL
PL
PL
PL
PL
NL
NL
NL
NL
NL
NL
NL
NL
NL
NL
NL
IT
IT
IT
IT
IT
IT
IT
IT
IT
IT
IT
UK
UK
UK
UK
UK
UK
UK
UK
UK
UK
UK
Kcal
Protein
Fat
Animal prot.
Vegetal fat
Self-suff.
GDP/cap
Home market
Growth supply
RXA processed
Demand conditions
Ho
me
dem
and
Dem
and
pat
tern
Ove
rall
Demand conditions (dairy)Weak Average Strong
67
RU
RU
RU
RU
RU
RU
RU
UA
UA
UA
UA
UA
UA
UA
KZ
KZ
KZ
KZ
KZ
KZ
KZ
BY
BY
BY
BY
BY
BY
BY
DE
DE
DE
DE
DE
DE
DE
FR
FR
FR
FR
FR
FR
FR
PL
PL
PL
PL
PL
PL
PL
NL
NL
NL
NL
NL
NL
NL
IT
IT
IT
IT
IT
IT
IT
UK
UK
UK
UK
UK
UK
UK
N-production ha
RTA fertilizers
RTA plant/animal protect.
RTA sector machinery
Logistics
Communication
Supporting industries
Sup
plie
rs in
du
stri
esR
elat
ed in
du
stri
esO
vera
llSupporting industries (dairy)
Weak Average Strong
68
RU
RU
RU
RU
RU
RU
UA
UA
UA
UA
UA
UA
KZ
KZ
KZ
KZ
KZ
KZ
BY
BY
BY
BY
BY
BY
DE
DE
DE
DE
DE
DE
FR
FR
FR
FR
FR
FR
PL
PL
PL
PL
PL
PL
NL
NL
NL
NL
NL
NL
IT
IT
IT
IT
IT
IT
UK
UK
UK
UK
UK
UK
Ease doing business
Price
Productivity
Start business
RTA processed
Firm strategy
Stra
tegy
Riv
alry
Ove
rall
Firm strategy (dairy)Weak Average Strong
69
RU
RU
RU
RU
RU
RU
RU
UA
UA
UA
UA
UA
UA
UA
KZ
KZ
KZ
KZ
KZ
KZ
KZ
BY
BY
BY
BY
BY
BY
BY
DE
DE
DE
DE
DE
DE
DE
FR
FR
FR
FR
FR
FR
FR
PL
PL
PL
PL
PL
PL
PL
NL
NL
NL
NL
NL
NL
NL
IT
IT
IT
IT
IT
IT
IT
UK
UK
UK
UK
UK
UK
UK
Accountability
Stability
Effectiveness
Regulatory
Rule of law
Corruption
Government
Ro
le g
ove
rnm
ent
Ove
rall
Government (dairy)
Weak Average Strong
70
Appendix 3.3 Scores on Porter’s determinants of all sectors
A3.3.1 Factor conditions
On factor condition Russia and Germany are for all sectors on the strongest side, Italy and Poland on the
weakest side. Kazakhstan is mainly for crops above average, mainly on the same level as the France.
Belarus is for most products on below average in the range of Romania. Ukraine is on the strong side for
dairy, oilseeds, potatoes and tomatoes. These positions indicate that the CIS countries have some
potential for increasing their production to compete with EU member states. The assessment of ‘all
sectors’ is based on unweighted average of all sectors: each sector has the same weight.
Figure A3.3.1 Factor conditions scores for all sectors (Z-scores of presented countries)
RU
RU
RU
RU
RU
RU
RU
RU
RU
RU
UA
UA
UA
UA
UA
UA
UA
UA
UA
UA
BY
BY
BY
BY
BY
BY
BY
BY
BY
BY
KZ
KZ
KZ
KZ
KZ
KZ
KZ
KZ
KZ
KZ
FR
FR
FR
FR
FR
FR
FR
FR
FR
FR
DE
DE
DE
DE
DE
DE
DE
DE
DE
DE
PL
PL
PL
PL
PL
PL
PL
PL
PL
PL
ES
ES
ES
ES
ES
ES
ES
ES
ES
ES
IT
IT
IT
IT
IT
IT
IT
IT
IT
IT
RO
RO
RO
RO
RO
RO
RO
RO
RO
RO
Dairy
Pork
Poultry
Cereals
Oilseeds
Potatoes
Tomatoes
Apples
Wine
All sectors
Factor conditionsWeak Average Strong
71
A3.3.2 Demand conditions
The scores on the demand conditions are more mixed compared to the factor conditions. France is
mainly on the strongest side and Romania on the weakest side. Overall the CIS countries are on the
weak side, except for Russia that is just above average. Noteworthy is the relatively strong position of
Russia and Belarus of dairy that is on the same level as of France and Germany. Ukraine turned out to be
the strongest for cereals and oilseeds. Poland that is overall weak, is the strongest on demand
conditions for apples.
Figure A3.3.2Demand conditions scores of all sectors (Z-scores of presented countries)
RU
RU
RU
RU
RU
RU
RU
RU
RU
RU
UA
UA
UA
UA
UA
UA
UA
UA
UA
UA
BY
BY
BY
BY
BY
BY
BY
BY
BY
BY
KZ
KZ
KZ
KZ
KZ
KZ
KZ
KZ
KZ
KZ
FR
FR
FR
FR
FR
FR
FR
FR
FR
FR
DE
DE
DE
DE
DE
DE
DE
DE
DE
DE
PL
PL
PL
PL
PL
PL
PL
PL
PL
PL
ES
ES
ES
ES
ES
ES
ES
ES
ES
ES
IT
IT
IT
IT
IT
IT
IT
IT
IT
IT
RO
RO
RO
RO
RO
RO
RO
RO
RO
RO
Dairy
Pork
Poultry
Cereals
Oilseeds
Potatoes
Tomatoes
Apples
Wine
All sectors
Demand conditionsWeak Average Strong
72
A3.3.3 Supporting industry
Figure A3.3.3 shows a rather clear distinction between the EU member states, excluding Romania and
the CIS countries. The EU countries are for all sectors above average to strong, the CIS countries below
average to weak. The position of Romania - EU member since 2007- is also always weak. Belarus scores
above average for 6 of the 9 sectors, especially in the crops sectors.
Figure A3.3.3 Scores supporting industries of all sectors (Z-scores of presented countries)
RU
RU
RU
RU
RU
RU
RU
RU
RU
RU
UA
UA
UA
UA
UA
UA
UA
UA
UA
UA
BY
BY
BY
BY
BY
BY
BY
BY
BY
BY
KZ
KZ
KZ
KZ
KZ
KZ
KZ
KZ
KZ
KZ
FR
FR
FR
FR
FR
FR
FR
FR
FR
FR
DE
DE
DE
DE
DE
DE
DE
DE
DE
DE
PL
PL
PL
PL
PL
PL
PL
PL
PL
PL
ES
ES
ES
ES
ES
ES
ES
ES
ES
ES
IT
IT
IT
IT
IT
IT
IT
IT
IT
IT
RO
RO
RO
RO
RO
RO
RO
RO
RO
RO
Dairy
Pork
Poultry
Cereals
Oilseeds
Potatoes
Tomatoes
Apples
Wine
All sectors
Supporting industriesWeak Average Strong
73
A3.3.4 Firm strategy and rivalry
The position of the countries on the determinant firm strategy and rivalry is rather divers. Most CIS
countries as well as Romania are below average for (almost) all sectors. Belarus is an exception, it above
average for 5 out of the 9 sectors and is in the range of the strongest countries for dairy and cereals. Of
the EU countries France, Germany and Poland are strong for almost all sectors. Poland has a very high
score for apples. Italy is the strongest in oilseeds, but the weakest in cereals and potatoes.
Figure A3.3.4 Scores firm strategy and rivalry for all sectors (Z-scores of presented countries)
RU
RU
RU
RU
RU
RU
RU
RU
RU
RU
UA
UA
UA
UA
UA
UA
UA
UA
UA
UA
BY
BY
BY
BY
BY
BY
BY
BY
BY
BY
KZ
KZ
KZ
KZ
KZ
KZ
KZ
KZ
KZ
KZ
FR
FR
FR
FR
FR
FR
FR
FR
FR
FR
DE
DE
DE
DE
DE
DE
DE
DE
DE
DE
PL
PL
PL
PL
PL
PL
PL
PL
PL
PL
ES
ES
ES
ES
ES
ES
ES
ES
ES
ES
IT
IT
IT
IT
IT
IT
IT
IT
IT
IT
RO
RO
RO
RO
RO
RO
RO
RO
RO
RO
Dairy
Pork
Poultry
Cereals
Oilseeds
Potatoes
Tomatoes
Apples
Wine
All sectors
Firm strategyWeak Average Strong
74
A3.3.5 Governance
To complete the analysis, figure 3.30 present the scores on the additional determinant governance,
which is similar for all sectors. The distinction between CIS countries and Romania and the other EU
countries is conclusive. This determinant has 50% of the weight of the other determinants.
Figure A3.3.5 Scores government for all sectors (Z-scores of presented countries)