Deliverable 4.4: Progress Report 4 Overview of Work Period: 2/16/21 – 5/25/21 Water Quality Toxicology Stormwater Water Year Event Basic Full Zfish Coho Collection Date Treatment Dates 6 31 x 2/16/21 2/17/21-2/18/21 32 x 1/24/21 1/25/21-1/26/21 33 x 1/31/21 2/1/21-2/2/21 34 x 2/6/21 2/8/21-2/9/21 35 x 2/15/21 2/16/21-2/17/21 36 x x * x 3/14/21 3/15/21-3/16/21 7 37 x 3/24/21 3/25/21-3/26/21 38 x 4/7/21 4/8/21-4/9/21 39 x 5/18/21 5/18/21-5/19/21 40 x 5/23/20 5/24/21-5/25/21 *Zebrafish molecular assays have not yet been completed for Event 36. Report Summary Work Progress Status Project Tasks % Completion 1. QAPP development 100 2. Prepare experimental columns 100 3. Condition experimental columns 100 4. Bioretention performance throughout accelerated aging 70 5. Outreach and communication 0 Discussions/decisions made since last report period N/A Summary of Events Summary of Full Water Chemistry Event 36 (Post WY6) Dissolved zinc concentrations were significantly higher in effluent from the shallower than the deeper BSM treatment depths. Copper concentrations were significantly higher in effluent from the 6” treatment depths compared with the 12” depths. A net export of nitrates was observed for all treatment depths, with significantly higher effluent concentrations from the deeper than the shallower BSM treatment depths.
Transcript
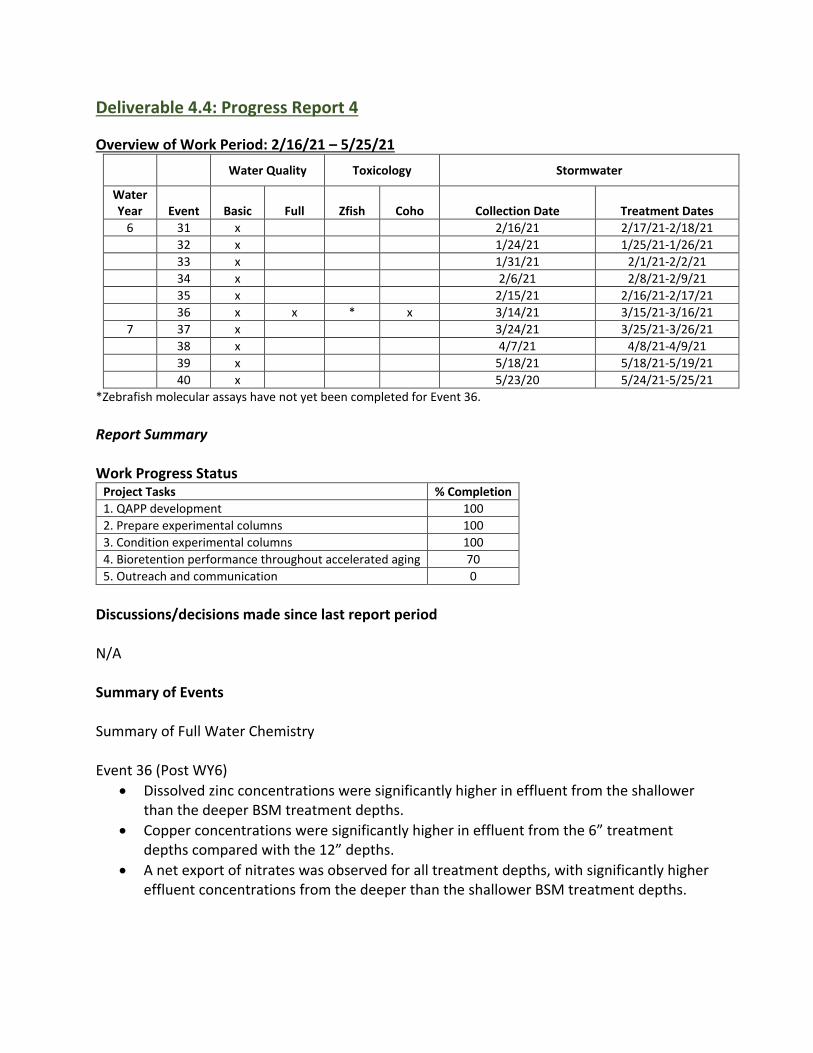
Deliverable 4.4: Progress Report 4
Overview of Work Period: 2/16/21 – 5/25/21
Water Quality Toxicology Stormwater
Water Year Event Basic Full Zfish Coho Collection Date Treatment Dates
6 31 x 2/16/21 2/17/21-2/18/21
32 x 1/24/21 1/25/21-1/26/21
33 x 1/31/21 2/1/21-2/2/21
34 x 2/6/21 2/8/21-2/9/21
35 x 2/15/21 2/16/21-2/17/21
36 x x * x 3/14/21 3/15/21-3/16/21
7 37 x 3/24/21 3/25/21-3/26/21
38 x 4/7/21 4/8/21-4/9/21
39 x 5/18/21 5/18/21-5/19/21
40 x 5/23/20 5/24/21-5/25/21
*Zebrafish molecular assays have not yet been completed for Event 36. Report Summary Work Progress Status
Project Tasks % Completion
1. QAPP development 100
2. Prepare experimental columns 100
3. Condition experimental columns 100
4. Bioretention performance throughout accelerated aging 70
5. Outreach and communication 0
Discussions/decisions made since last report period N/A Summary of Events Summary of Full Water Chemistry Event 36 (Post WY6)
Dissolved zinc concentrations were significantly higher in effluent from the shallower than the deeper BSM treatment depths.
Copper concentrations were significantly higher in effluent from the 6” treatment depths compared with the 12” depths.
A net export of nitrates was observed for all treatment depths, with significantly higher effluent concentrations from the deeper than the shallower BSM treatment depths.
Orthophosphate was not detected in effluent from the 6” treatment depths. Orthophosphate concentrations were significantly higher in effluent from the deeper than the shallower treatment depths.
Summary of Toxicology: Event 36 (Post WY6)
Untreated highway runoff was acutely lethal to juvenile coho salmon (100% mortality).
Treatment of runoff with bioretention completely prevented juvenile coho mortality for all BSM depths.
Full Water Chemistry
Full water chemistry analysis was conducted for Event 36 (End of WY6). Samples for water chemistry were collected and analyzed as previously (Deliverable 4.1: Progress Report 1).
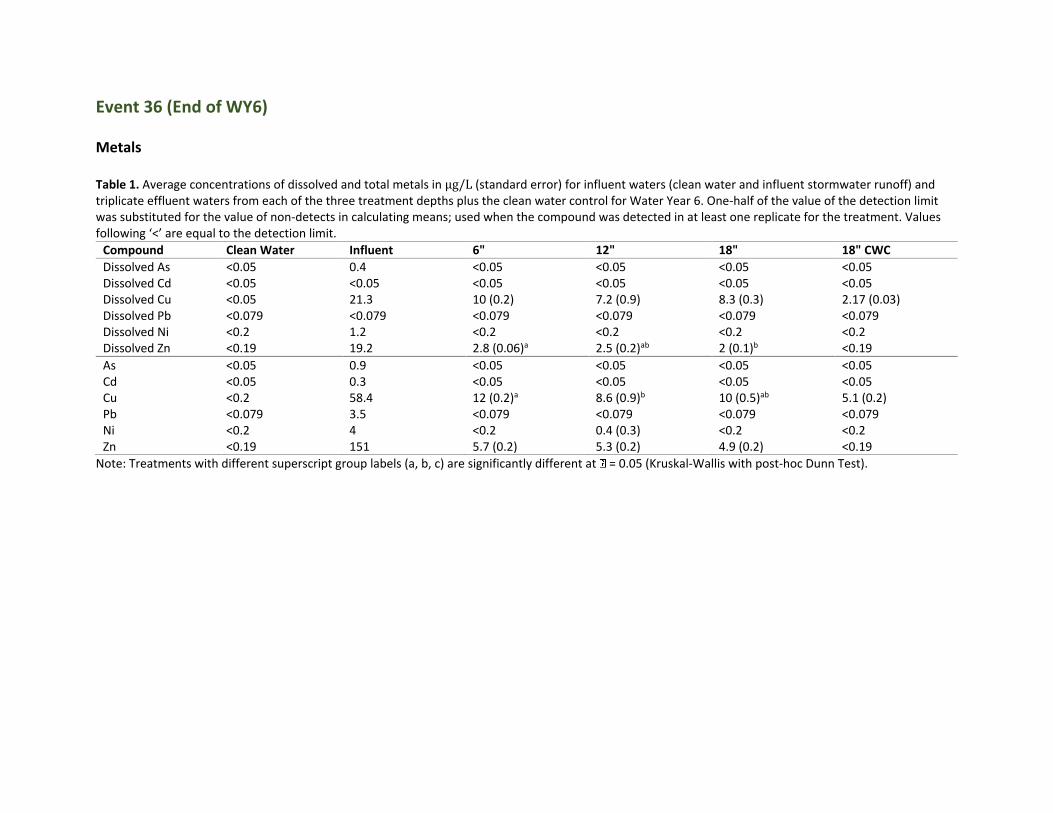
Event 36 (End of WY6) Metals Table 1. Average concentrations of dissolved and total metals in μg/L (standard error) for influent waters (clean water and influent stormwater runoff) and triplicate effluent waters from each of the three treatment depths plus the clean water control for Water Year 6. One-half of the value of the detection limit was substituted for the value of non-detects in calculating means; used when the compound was detected in at least one replicate for the treatment. Values following ‘<’ are equal to the detection limit.
Note: Treatments with different superscript group labels (a, b, c) are significantly different at = 0.05 (Kruskal-Wallis with post-hoc Dunn Test).
Nutrient & Conventional Water Chemistry Table 2. Average water chemistry values (standard error) for influent waters (clean water and influent stormwater runoff) and triplicate effluent waters from each of the three treatment depths plus the clean water control for Water Year 6. One-half of the value of the detection limit was substituted for the value of non-detects in calculating means; used when the compound was detected in at least one replicate for the treatment. Values following ‘<’ are equal to the detection limit. n.m. = not measured for this event.
Compound Units Clean Water Influent 6" 12" 18" 18" CWC
Note: Treatments with different superscript group labels (a, b, c) are significantly different at = 0.05 (Kruskal-Wallis with post-hoc Dunn Test).
PAHs Table 3. Average polycyclic aromatic hydrocarbon (PAH) concentrations in μg/L (standard error) for influent waters (clean water and influent stormwater runoff) and triplicate effluent waters from each of the three treatment depths plus the clean water control for Water Year 6. One-half of the value of the detection limit was substituted for the value of non-detects in calculating means; used when the compound was detected in at least one replicate for the treatment. Values following ‘<’ are equal to the detection limit.
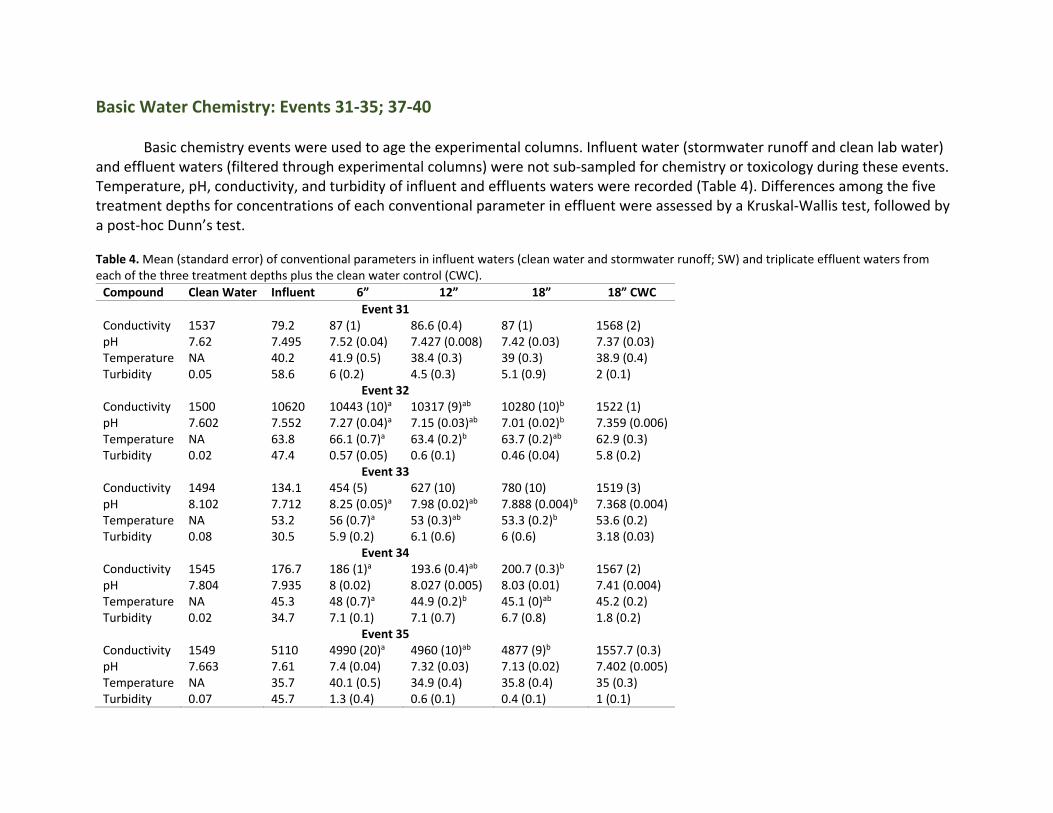
Basic chemistry events were used to age the experimental columns. Influent water (stormwater runoff and clean lab water) and effluent waters (filtered through experimental columns) were not sub-sampled for chemistry or toxicology during these events. Temperature, pH, conductivity, and turbidity of influent and effluents waters were recorded (Table 4). Differences among the five treatment depths for concentrations of each conventional parameter in effluent were assessed by a Kruskal-Wallis test, followed by a post-hoc Dunn’s test. Table 4. Mean (standard error) of conventional parameters in influent waters (clean water and stormwater runoff; SW) and triplicate effluent waters from each of the three treatment depths plus the clean water control (CWC).
Toxicity testing using juvenile coho salmon was generally conducted as previously (Deliverable 4.1: Progress Report 1). Untreated highway runoff was acutely lethal to juvenile coho salmon. At the end of the exposure (24 h), 100% mortality was observed. Treatment of runoff through any of the BSM treatments completely prevented mortality.
Figure 1. Survival of juvenile coho salmon following 24-h exposures to influent and effluent waters for three sampling Events: 1 (WY0), 24 (post-WY4), and 36 (post-WY6). Coho were exposed to influent stormwater (SW), control water (C), and bioretention-treated runoff pooled across triplicates (Event 1 and post-WY6) or duplicates (post-WY4) of each bioretention treatment depth (6”, 12”, 18”, and 18” clean water control (CWC)). * indicates an exposure that significantly affected survival relative to controls.
Saturated Hydraulic Conductivity
Saturated hydraulic conductivity (Ksat) of each bioretention treatment was measured following Event 36 (Post-WY6) using the falling head method (Klute and Dirksen 1986).
Table 5. Average (standard deviation) saturated hydraulic conductivity (Ksat) for each treatment for each test. 6R, 12R, and 18R refer to the 6”, 12”, and 18” treatment depths; 18C refers to the 18” clean water control columns.