Deliverable 4.5 Final Set of Management Tools: Final set of management tools and recommendations for improvements Due date of deliverable: month 48 (October 2013) Actual submission date: month 48 (October 2013)
Transcript
Deliverable 4.5
Final Set of Management Tools: Final set of management tools and recommendations
for improvements
Due date of deliverable: month 48 (October 2013)
Actual submission date: month 48 (October 2013)
Coordinator: Dr Katherine Cronin
Stichting Deltares
(Partner 16, Deltares, The Netherlands)
Contributors:
Katherine Cronin
Stichting Deltares
(Partner 16, Deltares, The Netherlands)
Myra van der Meulen
Stichting Deltares
(Partner 16, Deltares, The Netherlands)
Frank Keppel
Stichting Deltares
(Partner 16, Deltares, The Netherlands)
Asbjørn Christensen
Danmarks Tekniske Universitet
(Partner 12, DTU-AQUA, Denmark)
Tore Hogaasen
Norsk Institute for Vannforskning
(Partner 17, NIVA, Norway)
Dr Vanessa Stelzenmuller
Johann Heinrich von Thuenen-Institut,
Bundesforschungsintitut Fuer Landliche Raume,
Waldund Fischerei
(Partner 20, VTI, Germany)
Klaas Deneudt
Universiteit Gent
(Partner 4, UGent, Belgium)
3
1 INTRODUCTION 4
2 TOOLS FOR MESMA (MONITORING AND EVALUATION OF SPATIALLY MANAGED AREAS) 7 2.1 TOOL CATEGORIES 8
3 USE OF TOOLS IN THE CASE STUDIES 14 3.1 TOOLS USED IN THE CASE STUDIES 21
4 TOOLS DEVELOPED OR IMPROVED IN MESMA AND RECOMMENDATIONS FOR IMPROVEMENTS 23 4.1 E-MANUAL 23 4.2 BIOLOGICAL VALUATION 25 4.3 SPAM 26 4.4 UNCERTAINTY ANALYSES 28 4.5 CHASE 30
5 REFERENCES 32
1 INTRODUCTION
There is a huge range of what one might classify as tools that can be used in the various stages of marine
spatial management. The aim of the MESMA project (www.mesma.org) was to monitor and evaluate
spatially managed areas and for this tools and methodologies are required. The type of tools used
depends on whether a new plan is being developed, an existing plan is being reviewed and how much
monitoring of human activities and impacts is being undertaken. One may also want to evaluate whether
the current spatial management plan is achieving the stated ecological and/or socio-economic goals, such
as Good Environmental Status (GES). One of the objectives of MESMA was to gather a set of tools that can
be used to evaluate the effectiveness of a spatially managed area and the marine planning process from
the perspective of ecosystem-based management and in the context of climate change.
This document provides a brief overview of tools for the monitoring and evaluation of spatially
management areas. Many of these tools can be found on the MESMA central exchange
(http://www.mesmacentralexchange.eu/) (Figure 1). It also includes a brief description of MSP-specific
conceptual tools and guidelines.
Figure 1 MESMA central exchange
Different stages of the marine spatial planning process may be tackled with a range of tools. In itself,
marine spatial planning (MSP) is advocated as a promising tool to support the implementation of
ecosystem-based marine management (Stelzenmüller et al., 2012). Not all steps of such a planning
process require fundamental science. Thus the main scientific input is required for the initial assessment,
the development of spatial management scenarios and for plan performance assessment (Stelzenmüller
et al., 2012).
Any successful MSP initiative will employ a range of tools, techniques and methods to achieve each of the
above MSP stages. In the widest sense, tools for marine spatial planning can encompass a wide variety of
range and forms - conceptual, operational, analytical or technical. A tool may be a model, map, database,
legal/legislative requirements, permits, guidelines, a framework (Figure 2), criteria i.e. for indicators, a
Table 1 – Tool categories associated with different steps in the MESMA framework
FRAMEWORK
STEPS
Context Setting
(Step 1)
Existing information
collation and mapping
(Step 2)
Indicators
(Step 3)
Risk analysis and
state assessment
(Step 4)
Assessment of
findings against
operation objectives
(Step 5)
Evaluation of
Management
Effectiveness
(Step 6)
Adaptation to current
management (Step 7)
TOOL TYPE
Visualisation and
Mapping
X X X
Data Collection,
Processing &
Management
X X X
Decision Support X X X
Spatial Analysis X X
Statistical X
Conceptual
tools/guidelines
X X X
Participatory Mapping
and GIS
X
Uncertainty analysis X X X X X X X
Monitoring and
Assessment
X X
Fisheries Analysis X
Numerical Modelling X
Project Management X X X X X X X
Communication X
Socio-Economics X
Tool Category Visualisation
& Mapping
Data
Collection,
Processing
&
Management
Decision
Support
Spatial
Analysis
Statistical Participatory
mapping &
GIS
Monitoring
and Impact
Assessment
Fisheries
Analysis
Numerical
Modelling
Communication Socio-
Economics
Tool
Morpho x
Eonfusion x x
Habitat Digitizer Extension x
Kepler x
Benthic Terrain Modeller x x
Ecosystem Assessment and
Reporting Tool
x x x
MGET - Marine Geospatial Ecology
Tools
x x x x x x x
Marine Map x x x x x x x
CTAM - Coastal Transects Analysis
Model
x x x x x x
C-PLAN x x x
Netica x
SimCoast x x
Habitat Priority Planner x x x x
Marxan with Zones, and Zonae
Cogito
x x x x
ARIES - Artificial Intelligence for
Ecosystem Services
x x x
Expert Choice x x
AHP-OWA x x x
11
Tool Category Visualisation
& Mapping
Data
Collection,
Processing
&
Management
Decision
Support
Spatial
Analysis
Statistical Participatory
mapping &
GIS
Monitoring
and Impact
Assessment
Fisheries
Analysis
Numerical
Modelling
Communication Socio-
Economics
HIPRE x
LINK x x
MIDAS x x x x
MIMES x x x x
PAT x x
IAN (Integration and Application
Network)
x x
Open OceanMap x
E-Participation x x
Habitat Modelling Toolbox x x
SPAM (Sandeel Population
Analysis Model)
x x
Biomapper x x x
IBMlib x x x x
Fishery Analyst x x x x
Connectivity Analysis Toolkit x x
AHP in ArcGIS x x
EASy Mapping Solutions for Marine
Resources
x x
NatureServe Vista x x
SDM (Spatial Data Modeler) x x
NAMEM (Network Analyst for
Marine Ecosystem-based
management)
x
Tool Category Visualisation
& Mapping
Data
Collection,
Processing
&
Management
Decision
Support
Spatial
Analysis
Statistical Participatory
mapping &
GIS
Monitoring
and Impact
Assessment
Fisheries
Analysis
Numerical
Modelling
Communication Socio-
Economics
PANDA (Protected Areas Network
Design Application for ArcGIS)
x x
DIVA (Dynamic Interactive
Vulnerability Assessment)
x x x x
PATHMATRIX x x
WeMO x x
GADGET x x
ISIS-FISH x x
Marine Reserve and Local
Fisheries Interactive Simulation
x
EcoGIS x x x x
Multi-species Virtual Population
Analysis
x x
Atlantis x x x
GARP x
EcoWin 2000 x
ERSEM (the European Regional
Ecosystems Model)
x
Fisheries Libraries in R x x x
Hyper Niche x x
EcoPath x
Hydata Sonobuoy x
SAM v4.0 - Spatial analysis in
macroecology
x x x
13
Tool Category Visualisation
& Mapping
Data
Collection,
Processing
&
Management
Decision
Support
Spatial
Analysis
Statistical Participatory
mapping &
GIS
Monitoring
and Impact
Assessment
Fisheries
Analysis
Numerical
Modelling
Communication Socio-
Economics
CLUZ Conservation Land-Use
Zoning Software
EcoSeed x
ArcMarine x x x
MIRADI x x
Zonation x x
GRID (from Co-Exist) x x x
Biological Valuation Method x x x
BEQI x x x
Sustainability Indicator Tool x x x x
Table 2 A list of tools associated with different categories
3 USE OF TOOLS IN THE CASE STUDIES
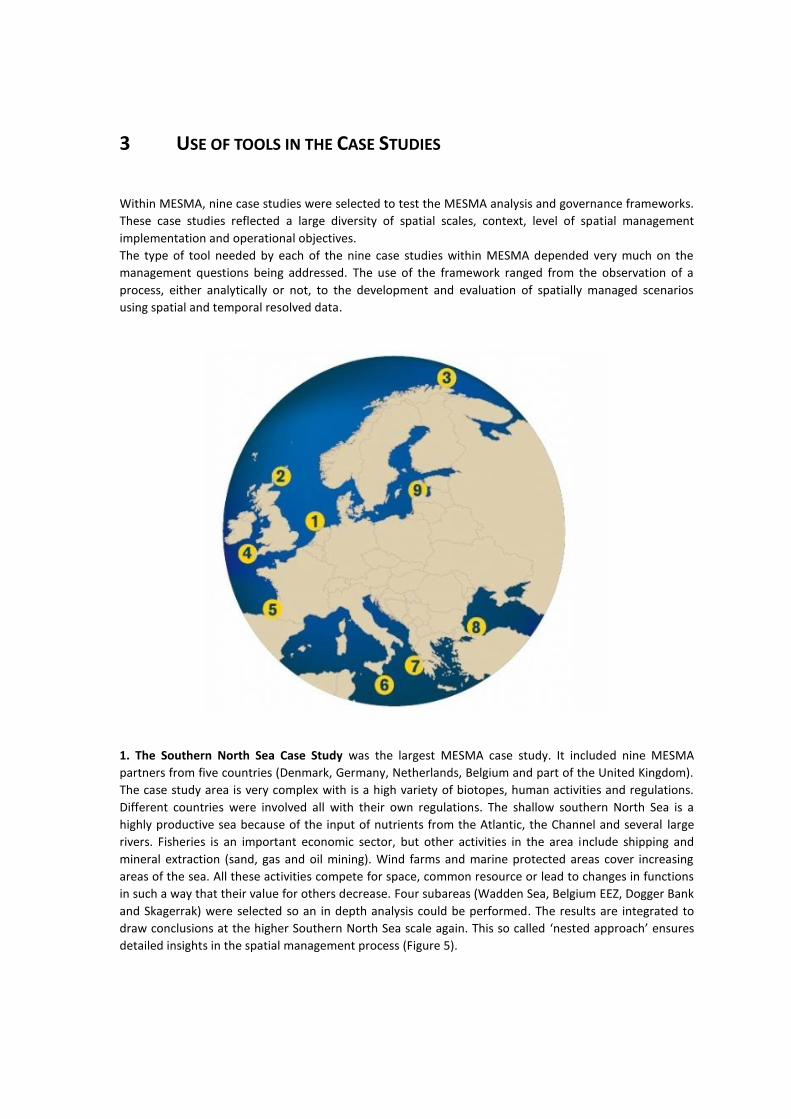
Within MESMA, nine case studies were selected to test the MESMA analysis and governance frameworks.
These case studies reflected a large diversity of spatial scales, context, level of spatial management
implementation and operational objectives.
The type of tool needed by each of the nine case studies within MESMA depended very much on the
management questions being addressed. The use of the framework ranged from the observation of a
process, either analytically or not, to the development and evaluation of spatially managed scenarios
using spatial and temporal resolved data.
1. The Southern North Sea Case Study was the largest MESMA case study. It included nine MESMA
partners from five countries (Denmark, Germany, Netherlands, Belgium and part of the United Kingdom).
The case study area is very complex with is a high variety of biotopes, human activities and regulations.
Different countries were involved all with their own regulations. The shallow southern North Sea is a
highly productive sea because of the input of nutrients from the Atlantic, the Channel and several large
rivers. Fisheries is an important economic sector, but other activities in the area include shipping and
mineral extraction (sand, gas and oil mining). Wind farms and marine protected areas cover increasing
areas of the sea. All these activities compete for space, common resource or lead to changes in functions
in such a way that their value for others decrease. Four subareas (Wadden Sea, Belgium EEZ, Dogger Bank
and Skagerrak) were selected so an in depth analysis could be performed. The results are integrated to
draw conclusions at the higher Southern North Sea scale again. This so called ‘nested approach’ ensures
detailed insights in the spatial management process (Figure 5).
15
Figure 5 North Sea case study with nested sub-case studies
2. The Pentland Firth and Orkney Waters case study is located to the far north of Scotland. One unique feature of the Orkney biotopes is the diversity and close proximity of many different marine habitats, from exposed wave swept inter-tidal zones, to areas of deep mud, from tidal rapids to maerl beds and saline lagoons. The area is especially noted for its seabird populations, marine mammals, organisms endemic to high energy marine environments and organisms at the southern or northern limits of their distribution. The most well established activities are shipping and fishing but the most important issue for marine planning is the emerging wave and tidal energy industry (see figure) with the potential to occupy large areas of marine space. The preparation of a non-statutory pilot Marine Spatial Plan is underway by Marine Scotland which will be succeeded by statutory plans drawn up in accordance with the provisions of the recent Marine (Scotland) Act 2010.The aim of this case study was to analyse and critique the process of the Pentland Firth and Orkney Waters pilot MSP as it is developed. A principal objective of the plan, and of government policy, is to facilitate the development of marine renewable energy and the study will focus on work to anticipate the as yet unknown impacts of these new activities and their conflicts with existing uses and users.
3. The Barents Sea is Europe’s last large, clean, and intact marine ecosystem. It is home to the world’s
largest cod and herring stocks (during their juvenile stage), numerous species of whales and seals, some
of the largest bird colonies in Europe (including puffin and cormorant) and the world’s biggest cold-water
coral reef. But is also a region with rapid industrial development. Increasing human activities such as oil
and gas exploration, shipping and aquaculture add to the impacts from fisheries, climate change and
increasing levels of toxic chemicals. They pose serious threats to the marine ecosystem and biodiversity.
In 2006 the Barents Sea Management Plan
was launched. This plan aims at sustainable
use of the ecosystem, within acceptable
levels of pollution, with reduced risk of
accidental spills, with sufficient capacity and
readiness to deal with accidents, and seafood
that is safe for consumption, while
safeguarding biodiversity. The plan provides
an overall framework for managing all human
activities (oil and gas industry, fishing and
shipping) in the area. This case study
assessed experiences from the development,
implementation and revision of the Barents
Sea Management Plan as valuable input to
MESMA. These experiences can facilitate
development of practical tools for sustainable
development in European seas through use
of spatial managed areas. MESMA can
provide valuable input to the next revision of
the Barents Sea Management Plan in 2015.
4. The Celtic Sea provides important habitats for a
number of bird and marine mammal species, as well as
other coastal and marine organisms. The wide variations
in coastal geography cause a large range of habitats, like
kelp forests, sea grass beds and cold-water corals. The
large range of habitats support a diverse fish fauna such as
herring and mackerel. In the Celtic Sea there is increasing
competition for ocean space. Initiatives have been started
to designate marine protected areas. There are also two
wind farms being planned. Fishermen feel that they are
increasingly being displaced from fishing grounds, due to
the allocation of ocean space for nature conservation and
offshore renewable energy development. This and other
developments create growing conflicts between the
different sectors that use the Celtic Sea. In this case study
several on-going initiatives were analysed and the
conflicts, challenges and good practices of marine spatial
management that emerged from these initiatives
assessed. This provided important information for the
MESMA framework, particularly in evaluating the key
governance/institutional issues that affect the
management effectiveness of spatial management.
5. The Basque continental shelf is located in the south eastern part of the Bay of Biscay, in the border
between France and Spain. This case study is considered representative of the eastern Atlantic area of the
MESMA study area. The area shows some specific characteristics in terms of biodiversity and marine
resources, but it also shares common human activities with other European regions. The Basque
continental shelf is small in extent but human activity is intense and diverse. It is characterised by holding
some specific (or nearly specific) economic activities such as red seaweed extraction Gelidium corneum.
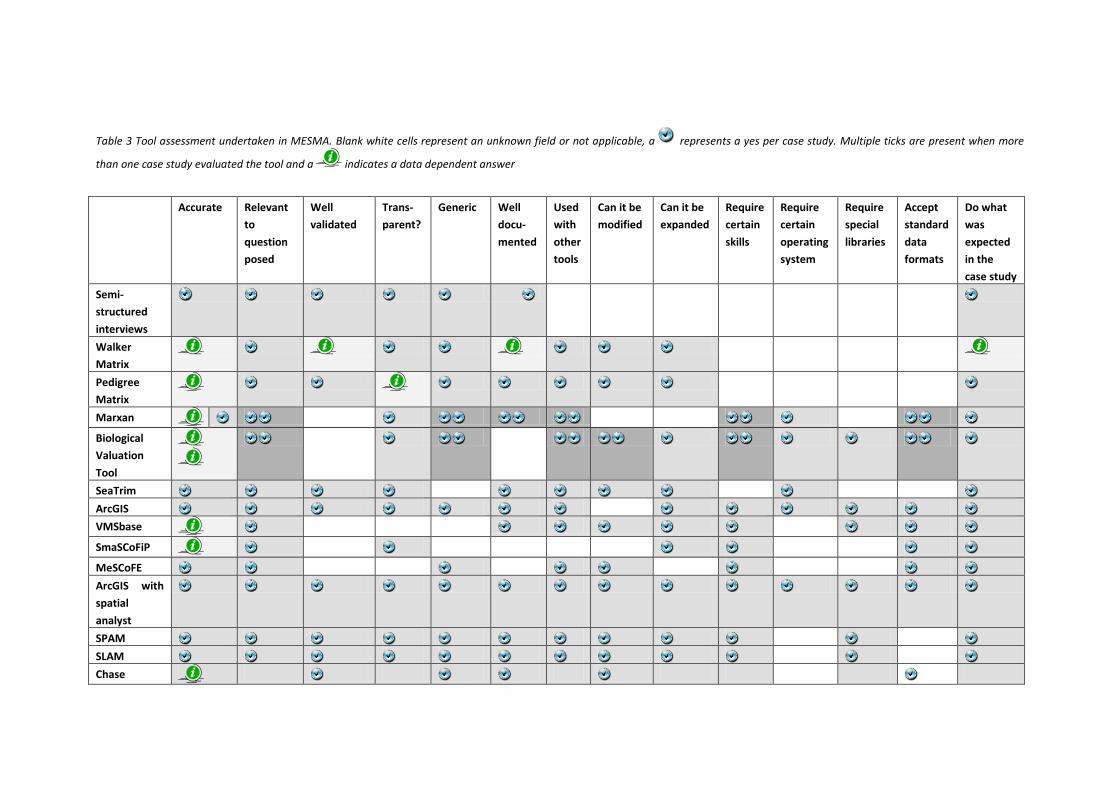
Table 3 Tool assessment undertaken in MESMA. Blank white cells represent an unknown field or not applicable, a represents a yes per case study. Multiple ticks are present when more
than one case study evaluated the tool and a indicates a data dependent answer
Accurate Relevant
to
question
posed
Well
validated
Trans-
parent?
Generic Well
docu-
mented
Used
with
other
tools
Can it be
modified
Can it be
expanded
Require
certain
skills
Require
certain
operating
system
Require
special
libraries
Accept
standard
data
formats
Do what
was
expected
in the
case study
Semi-
structured
interviews
Walker
Matrix
Pedigree
Matrix
Marxan
Biological
Valuation
Tool
SeaTrim ArcGIS VMSbase
SmaSCoFiP
MeSCoFE ArcGIS with
spatial
analyst
SPAM SLAM Chase
4 TOOLS DEVELOPED OR IMPROVED IN MESMA AND
RECOMMENDATIONS FOR IMPROVEMENTS
A number of tools are being developed or expanded through MESMA (Table 4), based on the
requirements identified by the case studies. Some have been identified by the case studies as necessary
for the evaluation and monitoring of a marine spatial plan in their study area. Others are more generic
and can be applied case-study wide. A description of these tools is provided in Cronin et al., 2012b.
Tool Name Institute Contact Person Existed
previously
E-Manual Deltares and CMRC Katherine Cronin No
SPAM DTU Aqua Thomas Kirk Sørensen Yes
Biological Valuation
Methodology
University of Gent Jan Van Yes
BEQI VLIz Kris Hostens Yes
Scenario analysis tools HWU Kate Johnson Yes
CHASE Tool NIVA Tore Hogaasen Yes
Methodological
guidelines for
governance analysis
University College
London
Peter Jones No
Sustainability Indicator
Tool
Senckenberg Sandra Voege No
Table 4 Tools developed through MESMA
4.1 E-manual
The E-MANUAL is a prototype tool that was developed as an electronic version of the analysis framework
(Stelzenmüller et al., 2010) by Deltares in the Netherlands and CMRC in Ireland. This enables a user to
step through the analysis framework electronically and on the web rather than in a static document. It
also aids ease of use by storing fields in a database and filling them in automatically in other tables. This
tool is part of the final MESMA product for marine spatial managers and scientists involved in the
evaluation and monitoring of spatially managed areas and is available at (http://mesma.ucc.ie/emanual/)
and through the MESMA Central Exchange.
The entire WP2 framework has been implemented in a PostGreSQL database, an open-source, object-
relational database system that runs on all operating systems, so that entries are connected and
recorded. An electronic version of the analysis framework was deemed necessary as many pieces of
information are duplicated and filling in the tables is labour intensive (Figure 6). With an electronic
version, parameters such as ecosystem components and pressures can be selected from predefined lists,
thus also improving consistency and reducing errors. It also allows for ease of update and allows multiple
entries to be compared.
Each framework ‘run’ will have a unique ID. Data can be entered for specific steps and incomplete records
recalled from the database at any time for editing. The database can also hold multiple runs for any case
of the installed packages can give full guarantee on compatibility with previous versions. However, the
working versions are documented and these versions will always be available for installation in the R
archives.
In short, the tool is freely accessible, fully documented and invites people to use, adapt and elaborate
upon in accordance with their own view on the optimal procedure for their data and study area (Figure 7).
Figure 7 Example of biological valuation maps of macrobenthos of the Belgian Part of the North Sea per
assessment question solved and final macrobenthos biological valuation map (based on Macrobel dataset)
4.3 SPAM
SPAM (Sandeel Population Analysis Model) was originally developed in 2007 to explore the possibility to
create short term high resolution fish stock forecasts for sedentary species (Figure 8). Since then the
model was developed further with added capabilities to support marine spatial planning, e.g. assess stock
impact scenarios (e.g. wind mills or MPAs (Christensen et al., 2009)) and alternative stock management
scenarios as well as future climate simulations, based on input from predicted future physical forcing
(Christensen et al., 2013). The incentive for focusing on a single species (presently sandeel) is that
biological interactions cannot be parameterized at this time with sufficiently certainty to support realistic
multistock models for marine ecosystems. The chances are bigger to build quasi-realistic single stock
models for stocks which can be considered indicative for ecosystem status.
The current major features of SPAM are:
High resolution (10 km) resolution of North Sea sandeel biomass dynamics based on a life cycle model
27
Stock recruitment computed spatially resolved from underlying physical and biological processes (Christensen et al., 2008)
Includes stock-density self-regulation effects
Includes multispecies interaction (predation pressure) and fishery effort as external drivers
Based on the previous work and experience with the model the following issues are identified as highly
important to expand/improve the SPAM model to provide cutting edge scientific decision support:
To implement higher temporal representation of intra annual processes, e.g. stock catch dynamics
Currently primitive schemes for data assimilation of catch and regional scale stock assessment are available; it would be desired to improve data assimilation methodologies
To include zooplankton variability coupling (larval survival and adult growth)
Currently fishery effort are supplied as and external driver (user set parameter). To achieve realistic scenario models it would be desired to make modelling of fishery effort reallocation more advanced, in response to fishing restrictions.
The model currently exists as a set of Python classes, which are applied from scripts reflecting whatever
one wishes to do with the model, e.g. run an alternative stock management scenario. These scripts setup
and run the model, and extracts whatever information is needed about the stock dynamics, and easily
connects to whatever plotting tools the user prefers, e.g. Matlab. The scripts are typically spawned from a
template and invoked from a command prompt, giving a high degree of functional flexibility.
The SPAM model was recently applied to assess the ecological consequences alternative N2000
designations (Goldsborough et al., 2013) by David Goldsborough, Thomas Kirk Sørensen and Asbjørn
Christensen. This case study tested and compared three proposed scenarios developed by members of
the North Sea Regional Advisory Council (NSRAC), and the effect of closing the whole Natura 2000 site.
The simulations were run with two options: without and with reallocation of displaced fishing effort.
Results show that the effect of all three scenarios without reallocation of fishing effort on the biomass of
sandeel is positive with up to approx. 3% increase in sandeel abundance on a North Sea scale. The NGOs’
proposal, which emphasises connectivity between areas, produces a biomass increase that is more than
twice that of the fishing sector’s scenario.
Currently a GUI (graphical user interface) is not available with the model. However, the screen shot shows
the typical usage of the SPAM model: the model application script in a text editor, the command prompt
where the script and data post processing are invoked ad hoc graphical plots invoked from the script,
displaying various aspects of the stock dynamics.
Figure 8 Examples of the SPAM model use
4.4 Uncertainty Analyses
The WP2 framework (Stelzenmüller et al., 2010) contains several structured steps and action points from
the scoping, gathering of data, analysis and extraction of recommendations for decision makers in marine
planning. Thus this technical ‘tool’ supports policy making. In this work, the typology of the uncertainties
at each step is mapped following the good practice described in Walker et al (2003) or van der Sluijs et al
(2004). At this workshop we aimed to move from a qualitative description of the typology of uncertainty
to the application of a pedigree matrix for most case studies.
The objectives of this workshop were to:
Further development of methods to characterize and quantify uncertainty of the MESMA framework
application outputs,
Develop a MESMA specific pedigree matrix
Scope for the development of tools and methods for uncertainty analysis and communication
Communication of uncertainty assessment (who will use this information and what does it mean for
the use of the assessment outputs)
Integration of uncertainty assessment in the e-manual
The aim of this methodological development was to characterise and quantify the uncertainty, emerging
also through structure and design of the framework. Therefore standardised tools were developed and
tested by the case studies.
29
When analysing uncertainty, the type and location of uncertainty should be identified first (see level 1 and
level 2 in Figure 9). To identify where uncertainties lie and communicate their presence to decision
makers, an uncertainty matrix was proposed by (Walker et al. 2003). This matrix enables a systematic
overview of the main features of uncertainty. Walker et al. (2003) distinguished three dimensions of
uncertainty: (i) location, (ii) level (i.e. range between deterministic knowledge and total ignorance), and
(iii) nature (i.e. whether it is due to imperfect knowledge or inherent system variability). The uncertainty
matrix developed by (Walker et al. 2003) was modified to represent the types of uncertainties
encountered when applying the framework for monitoring and evaluation of spatially managed areas
(Stelzenmüller et al. 2013).
Each case study described uncertainty associated with each action of the framework by eight descriptors
which characterised the uncertainty along the three dimensions (Walker at al. 2003). For each action the
variables that best described the uncertainty were given a score of 1 (presence), while those describing
uncertainty that was either absent or irrelevant for the purposes of the framework were scored as zero
(absence). For more details on how the analysis was performed and the results visualized see
Stelzenmüller et al., (2013).
After having characterised and explored the observed pattern of uncertainties within each step of the
assessment framework the next step was to describe and quantify uncertainty. Semi-quantitative
assessments of uncertainty as it is provided by the NUSAP (numerical, unit, spread, assessment, and
pedigree) system (Funtowicz & Ravetz 1990) are regarded as level 3 in Figure 9. NUSAP tools can assess
both qualitative and quantitative uncertainties. The general goal of these tools is to structure the critical
appraisal of the knowledge base. The method has been extended by adding expert judgment of reliability
(assessment) and systematic multi-criteria analysis of the production process (pedigree) (Van der Sluijs et
al. 2004). Thus here we focused on the pedigree matrix which was first introduced by (Funtowicz & Ravetz
1990) and which results in a semi-quantitative scoring of a number of qualitative criteria. We defined
therefore a pedigree matrix with eight semi-quantitative criteria to allow for an overall transparent
assessment of the uncertainty of the framework application and its respective outputs, by considering
those aspects of the framework which could compromise the reliability of the overall result (Funtowicz &
Ravetz 1990) (Table 3). The quality levels of the below described criteria have been scored by the case
studies with values ranging between 0 (low quality) and 4 (high quality). Thus we computed for each case
study the average score across the eight qualitative scores to express the relative overall confidence in
the particular framework assessment outputs. The specifications for each score are described further in
Stelzenmuller et al., (2013).
To compare and evaluate the actual average case study scores of the pedigree matrix Monte Carlo
simulations (MCS) were undertaken (Robert & Casella 2004) to generate a distribution of 10,000 possible
average scores derived from any pedigree matrix with eight criteria and a scoring scale from 0 to 4. More
precisely with this probabilistic analysis (see level 4 and beyond in Figure 9) we generated assumption-
free probability distributions by randomised resampling of the possible scores, allowing the quantification
of the probability of the actual average case study scores. For results see Stelzenmuller et al., (2013).
Figure 9 Different tools that may be used in an uncertainty analysis
4.5 Chase
The tool was developed specifically for establishing a baseline for the implementation of the Baltic Sea
Action Plan (BSAP) and to meet the requirements of the Marine Strategy Framework Directive (MSFD) to
establish good environmental status of marine waters. It has also been used in the HARMONY project in
the North Sea using data from Eionet. In both cases a large number of sites were included. The tool itself
is based on an Excel spreadsheet with formulas and VBA code that calculates the contamination ratio for
each substance and matrix (Figure 10).
The substances to use and their threshold values are chosen by the user, but it is preferable not to mix
threshold values from derived from different criteria, i.e. threshold values for food security and EAC’s
(Environmental Assessment Criteria). In the Baltic Sea some threshold values were taken from national
guidelines based on various criteria as well as EAC’s. In the North Sea only EAC’s from OSPAR were used.
In both cases the individual sites were aggregated to larger assessment units to enable an integrated
approach as biota, biomarkers and sediments are usually not sampled in exactly the same place. The
assessment units for coastal areas were smaller than those used for Open Sea units. The data are rather
heterogenous with respect to data quality, sampling frequency and the substances measured, and some
considerations should be given to temporal trends and spatial distribution as well as the representivity of
the data. An indication of “HIGH” status do not necessarily reflect reality as monitoring data for certain
substances can be missing (Figure 11).
Status for each matrix is calculated automatically as well as the final status. In the original
implementation, data had to be typed in by the user. However, in the North Sea, the process was
automated using VBA code to fill a spreadsheet for each site from a database table as well as to extract
the results to another table for plotting on maps and further evaluation. For single site evaluation or for a
small number of sites the first approach can be used. For larger datasets the automated approach is
preferable, however this has not been implemented into a distributable package. Another feature that is
recommended to be developed is the ability to produce a table that identifies the individual substances
and matrices that is causing the status to be Poor or Bad.
31
Figure 10 The CHASE spreadsheet
Figure 11 Final classification combining both the North Sea and the Baltic.
5 REFERENCES
Christensen, A., Mosegaard, H. & Jensen, H. (2009). Spatially resolved fish population analysis for
designing MPAs: influence on inside and neighbouring habitats. ICES Journal of Marine Science, 66, 5663.
Christensen, A., Butenschon, M., Gurkan, Z. & Allen, I.J. (2013). Towards an integrated forecasting system
for fisheries on habitat-bound stocks. Ocean Science, 9, 261-279. doi:10.5194/os-9-261-2013
Christensen, A., Jensen, H., Mosegaard, H., St. John, M. & Schrum, C., (2008). Sandeel (Ammodytes
marinus) larval transport patterns in the North Sea from an individual-based hydrodynamic egg and larval
model. Can. J. Fish. Aquat. Sci., 65, 1498-1511
Cronin, K., Lieberknect, L., Voege, S., Pipitone, C. & van der Meulen., (2012). An inventory of tools for