Deliverable 5.7 Fatal Accident Database Development and Analysis - Final Report Project co-financed by the European Commission, Directorate-General Transport and Energy Contract No: TREN-04-FP6TR-SI2.395465/506723 Acronym: SafetyNet Title: Building the European Road Safety Observatory Integrated Project, Thematic Priority 6.2 “Sustainable Surface Transport” Project Co-ordinator: Professor Pete Thomas Vehicle Safety Research Centre Ergonomics and Safety Research Institute Loughborough University Holywell Building Holywell Way Loughborough LE11 3UZ Organisation name of lead contractor for this deliverable: Vehicle Safety Research Centre, Loughborough University, UK Due Date of Deliverable: 31/10/2008 Submission Date: 06/01/2009 Report Author(s): S Reed, A Morris, VSRC Project Start Date: 1st May 2004 Duration: 4.5 years Project co-funded by the European Commission within the Sixth Framework Programme (2002 -2006) Dissemination Level PU Public x PP Restricted to other programme participants (inc. Commission Services) RE Restricted to group specified by consortium (inc. Commission Services) CO Confidential only for members of the consortium (inc. Commission Services)
Transcript
Deliverable 5.7 Fatal Accident Database Development and Analysis - Final Report
Project co-financed by the European Commission, Directorate-General Transport and Energy
Contract No: TREN-04-FP6TR-SI2.395465/506723 Acronym: SafetyNet Title: Building the European Road Safety Observatory Integrated Project, Thematic Priority 6.2 “Sustainable Surface Transport” Project Co-ordinator: Professor Pete Thomas Vehicle Safety Research Centre Ergonomics and Safety Research Institute Loughborough University Holywell Building Holywell Way Loughborough LE11 3UZ Organisation name of lead contractor for this deliverable: Vehicle Safety Research Centre, Loughborough University, UK Due Date of Deliverable: 31/10/2008 Submission Date: 06/01/2009 Report Author(s): S Reed, A Morris, VSRC Project Start Date: 1st May 2004 Duration: 4.5 years
Project co-funded by the European Commission within the Sixth Framework Programme (2002 -2006) Dissemination Level
PU Public x
PP Restricted to other programme participants (inc. Commission Services)
RE Restricted to group specified by consortium (inc. Commission Services)
CO Confidential only for members of the consortium (inc. Commission Services)
SafetyNet Deliverable 5.1, Fatal Accident Database Development and Analysis Report
Project co-financed by the European Commission, Directorate-General Transport and Energy
2.1 Project teams........................................................................................................ 3 3 Data collection methodology ................................................................... 4
3.1 Steps in Methodology Development ............................................................... 5 3.2 Development of Methodology – Determination of Protocol and Data Variables7
4 WP5 Task 1 Database ............................................................................... 8 5 Database pilot phase ................................................................................ 8 6 Case Example.......................................................................................... 10 7 Data collection in Participating Member States ................................... 13
France....................................................................................................... 13 The Netherlands........................................................................................ 14 Italy ........................................................................................................... 16 Finland ...................................................................................................... 17 Sweden ..................................................................................................... 19 United Kingdom......................................................................................... 21 Germany ................................................................................................... 23
7.1 Actual Sampling in Fatal Accident Database ................................................ 24 8 Results ..................................................................................................... 25
Description of the Database ..................................................................................... 25 Fatal Accidents - Basic Facts ................................................................................... 27 General Results Overview ........................................................................................ 33
9 Summary of Results................................................................................ 39 10 Discussion ............................................................................................... 43
SafetyNet Deliverable 5.1, Fatal Accident Database Development and Analysis Report
Project co-financed by the European Commission, Directorate-General Transport and Energy
Reed and Morris, WP5, 31st October 2008 Page 1
1 Introduction Task 5.1 of SafetyNet Work Package 5 is concerned with the development of a broad ranging, intermediate level Fatal Accident database. The information provided in the database represents a major advance in the knowledge of the nature and circumstances of fatal accidents within the EU. The information could be used as the basis for the development of countermeasures for fatal accidents within the EU - the data have been systematically collected according to defined sampling plans in participating Member States and hence the data are broadly representative of these Member States.
In the main, the data were derived from strictly factual police reports of fatal accident investigations although in certain cases, alternative sources of information were used including insurance investigation reports. The data recorded described the highway, vehicle and road-user factors to provide a description of the whole crash. The level of detail recorded was considerably greater than is currently obtainable in the CARE or CAREPLUS 2 specification. Approximately 100 – 150 variables with 500+ items of data were typically gathered for each accident investigated. Specific areas of data described the overall accident circumstances, driver and vehicle characteristics, specific road infrastructure features and descriptions of other crash participants.
A pilot and review activity took place before the main data collection phase commenced. During the main phase, the data were gathered and recorded onto a database which was specifically developed for WP5. The main data collection period involved collection of a representative sample of between 2% and 10% of the fatal crashes in each country (depending on the magnitude of the fatal accident population). In the end, 1298 fatal accident cases, involving at least 1 fatality per accident case were entered onto the database and subsequently analysed.
SafetyNet Deliverable 5.1, Fatal Accident Database Development and Analysis Report
2 Project Objectives Work Package 5 (WP5) officially commenced with the start of the SafetyNet IP on 1st May 2004. The aim (for the first 12 months) of the WP 5 Task 1 project was to develop the methodologies and protocols for an intermediate level fatal accident study, primarily directed to support road and vehicle safety policy.
The project was developed with close attention to the following objectives:
(a) To set up the building blocks for a continuous European process of fatal accident data collection, coding and analysis The main purpose of Task 5.1 was to build an effective data gathering structure, (involving all participating partners), to ensure that specific data on fatal crashes could be gathered in a systematic and routine manner. It was specified that the data should be collected in a number of EU member states using completely compatible methods although it was acknowledged that there would be slight variations between teams according to differences in local infrastructure. The data were recognised as being at an ‘intermediate’ level of detail (compared to CARE on the one hand and national in-depth studies on the other).
(b) To create a broad ranging, intermediate level, fatal accident database The data recorded described the environmental (including road infrastructure, e.g. crash barriers, road signs etc.), vehicle and road-user factors to provide a description of the whole crash (for example, similar to FARS and Stats19 databases). Approximately 100 – 150 variables in total for each case (accident/vehicle/ occupant/other records) were agreed by the partners as being ‘core data elements’ that could be collected by all. This included around 500 pieces of information per case. It should be stressed that the data were not selected according to a “lowest common denominator” approach; instead partners were challenged to gather a variety of information types. Additional interpretative information was also specified including a basic list of ‘events’ (essentially causation and contributory factors). Further information on the approach taken by the WP5 partnership is available through Deliverable D5.3: Fatal Data Methodology Development Report, SafetyNet, 2006. To support the concept of integrated datasets, variables that were common to both task 5.1 and 5.2 (of WP5) were identified and these are specified in the WP5 data glossary (Deliverable D5.5).
(c) To create an independent data set (collected by unbiased parties) Care was taken when interpreting information gathered from within the judicial process where the attribution of blame was a primary objective. Discussions within WP4 (Recommendations for Transparent and Independent Road Accident Investigations) have also demonstrated the importance of independence and transparency.
(d) To use the information collected to contribute knowledge and information relevant to road and vehicle safety policy at EU and national level It was recognised that data from the fatal accident study are required for a variety of reasons. First and foremost, the data are needed to provide the EC with data that can be used in decision making for road safety policy and
Project co-financed by the European Commission, Directorate-General Transport and Energy 2
SafetyNet Deliverable 5.1, Fatal Accident Database Development and Analysis Report
regulation. Therefore, some fundamental questions need to be addressed for example:
• Which road users are killed?
• What are the circumstances?
• What are the countermeasures?
It was recognised that the data could be used by a multitude of stakeholders in the road transport system but specifically road infrastructure experts, highway engineers and vehicles designers. It was intended that the data would be used to evaluate trends and to conduct inter-country comparisons where possible. There could be a link to national activities since most safety actions take place under subsidiary concerns.
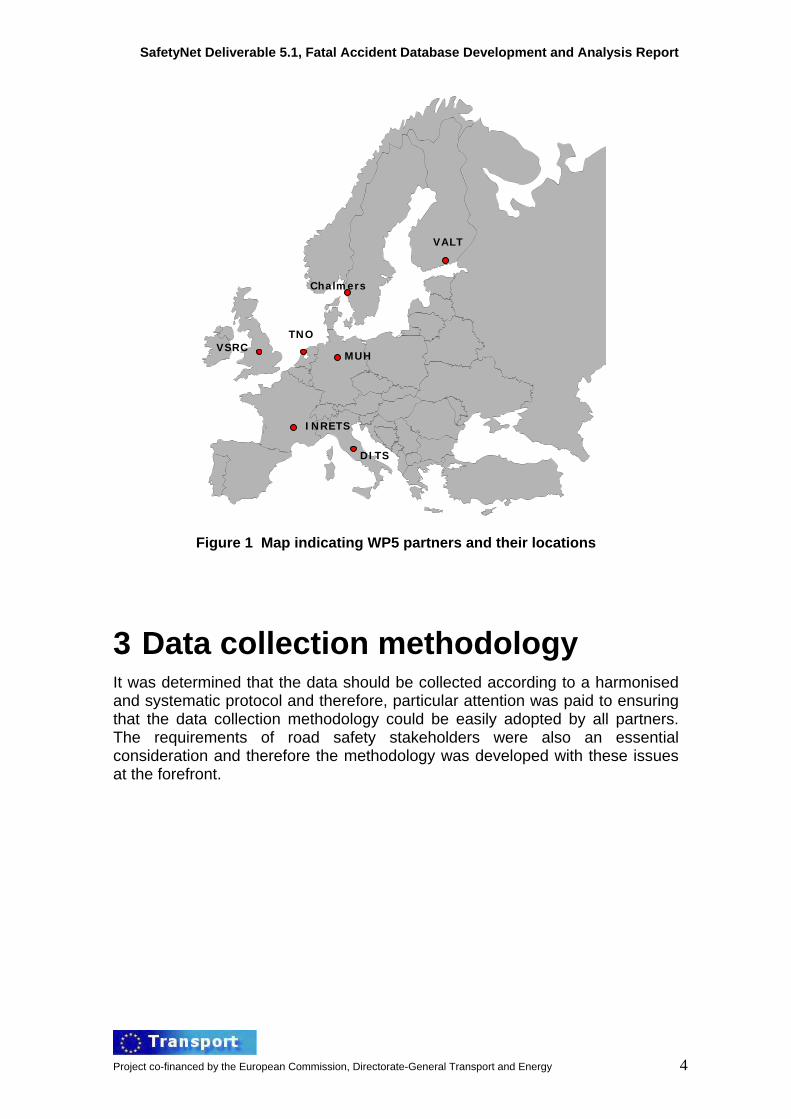
2.1 Project teams The data collection areas for the accidents will be from the countries with the largest fatality populations in Europe (Italy, France and Germany) as well as northern (Sweden, Finland) and middle European (UK, Netherlands) countries. Independent groups with no interest in commercial aspects of the study outcomes conducted data gathering and accident investigation activities. These are listed below and detailed in Figure 1: • Vehicle Safety Research Centre (VSRC), Loughborough University, UK (task
5.1 co-ordinators) • Netherlands Organisation for Applied Scientific Research (TNO), Delft,
Netherlands • Institut National de Recherche sur les Transports et leur Sécurité (INRETS),
Lyon, France • Chalmers University of Technology (Chalmers), Gothenburg, Sweden • Accident Research Unit at Medical University Hanover (ARU-MUH), Hanover,
Germany • The Finnish Motor Insurers’ Centre (VALT/FMIC), Helsinki, Finland • Department of “Idraulica, Trasporti, Strade”, University of Rome (DITS), Rome,
Italy
Project co-financed by the European Commission, Directorate-General Transport and Energy 3
SafetyNet Deliverable 5.1, Fatal Accident Database Development and Analysis Report
Project co-financed by the European Commission, Directorate-General Transport and Energy 4
Figure 1 Map indicating WP5 partners and their locations
3 Data collection methodology It was determined that the data should be collected according to a harmonised and systematic protocol and therefore, particular attention was paid to ensuring that the data collection methodology could be easily adopted by all partners. The requirements of road safety stakeholders were also an essential consideration and therefore the methodology was developed with these issues at the forefront.
Chalmers
INRETS
MUH VSRC TNO
VALT
DITS
SafetyNet Deliverable 5.1, Fatal Accident Database Development and Analysis Report
3.1 Steps in Methodology Development The following processes were used in the development of the methodology used in task 5.1; (a) Workshop on data requirements A workshop was held in October 2004 entitled “Establishing Requirements for a New European In-Depth Accident Causation Database”. The aim of this workshop was to provide the future users of accident data the opportunity to feed into the process of identifying general and specific research and policy questions which future accident databases will be expected to address. This process was useful for both Task 1 and Task 2 of WP5. A report was produced to summarise the workshop which focussed on the issues raised during the workshop session on the general and specific requirements for accident causation information and the subsequent feedback session on this topic. The nature of the issues that arose could be divided into 8 categories (information domains), which included:
As may be expected there was some overlap in the questioning that was suggested for each information domain, due to differences in the workshop participants’ understanding and pre-conception of the definition of each. Inter-domain relationships were also of interest. The feedback from the workshop has been constantly referred to whilst developing the data variables to ensure consistency with user needs.
(b) Consultation of National Experts Data requirements were also sought from National Experts in the EU Member States. Information and background on WP5 was presented to the National Experts in November 2004 and their feedback requested on data needs and requirements according to the nature of the project. All feedback was taken on board during the variable development process.
(c) Research questions to ask of the data Research questions to ask of the data were discussed by the WP5 partners and were summarised into three main categories as detailed below.
General
• What kinds of vehicles are involved in fatal accidents (age, type)? • What kinds of features in road infrastructure are involved in consequences
of fatal accidents (trees, guide rails, poles…)?
Project co-financed by the European Commission, Directorate-General Transport and Energy 5
SafetyNet Deliverable 5.1, Fatal Accident Database Development and Analysis Report
• What kinds of features in road infrastructure are involved in fatal accidents (lane arrangements, speed limits)?
• Which type of roads are fatal accidents most commonly occurring on? • Which gender/age is more likely to be killed in fatal accidents? • Which hours (or day period) are the most dangerous in terms of number of
fatal accidents? • Questions on the age and model of cars that CARE can’t answer. • Were there any technical vehicle breakdowns before the crash? • Were there visibility limitations that could prevent laser, radar or
positioning (e.g. GPS) systems to work? Design improvements/countermeasures
• Which fatal accidents can we do something about technically (vehicle or road infrastructure)?
• Which protective measures have the highest benefit for reducing fatal accidents?
• What type of countermeasures could save lives? • Dependent on results of vehicles involved, systems and regulations should
be developed for specific road users. • Dependent on results of accident manoeuvre information, we should be
able to determine which detection systems/assistance are needed. • Which barriers were broken before the accident? It should answer which
driver assisting equipment should be developed (red light detector, lane departure, etc.).
Outcome factors
• Which “accident type” (e.g. single vehicle-, meeting-, cross-section accident etc.) is most commonly fatal?
• Which “collision type” (e.g. frontal-, side-, rear end collision or roll over) is most commonly fatal?
• What are the most common causes of fatal accidents? (situation, environment, alcohol etc.)
• How do weather conditions affect road accidents?
Project co-financed by the European Commission, Directorate-General Transport and Energy 6
SafetyNet Deliverable 5.1, Fatal Accident Database Development and Analysis Report
3.2 Development of Methodology – Determination of Protocol and Data Variables
To start this process, a review of the existing procedures and protocols in EU Member States and the US was undertaken to ensure that the project would benefit from best practices. Existing procedures and protocols that were examined in detail included the UK Cooperative Crash Injury Study (CCIS), the UK On-the-Spot Project (OTS), the German In-Depth Accident Study (GIDAS), the US Fatal Accident Reporting System (FARS), and the Swedish Factors Influencing the Causation of Accidents and Incidents project (FICA).
An initial data variable list was produced containing 1138 variables. This was initially reviewed by the VSRC and exclusions were made for variables that were outside the project objectives, e.g. injury related criteria. After close examination of the remaining 193 potential data variables, a provisional variable compilation list ensued.
In order to determine which variables should be collected in the database, each variable was discussed in turn under the main headings of accident level, roadway level, vehicle level, and road user level. WP5 partners reviewed the provisional variable list during email circulation and at the technical meetings.
Each variable on the list was reviewed by each partner against specific questions. These included:
• Is the definition of each data variable suitable? • Would collecting this data variable contribute usefully to the aims and
objectives of the project and therefore is it deemed necessary to collect the data variable?
• Can the data variable be collected with respect to the determined definition?
• What is the expected reliability of the proposed data variable? • What proportion of cases (per partner) could this data variable be
gathered for?
The decision was made that if the proportion of cases for a data variable was less than 30% for all partners in total, then the WP5.1 partners would consider removing the variable concerned. Additionally, if the number of positive partner responses for collecting the data variable was less than 50%, then careful deliberation needed to be given as to whether the variable was to be retained on the prospective list or not.
Each ‘potential’ variable that had not already been agreed upon was discussed. This process included discussion for each variable’s inclusion and definition, and partners’ comments regarding possible problems with the collection of particular variables.
The list received numerous iterations for which numerous revisiting of the WP5 objectives was necessary. The needs of the data users as well partners’
Project co-financed by the European Commission, Directorate-General Transport and Energy 7
SafetyNet Deliverable 5.1, Fatal Accident Database Development and Analysis Report
comments regarding possible problems with particular variables were also taken into account.
After preparation of the final variable list, the preparation of the glossary and database commenced.
4 WP5 Task 1 Database A project database was developed (for both task 5.2 and task 5.1 of WP5) which links together the human, vehicle and environmental data collected for each accident. The SafetyNet WP5 Database system consists of a software application written in Visual Basic for Application (VBA) completely embedded inside a Microsoft Access 2003 Data Base Management System (DBMS). The application contains two completely separate parts that have the same structure with regards to user interface forms and database tables and relationships: these are known as the Input Application (IA) and the Output Application (OA). Using the IA, each partner could insert and modify data, images and pictures. Using the OA, it is now possible to view accidents data and images inserted by all partners participating in the project. The IA is a local application that works offline during the data entry and editing, as well as the Output Application during the road accidents browsing. When data transferring is requested, the Input Application and the Output Application can connect to the central server through a Secure File Transfer Protocol (SFTP). A central database implemented on a MySQL Server DBMS has been created with databases structures similar to the ones of IA and OA. This database collects all road accidents information inserted from different partners in local Microsoft Access databases. The central server is equipped with backup and redundancy mechanisms to ensure a secure data storage. The last release of the application is v.2.1. Further information regarding the database can be obtained form the WP5 Data Glossary (SafetyNet Deliverable D5.5).
5 Database pilot phase While the database was in construction it was necessary to devise a test program. This Database Pilot Phase was designed to thoroughly explore the
Project co-financed by the European Commission, Directorate-General Transport and Energy 8
SafetyNet Deliverable 5.1, Fatal Accident Database Development and Analysis Report
database and find areas where possible improvement or refinement was necessary.
The pilot phase provided the partners with an opportunity to test all the processes that had been developed during the previous months. This method involved an amount of data collection, data input and a thorough test of the database as a whole. These actions were all recorded and discussed at a technical meeting before any changes to the database were agreed.
The partners were required to collect a minimum of 5 cases each from the relevant authorities resulting in a minimum of 35 cases for the pilot. This number was felt sufficient to enable the 5.1 partners to further develop and streamline the database. This amount of cases also allowed the group to ‘iron out’ any problems with the database at an early stage.
When reviewing the database content it was important to examine it from a number of perspectives. This was completed through a detailed case review of the 5 cases with the aim to gain an understanding of the accident without the original accident report. Additionally an in-depth review of one randomly selected case was completed which closely examined the variables and coding issues both in the database and between partners. This amount of cases also allowed the group to ‘iron out’ any problems with the database at an early stage.
The initial results and comments generated from this process were recorded and discussed between the 5.1 partners at a technical meeting in Delft, The Netherlands in March 2006.
The pilot phase of task 5.1 was an essential test of functionality of the prototype database. As this was to be a test-bed for the full data collection task it was decided to use actual fatal accident cases.
Each partner was required to collect a minimum of 5 cases from the relevant authorities resulting in a minimum of 35 cases for the pilot. This number was felt sufficient to enable the 5.1 partners to further develop and streamline the database. This amount of cases also allowed the group to ‘iron out’ any problems with the database at an early stage.
Cases for the pilot study were selected on a case-by-case basis to include a broad range of road users and accident types. This was important as it allowed the database capabilities to be fully exploited.
The case collection for full scale data input was based on a representative sample. This method was designed to ensure the validity of analysis and results from across Europe. Further to the physical process of entering fatal cases onto the pilot database it was important to review the information gathered from the technical discussions. This information provided the 5.1 group with a direct way of feeding back useful data into the database development process.
Project co-financed by the European Commission, Directorate-General Transport and Energy 9
SafetyNet Deliverable 5.1, Fatal Accident Database Development and Analysis Report
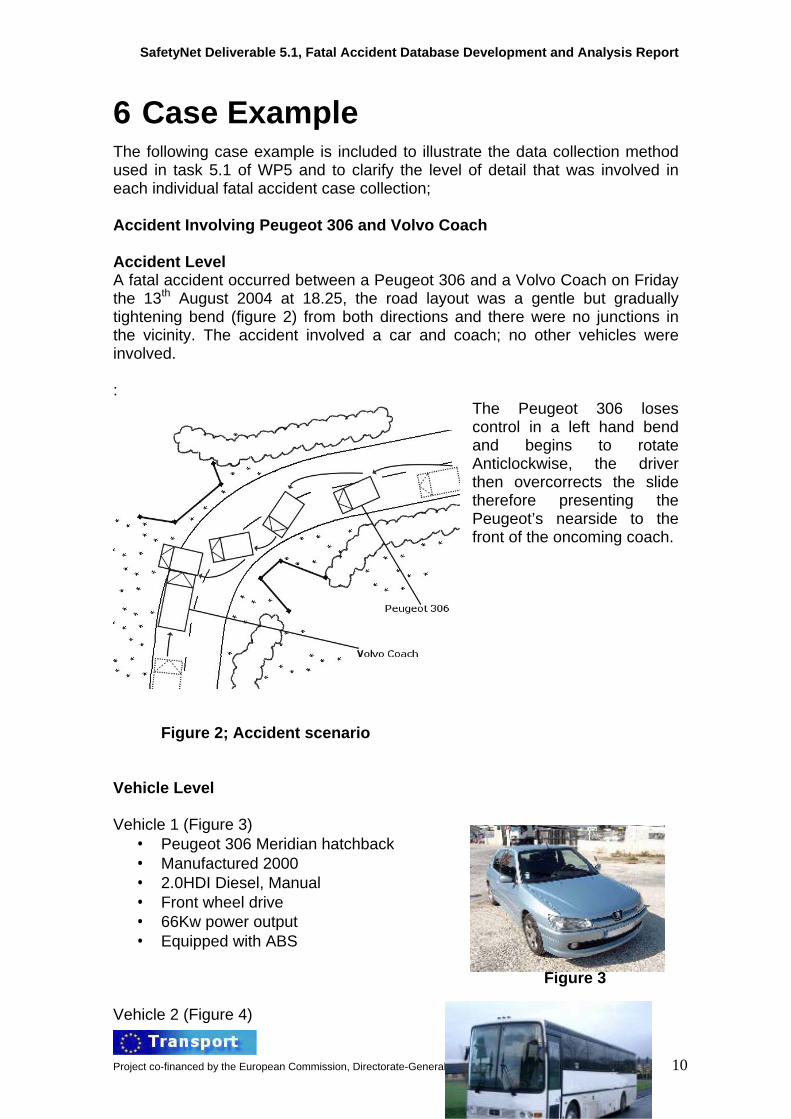
6 Case Example The following case example is included to illustrate the data collection method used in task 5.1 of WP5 and to clarify the level of detail that was involved in each individual fatal accident case collection; Accident Involving Peugeot 306 and Volvo Coach Accident Level A fatal accident occurred between a Peugeot 306 and a Volvo Coach on Friday the 13th August 2004 at 18.25, the road layout was a gentle but gradually tightening bend (figure 2) from both directions and there were no junctions in the vicinity. The accident involved a car and coach; no other vehicles were involved. :
The Peugeot 306 loses control in a left hand bend and begins to rotate Anticlockwise, the driver then overcorrects the slide therefore presenting the Peugeot’s nearside to the front of the oncoming coach.
Figure 2; Accident scenario
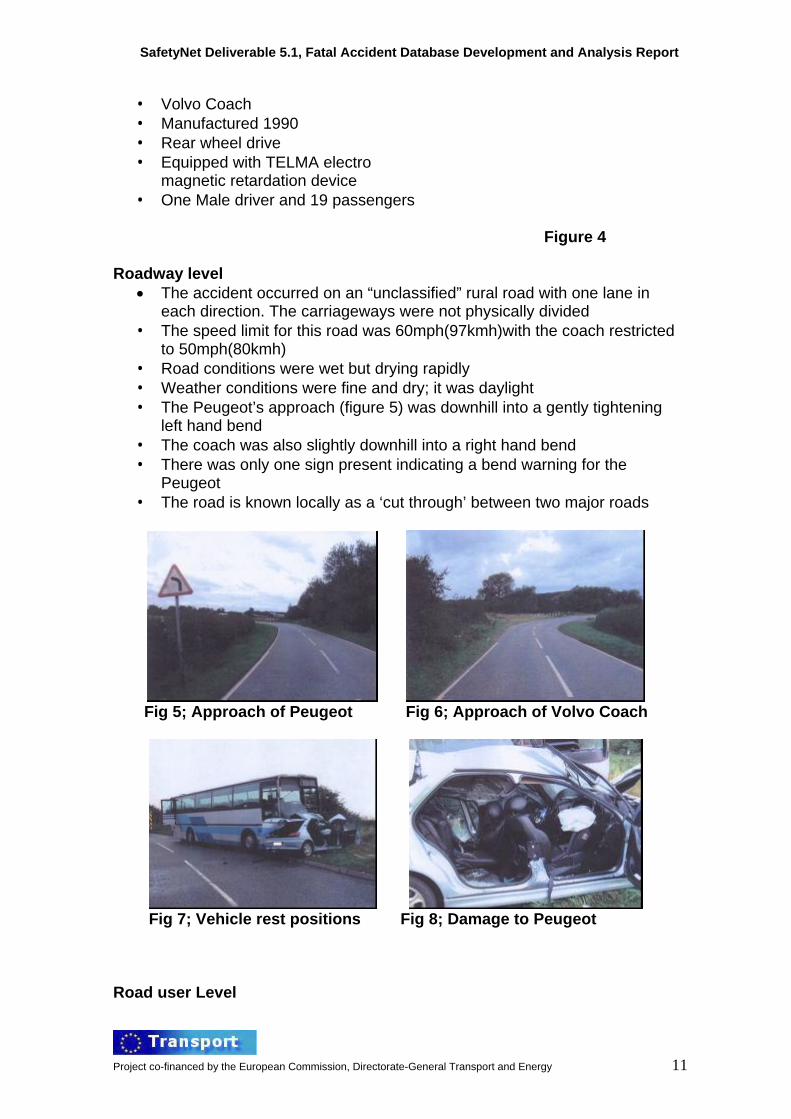
Vehicle Level Vehicle 1 (Figure 3)
• Peugeot 306 Meridian hatchback • Manufactured 2000 • 2.0HDI Diesel, Manual • Front wheel drive • 66Kw power output • Equipped with ABS
Figure 3
Vehicle 2 (Figure 4)
Project co-financed by the European Commission, Directorate-General Transport and Energy 10
SafetyNet Deliverable 5.1, Fatal Accident Database Development and Analysis Report
magnetic retardation device • One Male driver and 19 passengers
Figure 4
Roadway level
• The accident occurred on an “unclassified” rural road with one lane in each direction. The carriageways were not physically divided
• The speed limit for this road was 60mph(97kmh)with the coach restricted to 50mph(80kmh)
• Road conditions were wet but drying rapidly • Weather conditions were fine and dry; it was daylight • The Peugeot’s approach (figure 5) was downhill into a gently tightening
left hand bend • The coach was also slightly downhill into a right hand bend • There was only one sign present indicating a bend warning for the
Peugeot • The road is known locally as a ‘cut through’ between two major roads
Fig 5; Approach of Peugeot Fig 6; Approach of Volvo Coach
Fig 7; Vehicle rest positions Fig 8; Damage to Peugeot Road user Level
Project co-financed by the European Commission, Directorate-General Transport and Energy 11
SafetyNet Deliverable 5.1, Fatal Accident Database Development and Analysis Report
Driver Vehicle 1 o The driver of the Peugeot 306 was a 29 year old female. She was
a resident of the country but it is unclear whether she was familiar with the road.
o The driver was wearing a seat belt and the steering wheel hub airbag was deployed along with the struck-side seat back airbag.
o The body area most heavily injured was the head; she died in hospital on the 20th August 2004, 8 days after the accident.
Driver Vehicle 1
o The driver of the Volvo coach was a 40 year old male who was also a resident of the country; again it is unclear whether he was familiar with the road.
o The driver of the coach, as indicated by the onboard tachograph, braked initially when he saw the Peugeot out of control; he then applied the TELMA system in an attempt to avoid the collision.
o The driver was wearing his seatbelt but the coach was not equipped with any airbags. Neither the driver, nor any of the 19 passengers, sustained any injuries apart from shock.
Additional information Through the police vehicle examination it became clear that the Peugeot 306 had new rear pads and disks fitted earlier in the day; this could possibly be determined as a vehicle defect. From witness statements and most importantly the statement from the first witness at the scene, it became clear that an unlit cigarette and lighter was found on the Peugeot drivers lap. This could have been a distraction or causative issue. After the accident the signing and road surface was also renewed and this could have been a factor in the accident considering the minimal signage and the state of the road surface (drying after rain).
Project co-financed by the European Commission, Directorate-General Transport and Energy 12
SafetyNet Deliverable 5.1, Fatal Accident Database Development and Analysis Report
7 Data collection in Participating Member States
The data collection infrastructure for each of the different partners is detailed in this section.
France Description of the area from which the partner collected data; The data collection area was the whole of France. INRETS had access to all fatal accident police reports (les procès verbaux).
The sampling methodology (including an explanation of the representivity): In order to ensure a more representative sample a two stage stratified sampling technique was carried out to select the sample of 140 road accidents. The total French fatality data was first grouped by type of road user fatality (car occupant, 2 wheeled motor vehicle-users, pedestrian, cyclist, lorry driver and others) and each road user category was then stratified by the type of road class where the accident took place. The table below shows the population stratified by road user fatality and road class.
Table 1 Cross tabulation of road user fatality and road class, France The next step was to devise a sampling plan. The sample size of 140 accidents was equivalent to 2.7% of the population therefore the number selected from each sub-group was also roughly equal 2.7% of the population sub-group. For example there were 230 car occupant fatalities on motorways; therefore in the sample there were 6 of this type of accident studied in detail. The table below shows the sampling plan that was used.
SafetyNet Deliverable 5.1, Fatal Accident Database Development and Analysis Report
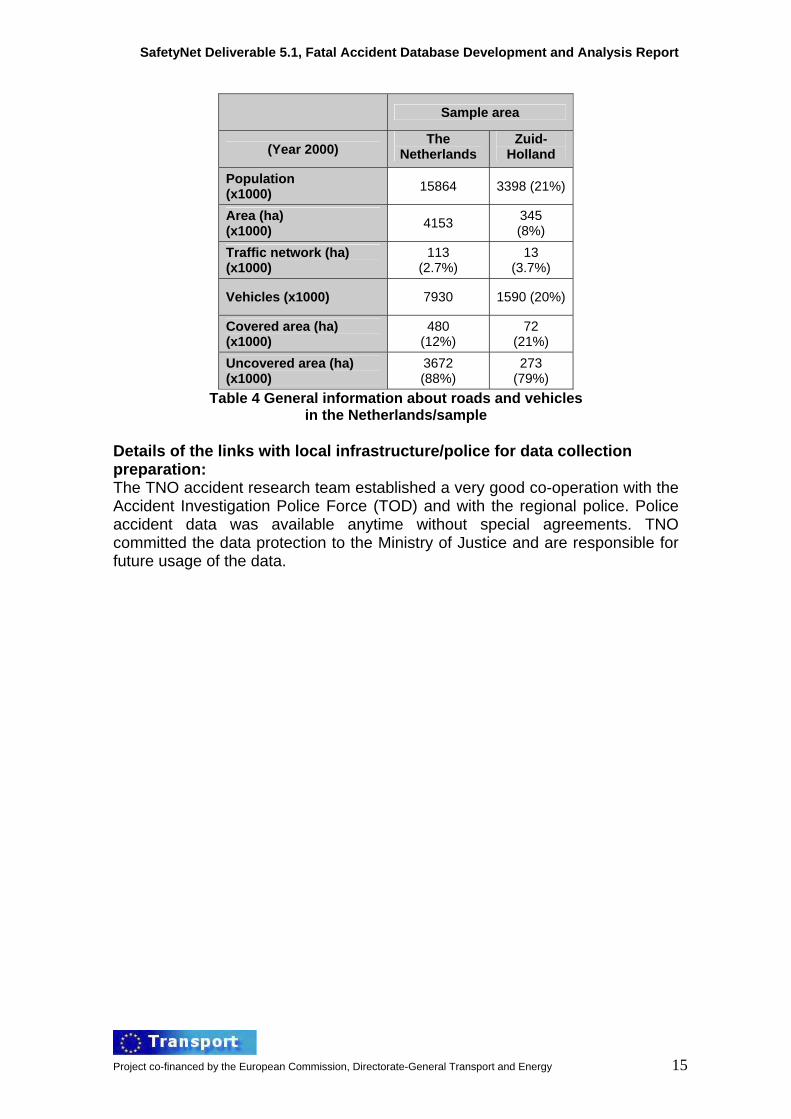
The Netherlands Description of the area from which the partner collected data TNO operated in the area Zuid-Holland (or so-called province Zuid-Holland). This province is split up into 4 regions: Rotterdam-Rijnmond, Haaglanden, Hollands Midden en Zuid-Holland Zuid. The area covers 344575 ha from which 13086 ha are meant for traffic use. 21% of the total surface is built or paved.
The sampling methodology (including an explanation of the representivity): TNO collected fatal accidents, which are investigated by the four accident investigation police groups TOD (representing each of the four regions). In particular, TNO co-operated with the Rotterdam-Rijnmond police force. This followed previous successful cooperation on similar kind of work conducted by the TNO team.
The “traffic participant”, “road type” and “month of the year” were the sampling criteria and the percentage of collected accidents per category (fulfilling those criteria) was based on the national data for the whole Netherlands.
The tables below show the national figures of different parameters (accident severity, size of the area, population and vehicle fleet) for both Zuid-Holland and The Netherlands in total.
In general it can be concluded that the province Zuid-Holland is representative to the national figures. As far as the accident severity is concerned, some under- or over-representation can be observed for the group of slight injured of the province with respect to the national figures.
A small difference can also be seen between the percentage of the provincial covered area and the national one.
Severity (2001-2003)
Light injured
Trans. to hospital
Hospita-lised Fatalities Total
Netherlands 52398 (42%)
36436 (30%)
32643 (26%)
3008 (2%) 124476
Zuid- Holland 8233 (35%)
9921 (41%)
5179 (22%)
417 (2%)
23750 (19%)
Table 3 Accident severity in Netherlands/Holland
Project co-financed by the European Commission, Directorate-General Transport and Energy 14
SafetyNet Deliverable 5.1, Fatal Accident Database Development and Analysis Report
Sample area
(Year 2000) The
Netherlands Zuid-
Holland
Population (x1000) 15864 3398 (21%)
Area (ha) (x1000) 4153 345
(8%) Traffic network (ha) (x1000)
113 (2.7%)
13 (3.7%)
Vehicles (x1000) 7930 1590 (20%)
Covered area (ha) (x1000)
480 (12%)
72 (21%)
Uncovered area (ha) (x1000)
3672 (88%)
273 (79%)
Table 4 General information about roads and vehicles in the Netherlands/sample
Details of the links with local infrastructure/police for data collection preparation: The TNO accident research team established a very good co-operation with the Accident Investigation Police Force (TOD) and with the regional police. Police accident data was available anytime without special agreements. TNO committed the data protection to the Ministry of Justice and are responsible for future usage of the data.
Project co-financed by the European Commission, Directorate-General Transport and Energy 15
SafetyNet Deliverable 5.1, Fatal Accident Database Development and Analysis Report
Italy Description of the area from which the partner collected data The data collection area that was used to collect the target number of accidents (480) was the whole country.
The sampling methodology (including an explanation of the representivity): A preliminary analysis was carried out on three different data sources (national statistical report, police report and insurance report) in order to determine the most suitable data source in terms of data availability and reliability. Results showed that insurance report was the most suitable data source.
All the reports were therefore provided by an insurance company (with approximately the 4% of the whole national market). It was decided that nationwide coverage by this company would guarantee data representativity.
The reference period to reach the target number of 480 fatal accidents was estimated to be 15 – 24 months.
Details of the links with local infrastructure/police for data collection preparation: Links with the involved insurance company were established early on in the project and were maintained throughout.
Any problems or concerns that have arisen: The links with the Insurance Company involved very delicate negotiations - especially issues concerning data dissemination.
Project co-financed by the European Commission, Directorate-General Transport and Energy 16
SafetyNet Deliverable 5.1, Fatal Accident Database Development and Analysis Report
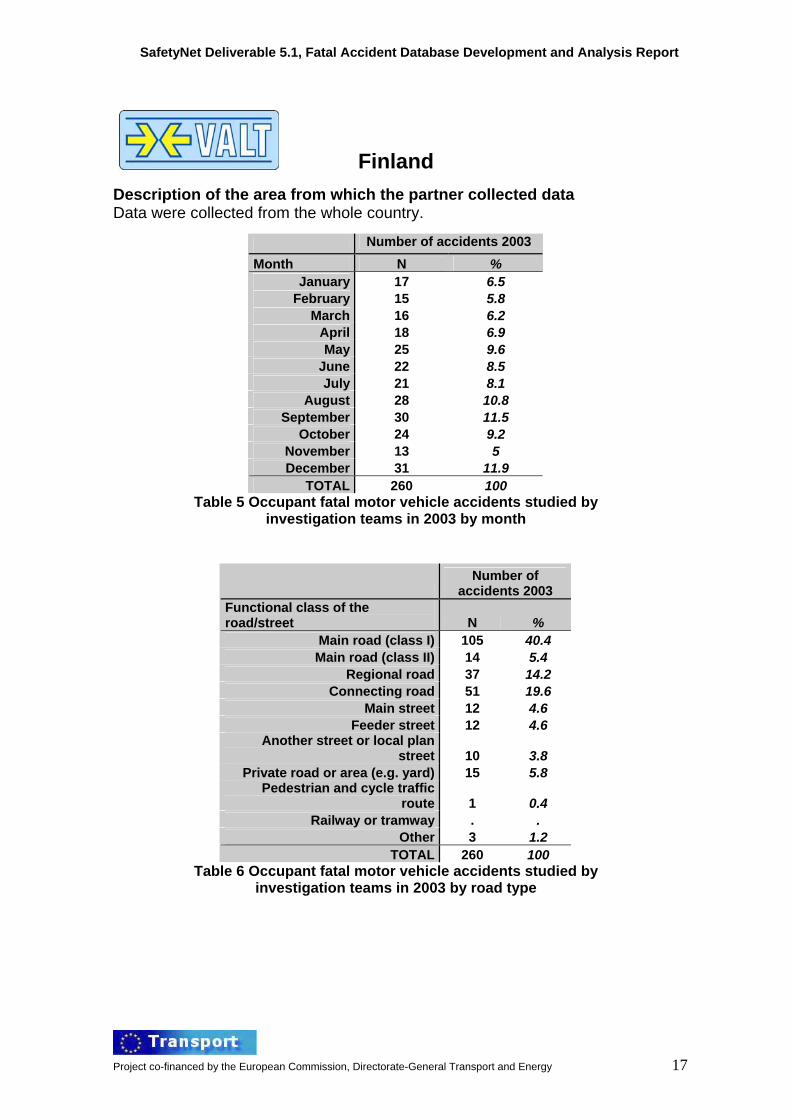
Finland Description of the area from which the partner collected data Data were collected from the whole country.
Number of accidents 2003 Month N %
January 17 6.5 February 15 5.8
March 16 6.2 April 18 6.9 May 25 9.6
June 22 8.5 July 21 8.1
August 28 10.8 September 30 11.5
October 24 9.2 November 13 5 December 31 11.9
TOTAL 260 100 Table 5 Occupant fatal motor vehicle accidents studied by
investigation teams in 2003 by month
Number of
accidents 2003 Functional class of the road/street N %
Main road (class I) 105 40.4 Main road (class II) 14 5.4
Regional road 37 14.2 Connecting road 51 19.6
Main street 12 4.6 Feeder street 12 4.6
Another street or local plan street 10 3.8
Private road or area (e.g. yard) 15 5.8 Pedestrian and cycle traffic
route 1 0.4 Railway or tramway . .
Other 3 1.2 TOTAL 260 100
Table 6 Occupant fatal motor vehicle accidents studied by investigation teams in 2003 by road type
Project co-financed by the European Commission, Directorate-General Transport and Energy 17
SafetyNet Deliverable 5.1, Fatal Accident Database Development and Analysis Report
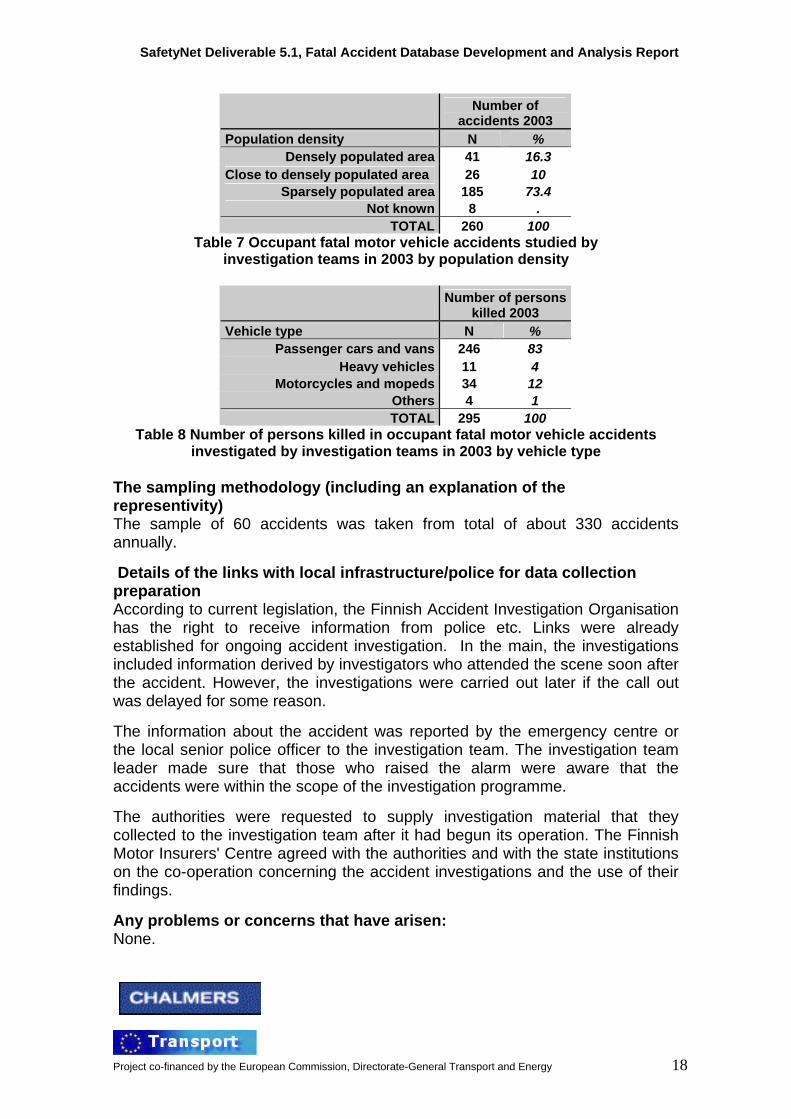
Number of
accidents 2003 Population density N %
Densely populated area 41 16.3 Close to densely populated area 26 10
Sparsely populated area 185 73.4 Not known 8 .
TOTAL 260 100 Table 7 Occupant fatal motor vehicle accidents studied by
investigation teams in 2003 by population density
Number of persons
killed 2003 Vehicle type N %
Passenger cars and vans 246 83 Heavy vehicles 11 4
Motorcycles and mopeds 34 12 Others 4 1 TOTAL 295 100
Table 8 Number of persons killed in occupant fatal motor vehicle accidents investigated by investigation teams in 2003 by vehicle type
The sampling methodology (including an explanation of the representivity) The sample of 60 accidents was taken from total of about 330 accidents annually.
Details of the links with local infrastructure/police for data collection preparation According to current legislation, the Finnish Accident Investigation Organisation has the right to receive information from police etc. Links were already established for ongoing accident investigation. In the main, the investigations included information derived by investigators who attended the scene soon after the accident. However, the investigations were carried out later if the call out was delayed for some reason.
The information about the accident was reported by the emergency centre or the local senior police officer to the investigation team. The investigation team leader made sure that those who raised the alarm were aware that the accidents were within the scope of the investigation programme.
The authorities were requested to supply investigation material that they collected to the investigation team after it had begun its operation. The Finnish Motor Insurers' Centre agreed with the authorities and with the state institutions on the co-operation concerning the accident investigations and the use of their findings.
Any problems or concerns that have arisen: None.
Project co-financed by the European Commission, Directorate-General Transport and Energy 18
SafetyNet Deliverable 5.1, Fatal Accident Database Development and Analysis Report
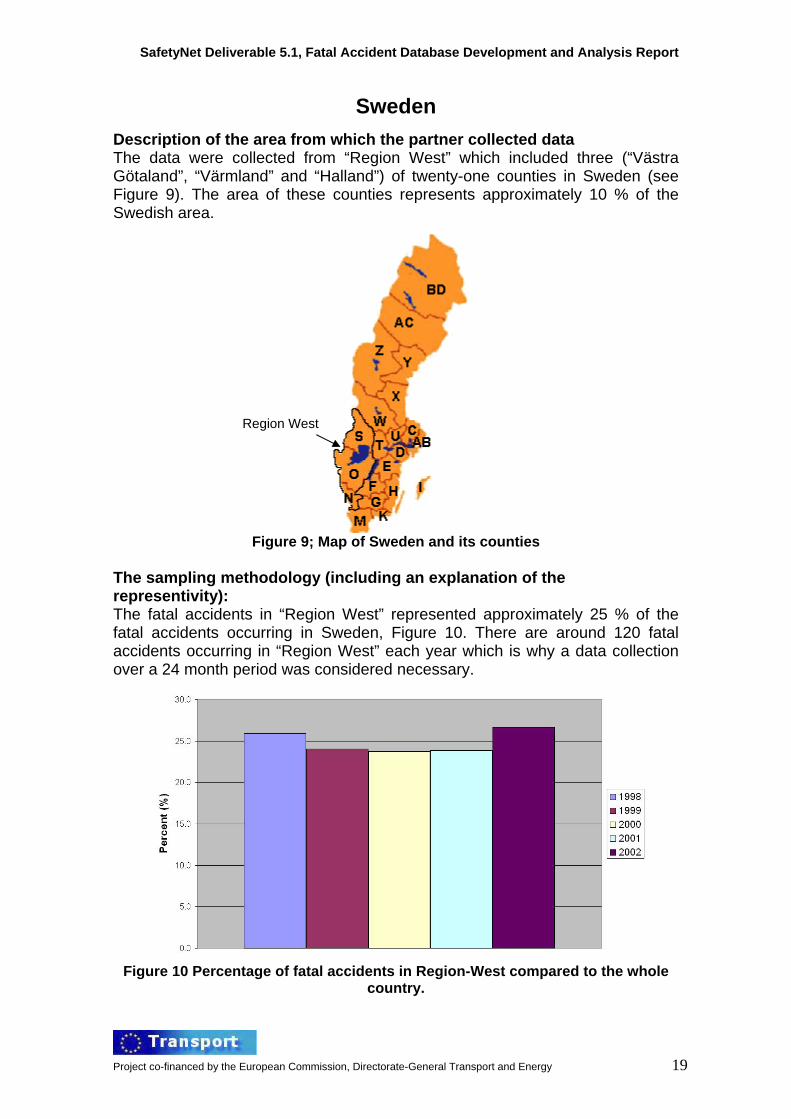
Sweden Description of the area from which the partner collected data The data were collected from “Region West” which included three (“Västra Götaland”, “Värmland” and “Halland”) of twenty-one counties in Sweden (see Figure 9). The area of these counties represents approximately 10 % of the Swedish area.
Region West
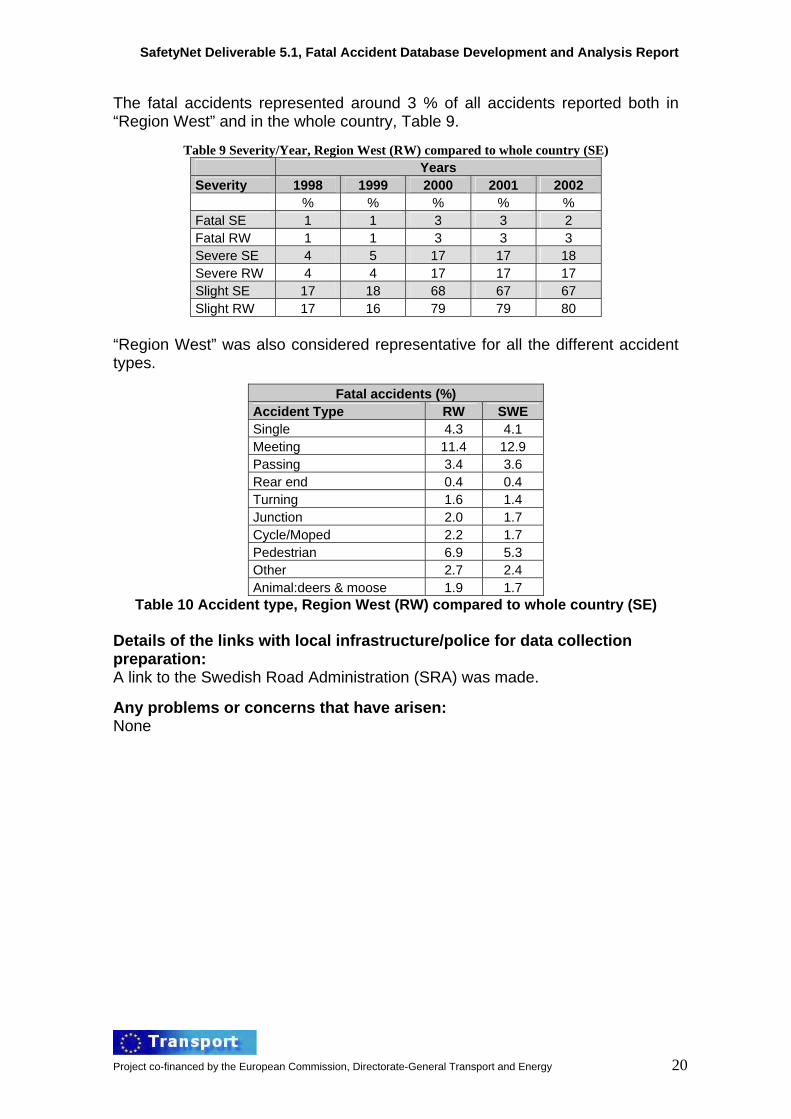
Figure 9; Map of Sweden and its counties The sampling methodology (including an explanation of the representivity): The fatal accidents in “Region West” represented approximately 25 % of the fatal accidents occurring in Sweden, Figure 10. There are around 120 fatal accidents occurring in “Region West” each year which is why a data collection over a 24 month period was considered necessary.
Figure 10 Percentage of fatal accidents in Region-West compared to the whole
country.
Project co-financed by the European Commission, Directorate-General Transport and Energy 19
SafetyNet Deliverable 5.1, Fatal Accident Database Development and Analysis Report
The fatal accidents represented around 3 % of all accidents reported both in “Region West” and in the whole country, Table 9.
Table 9 Severity/Year, Region West (RW) compared to whole country (SE) Years Severity 1998 1999 2000 2001 2002 % % % % % Fatal SE 1 1 3 3 2 Fatal RW 1 1 3 3 3 Severe SE 4 5 17 17 18 Severe RW 4 4 17 17 17 Slight SE 17 18 68 67 67 Slight RW 17 16 79 79 80
“Region West” was also considered representative for all the different accident types.
Fatal accidents (%) Accident Type RW SWE Single 4.3 4.1 Meeting 11.4 12.9 Passing 3.4 3.6 Rear end 0.4 0.4 Turning 1.6 1.4 Junction 2.0 1.7 Cycle/Moped 2.2 1.7 Pedestrian 6.9 5.3 Other 2.7 2.4 Animal:deers & moose 1.9 1.7
Table 10 Accident type, Region West (RW) compared to whole country (SE) Details of the links with local infrastructure/police for data collection preparation: A link to the Swedish Road Administration (SRA) was made.
Any problems or concerns that have arisen: None
Project co-financed by the European Commission, Directorate-General Transport and Energy 20
SafetyNet Deliverable 5.1, Fatal Accident Database Development and Analysis Report
United Kingdom
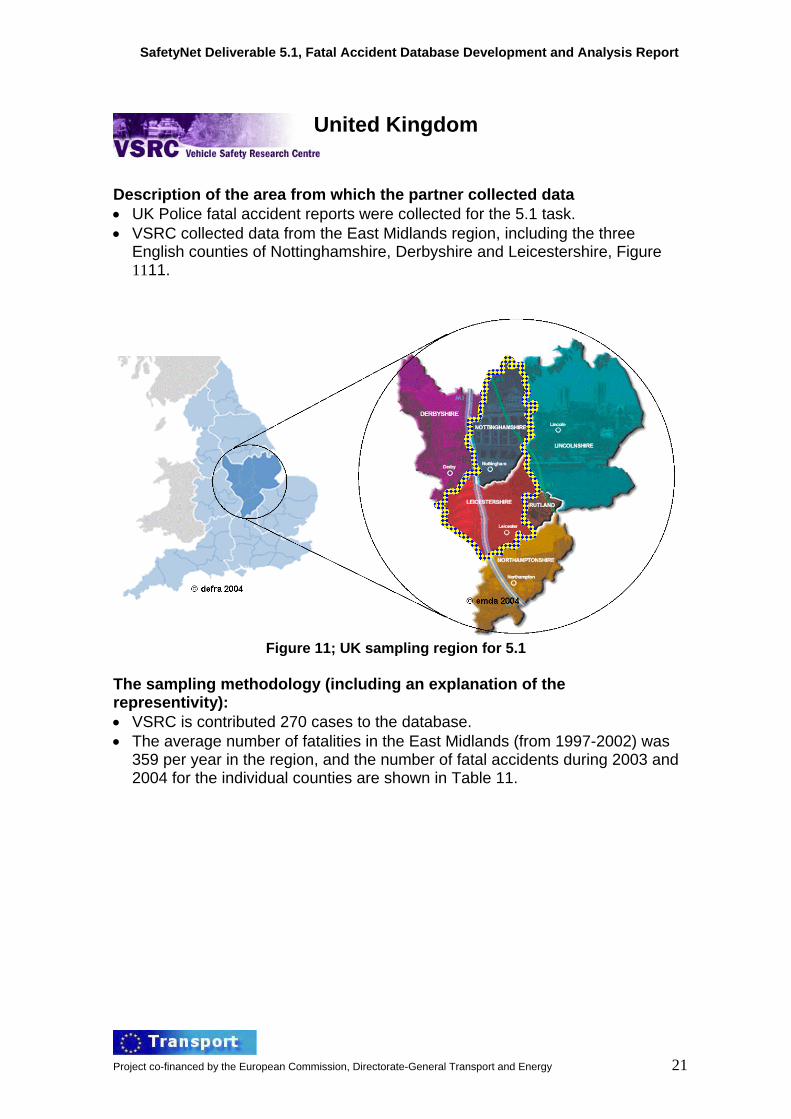
Description of the area from which the partner collected data • UK Police fatal accident reports were collected for the 5.1 task. • VSRC collected data from the East Midlands region, including the three
English counties of Nottinghamshire, Derbyshire and Leicestershire, Figure 1111.
Figure 11; UK sampling region for 5.1
The sampling methodology (including an explanation of the representivity): • VSRC is contributed 270 cases to the database. • The average number of fatalities in the East Midlands (from 1997-2002) was
359 per year in the region, and the number of fatal accidents during 2003 and 2004 for the individual counties are shown in Table 11.
Project co-financed by the European Commission, Directorate-General Transport and Energy 21
SafetyNet Deliverable 5.1, Fatal Accident Database Development and Analysis Report
Severity of injury (% of total)
Area Fatal Serious Slight
All Accidents
in 2003 Nottinghamshire 82 (1.5%) 826 (15.3%) 4492 (83.2%) 5400 Leicestershire* 56 (1.2%) 358 (7.8%) 4193 (91%) 4607 Total in these counties 138 2325 16448 19078
Total UK 3508 (1.2%) 33707 (11.6%) 253392 (87.2%) 290607 *Excluding Rutland
Table 11 2003 Traffic Casualties for the UK and sample area in 2003
• It was anticipated that numbers for 2004 would be similar to those for 2003 resulting in approximately 270 fatal accidents within the data collection area.
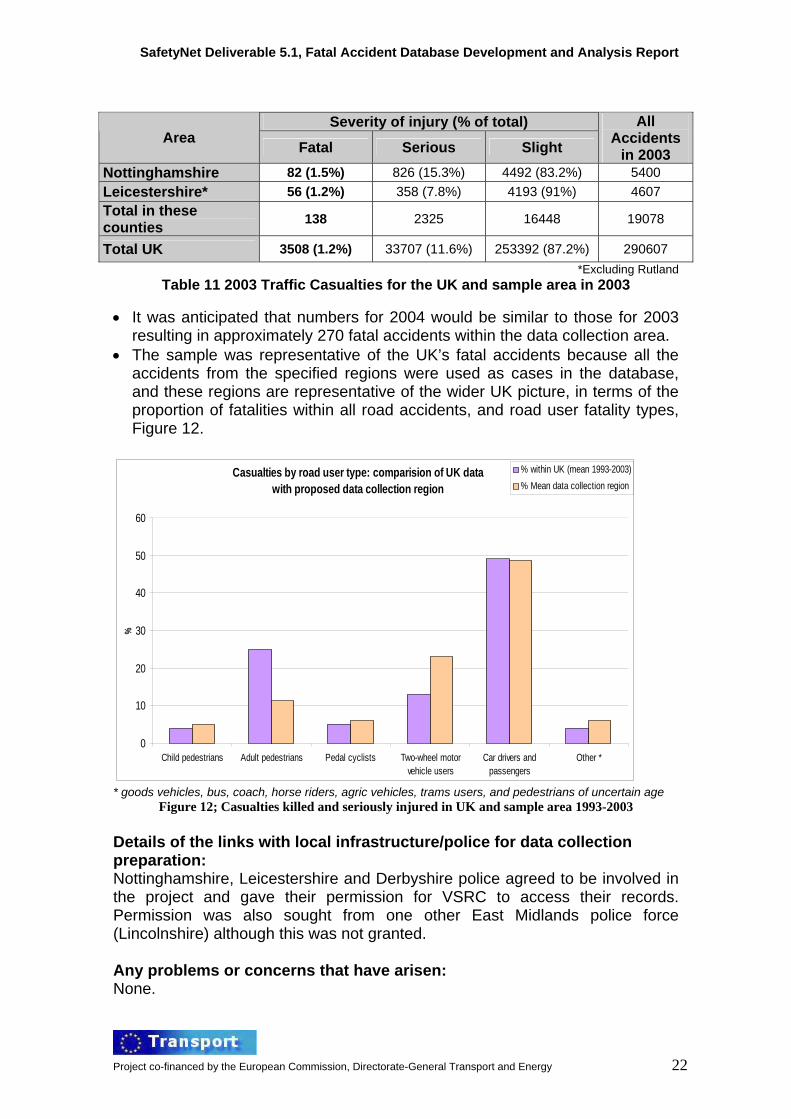
• The sample was representative of the UK’s fatal accidents because all the accidents from the specified regions were used as cases in the database, and these regions are representative of the wider UK picture, in terms of the proportion of fatalities within all road accidents, and road user fatality types, Figure 12.
Casualties by road user type: comparision of UK data
% within UK (mean 1993-2003)% Mean data collection region
* goods vehicles, bus, coach, horse riders, agric vehicles, trams users, and pedestrians of uncertain age
Figure 12; Casualties killed and seriously injured in UK and sample area 1993-2003 Details of the links with local infrastructure/police for data collection preparation: Nottinghamshire, Leicestershire and Derbyshire police agreed to be involved in the project and gave their permission for VSRC to access their records. Permission was also sought from one other East Midlands police force (Lincolnshire) although this was not granted. Any problems or concerns that have arisen: None.
Project co-financed by the European Commission, Directorate-General Transport and Energy 22
SafetyNet Deliverable 5.1, Fatal Accident Database Development and Analysis Report
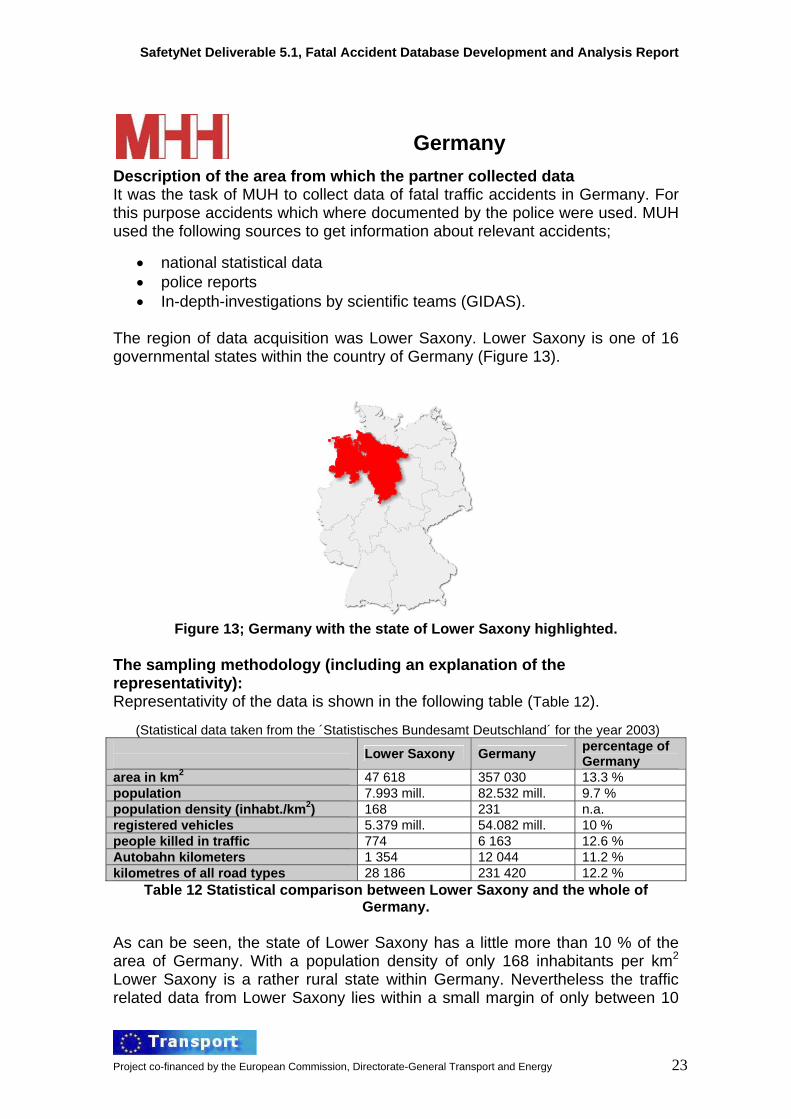
Germany Description of the area from which the partner collected data It was the task of MUH to collect data of fatal traffic accidents in Germany. For this purpose accidents which where documented by the police were used. MUH used the following sources to get information about relevant accidents;
• national statistical data • police reports • In-depth-investigations by scientific teams (GIDAS).
The region of data acquisition was Lower Saxony. Lower Saxony is one of 16 governmental states within the country of Germany (Figure 13).
Figure 13; Germany with the state of Lower Saxony highlighted.
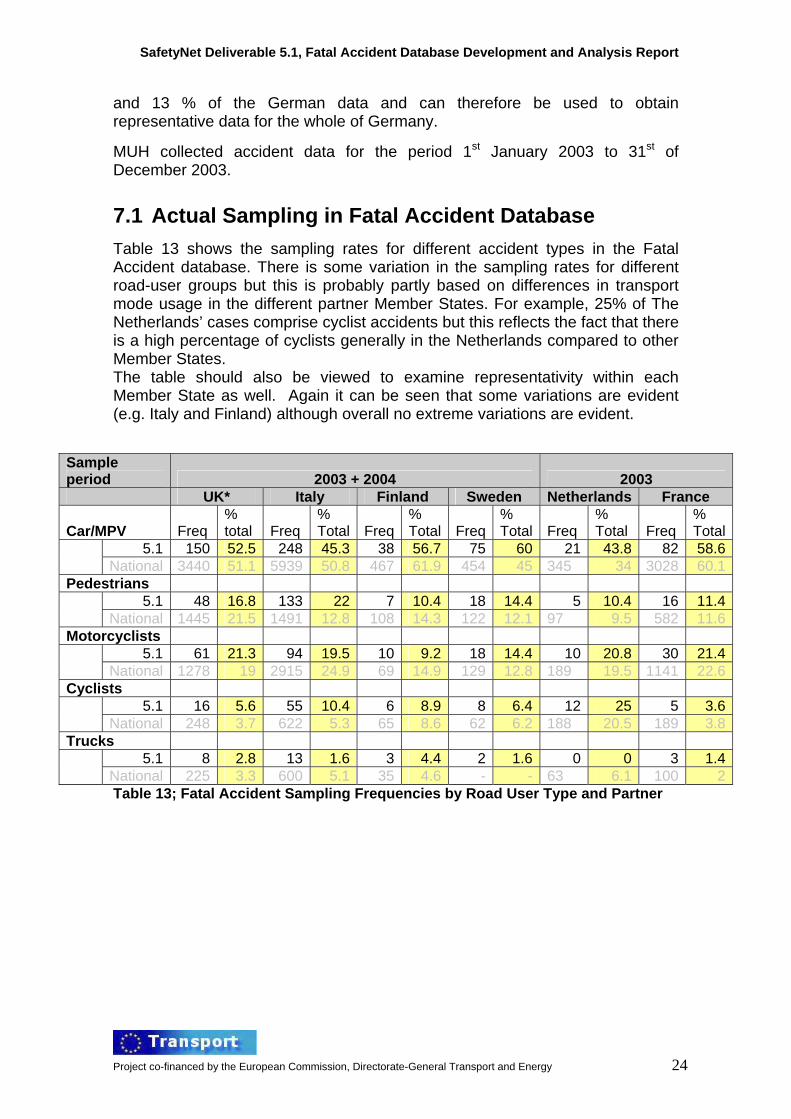
The sampling methodology (including an explanation of the representativity): Representativity of the data is shown in the following table (Table 12).
(Statistical data taken from the ´Statistisches Bundesamt Deutschland´ for the year 2003) Lower Saxony Germany percentage of
Germany area in km2 47 618 357 030 13.3 % population 7.993 mill. 82.532 mill. 9.7 % population density (inhabt./km2) 168 231 n.a. registered vehicles 5.379 mill. 54.082 mill. 10 % people killed in traffic 774 6 163 12.6 % Autobahn kilometers 1 354 12 044 11.2 % kilometres of all road types 28 186 231 420 12.2 %
Table 12 Statistical comparison between Lower Saxony and the whole of Germany.
As can be seen, the state of Lower Saxony has a little more than 10 % of the area of Germany. With a population density of only 168 inhabitants per km2 Lower Saxony is a rather rural state within Germany. Nevertheless the traffic related data from Lower Saxony lies within a small margin of only between 10
Project co-financed by the European Commission, Directorate-General Transport and Energy 23
SafetyNet Deliverable 5.1, Fatal Accident Database Development and Analysis Report
and 13 % of the German data and can therefore be used to obtain representative data for the whole of Germany.
MUH collected accident data for the period 1st January 2003 to 31st of December 2003.
7.1 Actual Sampling in Fatal Accident Database Table 13 shows the sampling rates for different accident types in the Fatal Accident database. There is some variation in the sampling rates for different road-user groups but this is probably partly based on differences in transport mode usage in the different partner Member States. For example, 25% of The Netherlands’ cases comprise cyclist accidents but this reflects the fact that there is a high percentage of cyclists generally in the Netherlands compared to other Member States. The table should also be viewed to examine representativity within each Member State as well. Again it can be seen that some variations are evident (e.g. Italy and Finland) although overall no extreme variations are evident.
Sample period 2003 + 2004 2003 UK* Italy Finland Sweden Netherlands France
Table 13; Fatal Accident Sampling Frequencies by Road User Type and Partner
Project co-financed by the European Commission, Directorate-General Transport and Energy 24
SafetyNet Deliverable 5.1, Fatal Accident Database Development and Analysis Report
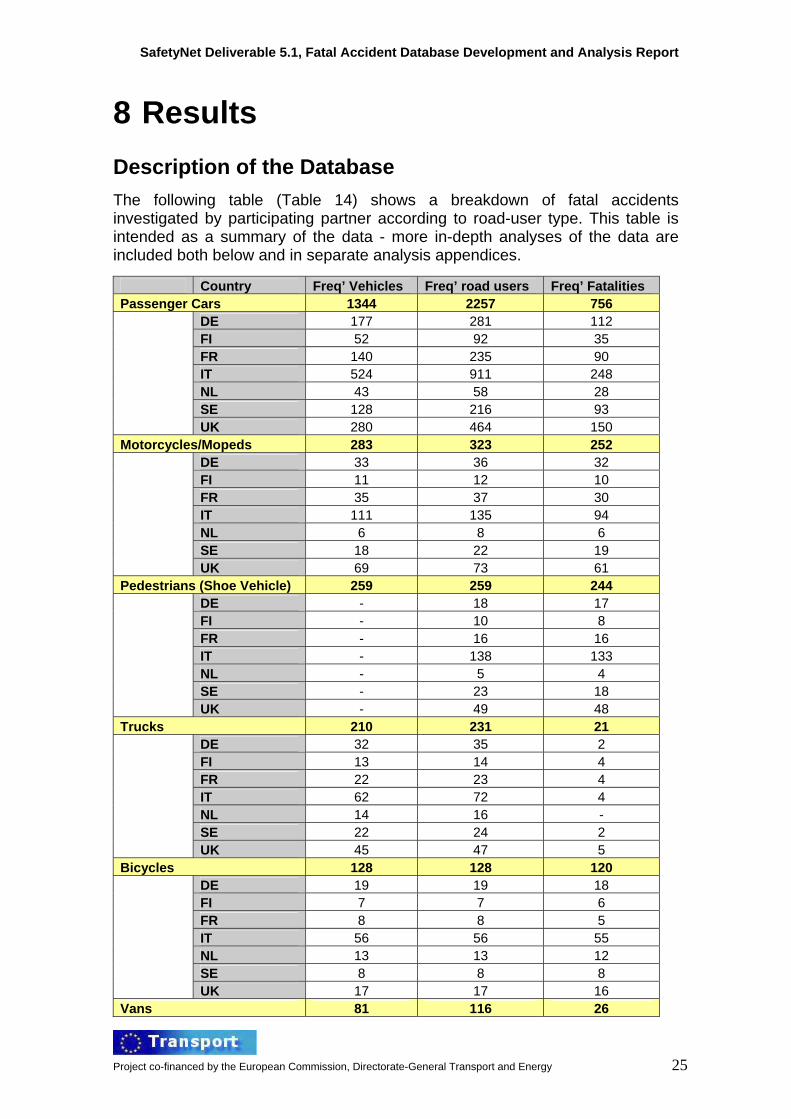
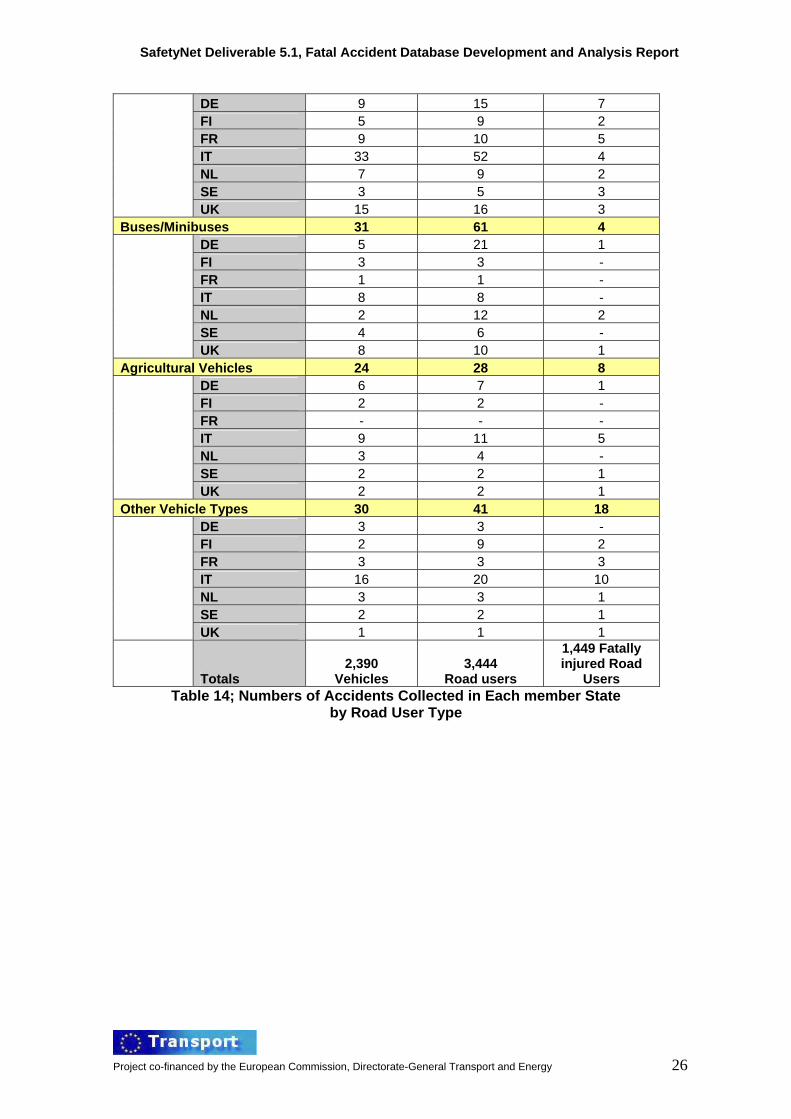
8 Results Description of the Database The following table (Table 14) shows a breakdown of fatal accidents investigated by participating partner according to road-user type. This table is intended as a summary of the data - more in-depth analyses of the data are included both below and in separate analysis appendices.
DE 177 281 112 FI 52 92 35 FR 140 235 90 IT 524 911 248 NL 43 58 28 SE 128 216 93
UK 280 464 150 Motorcycles/Mopeds 283 323 252
DE 33 36 32 FI 11 12 10 FR 35 37 30 IT 111 135 94 NL 6 8 6 SE 18 22 19
UK 69 73 61 Pedestrians (Shoe Vehicle) 259 259 244
DE - 18 17 FI - 10 8 FR - 16 16 IT - 138 133 NL - 5 4 SE - 23 18
UK - 49 48 Trucks 210 231 21
DE 32 35 2 FI 13 14 4 FR 22 23 4 IT 62 72 4 NL 14 16 - SE 22 24 2
UK 45 47 5 Bicycles 128 128 120
DE 19 19 18 FI 7 7 6 FR 8 8 5 IT 56 56 55 NL 13 13 12 SE 8 8 8
UK 17 17 16 Vans 81 116 26
Project co-financed by the European Commission, Directorate-General Transport and Energy 25
SafetyNet Deliverable 5.1, Fatal Accident Database Development and Analysis Report
DE 9 15 7 FI 5 9 2 FR 9 10 5 IT 33 52 4 NL 7 9 2 SE 3 5 3
UK 15 16 3 Buses/Minibuses 31 61 4
DE 5 21 1 FI 3 3 - FR 1 1 - IT 8 8 - NL 2 12 2 SE 4 6 -
UK 8 10 1 Agricultural Vehicles 24 28 8
DE 6 7 1 FI 2 2 - FR - - - IT 9 11 5 NL 3 4 - SE 2 2 1
UK 2 2 1 Other Vehicle Types 30 41 18
DE 3 3 - FI 2 9 2 FR 3 3 3 IT 16 20 10 NL 3 3 1 SE 2 2 1
UK 1 1 1
Totals 2,390
Vehicles 3,444
Road users
1,449 Fatally injured Road
Users Table 14; Numbers of Accidents Collected in Each member State
by Road User Type
Project co-financed by the European Commission, Directorate-General Transport and Energy 26
SafetyNet Deliverable 5.1, Fatal Accident Database Development and Analysis Report
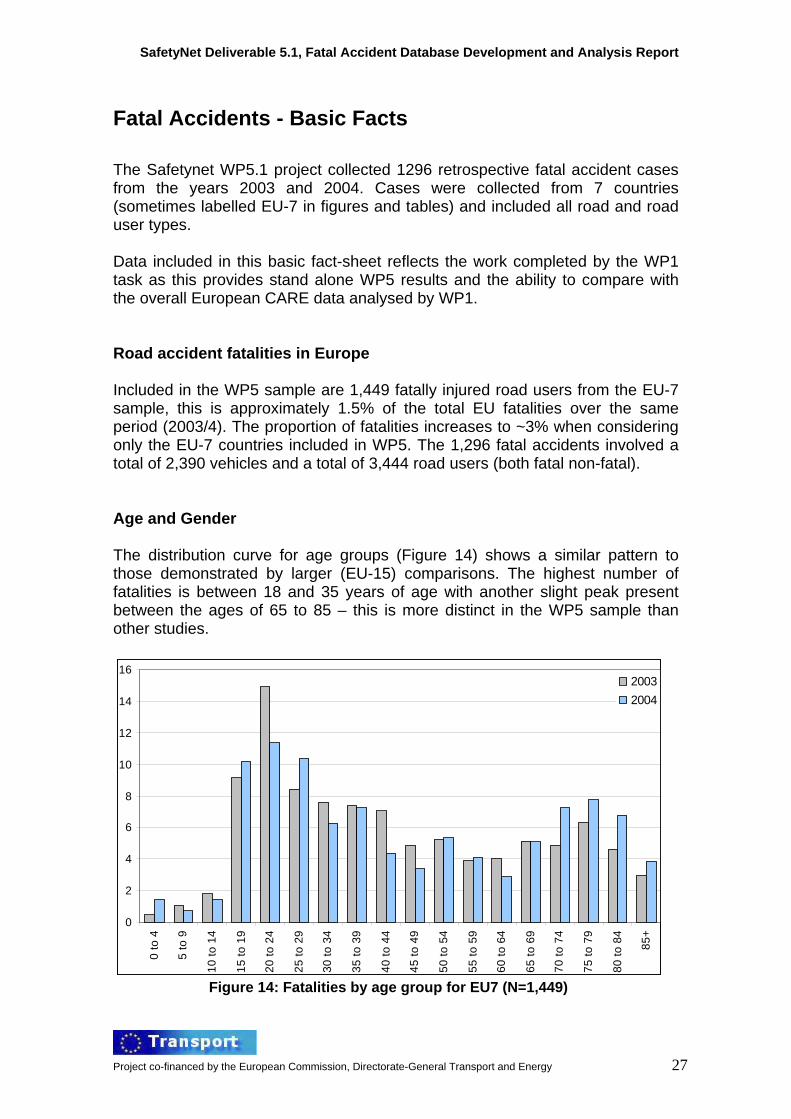
Fatal Accidents - Basic Facts The Safetynet WP5.1 project collected 1296 retrospective fatal accident cases from the years 2003 and 2004. Cases were collected from 7 countries (sometimes labelled EU-7 in figures and tables) and included all road and road user types. Data included in this basic fact-sheet reflects the work completed by the WP1 task as this provides stand alone WP5 results and the ability to compare with the overall European CARE data analysed by WP1. Road accident fatalities in Europe Included in the WP5 sample are 1,449 fatally injured road users from the EU-7 sample, this is approximately 1.5% of the total EU fatalities over the same period (2003/4). The proportion of fatalities increases to ~3% when considering only the EU-7 countries included in WP5. The 1,296 fatal accidents involved a total of 2,390 vehicles and a total of 3,444 road users (both fatal non-fatal). Age and Gender The distribution curve for age groups (Figure 14) shows a similar pattern to those demonstrated by larger (EU-15) comparisons. The highest number of fatalities is between 18 and 35 years of age with another slight peak present between the ages of 65 to 85 – this is more distinct in the WP5 sample than other studies.
0
2
4
6
8
10
12
14
16
0 to
4
5 to
9
10 to
14
15 to
19
20 to
24
25 to
29
30 to
34
35 to
39
40 to
44
45 to
49
50 to
54
55 to
59
60 to
64
65 to
69
70 to
74
75 to
79
80 to
84
85+
20032004
Figure 14: Fatalities by age group for EU7 (N=1,449)
Project co-financed by the European Commission, Directorate-General Transport and Energy 27
SafetyNet Deliverable 5.1, Fatal Accident Database Development and Analysis Report
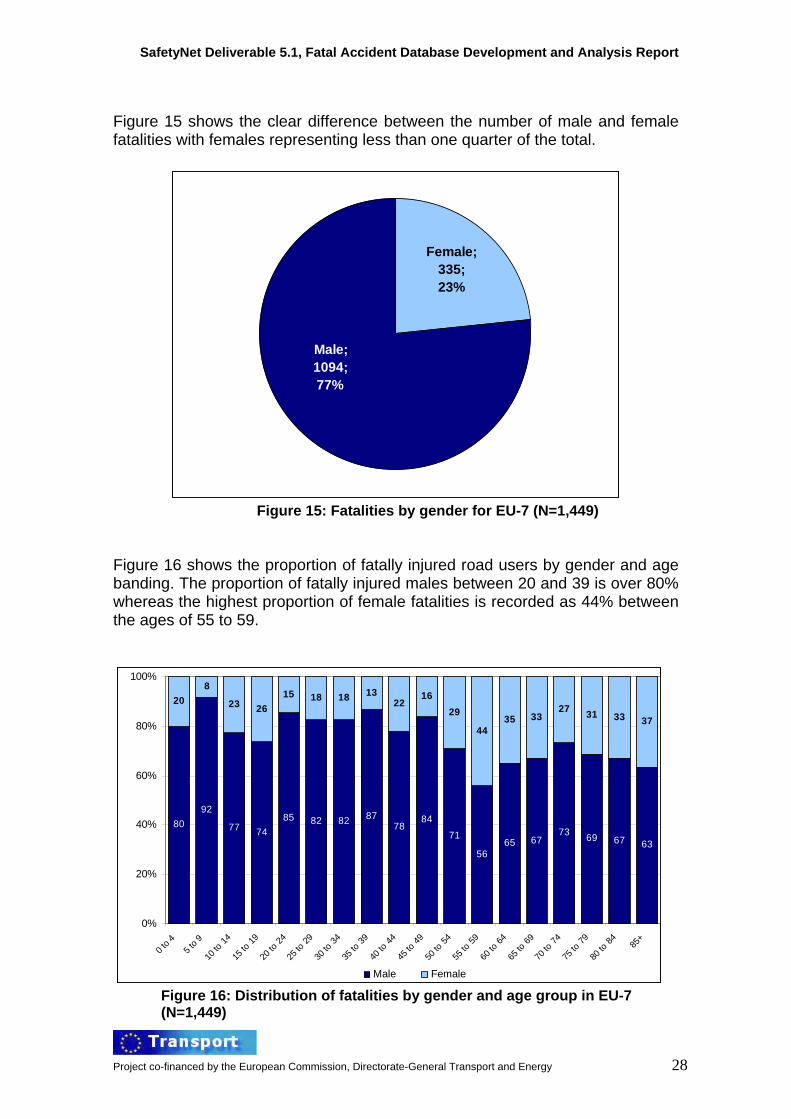
Figure 15 shows the clear difference between the number of male and female fatalities with females representing less than one quarter of the total.
Female;335;23%
Male; 1094; 77%
Figure 15: Fatalities by gender for EU-7 (N=1,449)
Figure 16 shows the proportion of fatally injured road users by gender and age banding. The proportion of fatally injured males between 20 and 39 is over 80% whereas the highest proportion of female fatalities is recorded as 44% between the ages of 55 to 59.
8092
77 7485 82 82 87
7884
71
5665 67
73 69 67 63
208
23 2615 18 18 13
2216
29
4435 33
27 31 33 37
0%
20%
40%
60%
80%
100%
0 to 4
5 to 9
10 to
14
15 to
19
20 to
24
25 to
29
30 to
34
35 to
39
40 to
44
45 to
49
50 to
54
55 to
59
60 to
64
65 to
69
70 to
74
75 to
79
80 to
84 85+
Male Female Figure 16: Distribution of fatalities by gender and age group in EU-7 (N=1,449)
Project co-financed by the European Commission, Directorate-General Transport and Energy 28
SafetyNet Deliverable 5.1, Fatal Accident Database Development and Analysis Report
Project co-financed by the European Commission, Directorate-General Transport and Energy 29
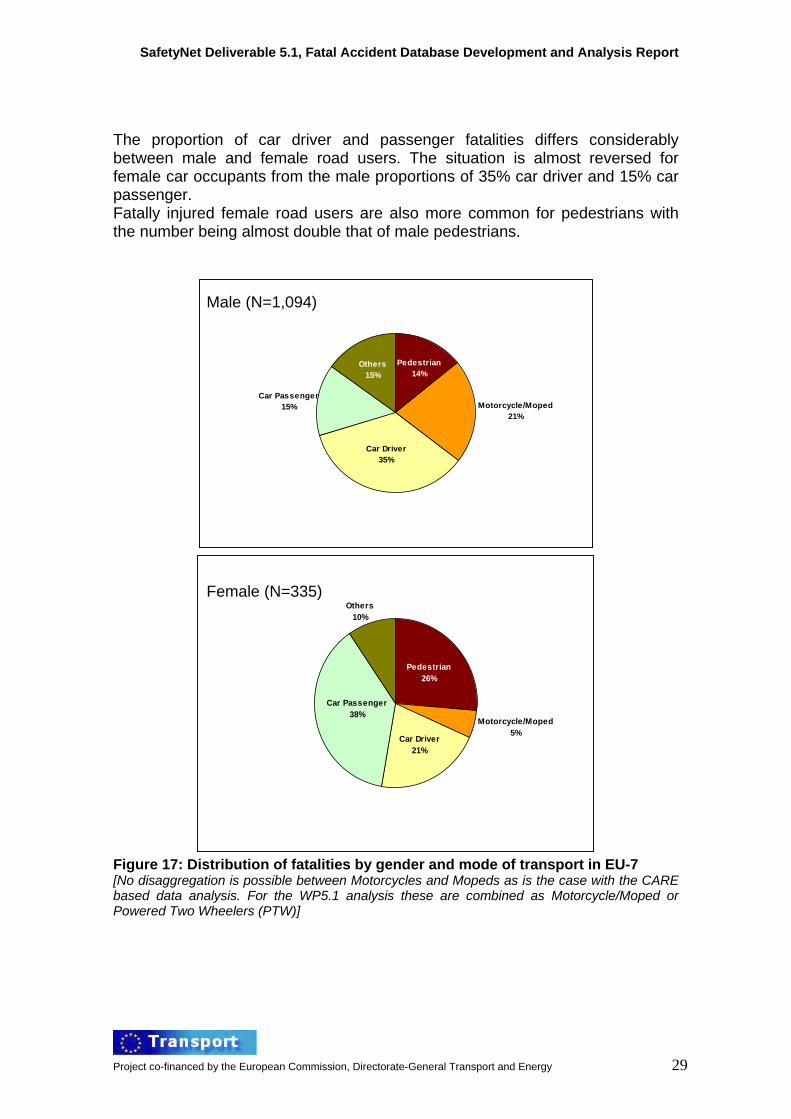
The proportion of car driver and passenger fatalities differs considerably between male and female road users. The situation is almost reversed for female car occupants from the male proportions of 35% car driver and 15% car passenger. Fatally injured female road users are also more common for pedestrians with the number being almost double that of male pedestrians.
Motorcycle/Moped21%
Pedestrian14%
Others15%
Car Passenger15%
Car Driver35%
Motorcycle/Moped5%
Others10%
Car Passenger38%
Car Driver21%
Pedestrian26%
Figure 17: Distribution of fatalities by gender and mode of transport in EU-7 [No disaggregation is possible between Motorcycles and Mopeds as is the case with the CARE based data analysis. For the WP5.1 analysis these are combined as Motorcycle/Moped or Powered Two Wheelers (PTW)]
Male (N=1,094)
Female (N=335)
SafetyNet Deliverable 5.1, Fatal Accident Database Development and Analysis Report
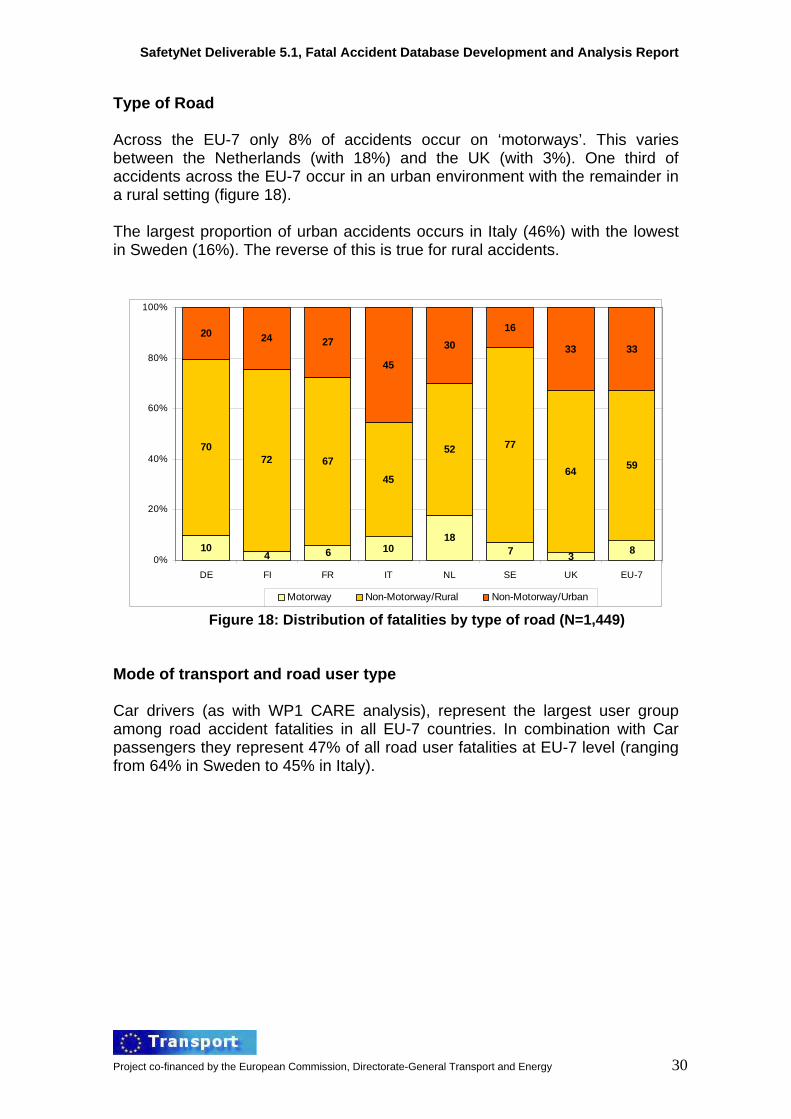
Type of Road Across the EU-7 only 8% of accidents occur on ‘motorways’. This varies between the Netherlands (with 18%) and the UK (with 3%). One third of accidents across the EU-7 occur in an urban environment with the remainder in a rural setting (figure 18). The largest proportion of urban accidents occurs in Italy (46%) with the lowest in Sweden (16%). The reverse of this is true for rural accidents.
104 6 10
187 3 8
7072 67
45
52 77
64 59
20 24 27
45
3016
33 33
0%
20%
40%
60%
80%
100%
DE FI FR IT NL SE UK EU-7
Motorway Non-Motorway/Rural Non-Motorway/Urban Figure 18: Distribution of fatalities by type of road (N=1,449)
Mode of transport and road user type Car drivers (as with WP1 CARE analysis), represent the largest user group among road accident fatalities in all EU-7 countries. In combination with Car passengers they represent 47% of all road user fatalities at EU-7 level (ranging from 64% in Sweden to 45% in Italy).
Project co-financed by the European Commission, Directorate-General Transport and Energy 30
SafetyNet Deliverable 5.1, Fatal Accident Database Development and Analysis Report
9
12
10
24
7
12
17
17
17
15
20
17
11
13
21
17
44
30
43
21
38
39
35
32
15
22
16
24
13
25
17
20
15
21
11
14
31
10
9
14
0% 20% 40% 60% 80% 100%
DE
FI
FR
IT
NL
SE
UK
EU-7
Pedestrian Motorcycle / Moped Car Driver Car Passenger Other
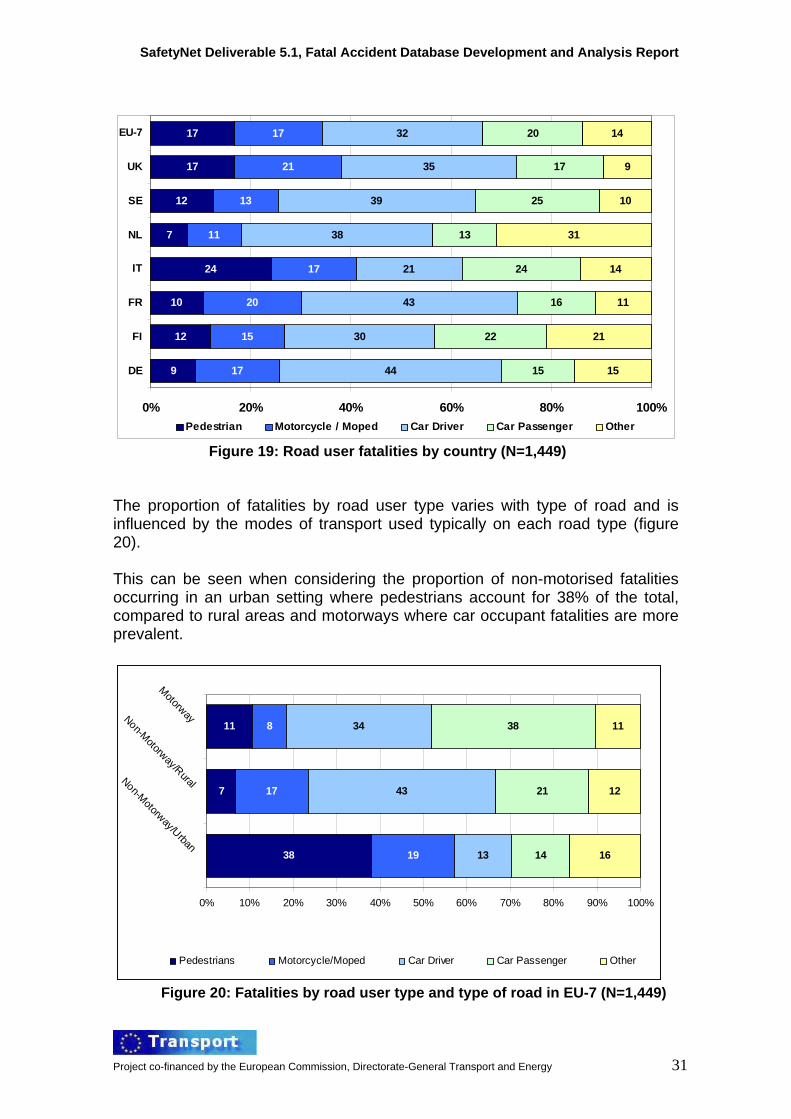
Figure 19: Road user fatalities by country (N=1,449) The proportion of fatalities by road user type varies with type of road and is influenced by the modes of transport used typically on each road type (figure 20). This can be seen when considering the proportion of non-motorised fatalities occurring in an urban setting where pedestrians account for 38% of the total, compared to rural areas and motorways where car occupant fatalities are more prevalent.
38
7
11
19
17
8
13
43
34
14
21
38
16
12
11
0% 10% 20% 30% 40% 50% 60% 70% 80% 90% 100%
Non-Motorway/Urban
Non-Motorway/Rural
Motorway
Pedestrians Motorcycle/Moped Car Driver Car Passenger Other
Figure 20: Fatalities by road user type and type of road in EU-7 (N=1,449)
Project co-financed by the European Commission, Directorate-General Transport and Energy 31
SafetyNet Deliverable 5.1, Fatal Accident Database Development and Analysis Report
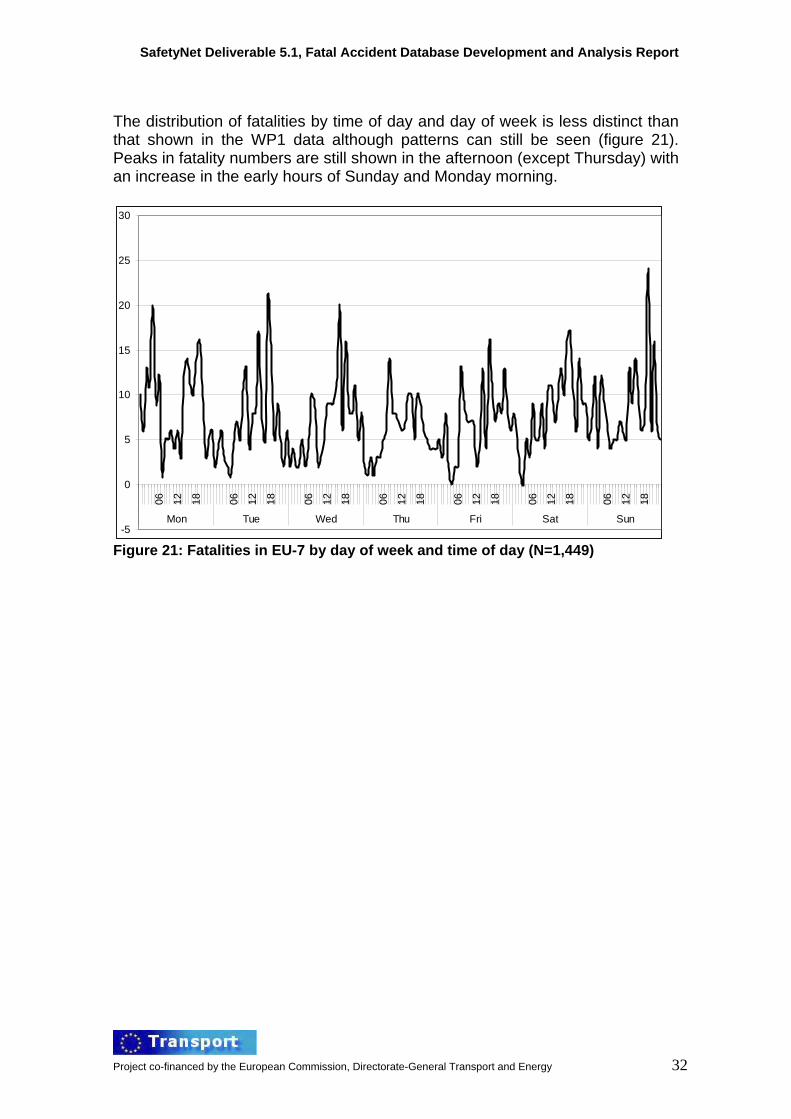
The distribution of fatalities by time of day and day of week is less distinct than that shown in the WP1 data although patterns can still be seen (figure 21). Peaks in fatality numbers are still shown in the afternoon (except Thursday) with an increase in the early hours of Sunday and Monday morning.
Figure 21: Fatalities in EU-7 by day of week and time of day (N=1,449)
Project co-financed by the European Commission, Directorate-General Transport and Energy 32
SafetyNet Deliverable 5.1, Fatal Accident Database Development and Analysis Report
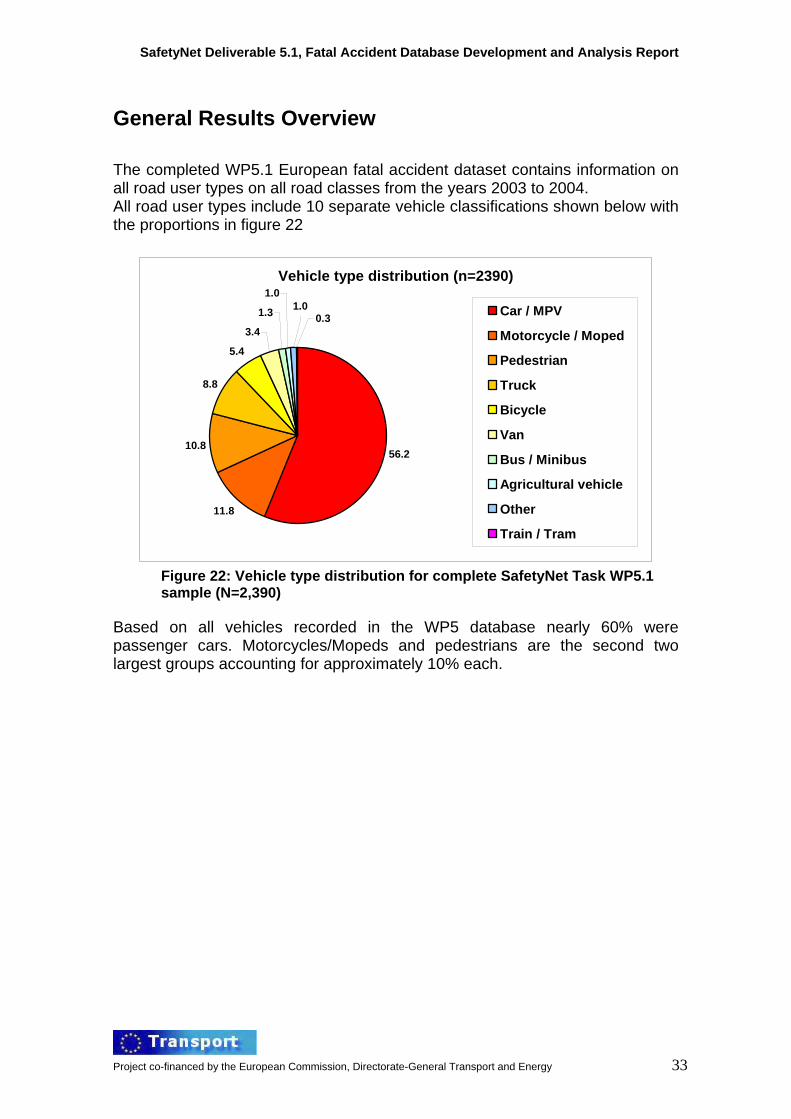
General Results Overview The completed WP5.1 European fatal accident dataset contains information on all road user types on all road classes from the years 2003 to 2004. All road user types include 10 separate vehicle classifications shown below with the proportions in figure 22
Vehicle type distribution (n=2390)
56.2
11.8
10.8
8.8
5.4
3.4
1.3
1.01.0
0.3 Car / MPV
Motorcycle / Moped
Pedestrian
Truck
Bicycle
Van
Bus / Minibus
Agricultural vehicle
Other
Train / Tram
Figure 22: Vehicle type distribution for complete SafetyNet Task WP5.1 sample (N=2,390)
Based on all vehicles recorded in the WP5 database nearly 60% were passenger cars. Motorcycles/Mopeds and pedestrians are the second two largest groups accounting for approximately 10% each.
Project co-financed by the European Commission, Directorate-General Transport and Energy 33
SafetyNet Deliverable 5.1, Fatal Accident Database Development and Analysis Report
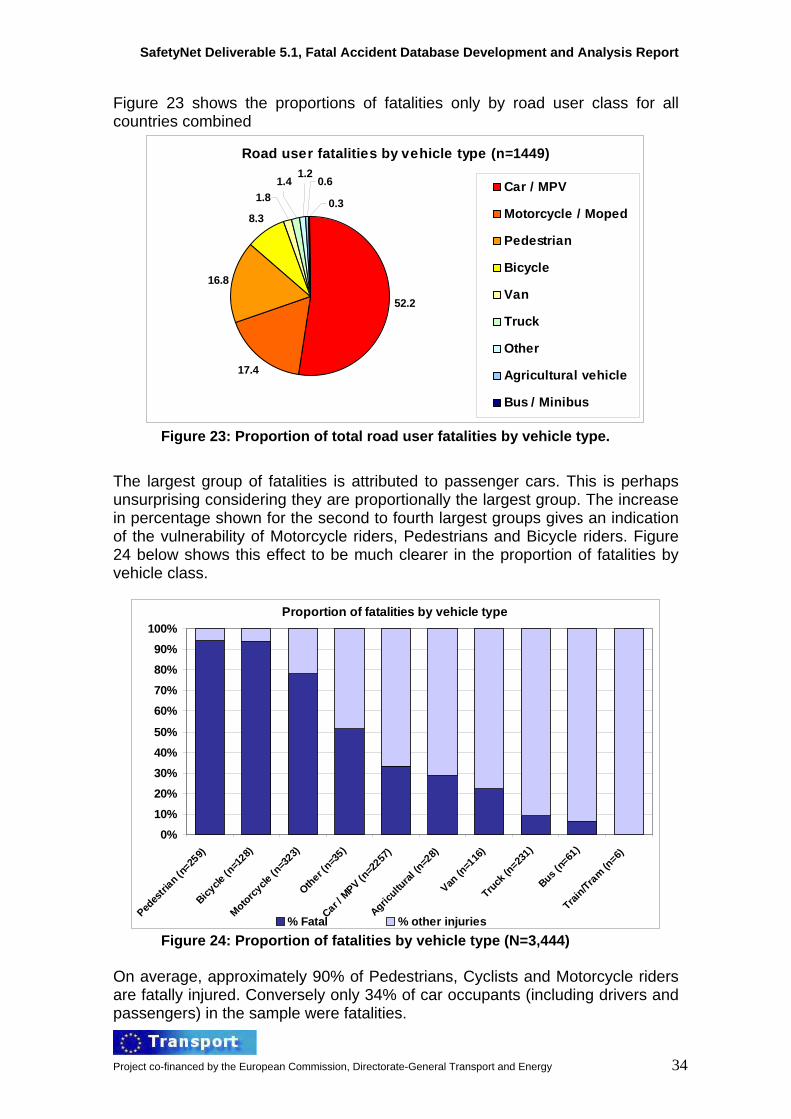
Figure 23 shows the proportions of fatalities only by road user class for all countries combined
Road user fatalities by vehicle type (n=1449)
52.2
17.4
16.8
8.30.3
0.61.2
1.81.4 Car / MPV
Motorcycle / Moped
Pedestrian
Bicycle
Van
Truck
Other
Agricultural vehicle
Bus / Minibus
Figure 23: Proportion of total road user fatalities by vehicle type. The largest group of fatalities is attributed to passenger cars. This is perhaps unsurprising considering they are proportionally the largest group. The increase in percentage shown for the second to fourth largest groups gives an indication of the vulnerability of Motorcycle riders, Pedestrians and Bicycle riders. Figure 24 below shows this effect to be much clearer in the proportion of fatalities by vehicle class.
Proportion of fatalities by vehicle type
0%
10%
20%
30%
40%
50%
60%
70%
80%
90%
100%
Pedes
trian (n
=259)
Bicycle
(n=1
28)
Motorcycle
(n=3
23)
Other (n=3
5)
Car / MPV (n
=2257
)
Agricultu
ral (n
=28)
Van (n
=116
)
Truck
(n=23
1)
Bus (n=61
)
Train/Tra
m (n=6)
% Fatal % other injuries Figure 24: Proportion of fatalities by vehicle type (N=3,444)
On average, approximately 90% of Pedestrians, Cyclists and Motorcycle riders are fatally injured. Conversely only 34% of car occupants (including drivers and passengers) in the sample were fatalities.
Project co-financed by the European Commission, Directorate-General Transport and Energy 34
SafetyNet Deliverable 5.1, Fatal Accident Database Development and Analysis Report
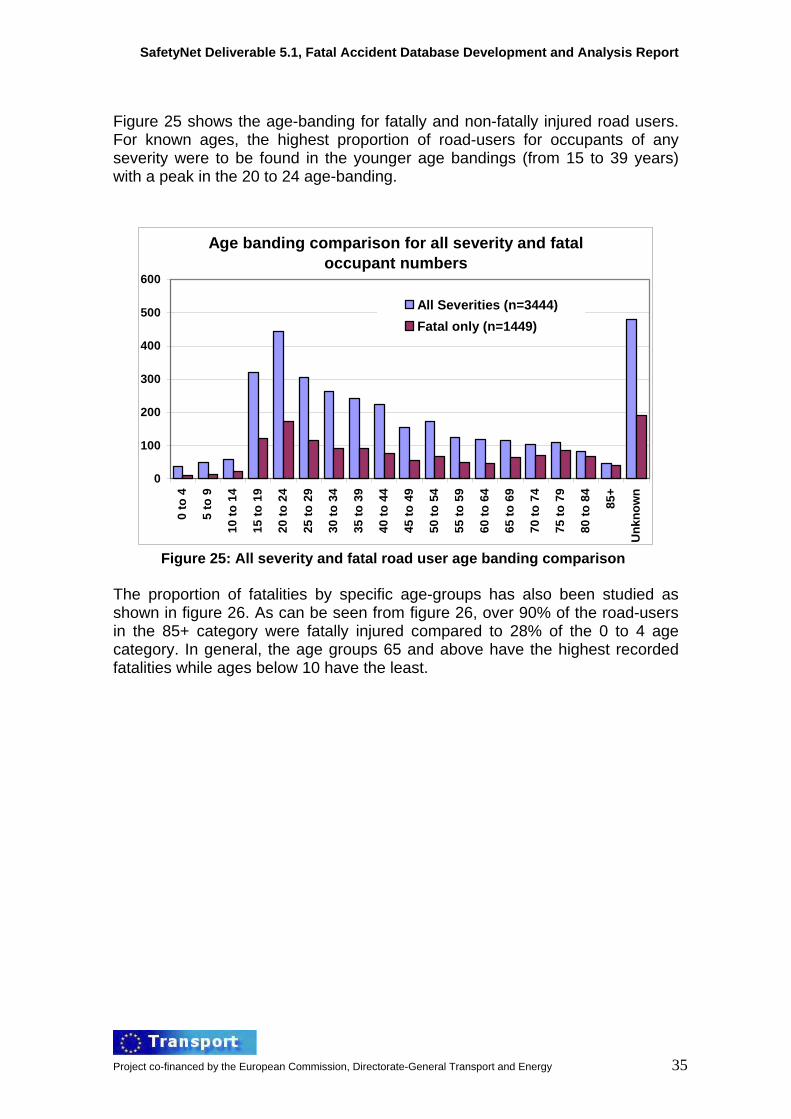
Figure 25 shows the age-banding for fatally and non-fatally injured road users. For known ages, the highest proportion of road-users for occupants of any severity were to be found in the younger age bandings (from 15 to 39 years) with a peak in the 20 to 24 age-banding.
Age banding comparison for all severity and fatal occupant numbers
0
100
200
300
400
500
600
0 to
4
5 to
9
10 to
14
15 to
19
20 to
24
25 to
29
30 to
34
35 to
39
40 to
44
45 to
49
50 to
54
55 to
59
60 to
64
65 to
69
70 to
74
75 to
79
80 to
84
85+
Unk
now
n
All Severities (n=3444)Fatal only (n=1449)
Figure 25: All severity and fatal road user age banding comparison
The proportion of fatalities by specific age-groups has also been studied as shown in figure 26. As can be seen from figure 26, over 90% of the road-users in the 85+ category were fatally injured compared to 28% of the 0 to 4 age category. In general, the age groups 65 and above have the highest recorded fatalities while ages below 10 have the least.
Project co-financed by the European Commission, Directorate-General Transport and Energy 35
SafetyNet Deliverable 5.1, Fatal Accident Database Development and Analysis Report
Proportion of fatalities by age group
0.010.020.030.040.050.060.070.080.090.0
100.0
0 to
4
5 to
9
10 to
14
15 to
19
20 to
24
25 to
29
30 to
34
35 to
39
40 to
44
45 to
49
50 to
54
55 to
59
60 to
64
65 to
69
70 to
74
75 to
79
80 to
84
85+
Figure 26; Proportion of fatalities by age group – all road users (N=3,185)
Table 15 shows fatal accident location by local area and road type.
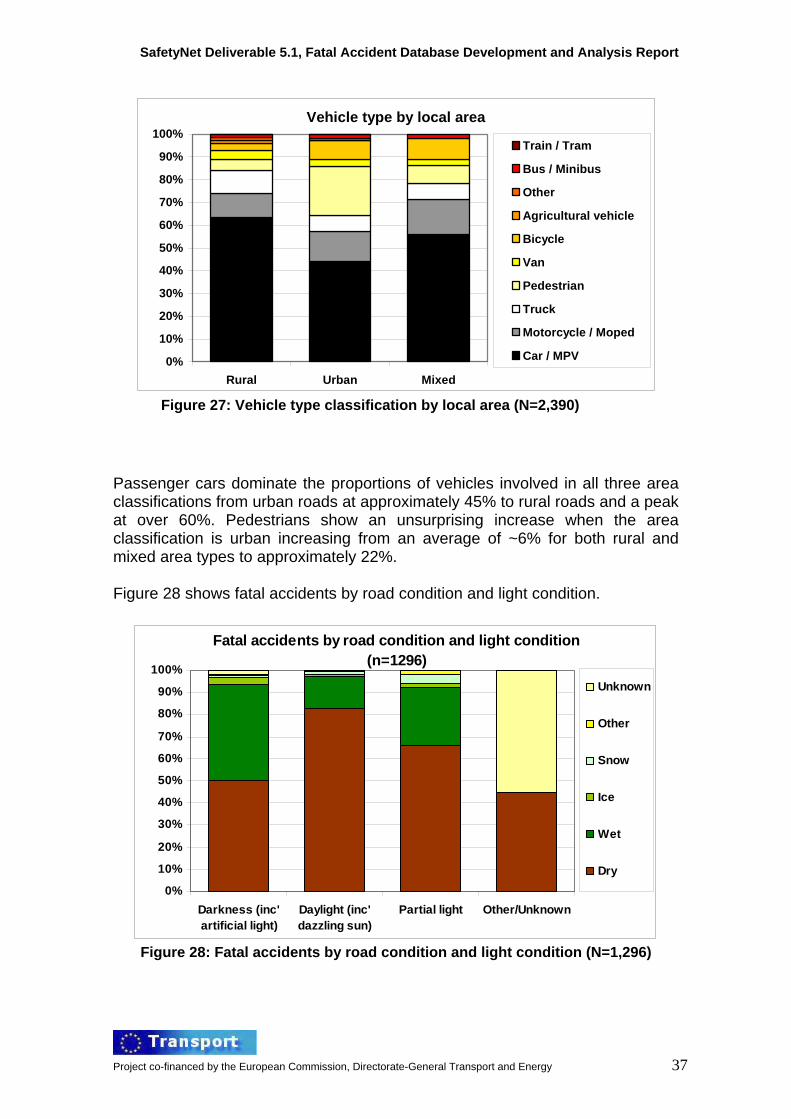
Table 15: Fatal accident location by local area and road type (N=2,390) 71% (n=1697) of all vehicles involved in fatal accidents were using sections of road that were two way, separated only by painted lines. Of these, 1014 vehicles (~60%) were in a rural setting. The second largest group involved vehicles on road sections physically separated by a traffic barrier. These accident account for approximately 10% of the vehicles (n=249). Figure 27 shows vehicle type classification by local area.
Project co-financed by the European Commission, Directorate-General Transport and Energy 36
SafetyNet Deliverable 5.1, Fatal Accident Database Development and Analysis Report
Vehicle type by local area
0%
10%
20%
30%
40%
50%
60%
70%
80%
90%
100%
Rural Urban Mixed
Train / Tram
Bus / Minibus
Other
Agricultural vehicle
Bicycle
Van
Pedestrian
Truck
Motorcycle / Moped
Car / MPV
Figure 27: Vehicle type classification by local area (N=2,390)
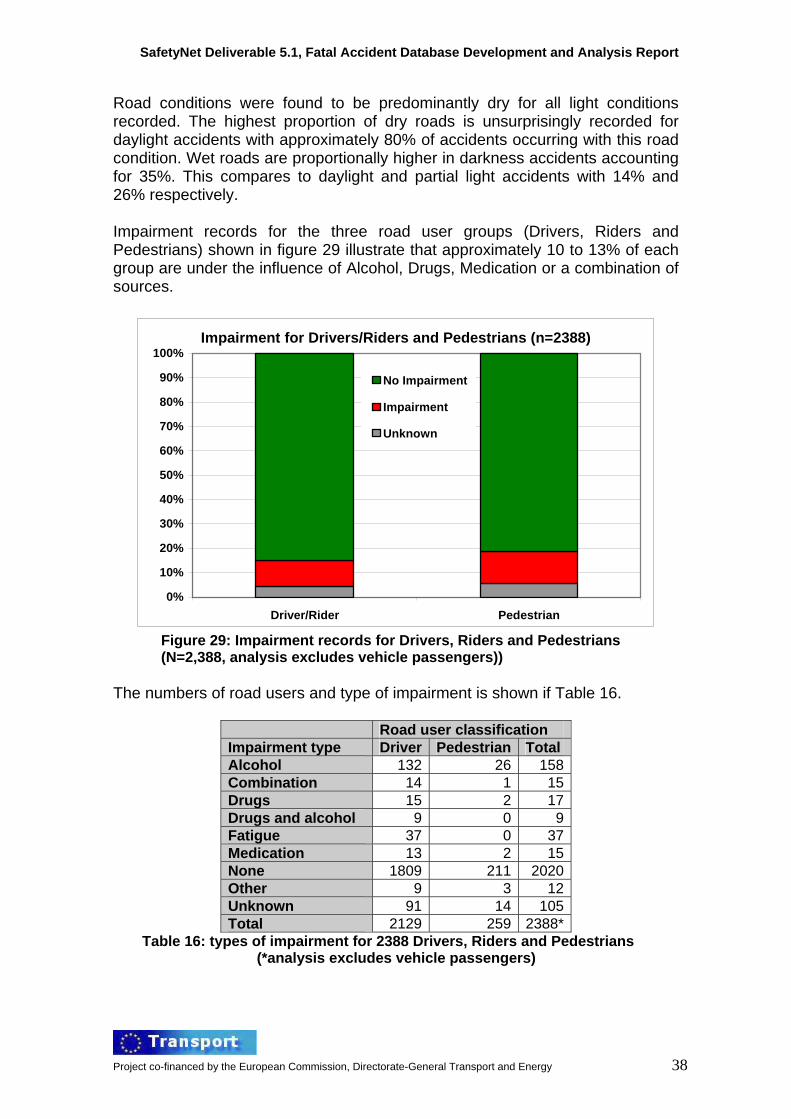
Passenger cars dominate the proportions of vehicles involved in all three area classifications from urban roads at approximately 45% to rural roads and a peak at over 60%. Pedestrians show an unsurprising increase when the area classification is urban increasing from an average of ~6% for both rural and mixed area types to approximately 22%. Figure 28 shows fatal accidents by road condition and light condition.
Fatal accidents by road condition and light condition (n=1296)
0%
10%
20%
30%
40%
50%
60%
70%
80%
90%
100%
Darkness (inc'artificial light)
Daylight (inc'dazzling sun)
Partial light Other/Unknown
Unknown
Other
Snow
Ice
Wet
Dry
Figure 28: Fatal accidents by road condition and light condition (N=1,296)
Project co-financed by the European Commission, Directorate-General Transport and Energy 37
SafetyNet Deliverable 5.1, Fatal Accident Database Development and Analysis Report
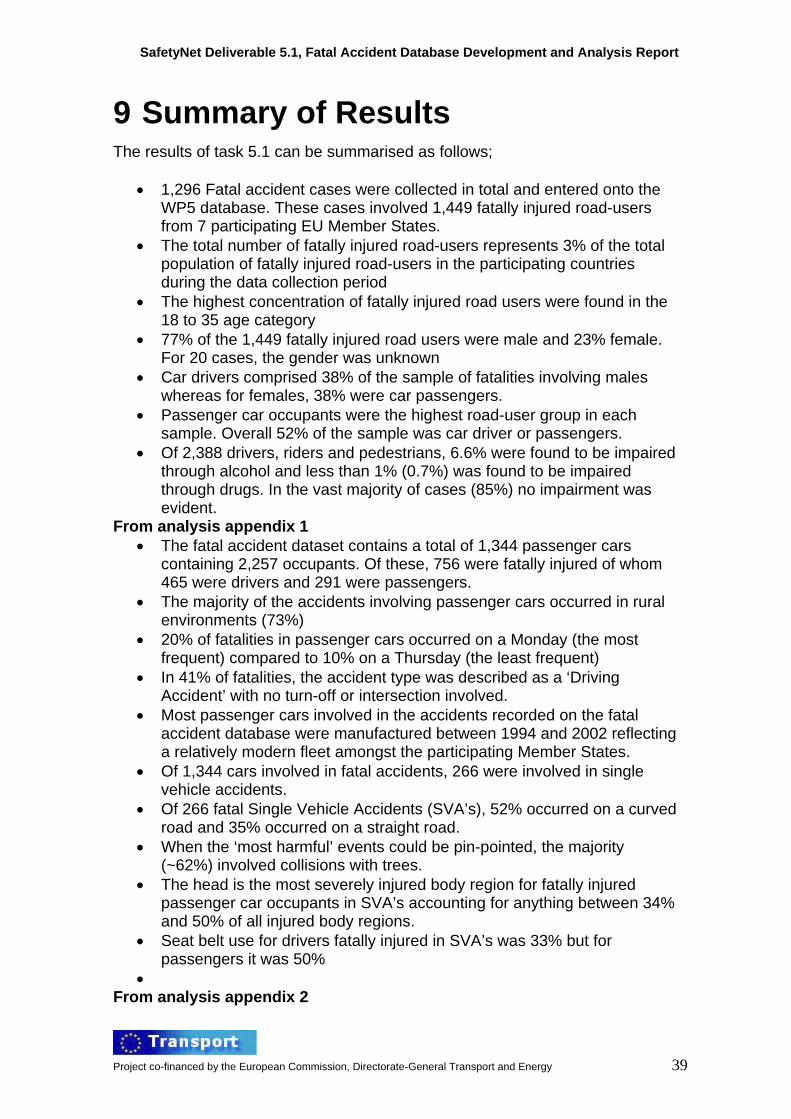
Road conditions were found to be predominantly dry for all light conditions recorded. The highest proportion of dry roads is unsurprisingly recorded for daylight accidents with approximately 80% of accidents occurring with this road condition. Wet roads are proportionally higher in darkness accidents accounting for 35%. This compares to daylight and partial light accidents with 14% and 26% respectively. Impairment records for the three road user groups (Drivers, Riders and Pedestrians) shown in figure 29 illustrate that approximately 10 to 13% of each group are under the influence of Alcohol, Drugs, Medication or a combination of sources.
Impairment for Drivers/Riders and Pedestrians (n=2388)
0%
10%
20%
30%
40%
50%
60%
70%
80%
90%
100%
Driver/Rider Pedestrian
No Impairment
Impairment
Unknown
Figure 29: Impairment records for Drivers, Riders and Pedestrians (N=2,388, analysis excludes vehicle passengers))
The numbers of road users and type of impairment is shown if Table 16.
Road user classification Impairment type Driver Pedestrian Total Alcohol 132 26 158 Combination 14 1 15 Drugs 15 2 17 Drugs and alcohol 9 0 9 Fatigue 37 0 37 Medication 13 2 15 None 1809 211 2020 Other 9 3 12 Unknown 91 14 105 Total 2129 259 2388*
Table 16: types of impairment for 2388 Drivers, Riders and Pedestrians (*analysis excludes vehicle passengers)
Project co-financed by the European Commission, Directorate-General Transport and Energy 38
SafetyNet Deliverable 5.1, Fatal Accident Database Development and Analysis Report
9 Summary of Results The results of task 5.1 can be summarised as follows;
• 1,296 Fatal accident cases were collected in total and entered onto the WP5 database. These cases involved 1,449 fatally injured road-users from 7 participating EU Member States.
• The total number of fatally injured road-users represents 3% of the total population of fatally injured road-users in the participating countries during the data collection period
• The highest concentration of fatally injured road users were found in the 18 to 35 age category
• 77% of the 1,449 fatally injured road users were male and 23% female. For 20 cases, the gender was unknown
• Car drivers comprised 38% of the sample of fatalities involving males whereas for females, 38% were car passengers.
• Passenger car occupants were the highest road-user group in each sample. Overall 52% of the sample was car driver or passengers.
• Of 2,388 drivers, riders and pedestrians, 6.6% were found to be impaired through alcohol and less than 1% (0.7%) was found to be impaired through drugs. In the vast majority of cases (85%) no impairment was evident.
From analysis appendix 1 • The fatal accident dataset contains a total of 1,344 passenger cars
containing 2,257 occupants. Of these, 756 were fatally injured of whom 465 were drivers and 291 were passengers.
• The majority of the accidents involving passenger cars occurred in rural environments (73%)
• 20% of fatalities in passenger cars occurred on a Monday (the most frequent) compared to 10% on a Thursday (the least frequent)
• In 41% of fatalities, the accident type was described as a ‘Driving Accident’ with no turn-off or intersection involved.
• Most passenger cars involved in the accidents recorded on the fatal accident database were manufactured between 1994 and 2002 reflecting a relatively modern fleet amongst the participating Member States.
• Of 1,344 cars involved in fatal accidents, 266 were involved in single vehicle accidents.
• Of 266 fatal Single Vehicle Accidents (SVA’s), 52% occurred on a curved road and 35% occurred on a straight road.
• When the ‘most harmful’ events could be pin-pointed, the majority (~62%) involved collisions with trees.
• The head is the most severely injured body region for fatally injured passenger car occupants in SVA’s accounting for anything between 34% and 50% of all injured body regions.
• Seat belt use for drivers fatally injured in SVA’s was 33% but for passengers it was 50%
• From analysis appendix 2
Project co-financed by the European Commission, Directorate-General Transport and Energy 39
SafetyNet Deliverable 5.1, Fatal Accident Database Development and Analysis Report
• Pedestrians represent the third largest group in the SafetyNet WP5 fatal accident dataset, accounting for nearly one fifth of the total fatalities recorded.
• By country Italy has the highest proportion of pedestrian fatalities with nearly two thirds of the sample; the country with the second largest proportion is the United Kingdom with nearly one fifth of the fatalities.
• Analysis of age and gender of pedestrian fatalities show that the group is predominantly male, accounting for nearly two thirds of the sample. The group is also skewed towards elderly pedestrians with almost two thirds over the age of 60. Only around 10% of the fatalities occur at ages below 30 years.
• Pedestrians fatally injured in road accidents were predominantly not under the influence of Alcohol, drugs or impaired in any other way. Only around 10% had records of alcohol use with a small proportion recoding drug use.
• Only 4 pedestrians from the sample of 179 were found to have worn high visibility clothing.
• Proportionally more pedestrians were found to have ‘Multiple body regions’ injured compared to car passengers. This is probably the result of the severity of the impacts.
• The second most common body region that caused the pedestrian fatality was an injury to the head. This is perhaps an unsurprising result as aggressive contacts with stiff vehicular structures such as windscreen pillars or the windscreen are very common.
From analysis Appendix 3 • A total of 263 fatal accidents involving 283 mopeds and motorcycles
have been registered in the 5.1 Fatal Accident database. • Most of these accidents happened during summertime; this reflects the
use of this type of vehicles which increases with warm temperatures and dry road conditions
• Over half of powered two wheelers in the sample classify as category A - motorcycles with no power restrictions, according to the European driving license classification system.
• Over one third of motorcycle/moped accidents were classified as driving accidents. These accidents were initiated by a single vehicle loss of control.
• Nearly 40% of motorcycle and moped accidents occurred at or near junctions with GDV accident classifications recording either vehicles turning off or vehicles turning in or crossing.
• The most common accident type (44%) involved a motorcycle/moped in collision with a Car/MPV.
• Slightly over one fifth of all motorcycle/moped accidents (22%) occurred as a single vehicle accident.
• Almost half of all motorcycle/moped accidents occurred in a rural setting. Urban accidents accounted for 41% of all accidents.
• In the immediate location of the accident 45% of motorcycle/moped accidents showed a junction. 29% at t junctions and 13% at cross roads.
• 54% of motorcycle/moped accidents showed no junction influence
Project co-financed by the European Commission, Directorate-General Transport and Energy 40
SafetyNet Deliverable 5.1, Fatal Accident Database Development and Analysis Report
• Considering junction accidents the most frequent motorcycle/moped rider manoeuvre is “Driving round a right hand bend” (about 42%) which highlights a problem with road alignment near intersections.
• Overtaking a moving vehicle is a recorded rider manoeuvre in nearly one third (17%) of junction accidents.
• In most accident situations occurring at junctions a vehicle driver turns left or pulls out from a side road in front of a PTW rider approaching the intersection.
• Single vehicle accidents without junction influence are characterized by the rider driving round in a left or right hand bend (55%) or travelling along a straight road (32%).
• Motorcycle/moped accidents without junction influence show the most frequent rider manoeuvre to be “Driving along a straight road” (49%).
• “Driving round bends” (31%) and “Overtaking moving vehicle” (14%) are other frequent rider manoeuvres in motorcycle/moped accidents away from junctions.
• About 40% of all riders and passengers involved in motorcycle/moped accidents died as a result with only 5% reporting serious injuries.
• In about half of motorcycle and moped cases no crash avoidance manoeuvre is reported for riders, braking is evident in one third of cases while steering is recorded in only 11%.
• In general for all motorcycle and moped classes a collision with another vehicle represents the most harmful event.
• The area of most vehicle damage for car/MPV in collision with a motorcycle is the front of the car (approximately 47% of cases). This is followed by the right side (23%) and the left side (21%).
• The most common age group for motorcycle/moped riders is between 30 and 39 years of age.
• Almost all of the motorcycle and moped riders are male. • In general there is a trend towards higher motorcycle engine power
outputs and elevated pre-impact speeds (where reported). • Over 90% of all motorcycle and moped accidents occurred on a dry road
in dry weather without any influence from road surface contaminants. • Nearly three quarters of accidents occurred in daylight with just under a
quarter occurring in darkness (including darkness with artificial lighting). • The majority of accidents occurred on a straight and level section of road
way. Fewer than 40% had any bend influence. • Two thirds of the motorcycle and moped riders are reported as using a
protective helmet, only 8% record non-use. • Information on protective clothing is limited, however there is an
indication that full protective equipment is more often not worn. From analysis Appendix 4
• Within the motorized vehicle sample single vehicle accidents (SVA) were proportionally very high. The majority of the SVA’s were classed as driving accidents.
• Turning off and turning in/crossing accident types are accidents that involve junctions and a degree of crossing traffic, these account for approximately one third of the accidents.
Project co-financed by the European Commission, Directorate-General Transport and Energy 41
SafetyNet Deliverable 5.1, Fatal Accident Database Development and Analysis Report
• The majority of accidents involving motorised vehicles occurred in two way traffic and, more commonly, road sections divided by a painted centre line.
• The second largest group of accidents were those occurring in two way traffic but physically divided by some type of barrier.
• Accidents on motorways were rare in the database. • The majority of accidents occurred on roads with speed limits of between
81 and 100 km/h. Only a small number of accidents occurred on roads with a speed limit of above 100 km/h.
• Accident locality was predominantly rural, accounting for nearly three quarters of the total accidents.
• Traffic flow conditions were light or normal in over three quarters of the cases, accidents in heavy traffic featured less often.
• Just over half of the accidents involving motorised vehicles occurred on a straight road. Almost all the remaining accidents occurred in a curve with a very slight bias towards left hand bends.
• For single vehicle accidents only ~40% occurred on a straight road and ~60% on a bend, again a slight bias is shown towards the left.
• Just over half of the accidents occurred during daylight hours. A further 38% occurred when it was dark (including dark with artificial lighting).
• Nearly ninety percent of accidents occurred when the weather conditions were dry.
• Among the adverse weather conditions rain gained the largest share with approximately 10% of all motorised vehicle accidents.
• More vehicles had an accident on a wet road surface than those recorded as having an accident when weather conditions were raining, 22% compared to 9%.
• Bicycles and pedestrians had the majority of accidents in two way traffic, divided only by a painted line.
• Nearly half of bicycle and pedestrian accidents occurred at junctions with the largest share at T junctions, this was followed by crossroads.
• Cyclists and pedestrians tend to have accidents on roads with a lower speed limit than do motorised vehicles. The majority of bicycle and pedestrian accidents occur within 31-50 km/h speed limits.
• In contrast with motorised vehicles, most bicycles and pedestrians had an accident in an urban area.
• Cyclists and pedestrians more often had accidents when the traffic flow was normal or light, however, a greater percentage of pedestrians and bicycles had an accident in normal traffic flow than did motorised vehicles.
• The majority of cyclists and pedestrians were travelling on both a flat and straight road.
• For the majority of pedestrian accidents there was no pedestrian crossing facility present however for one fifth there was an uncontrolled, designated crossing.
• Nearly three quarters of cyclists did not have the option of using a dedicated cycle facility.
• The majority of bicycles had accidents in the daytime whereas only half of pedestrians had an accident during the day.
Project co-financed by the European Commission, Directorate-General Transport and Energy 42
SafetyNet Deliverable 5.1, Fatal Accident Database Development and Analysis Report
Project co-financed by the European Commission, Directorate-General Transport and Energy 43
• 43% of pedestrians were travelling in the dark when they were involved in a fatal accident.
• For both bicycles and pedestrians, the weather was more often dry. Very few bicycle accidents occurred during adverse weather conditions.
10 Discussion The aim of the SafetyNet work package 5.1 was to develop a European Fatal Accident database which would allow examination of road, vehicle and highway factors implicated in fatal accidents within the EU. In total, 1,296 fatal accident cases were collected from the 7 participating EU member States using a standardised protocol. The data from these accident cases have been collated, entered onto a database and analysed according to a number of selected research domains. Thus analysis includes a general data overview, an analysis of the nature and circumstances of fatal passenger car accidents, an analysis of the nature and circumstances of fatal pedestrian accidents, and an analysis of the nature and circumstances of fatal two-wheeler accidents. A concern has been raised regarding the use of multi-source data in task 5.1. The raw data sources vary between police reports, judiciary records, road authority data and insurance reports. This varied approach raised questions regarding the independence of the data. However, as task 5.1 began by setting a level of data to be collected from a sample of source material this approach ensured that all partners could collect fatal accident case data to the same level. The effect of bias on the data is therefore considered minimal by the task 5.1 partnership. The study itself clearly demonstrates that the development of a European Fatal Crash database is a realistic prospect and the WP5 partnership strongly recommend that a future activity should be conducted using the protocol developed with task 5.1. Clearly the data have limitations in that there were only 7 EU member states participating in the data collection but this could easily be overcome given appropriate resources and assessing the wider capability and willingness to collect such data from a wider partnership. The 5.1 data clearly have a number of purposes for policy-makers in national administrations and the EC and for other stakeholders. Whilst the method used has limited application to the vehicle manufacturers, it is suggested that a sufficient level of detail exists within the database for the data to be useful for local and regional highway authorities where even a case-by-case review of individual accident cases would be useful.