Project co-financed by the European Commission Directorate General for Mobility and Transport Road Safety Data, Collection, Transfer and Analysis Deliverable 5.9 - Review of Accident causation models used in Road Accident Research Please refer to this report as follows: Hermitte, T (21/09/2012) Title, D5.9 Review of Accident causation models used in Road Accident Research of the EC FP7 project DaCoTA. Grant agreement No TREN / FP7 / TR / 233659 /"DaCoTA" Theme: Sustainable Surface Transport: Collaborative project Project Coordinator: Professor Pete Thomas, Vehicle Safety Research Centre, ESRI Loughborough University, Ashby Road, Loughborough, LE11 3TU, UK Project Start date: 01/01/2010 Duration 36 months Organisation name of lead contractor for this deliverable: GIE RE PSA RENAULT Report Author(s): HERMITTE Thierry (GIE RE PR) Due date of deliverable 31/01/2012 Submission date: 21/09/2012 Project co-funded by the European Commission within the Seventh Framework Programme Dissemination Level (delete as appropriate) PU Public
Transcript
Project co-financed by the European Commission Directorate General for Mobility and Transport
Road Safety Data, Collection, Transfer and Analysis
Deliverable 5.9 - Review of Accident causation models used in Road Accident
Research
Please refer to this report as follows:
Hermitte, T (21/09/2012) Title, D5.9 Review of Accident causation models used in Road Accident Research of the EC FP7 project DaCoTA.
Grant agreement No TREN / FP7 / TR / 233659 /"DaCoTA"
3. Accidents and causes ..................................................................................... 9
3.1. Why do we need to understand accidents? ............................................................. 9
3.2. What is a cause? .................................................................................................... 10
3.3. The need for accident causation models ............................................................... 12
3.4. The systemic approach .......................................................................................... 13
4. The description and analysis of the accident causation models ............... 16
4.1. The ontological point of view: the components of the DVE system and their interactions .......................................................................................................................... 16
4.1.1. The DVE model .................................................................................................. 16
4.1.2. The haddon matrix ............................................................................................. 18
4.2. The Teleological point of view: purposes and motivations .................................... 20
4.3. The functional point of view: the DVE system processes ...................................... 20
4.3.1. The HFF model .................................................................................................. 20
4.3.2. The ACASS model ............................................................................................. 24
4.4. The transformational point of view: the sequence of events .................................. 27
4.4.1. The sequential model......................................................................................... 27
4.4.2. The OTS and VALT models ............................................................................... 30
4.4.3. The domino theory ............................................................................................. 31
4.4.4. The DREAM model ............................................................................................ 33
This report allows us to make the link between WP5 and WP2.
Several models of accident causation exist in road accident research.
The objective of this report is to make an inventory of these models and to identify their basis of formulation. This report is based upon a review of literature and/or previous projects such as the models developed within SafetyNet and TRACE.
A lot is known about accidentology since researchers have been working in this area for several decades, both in the areas of accident causation and in passive safety. The basic method applied in accidentology (and especially in micro accidentology) is that the accident is studied in its chronology: The driving phase, which is, forthe driver, a normal situation with no unexpected demands upon him. The rupture phase, that occurs when an unexpected event (or so-called precipitating event) turns the driving situation into an accident situation for which, suddenly, the demand to the driver exceeds his normal or acceptable ability to respond. The emergency phase, which covers the space and time between rupture and collision. And finally, the crash phase (e.g. impact, collision or roll over).
There are also many ways to analyse accidents and accident mechanisms. For example, LAB (F) developed its own accident analysis model in order to understand the production of the accidental situation. This model was inspired by previous work and especially those carried out by INRETS (F) at the beginning of the nineteen eighties in the south of France and identifies:
The sequential description of the accident circumstances,
The events that could have contributed to convert a driving situation into an accident situation,
The nature of the driver functional failure (e.g. perception, comprehension, decision, action) and the mechanism of the human failure (e.g. driving errors, unavailability of information, under-activation to driving),
An identification of manoeuvres carried out by the drivers and the trajectories of the vehicles.
And finally the sequential correspondence between car kinematics parameters and human cognitive parameters, from the initial conflict situation to the impact. This is the final step of the accident analysis: its reconstruction.
The use of such a model has already produced interesting results. For example, INRETS has examined French in-depth accident data and has proposed to set a classification of accidents based on the production of human failure. The fundamental idea of this approach is to consider the human error not as a cause of the accident but rather as a consequence of malfunctions occurring in the interactions between the driver and his environment. Some causes of the error are considered to be internal to the driver whereas other causes are considered to be external. In this research, the error is exclusively studied, just before the accident situation, from the driver perspective. It could actually be argued that part of the cause of an accident could be nested within the organisation of traffic, production of
Accident causation models report
DaCoTA - WP5 - D5 9 vf.doc 4
vehicles, individual proneness to be involved in accidents, economical context, urban management, or other complex multi-factorial factors.
This report makes an inventory of existing accident causation models published in scientific literatures.
3. Accidents and causes ..................................................................................... 9
3.1. Why do we need to understand accidents? ............................................................. 9
3.2. What is a cause? .................................................................................................... 10
3.3. The need for accident causation models ............................................................... 12
3.4. The systemic approach .......................................................................................... 13
4. The description and analysis of the accident causation models ............... 16
4.1. The ontological point of view: the components of the DVE system and their interactions .......................................................................................................................... 16
4.1.1. The DVE model .................................................................................................. 16
4.1.2. The haddon matrix ............................................................................................. 18
4.2. The Teleological point of view: purposes and motivations .................................... 20
4.3. The functional point of view: the DVE system processes ...................................... 20
4.3.1. The HFF model .................................................................................................. 20
4.3.2. The ACASS model ............................................................................................. 24
4.4. The transformational point of view: the sequence of events .................................. 27
4.4.1. The sequential model......................................................................................... 27
4.4.2. The OTS and VALT models ............................................................................... 30
4.4.3. The domino theory ............................................................................................. 31
4.4.4. The DREAM model ............................................................................................ 33
Traffic crashes have a major impact to European society, in 2008 over 38,000 road users died and over 1.2 million were injured. The economic cost is immense and has been estimated at over €160 billion for the EU 15 alone. The European Commission and National Governments place a high priority on reducing casualty numbers and have a series introduced targets and objectives.
The experience of the best-performing countries is that the most effective policies are based on an evidence-bashed, scientific approach. Information about the magnitude, nature and context of the crashes is essential while detailed analyses of the role of infrastructure, vehicles and road users enables new policies to be developed.
The EU funded SafetyNet project established the European Road Safety Observatory to bring together data and knowledge to support safety policy-making. The project developed the framework of the Observatory and the protocols for the data and knowledge, the ERSO is now a part of the DG-Move website http://ec.europa.eu/transport/road_safety/specialist/index_en.htm.
The DaCoTA project will add to the strength and wealth of information in the Observatory by enhancing the existing data and adding new road safety information. The main areas of work include
Developing the link between the evidence base and new road safety policies
Establishing a Pan-European Accident Investigation Network
Bringing a wide variety of data together for users to manipulate
Predicting accident trends, presenting data to policy makers
Intelligent safety system evaluation
Naturalistic driving observations
In this paper, we report on research activities deriving from WP5 – Safety and eSafety.
WP5 – Safety and eSafety description
Indeed, new intelligent technologies are rapidly being deployed into the transport system with the intention of reducing casualties and improving transport efficiency. Examples include driver information and hazard alert systems as well as autonomous systems that modify vehicle dynamics. The pace of development means that it is difficult to measure casualty reduction or to identify any confounding factors that may reduce system effectiveness. Particular areas concern the introduction of driver distractions, inappropriate system functionality and driver awareness of the limitations of the new systems. The DaCoTA project will establish a consistent approach to the evaluation of such systems once they have been introduced to the market by specifying analytic approaches and new data needs.
DaCoTA aims to address the specific data and analysis needs when evaluating the contribution to safety of new technologies, whether vehicle or road based. The project will develop procedures to identify and update the system functionality in terms of accident risk prevention and injury risk prevention and to identify and update how current technology can address these needs. It will identify gaps in essential data needed to evaluate the safety effectiveness of new technologies and produce guidance on ways such information could be brought together. Finally it will build on previous work to assemble analytic methods specifically designed for technology assessment.
Task 5.2 description – Drivers needs and the validation of technologies
The main objective of this task is to propose a catalogue of safety systems (currently on the market and under development) and to verify to what extent these systems address the real road users‘ needs in terms of accident prevention, accident avoidance and injury prevention or injury mitigation. This innovative aspect has already been covered by the TRACE project (WP4, WP5 and WP6) and deserves to be continuously updated.
Sub-task 5.2.1 description – Accident causation model
An accident causation model is proposed. Since there are several existing models of accident causation, a first task is to make an inventory of these models and to identify their basis of formulation. This is based upon a review of literature and previous projects such as the models developed within SafetyNet and TRACE. This model helps formalise what accident causation is and should be giving particular emphasis towards the consideration of technologies. This model is then the basis for the identification of the nature of data that can be stored in the ERSO.
Accident causation models report
DaCoTA - WP5 - D5 9 vf.doc 9
3. ACCIDENTS AND CAUSES
3.1. Why do we need to understand accidents?
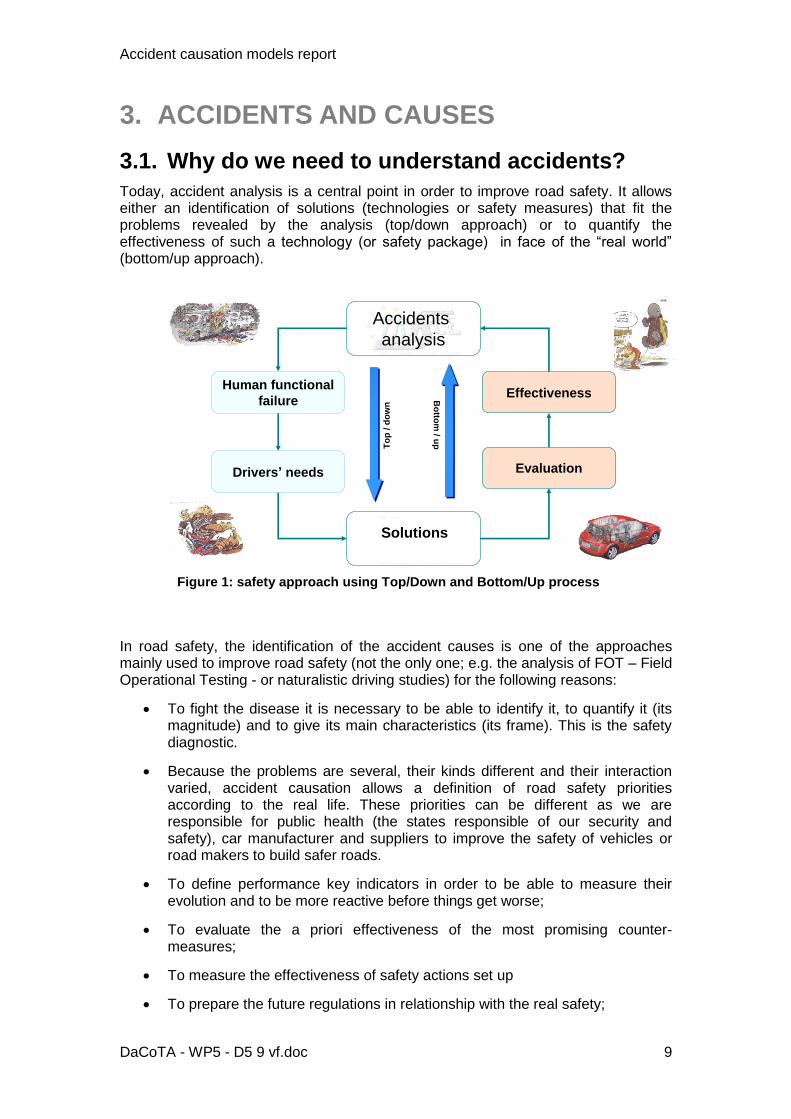
Today, accident analysis is a central point in order to improve road safety. It allows either an identification of solutions (technologies or safety measures) that fit the problems revealed by the analysis (top/down approach) or to quantify the effectiveness of such a technology (or safety package) in face of the ―real world‖ (bottom/up approach).
In road safety, the identification of the accident causes is one of the approaches mainly used to improve road safety (not the only one; e.g. the analysis of FOT – Field Operational Testing - or naturalistic driving studies) for the following reasons:
To fight the disease it is necessary to be able to identify it, to quantify it (its magnitude) and to give its main characteristics (its frame). This is the safety diagnostic.
Because the problems are several, their kinds different and their interaction varied, accident causation allows a definition of road safety priorities according to the real life. These priorities can be different as we are responsible for public health (the states responsible of our security and safety), car manufacturer and suppliers to improve the safety of vehicles or road makers to build safer roads.
To define performance key indicators in order to be able to measure their evolution and to be more reactive before things get worse;
To evaluate the a priori effectiveness of the most promising counter-measures;
To measure the effectiveness of safety actions set up
To prepare the future regulations in relationship with the real safety;
Accidents
analysis
Technologies
Drivers’ needs Evaluation
EffectivenessHuman functional
failure
To
p /
do
wn
Bo
ttom
/ up
Solutions
Figure 1: safety approach using Top/Down and Bottom/Up process
Accident causation models report
DaCoTA - WP5 - D5 9 vf.doc 10
To develop some performance tests to be sure that the safety systems well answer to the regulations and the real safety;
To know for each actor its responsibility as a part of the disease;
In a competitive world, to be able to place oneself in relation to the others. For example make comparison between countries or regions, or between products proposed by industries;
To identify the lack in the data collection displayed by the analysis and make propositions for the update.
To anticipate the future problems on the road.
3.2. What is a cause?
According to the review of the literature, the accident seems to be well defined:
―A sudden and unintentional event resulting in damage to property, people or environment.‖
Elvik, 2004
―An accident can be defined as a short, sudden, and unexpected event or occurrence that results in an unwanted and undesirable outcome.‖
Hollnagel, 2004
So, the accident is not really predictable and can cause negative consequences such as fatalities, injuries, near misses, damaged materials or … shattered nerves.
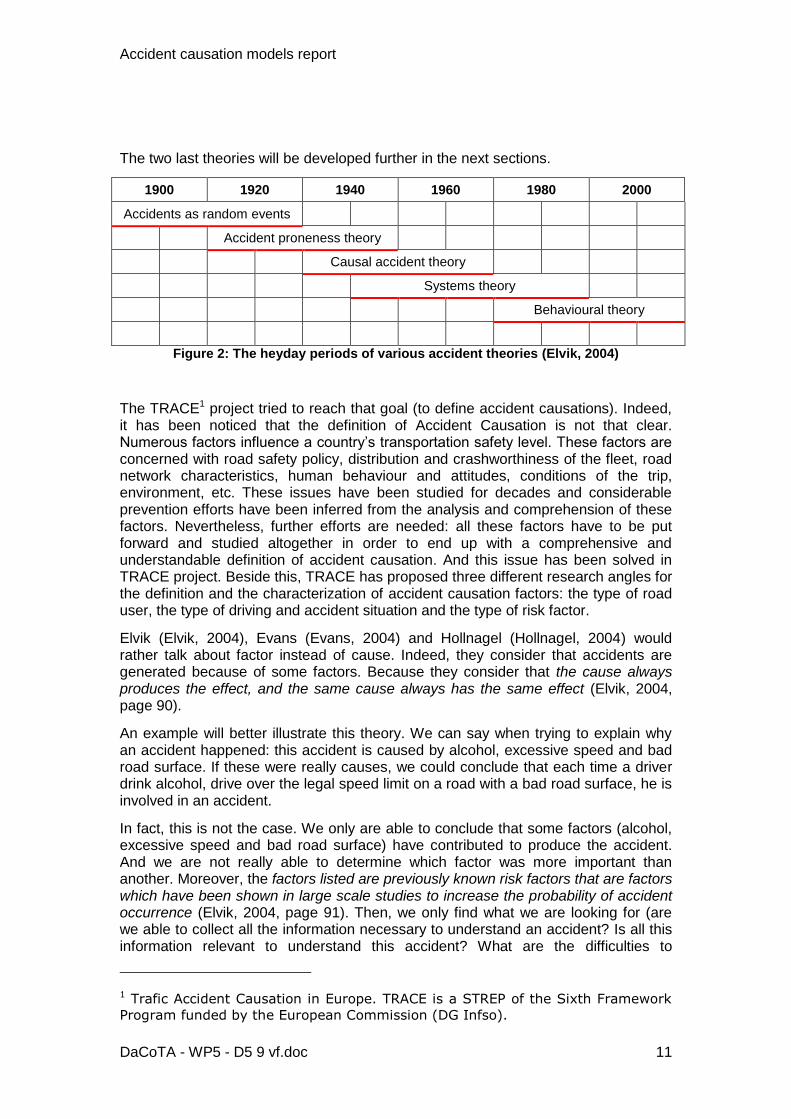
If researchers can agree on the word accident, the exercise is not so easy if we want to define a cause and especially a road accident cause. Historically (see Figure 2), we have not always talked about road accident causes. In the beginning of the 20th century, an accident was considered as a random event. Ten years after the theory explaining that only drivers with ―personality disorder‖ were involved in accidents appeared (if we cannot find a plausible reason for what people do, we, we classify them as psychologically disturbed or even psychotic, Hollnagel, 2004, page 38).
It is only in the 1940s and 1950s, when the number of vehicles increased, that the two previous theories became obsolete. The causal accident theory argued that it was only by finding the real causes of accidents that successful prevention was possible (Elvik, 2004, page 88).
Accident causation models report
DaCoTA - WP5 - D5 9 vf.doc 11
The two last theories will be developed further in the next sections.
1900 1920 1940 1960 1980 2000
Accidents as random events
Accident proneness theory
Causal accident theory
Systems theory
Behavioural theory
Figure 2: The heyday periods of various accident theories (Elvik, 2004)
The TRACE1 project tried to reach that goal (to define accident causations). Indeed, it has been noticed that the definition of Accident Causation is not that clear. Numerous factors influence a country‘s transportation safety level. These factors are concerned with road safety policy, distribution and crashworthiness of the fleet, road network characteristics, human behaviour and attitudes, conditions of the trip, environment, etc. These issues have been studied for decades and considerable prevention efforts have been inferred from the analysis and comprehension of these factors. Nevertheless, further efforts are needed: all these factors have to be put forward and studied altogether in order to end up with a comprehensive and understandable definition of accident causation. And this issue has been solved in TRACE project. Beside this, TRACE has proposed three different research angles for the definition and the characterization of accident causation factors: the type of road user, the type of driving and accident situation and the type of risk factor.
Elvik (Elvik, 2004), Evans (Evans, 2004) and Hollnagel (Hollnagel, 2004) would rather talk about factor instead of cause. Indeed, they consider that accidents are generated because of some factors. Because they consider that the cause always produces the effect, and the same cause always has the same effect (Elvik, 2004, page 90).
An example will better illustrate this theory. We can say when trying to explain why an accident happened: this accident is caused by alcohol, excessive speed and bad road surface. If these were really causes, we could conclude that each time a driver drink alcohol, drive over the legal speed limit on a road with a bad road surface, he is involved in an accident.
In fact, this is not the case. We only are able to conclude that some factors (alcohol, excessive speed and bad road surface) have contributed to produce the accident. And we are not really able to determine which factor was more important than another. Moreover, the factors listed are previously known risk factors that are factors which have been shown in large scale studies to increase the probability of accident occurrence (Elvik, 2004, page 91). Then, we only find what we are looking for (are we able to collect all the information necessary to understand an accident? Is all this information relevant to understand this accident? What are the difficulties to
1 Trafic Accident Causation in Europe. TRACE is a STREP of the Sixth Framework
Program funded by the European Commission (DG Infso).
Accident causation models report
DaCoTA - WP5 - D5 9 vf.doc 12
collecting this information and what is its contribution to understanding in the accident?). In an accident we have the feeling that there is a part of unpredictability which takes largely part into the accident genesis. Indeed, an accident belongs to a complex system and by definition we are not able to understand everything and every links of the system components.
Factors are only the explanatory elements of a model explaining the probability of an accidents occurrence. There is still an error or an unpredictability which does not give us the possibility to be 100% sure of accident causes.
3.3. The need for accident causation models
―Accident causation models differ in many fundamental ways. At one level, they may differ in their area of application, their purpose and their focus. They may also differ
significantly in their general structure, their inputs and outputs.‖
Lehto, 1991
―It is postulated that if humans were perfectly rational, and always in perfect control of hazards that are subject to human control, there would be very few serious
accidents‖
Elvik, 2005
A model is a reference frame which helps people to talk about and to be understood in a specific topic. The model can grant references, definitions, and rules.
Nevertheless, a model has a specific aim. For instance, Figure 2 shows the different theories or models used in the last 100 years. The first model – ―accidents as random events‖ - followed a simple ―rule‖ (modelling assumption): an accident is a random event. So there was no reason to look for causes.
The second model – ―Accident proneness theory‖ - explained that only some drivers with specific characteristics had accidents. And the causal model determined causes which led to the accidents (but we demonstrated earlier that it was not really causes but rather factors).
All these theories or models follow a rule and we can‘t say that all of them are false. A part of all of them is true.
And as far as accident is a complex system and the complete scientific explanation
for accidents is not possible (see 3.2), it is necessary to create accident causation
models which guide the researcher in finding solutions to avoid accidents.
“Behavior in road accidents is complex, within a complex system that consists of the triptych Driver-Vehicle-Environment. It is not the number of components involved in the accident occurrence, neither the number of variables interacting during the accident, nor the number of their interactions, that make the accident complex. But, most of all, it is the impossibility to predict the DVE system behavior that entails this
Accident causation models report
DaCoTA - WP5 - D5 9 vf.doc 13
complexity. This unpredictability is notably due to the fact that human actions are strongly involved in accident causation, and that human behavior is unpredictable.”
Ben Ahmed, 2005
3.4. The systemic approach
“These models (systemic accident models) endeavour to describe the characteristic performance on the level of the system as a whole, rather than on the level of specific cause-effect « mechanisms » or even epidemiological factors.”
Hollnagel, 2004
Most of the theories (see Figure 2) previously presented or quoted have been used in road safety, continuing today, focusing on one specific point of view. The human is at the centre of the regulation. He has to interact with the machine (drive his car: hold the steering wheel, change direction, brake, change gear, declutch, accelerate, look at mirrors, etc.), to interact with an unsettled environment (lighting conditions, weather conditions, road surface, road geometry, road signs, etc.), to interact with the other users (pedestrian, 2 wheelers users, etc.). All these factors and interactions make that the accident causes are multiple, not unique, can be independent from each other, not having the same end, with different degree of implication and can be different depending on who makes the analysis, etc. in others words a not predictable system.
The challenge is to build a model for a system (the road accident system), which is a priori not foreseeable.
A solution consists to use the theory based on the systemic approach. The target is to represent the systems as a ―general system‖, i.e. not as an aggregate of independent and understandable entities but rather as a system which is organized, which works, which evolves and which is finalized.
The theory of the systems was developped by Ludwig von Bertalanffy (Bertalanffy, 1975), William Ross Ashby and others between 1940s and 1970s and takes its inspiration from the previous works on the cybernetic (Wienner, 1948). Since, this theory has evolved in several movements in United States and in France.
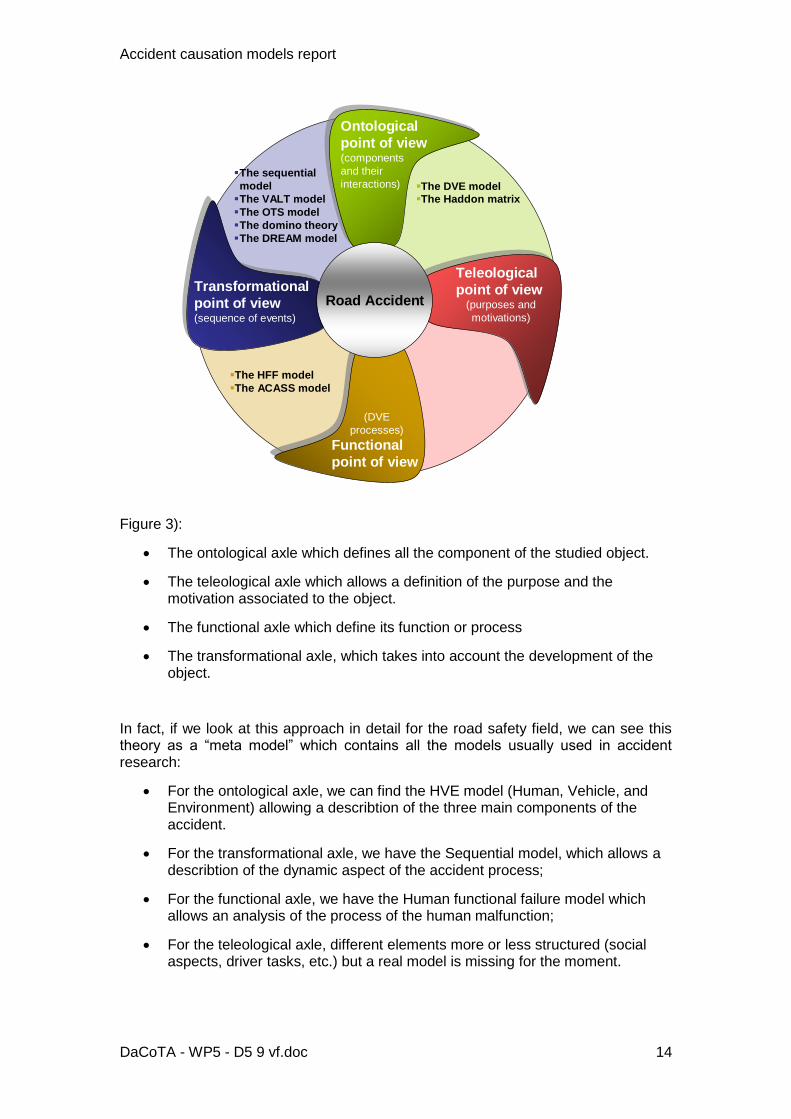
All the interest of this new theory relies on the various dimensions allowing defining an object. In this theory a system can be viewed by four fundamental axles (see
Accident causation models report
DaCoTA - WP5 - D5 9 vf.doc 14
Road Accident
Ontological
point of view(components
and their
interactions)
Teleological
point of view(purposes and
motivations)
(DVE
processes)
Functional
point of view
Transformational
point of view(sequence of events)
The DVE modelThe Haddon matrix
The HFF model
The ACASS model
The sequential
model
The VALT model
The OTS model
The domino theory
The DREAM model
Figure 3):
The ontological axle which defines all the component of the studied object.
The teleological axle which allows a definition of the purpose and the motivation associated to the object.
The functional axle which define its function or process
The transformational axle, which takes into account the development of the object.
In fact, if we look at this approach in detail for the road safety field, we can see this theory as a ―meta model‖ which contains all the models usually used in accident research:
For the ontological axle, we can find the HVE model (Human, Vehicle, and Environment) allowing a describtion of the three main components of the accident.
For the transformational axle, we have the Sequential model, which allows a describtion of the dynamic aspect of the accident process;
For the functional axle, we have the Human functional failure model which allows an analysis of the process of the human malfunction;
For the teleological axle, different elements more or less structured (social aspects, driver tasks, etc.) but a real model is missing for the moment.
Accident causation models report
DaCoTA - WP5 - D5 9 vf.doc 15
Its applications can be numerous in road safety, in particular to analyze databases and to report weaknesses on points of view not well documented (Ben Ahmed, 2005).
Road Accident
Ontological
point of view(components
and their
interactions)
Teleological
point of view(purposes and
motivations)
(DVE
processes)
Functional
point of view
Transformational
point of view(sequence of events)
The DVE modelThe Haddon matrix
The HFF model
The ACASS model
The sequential
model
The VALT model
The OTS model
The domino theory
The DREAM model
Figure 3: A new framework for accident description based on systemic approach – DVE : Driver vehicle Environment – OTS: On The Spot – HFF: Human Functional
Failure – VALT: It is the Traffic Safety Committee of Insurance Companies in Finland – DREAM: Driving Reliability and Error Analysis Method
Figure 3 illustrates the systemic approach and the 4 complementary points of view. For all of them, some accident causation models have been identified. These models will be developed and explained in the next section.
Accident causation models report
DaCoTA - WP5 - D5 9 vf.doc 16
4. THE DESCRIPTION AND ANALYSIS OF THE ACCIDENT CAUSATION MODELS
Many stakeholders, from industries (eg. vehicle manufacturers, car parts manufacturers), from health community (government, insurances, non profit organizations helping users, family involved directly or indirectly in an accident…), from research (research scientists, designers, engineers…) take a part in road safety improvement. And each of them has their own skills and perception of the problem and its solution. The aim of this report is first to show a global view of the complex road system, considering all its components and the 4 axis presented above. And then to detail some accident causation models which are largely used by road safety stakeholders.
4.1. The ontological point of view: the components of the DVE system and their interactions
This point of view details the components of the road system (user, vehicle and environment). As an illustration, it helps the stakeholders to understand to whom or to which environment their actions are addressed.
Then, for instance, ministries are able to identify to which road users they need to aim research action programs or public awareness campaigns:
In France, 25% of fatalities are Powered Two Wheelers (PTW) users => this is a big issue.
Vehicle manufacturers identify which kind of vehicles need to be further developed because their risks of accident increase.
Almost 50% of accidents could be avoided if a 4 stars rated EuronCAP vehicle would have been equipped with ESC and EBA
Researchers develop technologies and systems according to the need of users: do we need to develop or to have a compulsory system inside a vehicle if the drivers will not use it?
Models of this type clearly are useful for organizing and prioritising safety efforts. And such approaches are entirely descriptive.
4.1.1. The DVE model
4.1.1.1. What is the DVE system model?
The Driver – Vehicle - Environment model gives the possibility to analyse the accident according to 3 axes – the driver, the vehicle and the environment – and through the links between this 3 axes. The description of the system Driver-Vehicle-
Accident causation models report
DaCoTA - WP5 - D5 9 vf.doc 17
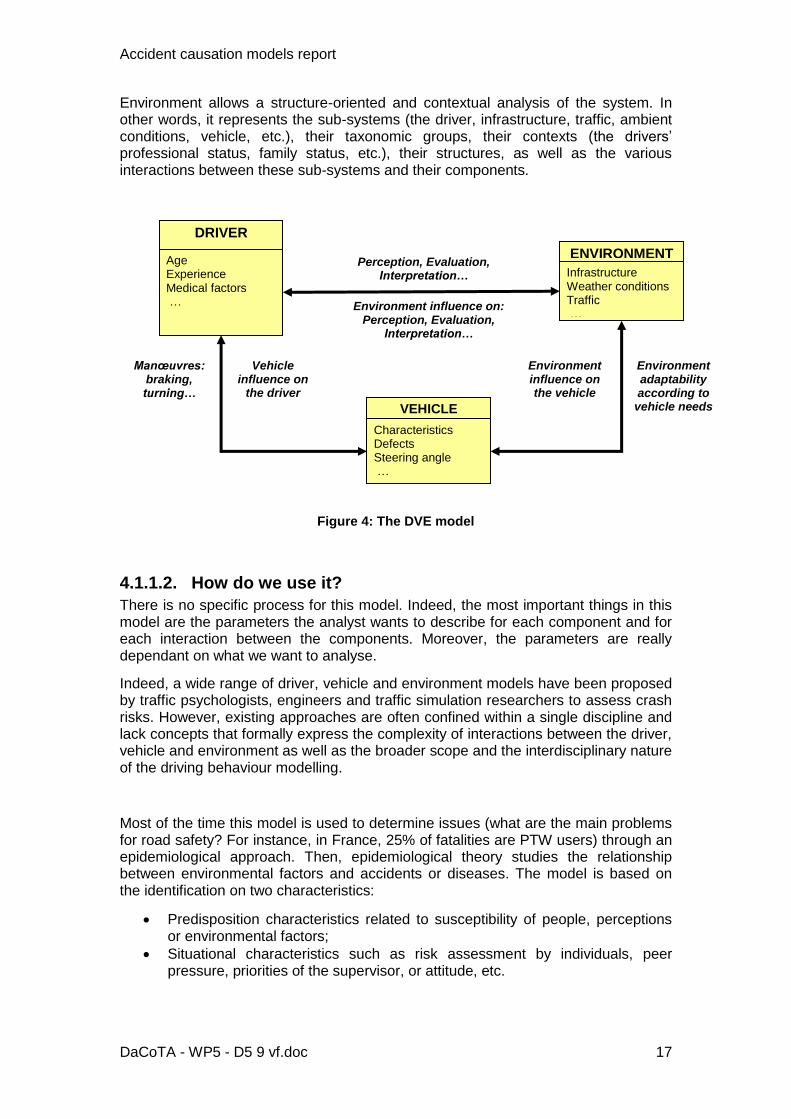
Environment allows a structure-oriented and contextual analysis of the system. In other words, it represents the sub-systems (the driver, infrastructure, traffic, ambient conditions, vehicle, etc.), their taxonomic groups, their contexts (the drivers‘ professional status, family status, etc.), their structures, as well as the various interactions between these sub-systems and their components.
Figure 4: The DVE model
4.1.1.2. How do we use it?
There is no specific process for this model. Indeed, the most important things in this model are the parameters the analyst wants to describe for each component and for each interaction between the components. Moreover, the parameters are really dependant on what we want to analyse.
Indeed, a wide range of driver, vehicle and environment models have been proposed by traffic psychologists, engineers and traffic simulation researchers to assess crash risks. However, existing approaches are often confined within a single discipline and lack concepts that formally express the complexity of interactions between the driver, vehicle and environment as well as the broader scope and the interdisciplinary nature of the driving behaviour modelling.
Most of the time this model is used to determine issues (what are the main problems for road safety? For instance, in France, 25% of fatalities are PTW users) through an epidemiological approach. Then, epidemiological theory studies the relationship between environmental factors and accidents or diseases. The model is based on the identification on two characteristics:
Predisposition characteristics related to susceptibility of people, perceptions or environmental factors;
Situational characteristics such as risk assessment by individuals, peer pressure, priorities of the supervisor, or attitude, etc.
Age Experience Medical factors …
DRIVER
Infrastructure Weather conditions Traffic …
ENVIRONMENT
Characteristics Defects Steering angle …
VEHICLE
Perception, Evaluation, Interpretation…
Environment influence on: Perception, Evaluation,
Interpretation…
Manœuvres: braking, turning…
Vehicle influence on
the driver
Environment influence on the vehicle
Environment adaptability according to
vehicle needs
Accident causation models report
DaCoTA - WP5 - D5 9 vf.doc 18
The two characteristics, taken together, can result in or prevent conditions that might result in accident or illness. For example, a worker who is susceptible to peer pressure is more likely to have an occupational accident or illness.
4.1.1.3. What are the limits of this model?
The lack of methodology itself (as presented above) is a limit of this model. Indeed, information coming from different institute cannot be systematically gathered with this model. It depends on which question you need to answer or on which problem you want to solve your problem. For instance, a government would probably like to know what the issues in Europe are (for instance, thanks to CARE database, we know that almost 50% of fatalities in Europe are vulnerable road users).
A car manufacturer point of view, would rather be interested in pre-crash situations: from the TRACE project, we know that overtaking represents 18 to 38% of all accidents where at least one specific maneuver is performed, Changing lane 11 to 19% and Turning left 10 to 43% according to the country.2
4.1.1.4. What is the level or what are the levels of details of the model?
The parameters which need to be collected for this model have different levels of details.
Indeed, many European countries have their own national injury accident database. Most of the time, the information is collected by police. This information is not really detailed and is descriptive. And the aggregation of this information is generally used by governments or research institute to determine global issues.
Other research institutes follow the same causation model but collect more detailed data about the accident: the curve radius, the time since the departure, the vehicle safety systems…
The level of details depends on the need of the model users.
4.1.2. The haddon matrix
4.1.2.1. What is the haddon matrix model?
The Haddon Matrix is the most commonly used paradigm in the injury prevention field.
Developed by William Haddon in 1970, the matrix looks at factors related to human, vehicle, and environmental attributes before, during and after an accident. By utilizing this framework, one can then think about evaluating the relative importance of different factors and design interventions.
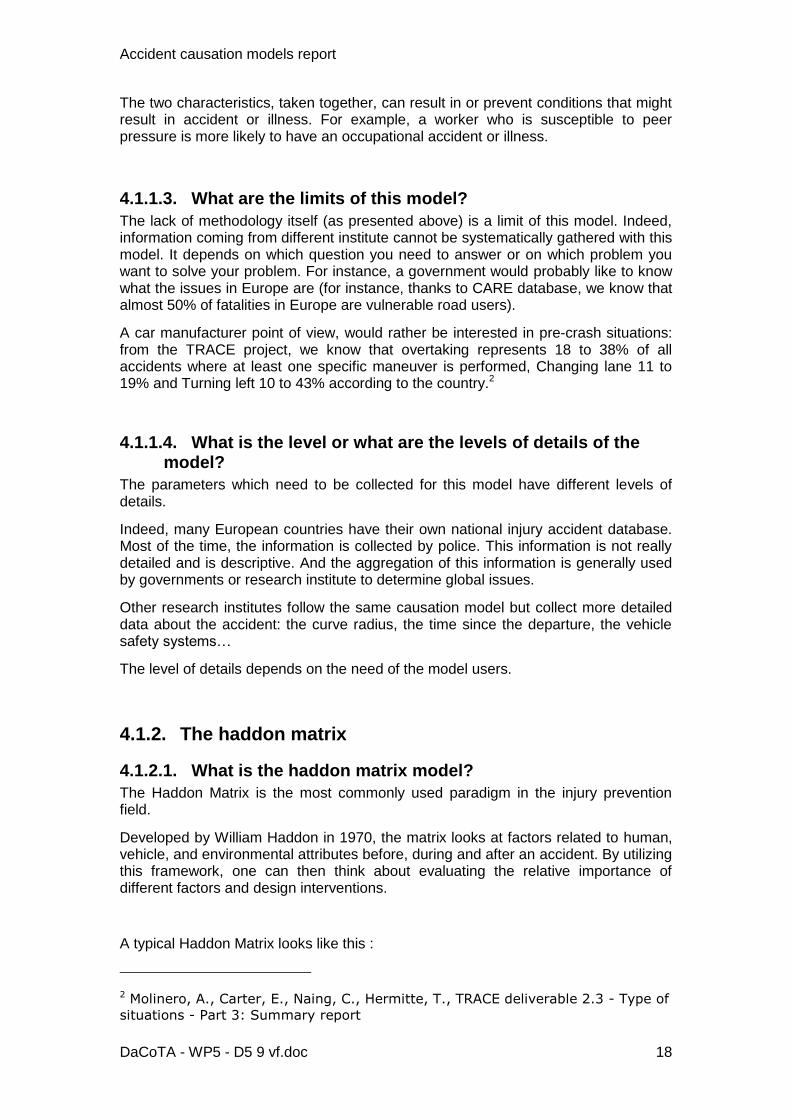
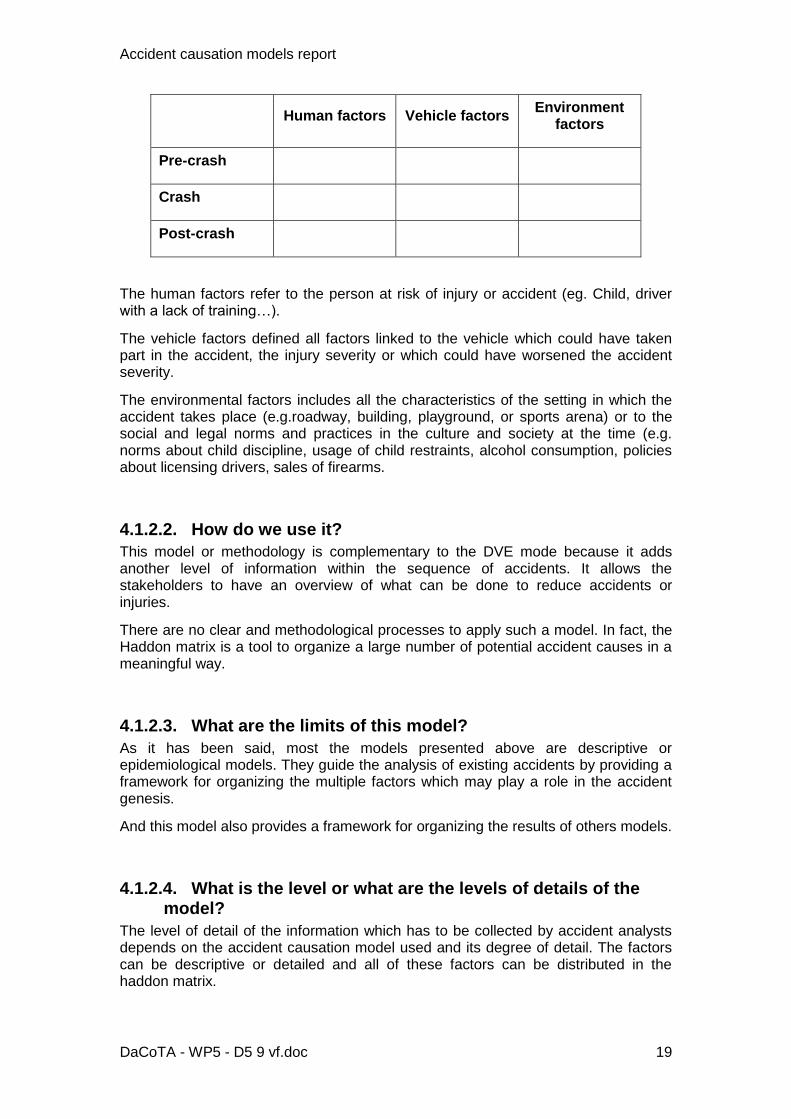
A typical Haddon Matrix looks like this :
2 Molinero, A., Carter, E., Naing, C., Hermitte, T., TRACE deliverable 2.3 - Type of
situations - Part 3: Summary report
Accident causation models report
DaCoTA - WP5 - D5 9 vf.doc 19
Human factors Vehicle factors Environment
factors
Pre-crash
Crash
Post-crash
The human factors refer to the person at risk of injury or accident (eg. Child, driver with a lack of training…).
The vehicle factors defined all factors linked to the vehicle which could have taken part in the accident, the injury severity or which could have worsened the accident severity.
The environmental factors includes all the characteristics of the setting in which the accident takes place (e.g.roadway, building, playground, or sports arena) or to the social and legal norms and practices in the culture and society at the time (e.g. norms about child discipline, usage of child restraints, alcohol consumption, policies about licensing drivers, sales of firearms.
4.1.2.2. How do we use it?
This model or methodology is complementary to the DVE mode because it adds another level of information within the sequence of accidents. It allows the stakeholders to have an overview of what can be done to reduce accidents or injuries.
There are no clear and methodological processes to apply such a model. In fact, the Haddon matrix is a tool to organize a large number of potential accident causes in a meaningful way.
4.1.2.3. What are the limits of this model?
As it has been said, most the models presented above are descriptive or epidemiological models. They guide the analysis of existing accidents by providing a framework for organizing the multiple factors which may play a role in the accident genesis.
And this model also provides a framework for organizing the results of others models.
4.1.2.4. What is the level or what are the levels of details of the model?
The level of detail of the information which has to be collected by accident analysts depends on the accident causation model used and its degree of detail. The factors can be descriptive or detailed and all of these factors can be distributed in the haddon matrix.
Accident causation models report
DaCoTA - WP5 - D5 9 vf.doc 20
4.2. The Teleological point of view: purposes and motivations
This axle gives the possibility to explain why a system exists: why a driver in his car is driving, why a road needs to have a certain radius, why users use their car instead of public transport…? Through this axle, stakeholders can understand the constraints and the needs of each components of the system.
No model on this axle has been found in the literature.
4.3. The functional point of view: the DVE system processes
This functional point of view gives the possibility to model how the system is functioning: how does a driver drive? How does a driver perform a task? How does an infrastructure guide the vehicles? How does a law structure a vehicle development, the interaction between the users and the development of a system….?
4.3.1. The HFF model
4.3.1.1. What is the HFF model?
Most safety studies come to the conclusion that human error is the main cause of accidents. Nevertheless, such a conclusion has not proven to be efficient in its capacity to offer adequate means to fight against this error. In a purpose of better qualifying accident causation, TRACE (Traffic Accident Causation in Europe project), has investigated the different types of 'errors' with the help of a classification model formalizing typical 'Human Functional Failures' (HFF) involved in road accidents. These failures are not seen as the causes of road accidents, but as the result of the driving system malfunctions which can be found in its components (user/road/vehicle) and their defective interactions (unfitness of an element with another). Such a view tries to extend 'accident causation' analysis toward understanding, not only the causes, but also the processes involved in the accident production. So the purpose is to go further than establishing the facts, toward making a diagnosis on their production process. The usefulness of this diagnosis is to help define countermeasures suited to the malfunction processes in question. Three main information needs to be studied during the in-depth analysis, using the Human Functional Failure analysis: the Human Functional Failure, the explanatory element and the degree of involvement of the user. They are further explained in the following paragraphs (using the following references Van Elslande et al. (2007) and Naing et al. (2007).
This model is linked to the sequential model (see 4.4.1). Indeed, the Human
Functional Failure is focused on the analysis that follows the rupture phase, which is a key stage that pitches the driver from a normal driving situation into an impaired one.
Accident causation models report
DaCoTA - WP5 - D5 9 vf.doc 21
4.3.1.2. How do we use it?
The Human Functional Failures
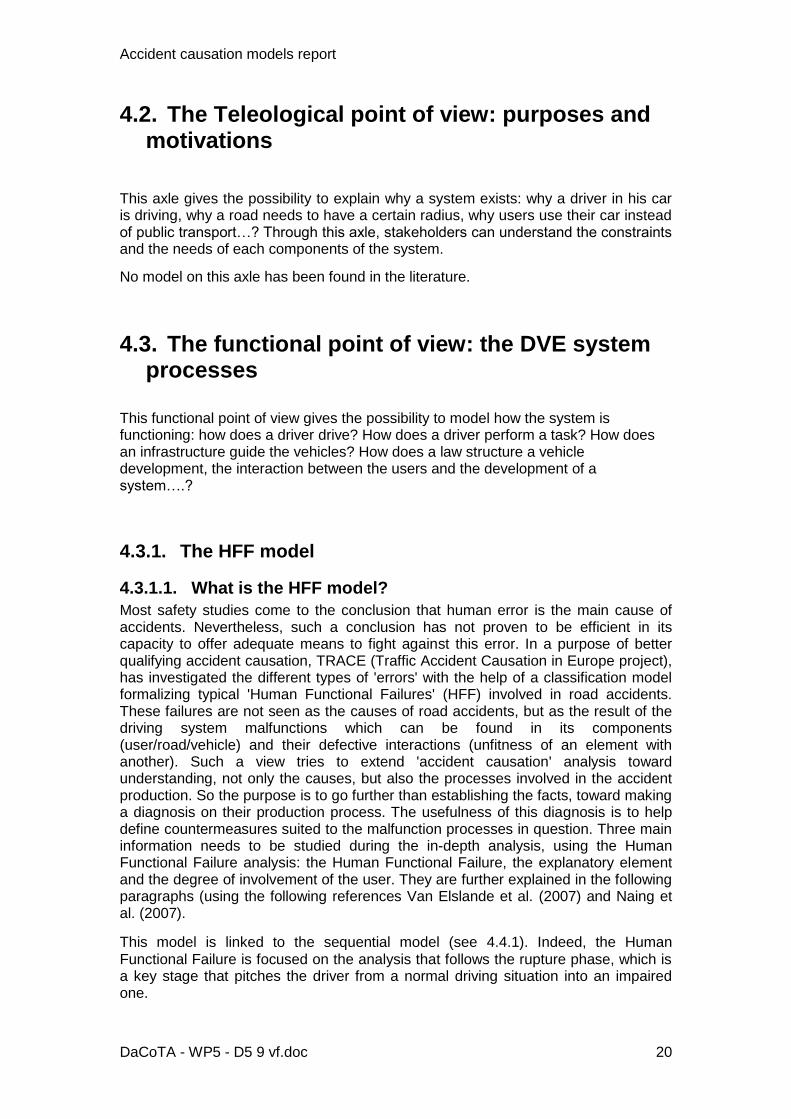
Failures are delineated below following a sequential theoretical chain of human functions involved in information gathering, processing, decision and action (see Figure 5). It does not imply that drivers function in a linear way. In the common functioning of the individual, there are numerous feedbacks between the various modules, and the data processing is strongly looped. But involving accidents as in the analysis which follows, we stop this functional buckle in the stage of rupture in the progress of the driver, as he is confronted with an unexpected difficulty which is going to lead him to lose the control of the situation which was more or less suitably regulated so far. It is thus a grid of analysis of the dysfunctions and not a model of functioning or dysfunction of the operator.
Figure 5: Stages of Human Function failure
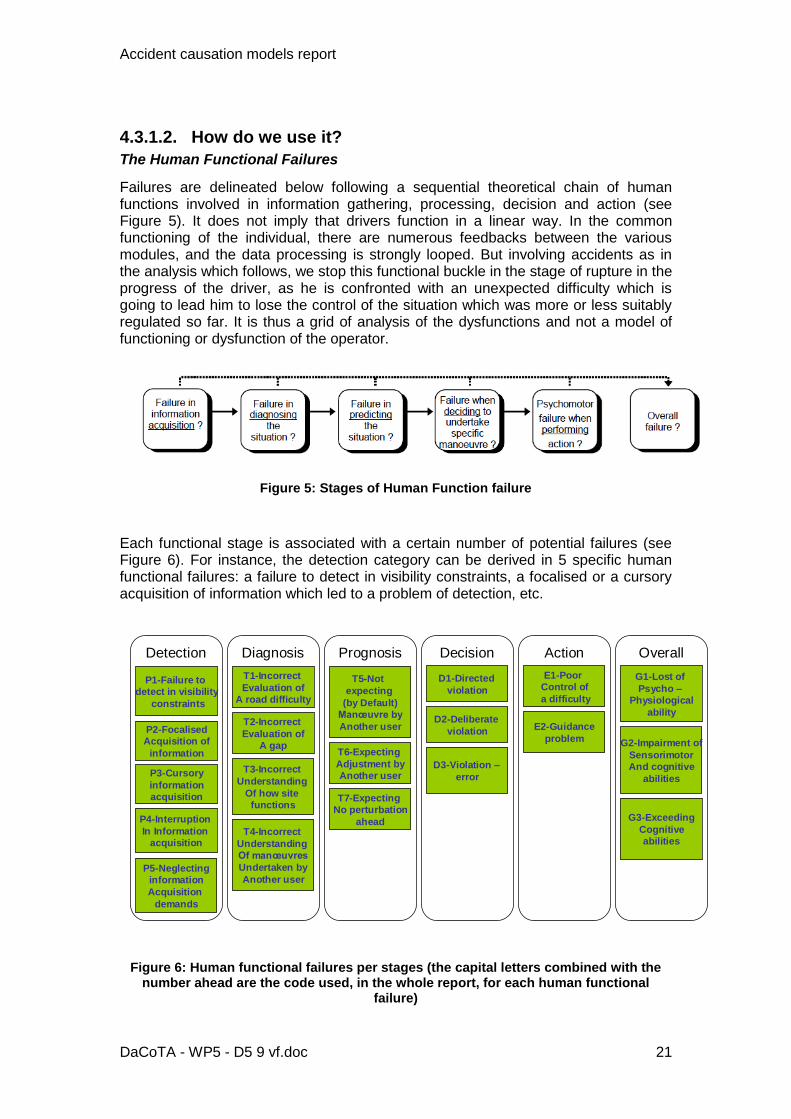
Each functional stage is associated with a certain number of potential failures (see Figure 6). For instance, the detection category can be derived in 5 specific human functional failures: a failure to detect in visibility constraints, a focalised or a cursory acquisition of information which led to a problem of detection, etc.
OverallActionDecisionPrognosisDiagnosisDetection
P1-Failure to
detect in visibility
constraints
P2-Focalised
Acquisition of
information
P3-Cursory
information
acquisition
P4-Interruption
In Information
acquisition
P5-Neglecting
information
Acquisition
demands
T1-Incorrect
Evaluation of
A road difficulty
T2-Incorrect
Evaluation of
A gap
T3-Incorrect
Understanding
Of how site
functions
T4-Incorrect
Understanding
Of manœuvres
Undertaken by
Another user
T5-Not
expecting
(by Default)
Manœuvre by
Another user
T6-Expecting
Adjustment by
Another user
T7-Expecting
No perturbation
ahead
D1-Directed
violation
D2-Deliberate
violation
D3-Violation –
error
E1-Poor
Control of
a difficulty
E2-Guidance
problem
G1-Lost of
Psycho –
Physiological
ability
G2-Impairment of
Sensorimotor
And cognitive
abilities
G3-Exceeding
Cognitive
abilities
Figure 6: Human functional failures per stages (the capital letters combined with the number ahead are the code used, in the whole report, for each human functional
failure)
Accident causation models report
DaCoTA - WP5 - D5 9 vf.doc 22
The explanatory elements
Explanatory elements are factors which lead to human functional failures. Human failures are explained by factors characterizing the state of system, i.e. the defects of its components (human and other) and of their interactions. These factors are then considered as the explanatory elements of the road users' incapacity to adapt to the situation in hand. The combination of these elements explains the fact that the appropriate function failed in attaining the wanted outcome.
They are classified according to three main categories which are the three components of the system Driver-Vehicle-Environment.
A grid of all the relevant elements contributing to human failures is used (Van Elslande, 2007). These elements differentiate those factors coming from the "human" part of the system, from those coming from the layout, the traffic interaction and the vehicle.
For instance, when a user has incorrectly evaluated a road difficulty (it is a problem of diagnosis, see Figure 6) because of his speed, his over experience of the route, his state (he is in a hurry), etc. All these factors are the ones which explain the failure.
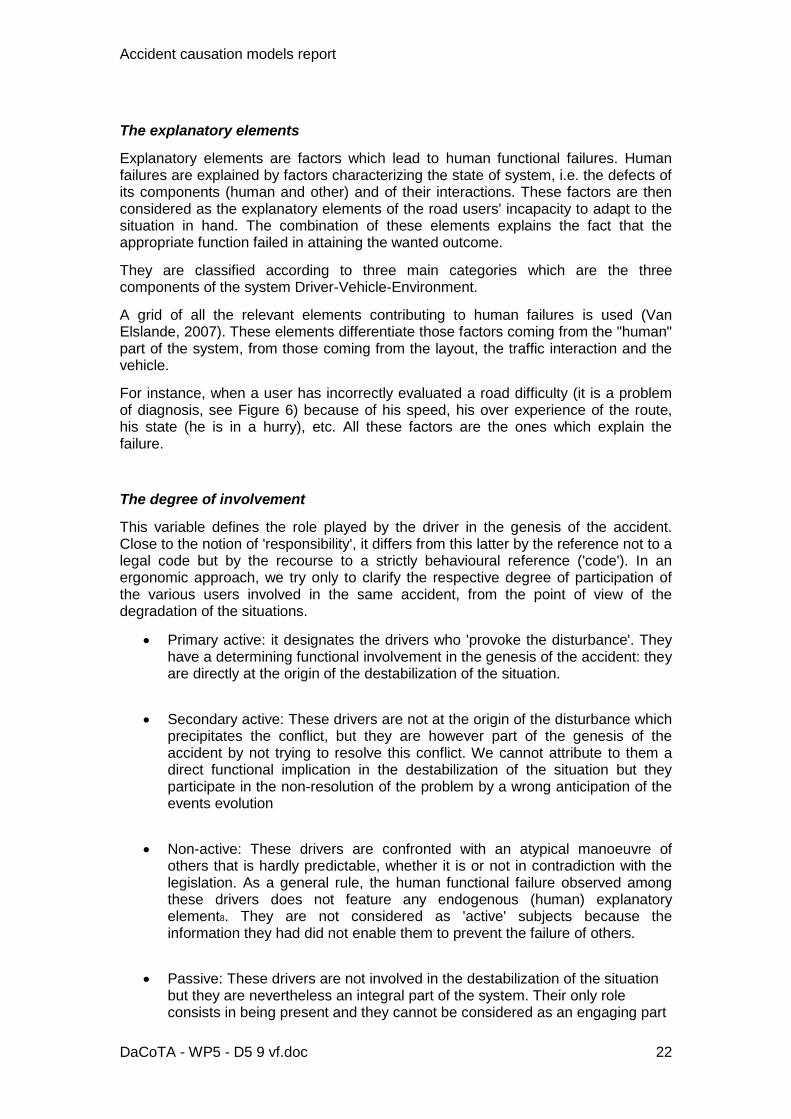
The degree of involvement
This variable defines the role played by the driver in the genesis of the accident. Close to the notion of 'responsibility', it differs from this latter by the reference not to a legal code but by the recourse to a strictly behavioural reference ('code'). In an ergonomic approach, we try only to clarify the respective degree of participation of the various users involved in the same accident, from the point of view of the degradation of the situations.
Primary active: it designates the drivers who 'provoke the disturbance'. They have a determining functional involvement in the genesis of the accident: they are directly at the origin of the destabilization of the situation.
Secondary active: These drivers are not at the origin of the disturbance which precipitates the conflict, but they are however part of the genesis of the accident by not trying to resolve this conflict. We cannot attribute to them a direct functional implication in the destabilization of the situation but they participate in the non-resolution of the problem by a wrong anticipation of the events evolution
Non-active: These drivers are confronted with an atypical manoeuvre of others that is hardly predictable, whether it is or not in contradiction with the legislation. As a general rule, the human functional failure observed among these drivers does not feature any endogenous (human) explanatory element8. They are not considered as 'active' subjects because the information they had did not enable them to prevent the failure of others.
Passive: These drivers are not involved in the destabilization of the situation but they are nevertheless an integral part of the system. Their only role consists in being present and they cannot be considered as an engaging part
Accident causation models report
DaCoTA - WP5 - D5 9 vf.doc 23
in the disturbance. No measure may logically be beneficial to them, except to act on the other driver.
4.3.1.3. What are the limits of this model?
First of all, the use of this model requires a good understanding and knowledge on
the sequential analysis of the accident (see 4.4.1). It will help the analyst to have a
good overview of factors which led to the functional failure.
The work is based on an in-depth analysis of detailed accident data including, among other detailed data, registered interviews of the drivers, in the purpose of making them precisely explain their perceptions of the facts, their decisions, actions, the difficulties they encountered, etc.
4.3.1.4. What is the level or what are the levels of details of the model?
For this model, different level of detail exists for two parameters: the Human Functional Failures and the explanatory elements.
Indeed, for the HFF, Figure 5 and Figure 6 show that first there is global stages of human malfunctions. It can be a problem of detection, diagnosis, prognosis…And then, there is another level which detailed the functional failures that can potentially be found in In-Depth data. For instance, we know that the driver had a problem of detection, and this one was a failure to detect in visibility constraints.
The explanatory elements have too, different levels of detail. The same factors can appear at different stages of the accident and may have different roles, being contributing, triggering, or aggravating factors to the process. A specific factor may already be present at the start of the ‗Driving phase‘ (e.g. alcohol intoxication) and this would become a ‗Contributor‘ when the ‗Triggering‘ factor is introduced (e.g. animal runs out into the carriageway). The fact that the driver is ‗speeding‘ when the animal appears both ‗Aggravates‘ the likelihood of the functional failure occurring and also the severity of the outcome (i.e. more severe injuries).
As part of classifying factors which lead to human functional failure, three integrated levels of categorisation are proposed, corresponding to the types of real world accident data commonly available to analysts. This ensures that the classifications are versatile and flexible enough to be of use in accident data analysis at the following levels of detail:
1. Descriptive – When undertaking analysis using descriptive level (police or national-level) data;
2. Generic – For use in analysis of the failure generating scenarios in Task 5.3;
3. In-depth – When undertaking analysis using in-depth accident data.
The ‗generic‘ level overlaps partly with both ‗descriptive‘ and ‗in-depth‘ levels. Therefore, this level could also be used for analysis of descriptive data where the information collected is at a greater depth than at the ‗Descriptive‘ level of
Accident causation models report
DaCoTA - WP5 - D5 9 vf.doc 24
classification (so that information is not lost), or alternatively could be used for analysis of in-depth data when the information collected is not as detailed as in the ‗in-depth‘ classification.
4.3.2. The ACASS model
4.3.2.1. What is the ACASS model?
The ACASS model - Accident Causation Analysis with Seven Steps – is the model used by the teams who are fulfilling the GIDAS3 database (Otte et al., 2009). This methodology has been developed in order to:
compile an evaluation-neutral coding system of accident causes and/or of accident parameters
have a methodology which is not exclusively applied by psychologists
determine accident causes even if the interviews of accident involved users are not available.
The model details different fields and degree of details of accident causations:
Human causation factors
Causation factors from the range of the technology of the vehicle
Causation factors from the range of the infrastructure and/or the environment
From a general point of view, this model seems very close to the DVE model (see
4.1.1). Nevertheless, the details of the methodology show that it mainly focuses on
human accident causes (because around 90% of the accidents factors are based on human failures) and it allows a structured categorization of human causes in a sequence of basic human functions. This last point is really the heart of the
methodology and is close to the previous model presented (see 4.3.1).
4.3.2.2. How do we use it?
To record the accident causes with ACASS it is therefore possible to assign multiple accident causation factors to each accident participant (see Figure 7). Each causation factor is recorded as a code which consists of four numbers (human causes) or 3 numbers (causes from the vehicle technology or infrastructure/nature) respectively.
The source (police report, in-depth accident investigator, witnesses…) from which the causation information originates is coded together with each causation factor. If information is received from different sources, the most reliably appearing source is indicated. In case of legitimate doubts concerning the truth of a statement (e.g. defensive manoeuvre of a participant), this can be expressed by setting a checkmark next to the information source. Furthermore there is a text field to each cause factor where a short explanation should be given why the code was chosen.
3 German In-Depth Accident Study
Accident causation models report
DaCoTA - WP5 - D5 9 vf.doc 25
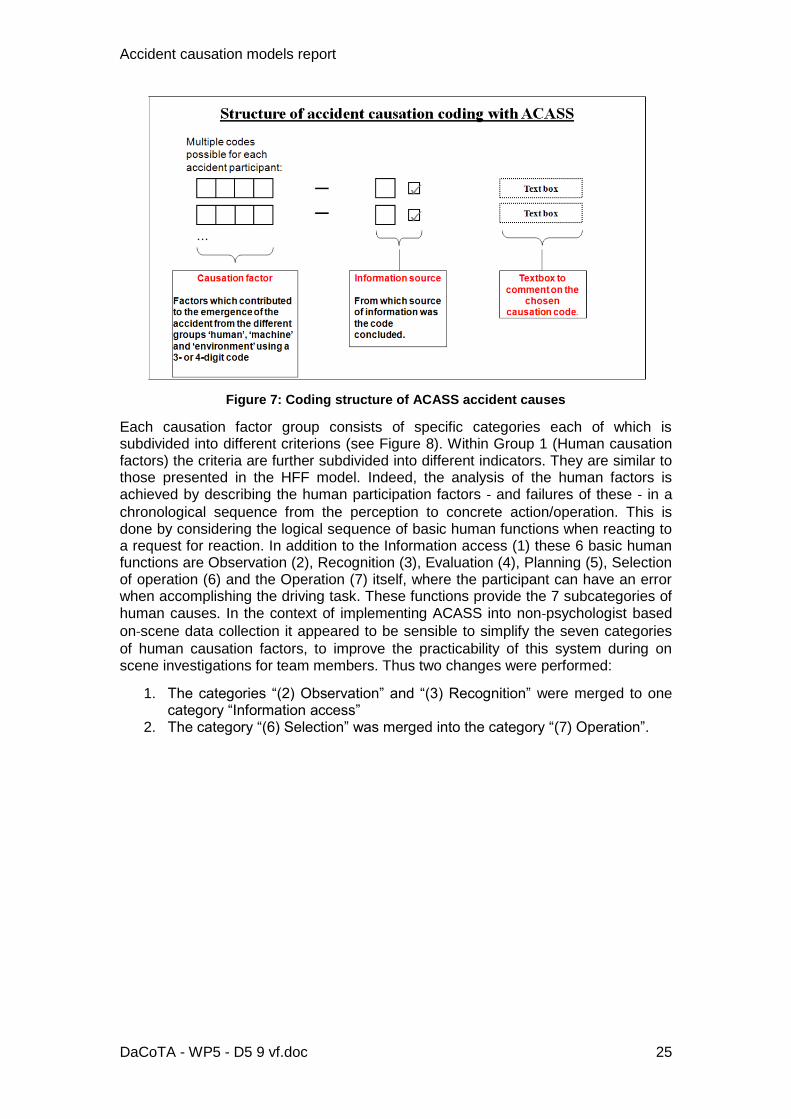
Figure 7: Coding structure of ACASS accident causes
Each causation factor group consists of specific categories each of which is subdivided into different criterions (see Figure 8). Within Group 1 (Human causation factors) the criteria are further subdivided into different indicators. They are similar to those presented in the HFF model. Indeed, the analysis of the human factors is achieved by describing the human participation factors ‐ and failures of these ‐ in a
chronological sequence from the perception to concrete action/operation. This is done by considering the logical sequence of basic human functions when reacting to a request for reaction. In addition to the Information access (1) these 6 basic human functions are Observation (2), Recognition (3), Evaluation (4), Planning (5), Selection of operation (6) and the Operation (7) itself, where the participant can have an error when accomplishing the driving task. These functions provide the 7 subcategories of human causes. In the context of implementing ACASS into non‐psychologist based
on‐scene data collection it appeared to be sensible to simplify the seven categories
of human causation factors, to improve the practicability of this system during on scene investigations for team members. Thus two changes were performed:
1. The categories ―(2) Observation‖ and ―(3) Recognition‖ were merged to one category ―Information access‖
2. The category ―(6) Selection‖ was merged into the category ―(7) Operation‖.
Accident causation models report
DaCoTA - WP5 - D5 9 vf.doc 26
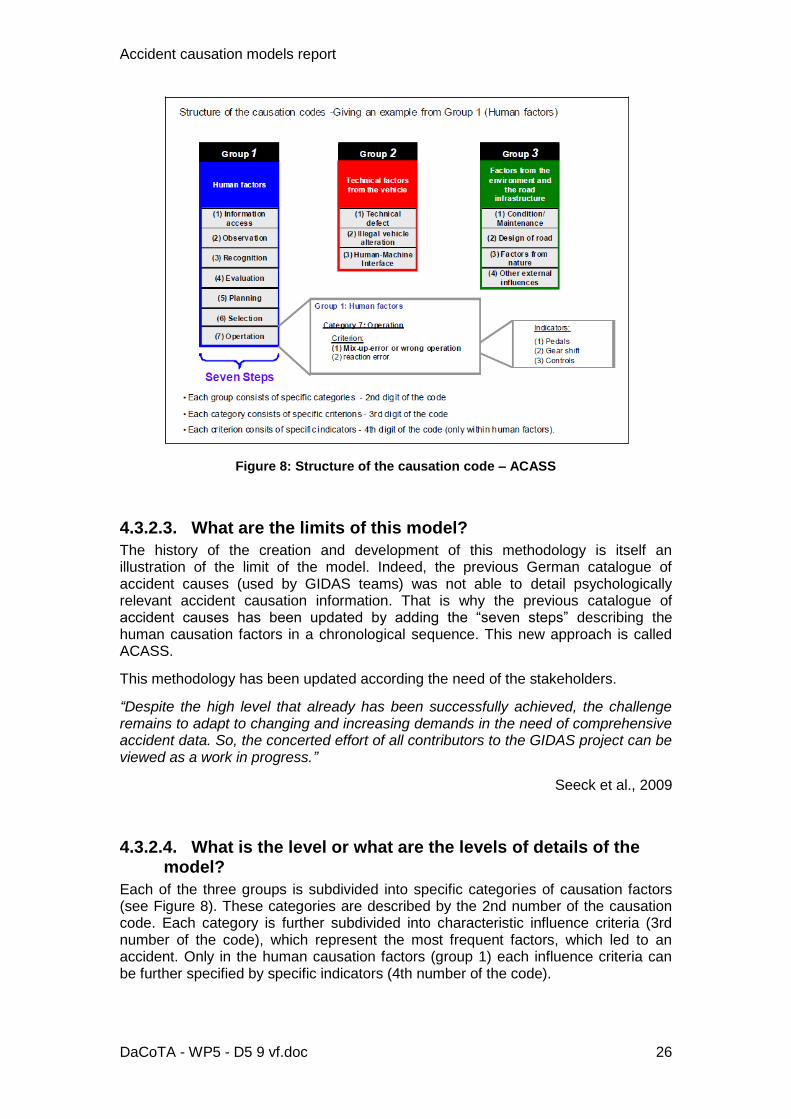
Figure 8: Structure of the causation code – ACASS
4.3.2.3. What are the limits of this model?
The history of the creation and development of this methodology is itself an illustration of the limit of the model. Indeed, the previous German catalogue of accident causes (used by GIDAS teams) was not able to detail psychologically relevant accident causation information. That is why the previous catalogue of accident causes has been updated by adding the ―seven steps‖ describing the human causation factors in a chronological sequence. This new approach is called ACASS.
This methodology has been updated according the need of the stakeholders.
“Despite the high level that already has been successfully achieved, the challenge remains to adapt to changing and increasing demands in the need of comprehensive accident data. So, the concerted effort of all contributors to the GIDAS project can be viewed as a work in progress.”
Seeck et al., 2009
4.3.2.4. What is the level or what are the levels of details of the model?
Each of the three groups is subdivided into specific categories of causation factors (see Figure 8). These categories are described by the 2nd number of the causation code. Each category is further subdivided into characteristic influence criteria (3rd number of the code), which represent the most frequent factors, which led to an accident. Only in the human causation factors (group 1) each influence criteria can be further specified by specific indicators (4th number of the code).
Accident causation models report
DaCoTA - WP5 - D5 9 vf.doc 27
4.4. The transformational point of view: the sequence of events
The transformational point of view (or the genetic one) shows that the road system evolves according to its economic context, vehicle circulating park, safety systems penetration rates, knowledge,
4.4.1. The sequential model
4.4.1.1. What is the sequential model?
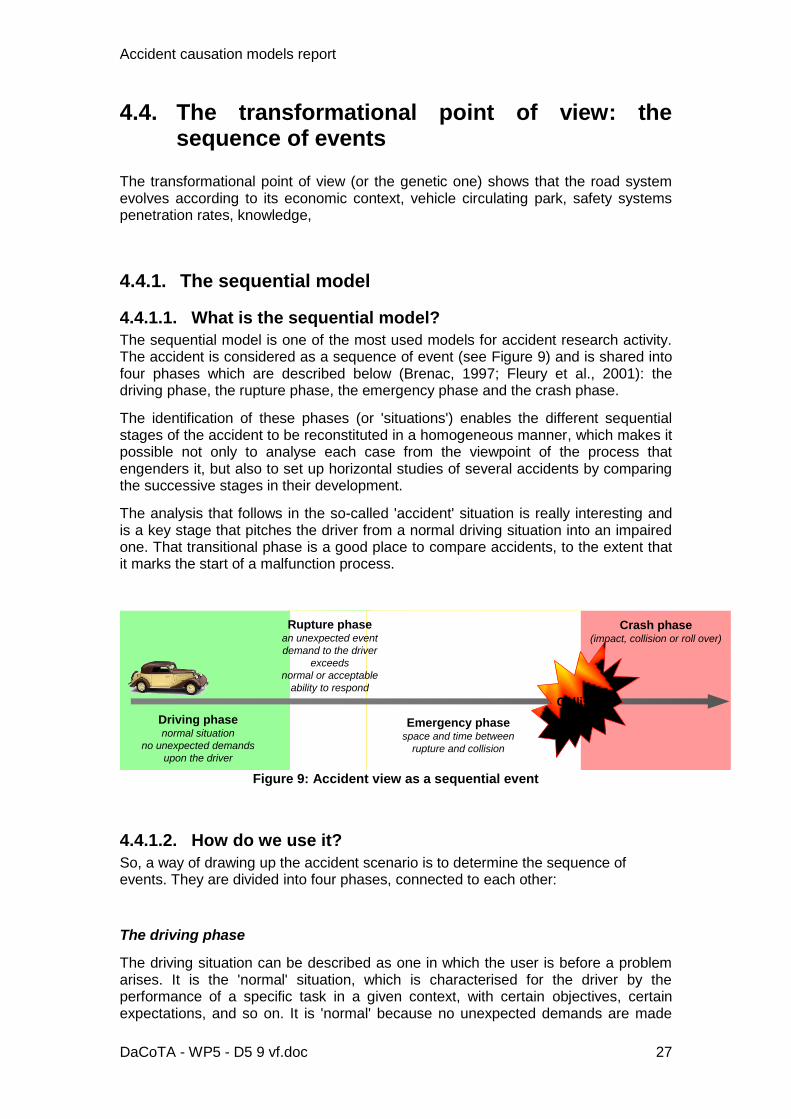
The sequential model is one of the most used models for accident research activity. The accident is considered as a sequence of event (see Figure 9) and is shared into four phases which are described below (Brenac, 1997; Fleury et al., 2001): the driving phase, the rupture phase, the emergency phase and the crash phase.
The identification of these phases (or 'situations') enables the different sequential stages of the accident to be reconstituted in a homogeneous manner, which makes it possible not only to analyse each case from the viewpoint of the process that engenders it, but also to set up horizontal studies of several accidents by comparing the successive stages in their development.
The analysis that follows in the so-called 'accident' situation is really interesting and is a key stage that pitches the driver from a normal driving situation into an impaired one. That transitional phase is a good place to compare accidents, to the extent that it marks the start of a malfunction process.
Driving phasenormal situation
no unexpected demands
upon the driver
Rupture phasean unexpected event
demand to the driver
exceeds
normal or acceptable
ability to respond
Emergency phasespace and time between
rupture and collision
Crash phase(impact, collision or roll over)
Collision
Figure 9: Accident view as a sequential event
4.4.1.2. How do we use it?
So, a way of drawing up the accident scenario is to determine the sequence of events. They are divided into four phases, connected to each other:
The driving phase
The driving situation can be described as one in which the user is before a problem arises. It is the 'normal' situation, which is characterised for the driver by the performance of a specific task in a given context, with certain objectives, certain expectations, and so on. It is 'normal' because no unexpected demands are made
Accident causation models report
DaCoTA - WP5 - D5 9 vf.doc 28
upon him. The driver can adapt effectively, the events unfold in line with his predictions, expectations and anticipations. He is not overloaded with information. He controls his speed and course; he is 'master of his vehicle'. In more general terms, this means that there is a balance between the demands and ability of the system components to respond to one another: alignment, skid-resistance, sight distance, tyre wear and pressure, condition of shock absorbers, speed, degree of driver awareness, etc. It should be noted that 'normality' in this case refers to effectiveness, but not necessarily to compliance with traffic regulations.
The advantage of studying this particular driving phase is to reveal what the driver considers to be both desirable and feasible in a particular place, and in a particular context.
The rupture phase
The 'rupture' is an unexpected event that interrupts the driving situation by upsetting its balance and thus endangering the system. That event could be an unforeseen presence or manoeuvre by another user, the advent of an infrastructure configuration which takes the driver by surprise, or provokes a sudden high workload, and so on. The effect of the rupture situation is to switch the system components from a bearable level of demand to a suddenly excessive demand in terms of ability to respond.
It should be noted that an 'unexpected event' does not necessarily mean 'unpredictable'. Which raises the question of to what extent it really was unpredictable, and if not, why it was unexpected. Information gained on the driving situation is of considerable use when seeking this explanation.
The emergency phase
It is the period during which the driver tries to return to the normal situation by carrying out an emergency manoeuvre. A particular feature of this stage is that the driver faces very severe constraints (both temporal and dynamic) with regards to the options open to him (braking, accelerating, swerving, etc).
The emergency phase covers the space and time between rupture and impact. If the rupture situation gives a statement of the problem in hand, the emergency situation defines the space-time 'credit' available in which to solve it. This 'credit' is, by definition, extremely limited.
The emergency situation can be determined in relation to the driving situation by the sudden excessive demand level imposed on the system components. The driver must solve, within a given time, a problem that is, in principle, entirely new to him. The range of solutions depends on the environment in terms of hostile obstacles or the space available for evasive action, or on the driver skills, driving experience, driver‘s long-term-memory, etc. The capacity of the vehicle to perform the required manoeuvre depends not only on its design and state of repair but also, when referring to vehicle-ground liaison, on the state of the infrastructure. The emergency situation reveals the insufficiencies or defects in one or another of the system components, weaknesses that remain tolerable when faced with normally moderate driving situation demands.
The emergency manoeuvre is an attempt to find a solution to a problem. It sometimes succeeds, but in accident databases this manoeuvre has failed. So the emergency situation is followed by the crash phase.
Accident causation models report
DaCoTA - WP5 - D5 9 vf.doc 29
The crash phase
The crash phase comprises the crash and its consequences. It determines the severity of the accident in terms of material damage and bodily injury. Once again, the situational circumstances depend on what has occurred previously and the interaction between the three components: thus an elderly person is more vulnerable to injury, modern vehicles are better designed to crashworthiness, a protection rail prevents impact with a hostile obstacle, etc.
From a safe-system model point of view, each of these phases should be considered specifically with the purpose of not generating hazards for the driver. So the driving system should not generate ruptures, should be forgiving (i.e. giving the possibility to recuperate) in emergency phase, and protecting in impact phase.
The accident causation information is mainly in the two first phases: the driving and rupture phases. Indeed, many counter-measures rely on the findings in these two phases:
The manoeuvres carried out by the drivers and the trajectories of the vehicles.
The key event or precipitating event that could have contributed to convert a driving situation into an accident situation.
The factors which explain directly or indirectly this event.
4.4.1.3. What are the limits of this model?
Such a model is often used for qualitative and quantitative analysis because it shows how events and factors are related. Nevertheless, this model has drawbacks. Indeed, this model is very structured and only information presented in the methodology can be chosen. Then, this methodology is quite insensitive to information left out of what is proposed for key events or factors. This remark is also true for the other models.
Moreover, in order to be able to apply such a model for accident causation analysis, it is necessary to realize a reconstruction of the accident. Indeed, it gives the possibility to link the kinematics parameters to human cognitive parameters. This state means that this model itself can be sufficient to well understand the accidents causes. It is really necessary to use another model (e.g. the HFF model) to have a good understanding of the human cognitive parameters.
4.4.1.4. What is the level or what are the levels of details of the model?
The information needed for this analysis is very detailed. Only in-depth analysis of the accidents is sufficient to use efficiently with this model. In addition to what has to be collected on the scene of the accidents, it is necessary to understand the kinematics sequence of the accidents: this can be done with good knowledge on vehicle kinematics or simulation software.
Accident causation models report
DaCoTA - WP5 - D5 9 vf.doc 30
4.4.2. The OTS and VALT models
4.4.2.1. What are the OTS and VALT models?
Both models are very similar and differ only in several points. Moreover, these models are an updated versions of the sequential model. That is why both are described in this section.
The On-The-Spot Accident Research Project (OTS) was undertaken in the UK from 2000 to 2010, funded by the UK Department for Transport and Highways Agency. This provides in-depth data scene data, with 500 cases per year covering the Midlands & South-East regions of England.
The VALT file is built from accidents compensated under motor liability insurance. Insurers’ claim handlers record the data in the company’s
database and also forward certain files to Finnish Insurance Data Ltd, who makes the database available to VALT. The database of insurance claims
can be complemented in insurance companies to include data originating from police examination records or any other documents that may have been issued on the case. Both methodologies consider the accident as a sequence of events and as the result of risk factors that had an effect on the accident genesis (direct or indirect factors).
4.4.2.2. How do we use it?
Both OTS and VALT use an accident causation system that uses codes for contributory and precipitating factors. The precipitating factor is described as the critical failure or manoeuvre which led to the accident. For each accident scene, only ONE precipitating factor can be selected. The contributory factor is the factor or factors which contributed to this precipitating factor. More than one contributory factor can be selected for each precipitating factor.
For both precipitating and contributory factors, the likelihood of this factor being causative to the accident (definitely, probably, possibly, not causative) must be decided.
In addition to the precipitating/contributory factors system used in OTS and VALT, a system of interaction coding is also used. This coding system is related to each active road user involved in the accident (i.e. vehicle drivers and pedestrians directly involved in the collision, but not vehicle passengers, unless their actions directly contributed to the accident occurring).
The coding system enables a record to be made for each active road user of how they interacted with their own vehicle, interacted with the highway infrastructure and interacted with the other road users who were sharing that highway.
In addition to the two systems in place to record accident causation and interactions, the database also includes other information relevant to accident causation issues:
- Pedestrian behaviour, including distractions, pedestrian motion, attitude prior to impact, movement relative to other vehicles, avoiding actions.
Accident causation models report
DaCoTA - WP5 - D5 9 vf.doc 31
- In the questionnaire which is given to the active road users involved in the accident, many questions are asked about the accident, such as their familiarity with the road and the vehicle, whether there were functional problems with the vehicle prior to impact, vision obscurity problems, whether the road surface, road layout or weather contributed to loss of control, health problems, medication use…
- Detailed information is collected for:
Weather and lighting conditions – precipitation, visibility, wind (speed and direction), street lighting, day/night, luminance,
Road surface conditions - defects, friction, contaminants such as ice/snow/wet/damp/dry/frost/salty/oil/diesel/mud/gravel, flooding, surface material,
Vehicle – loading, defects, visibility from vehicle.
4.4.2.3. What are the limits of these models?
As far as these models are updated versions of the previous model (sequential model), the limits of these models are presented in the previous section.
4.4.2.4. What is the level or what are the levels of details of the models?
As far as these models are updated versions of the previous model (sequential model), the limits of these models are presented in the previous section.
4.4.3. The domino theory
4.4.3.1. What is the domino theory?
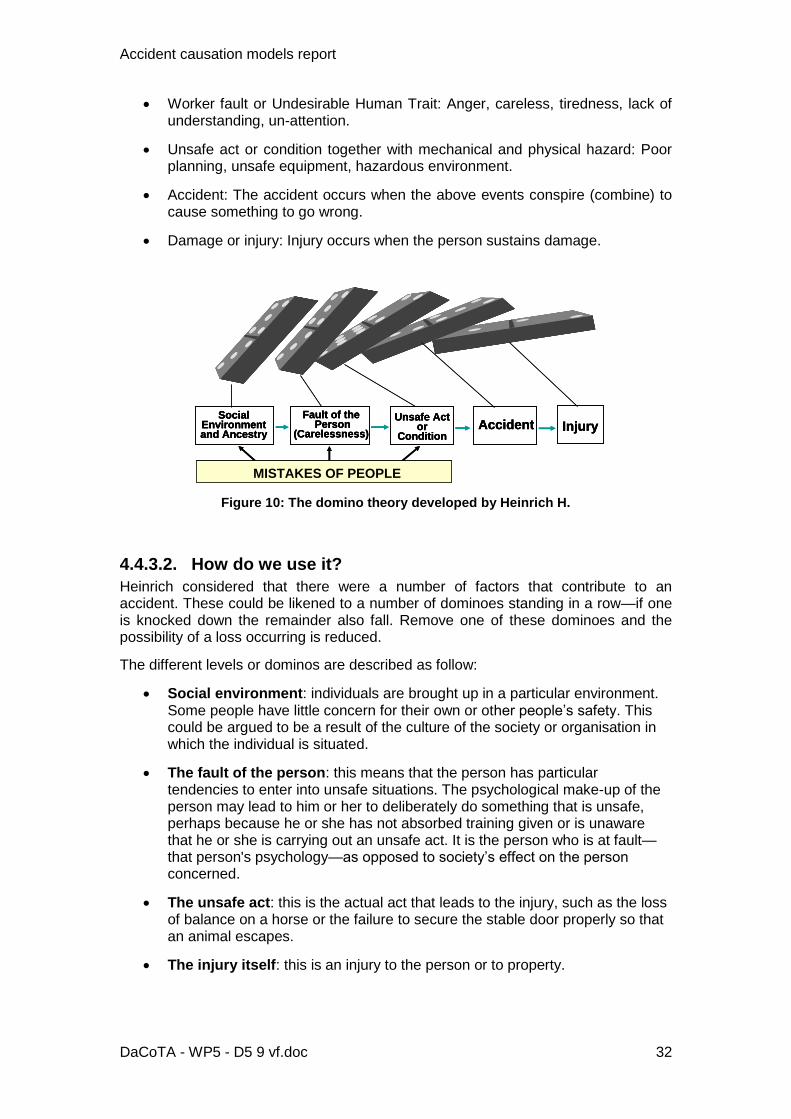
The Domino theory was developed in 1931 by H. W. Heinrich; it states that an accident is only one of a series of factors, each of which depends on a previous factor in the following manner (Heinrich 1980):
1. Accident causes an injury. 2. Individual's negligent act or omission, or a faulty machine, causes an
accident. 3. Personal shortcomings cause negligent acts or omissions. 4. Hereditary and environment cause personal shortcomings.
88% of all accidents are caused by unsafe acts of people, 10% by unsafe actions and 2% by ―acts of God‖. Heinrich proposed a ―five-factor accident sequence‖ in which each factor would actuate the next step in the manner of toppling dominoes lined up in a row. The sequence of accident factors is as follows:
Ancestry and social environment: Those conditions that make us take or accept risk.
Accident causation models report
DaCoTA - WP5 - D5 9 vf.doc 32
Worker fault or Undesirable Human Trait: Anger, careless, tiredness, lack of understanding, un-attention.
Unsafe act or condition together with mechanical and physical hazard: Poor planning, unsafe equipment, hazardous environment.
Accident: The accident occurs when the above events conspire (combine) to cause something to go wrong.
Damage or injury: Injury occurs when the person sustains damage.
Social Environmentand Ancestry
Fault of thePerson
(Carelessness)
Unsafe Act or
ConditionAccident Injury
MISTAKES OF PEOPLE
Social Environmentand Ancestry
Social Environmentand Ancestry
Fault of thePerson
(Carelessness)
Fault of thePerson
(Carelessness)
Unsafe Act or
Condition
Unsafe Act or
ConditionAccidentAccident InjuryInjury
MISTAKES OF PEOPLE
Figure 10: The domino theory developed by Heinrich H.
4.4.3.2. How do we use it?
Heinrich considered that there were a number of factors that contribute to an accident. These could be likened to a number of dominoes standing in a row—if one is knocked down the remainder also fall. Remove one of these dominoes and the possibility of a loss occurring is reduced.
The different levels or dominos are described as follow:
Social environment: individuals are brought up in a particular environment. Some people have little concern for their own or other people‘s safety. This could be argued to be a result of the culture of the society or organisation in which the individual is situated.
The fault of the person: this means that the person has particular tendencies to enter into unsafe situations. The psychological make-up of the person may lead to him or her to deliberately do something that is unsafe, perhaps because he or she has not absorbed training given or is unaware that he or she is carrying out an unsafe act. It is the person who is at fault—that person's psychology—as opposed to society‘s effect on the person concerned.
The unsafe act: this is the actual act that leads to the injury, such as the loss of balance on a horse or the failure to secure the stable door properly so that an animal escapes.
The injury itself: this is an injury to the person or to property.
Accident causation models report
DaCoTA - WP5 - D5 9 vf.doc 33
4.4.3.3. What are the limits of this model?
The domino‘s theory has been a very used methodology for the last 50 years. Nevertheless, it has been updated by several researchers in order to focus on their own aims. For example, Weaver, in 1971, modified the original theory to propose that the last three dominos in the sequence were caused by management omissions. In 1976, Adams changed the emphasis of the first three dominos to reflect organisational rather than person features. Bird and Loftus adapted Heinrich‘s domino theory to reflect the influence of management in the accident causation process. Multiple causation theory is an outgrowth of the domino theory, but it postulates that for a single accident there may be many contributory factors, causes and sub-causes, and that certain combinations of these give rise to accidents.
All three examples shows that the domino theory is rather a theory which can be adapted by researchers according to their needs or their countermeasure they can developed.
4.4.3.4. What is the level or what are the levels of details of the model?
This model has been applied in different fields (buildings, industries, road accident…) and has different versions. Main conclusions from domino‘s theory analysis show that a general level of details exists: 88% of accidents caused by unsafe acts, 10% by unsafe conditions and 2% are unavoidable.
There is no common detailed factor for each general level (unsafe acts, unsafe conditions) because it depends on the need and the knowledge of each analyst.
4.4.4. The DREAM model
4.4.4.1. What is the DREAM model?
DREAM is a tool that enables researchers and others to systematically classify and store information about factors contributing to accidents which have been collected in in-depth accident investigations (Warner et al., 2008). It is ―…an organiser of explanations – not a provider of explanations.‖ (Warner et al., p. 5)
The model was originally developed with the aim of identifying traffic situations for which the development of technical solutions had the potential to decrease the incidence of future accidents. Hence, the causation categories in DREAM, as well as the underlying accident model, focus on risk avoidance (Warner et al., 2008). DREAM is an adaptation of the Cognitive Reliability and Error Analysis Method (CREAM) (Hollnagel, 1998; cited in Warner et al., 2008). CREAM was originally developed to analyse accidents within process control domains (eg in nuclear power plants). CREAM was subsequently adapted for use in the road transport domain, and became DREAM (Warner et al., 2008). Several versions of DREAM have evolved over time (Warner et al., 2008). DREAM Version 2.1 was first used in 2002, in the Swedish project FICA (Factors Influencing the Causation of Accidents and incidents). It was later adapted for further use in the EC-funded SafetyNet project (at which time it was called SNACS 1.1) Both versions have been used to analyse accident data in Sweden and other European countries, especially in the SafetyNET project.
Accident causation models report
DaCoTA - WP5 - D5 9 vf.doc 34
DREAM 3.0 is the latest version, which evolved mainly from the EC-funded SafetyNET project. DREAM is bi-directional; that is, it can be used to analyse past accidents as well as predict future accidents (Warner et al., 2008). DREAM is not the only tool that has been developed to store and classify accident and incident data. Other models exist, such as HFACS (Human Factors Accident Analysis Classification System, Wiegmann, D., et al., 2005) and ICAM (Incident, Cause, Analysis Method). The main advantage of DREAM over other models is that it was developed and adapted specifically to structure and categorise accident data collected through in-depth studies of motor vehicle crashes. The HFACS and ICAM tools were developed for the military aviation and process control industries, respectively.
4.4.4.2. How do we use it?
DREAM has 3 main elements: an accident model; a classification scheme; and a method (Warner et al., 2008). The accident model derives from two accident models: the Contextual Control model (COCOM; Hollnagel, 1998, cited in Warner et al, 2008); and the Extended Control Model (ECOM; Hollnagel and Woods, 2005; cited in Warner et al, 2008). These models suppose that cognition, in the road traffic domain, involves observation, interpretation and planning, and that control in the traffic domain involves working towards multiple parallel goals on different timeframes. These theoretical standpoints are reflected in how the contributing factors in the classification scheme are defined and linked to each other. Accidents are seen as the result of ―…an unsuccessful interplay between driver, vehicle and traffic environment…‖, as well as failures of organisations responsible for shaping the conditions under which driving takes place. (Warner et al., 2008, p. 6). The model takes into account failures that occur at the ―sharp‖ end as well as the ―blunt‖ end. Sharp end failures are ones that occur at close proximity to the accident (eg a driver fails to see a red traffic light which contributes to two cars colliding). Blunt end failures occur at other times or at other locations (for example a mechanical failure to maintain the brakes properly, which later contributes to two cars crashing). (Warner et al., 2008).
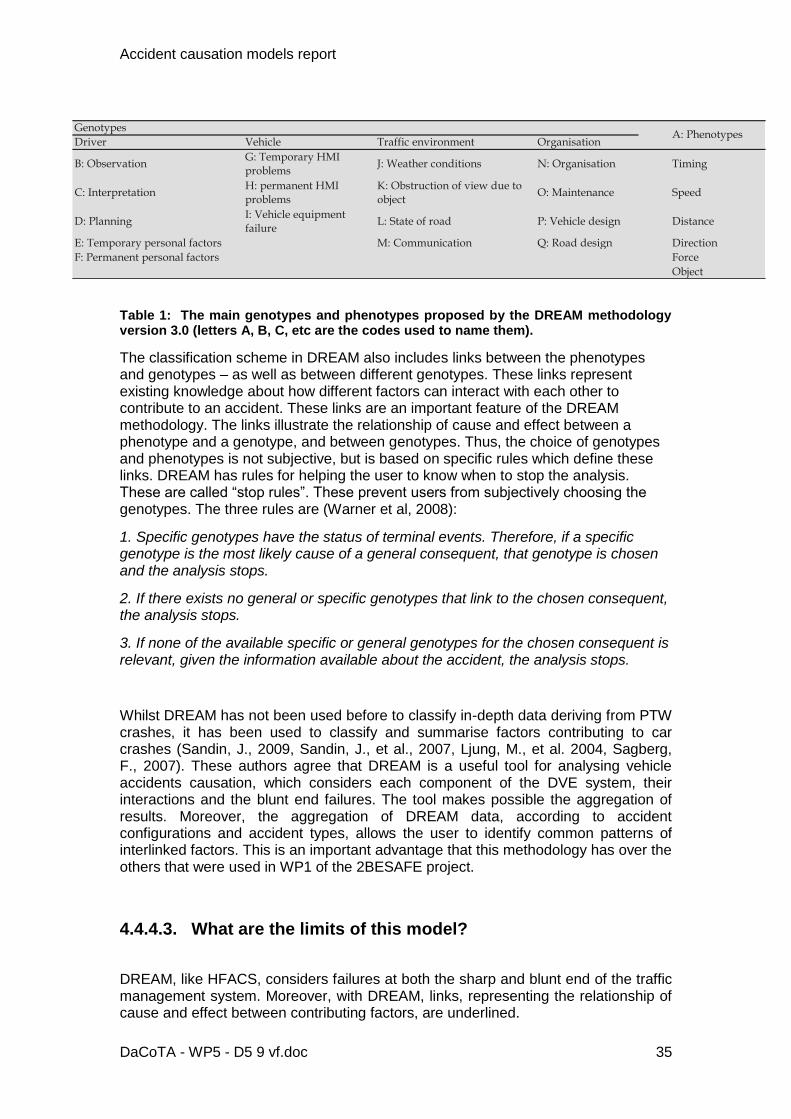
The classification scheme in DREAM 3.0 consists of so-called ―phenotypes‖ and ―genotypes‖ – and the links between them (Warner et al, 2008). Phenotypes are the ―observable effects‖ of an accident and include human actions and system events. The purpose of the phenotypes is to classify the observable effects into a relatively limited set of categories from which the DREAM analysis can begin. In DREAM 3.0 there are 6 general phenotypes which are all linked to one or more specific phenotypes (see Table 1). The 6 general phenotypes are - timing, speed, distance, direction, force, and object. The 10 specific phenotypes are: too early action; too late action; no action; too high speed; too low speed; too short distance; wrong direction; surplus force; insufficient force; and adjacent object. Genotypes are the factors that may have contributed to the observable effects – in other words, the contributing factors. Usually they cannot be observed, and hence have to be deduced eg from interviews with drivers and accident reports.(Warner et al., 2008). In DREAM 3.0, there are 51 general genotypes, some of which are linked with one or more specific genotypes. The genotypes are divided into 4 broad categories – driver, vehicle, traffic environment and organisation – and each of them has sub-categories (see Table 1). Driver categories include – observation, interpretation, planning, temporary personal factors, permanent personal factors. Vehicle categories include – temporary HMI problems; permanent HMI problems; and vehicle equipment failure. Traffic environment includes weather conditions, obstruction of view due to objects, state of the road and communication. Organisation categories include organisation, maintenance, vehicle design and road design.
Accident causation models report
DaCoTA - WP5 - D5 9 vf.doc 35
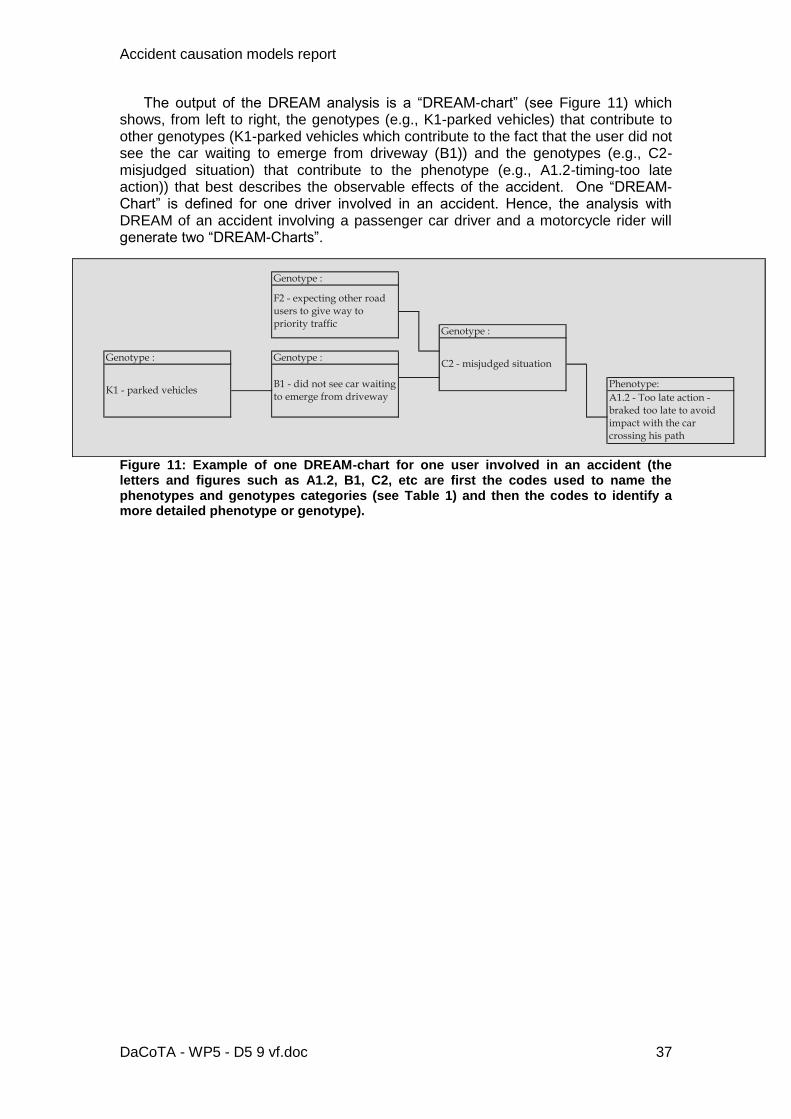
Table 1: The main genotypes and phenotypes proposed by the DREAM methodology version 3.0 (letters A, B, C, etc are the codes used to name them).
The classification scheme in DREAM also includes links between the phenotypes and genotypes – as well as between different genotypes. These links represent existing knowledge about how different factors can interact with each other to contribute to an accident. These links are an important feature of the DREAM methodology. The links illustrate the relationship of cause and effect between a phenotype and a genotype, and between genotypes. Thus, the choice of genotypes and phenotypes is not subjective, but is based on specific rules which define these links. DREAM has rules for helping the user to know when to stop the analysis. These are called ―stop rules‖. These prevent users from subjectively choosing the genotypes. The three rules are (Warner et al, 2008):
1. Specific genotypes have the status of terminal events. Therefore, if a specific genotype is the most likely cause of a general consequent, that genotype is chosen and the analysis stops.
2. If there exists no general or specific genotypes that link to the chosen consequent, the analysis stops.
3. If none of the available specific or general genotypes for the chosen consequent is relevant, given the information available about the accident, the analysis stops.
Whilst DREAM has not been used before to classify in-depth data deriving from PTW crashes, it has been used to classify and summarise factors contributing to car crashes (Sandin, J., 2009, Sandin, J., et al., 2007, Ljung, M., et al. 2004, Sagberg, F., 2007). These authors agree that DREAM is a useful tool for analysing vehicle accidents causation, which considers each component of the DVE system, their interactions and the blunt end failures. The tool makes possible the aggregation of results. Moreover, the aggregation of DREAM data, according to accident configurations and accident types, allows the user to identify common patterns of interlinked factors. This is an important advantage that this methodology has over the others that were used in WP1 of the 2BESAFE project.
4.4.4.3. What are the limits of this model?
DREAM, like HFACS, considers failures at both the sharp and blunt end of the traffic management system. Moreover, with DREAM, links, representing the relationship of cause and effect between contributing factors, are underlined.
Genotypes
Driver Vehicle Traffic environment Organisation
B: ObservationG: Temporary HMI problems
J: Weather conditions N: Organisation Timing
C: InterpretationH: permanent HMI problems
K: Obstruction of view due to object
O: Maintenance Speed
D: PlanningI: Vehicle equipment failure
L: State of road P: Vehicle design Distance
E: Temporary personal factors M: Communication Q: Road design Direction
F: Permanent personal factors Force
Object
A: Phenotypes
Accident causation models report
DaCoTA - WP5 - D5 9 vf.doc 36
Most of the advantages of the DREAM methodology have been described above. The failures at the blunt end (ie organisational factors) are not as comprehensive in the DREAM model as they are in the HFACS model, which includes organisational factors such as resource management, organisational climate, and organisational process. It is important to extend the repertoire of organizational categories for motorcycles. However, it is not appropriate to simply add such additional categories from HFACS to the DREAM model during the lifetime of this project. There are several reasons for this.
Firstly, it is inappropriate to add additional categories if they were not categories that were collected during the accident investigation process itself. DREAM is a classification tool, and if we simply add extra categories to DREAM that were not collected during the investigation this would force us to make judgements about the role of these additional organisation factors in crashes. This is inappropriate, as it would involve a re-analysis, rather than a re-classification, of the original data collected. Secondly, all the genotypes and phenotypes in DREAM are systematically linked together in an iterative way. It is not possible to add additional organisational categories without developing appropriate links with other genotypes, based on the linking rules of DREAM and the psychological theory from which it has been derived. It is not possible to do this, as it requires close collaboration with those who developed the DREAM model. It would require another project within itself. There is another remark that can be made about the limitations of the methodology: all genotypes or contributing factors are general and most of them fit well with passenger car accidents. Nevertheless, we know that Powered Two Wheeler (PTW) driving is different and specific. In order to have more relevant countermeasures for PTW accidents, it would be appropriate to adapt genotypes for PTW accidents. For instance, ―splitting lanes‖ is a recurrent manoeuvre or factor which leads to an accident for PTW`s. However, in DREAM, nothing is said about it (except ―priority error‖ which is not specific enough for the PTW rider). Moreover, factors related to the way riders manoeuvre their PTW are not highlighted as factors in this methodology, although it is critically important aspect in PTW riding.
Finally, DREAM has value beyond that of merely classifying and aggregating, post-hoc, factors that contribute to PTW accidents. Ideally, DREAM should be used to structure and guide the in-depth accident investigation process. It was at times frustrating to find that it is unable to judge whether a genotype was present because no relevant question regarding that genotype was included in the checklist used to investigate the accident. For example, it is not easy to choose option F4 - Habitually stretching rules and recommendations - because, although a rider might clearly have stretched the rules & recommendations at the time of the accident, we would not know this unless we asked him (and, even then, he might not tell the truth).
4.4.4.4. What is the level or what are the levels of details of the model?
The level of details depends on the information availability and in order to avoid subjective choice for accident causations, rules exist: see the paragraph explaining how to use the DREAM model.
4.4.4.5. Example
Accident causation models report
DaCoTA - WP5 - D5 9 vf.doc 37
The output of the DREAM analysis is a ―DREAM-chart‖ (see Figure 11) which shows, from left to right, the genotypes (e.g., K1-parked vehicles) that contribute to other genotypes (K1-parked vehicles which contribute to the fact that the user did not see the car waiting to emerge from driveway (B1)) and the genotypes (e.g., C2-misjudged situation) that contribute to the phenotype (e.g., A1.2-timing-too late action)) that best describes the observable effects of the accident. One ―DREAM-Chart‖ is defined for one driver involved in an accident. Hence, the analysis with DREAM of an accident involving a passenger car driver and a motorcycle rider will generate two ―DREAM-Charts‖.
Figure 11: Example of one DREAM-chart for one user involved in an accident (the letters and figures such as A1.2, B1, C2, etc are first the codes used to name the phenotypes and genotypes categories (see Table 1) and then the codes to identify a more detailed phenotype or genotype).
Genotype :
K1 - parked vehicles
Genotype :
F2 - expecting other road users to give way to
priority traffic
Genotype :
B1 - did not see car waiting to emerge from driveway A1.2 - Too late action -
braked too late to avoid impact with the car
crossing his path
Phenotype:
Genotype :
C2 - misjudged situation
Accident causation models report
DaCoTA - WP5 - D5 9 vf.doc 38
5. CONCLUSION
Since there are several existing models of accident causation, the aim of this report was to make an inventory of these models and to identify their basis of formulation. This was based upon a review of literature and previous projects such as the models developed within SafetyNet and TRACE. This model helps formalising what accident causation is and should be especially oriented towards the consideration of technologies. This model is then the basis for the identification of the nature of data that can be stored in the ERSO.
General conclusions
Stakeholders and evaluators design and/or use models of the road system to perform their activities. For instance, car manufacturers use models of accident causation in order to design safety systems. This allows them to design actions that will be adapted to a context and relevant to expectations. These models are knowledge that depicts behaviour and structure of systems. Therefore, models are used to describe a system. They are also used in a prescriptive way to predict future behaviour of systems. For instance, in an a priori evaluation, evaluators have to identify all the possible effects of the introduction of the safety actions in its context in order to design a satisfied evaluation.
Designing of models is performed according to a paradigm. It provides some ―rules‖ to build models. This is a way to see the world. In the classical paradigm of modelling, knowledge is absolute and shapes deterministic models of the systems‘ behaviour. Modellers have access to the reality and they are able to build a general model of it. However, this paradigm is not suitable for modelling of complex systems. Complexity characterizes the opportunity for emergence of some new and unexpected behaviour. For instance, the introduction of an automatic speed regulator will surely imply the emergence of new driving behaviour. Due to absolute and deterministic vision of the classical paradigm, this change would not be modelled in a prescriptive way. This will only be modelled if it appears. Accident science analysts need this knowledge for evaluating.
Thereby, there is a need for a new modelling paradigm that handles the complexity of the road system. The aim is to use another paradigm when it is necessary. It will not replace the classical paradigm; it will be complementary. In our research, we use the systemic paradigm. In France, Le Moigne has formalized and enhanced this paradigm under the concept of ―the general system‖. He followed the research of Bertalanffy and he was inspired by E. Morin and H. Simon. Systemic was developed in order to provide answer to the limits of the classical modelling paradigm. It proposes a relative vision of the modelling activity where systems are dynamics objects. The general formulation of this paradigm is based on four axes: ―a system is something that exists (ontological axe), that operates (functional axe), that evolves (genetical axe) in a dynamic context by following some goals (teleological axe)‖. Major differences with classical paradigm are on the genetical and the teleological axes. Complex changes of the systems can be understood by taking account these two axes. A complex system can change its behaviour in order to adapt them to the modifications of its context and in order to achieve its intrinsic goals. One other thing in this paradigm is the positioning of the
Accident causation models report
DaCoTA - WP5 - D5 9 vf.doc 39
modellers. They are no longer external of the modelled reality; they directly interact with it. Each modeller has his own representation of the world. Thus, models are relative to the modellers. In conclusion, we use the two paradigms in order to build models of the road system and the evaluation activity. They are complementary and the aim is to use them according to the modelling needs. Depending on the complexity of the system to model, we use either systemic or the classical paradigm. When it is complex, we use systemic and we use the other one when it is not. Some models which are mainly used by road safety stakeholders have then been presented in this report and some points need to be discussed according to the needs of the DACOTA project.
Discussion The presentation of the models showed that most of them are clearly different and seem to answer different needs. Indeed, descriptive models (such as DVE model or the haddon matrix) are used to determine issues and to organize safety campaigns or policies. More detailed models (e.g. the HFF model or the sequential one) have been created for expert needs (psychologists, safety system developers, researchers…). But for some models, it is not really clear why the models have been created, for which need and by whom it will be used. That is why it is necessary to list the needs of stakeholders in order to adapt or create models which answer their needs. Nevertheless, we cannot categorically say that all the models are not useful because we do not know for whom they have been created and for which need. Indeed, all models give information about the accidents; all this information is sometimes common between the models and different for other aspects. They are complementary of each other and all of them help us understand road accidents. For some accidents, a given model can explain why an accident happened. For others, the model cannot explain.
Some parameters are then common and some models seem similar (e.g. VALT and OTS models). Nevertheless, models and parameters have been updated according to stakeholders needs. One of the aims of DACOTA is to harmonize accident analysis in Europe. And one of the challenges will be to define a common grid of analysis in order to be able to aggregate data from different institute`s together.
The next question to answer will be: which parameters do we need to collect? All models propose to collect a large number of very detailed information. But how relevant is this information for road accident understanding? We do not really know if all this information (or which information) is relevant for stakeholders‘ needs.
In the process of in-depth data collecting, it will be important to harmonize the way the information will be collected and the tools that will be necessary. Indeed, the description of the models demonstrated that subjective conclusions can always occur.
In order to be able to gather information from different stakeholders it is necessary to avoid such issues by training the accident data investigators and defining clear and common methodologies….
Accident causation models report
DaCoTA - WP5 - D5 9 vf.doc 40
6. REFERENCES
Ben Ahmed, W., Mekhilef, M., Bigand, M., Page, Y., 2005, Knowledge sharing between designers and accidentologistes for the development of road safety systems, DETC2005-85181, ASME 2005 Design Engineering Technical Conferences, 31st Design Automation Conference, September 24-28 Long Beach, California, USA. Bertalanffy, L., Taschdjian, E., 1975, Perspectives on General Systems Theory. Scientific-Philosophical Studies, New York: George Braziller. Brenac, T., 1997. L‘analyse séquentielle de l‘accident de la route (Méthode INRETS), comment la mettre en pratique dans les diagnostics de sécurité routière. Rapport INRETS, Outils et Méthodes n° 3. Arcueil: INRETS. 79 p. Elvik, R., Vaa, T., 2004, The Handbook of Road Safety Measures. Elsevier Science, Oxford. Elvik, R., 2005, Laws of accident causation, 18th ICTCT workshop, Road safety issues, Paper. Evans, L., 2004, Traffic Safety. Bloomfield Hills, MI: Science Serving Society.
Fleury, D., Brenac, T., 2001. Accident prototypical scenarios, a tool for road safety research and diagnostic studies. Accident analysis and prevention 33(2), 267-276. Hollnagel, E., 2004, Barriers and accident prevention. Aldershot, UK: Ashgate Katsakiori, P., Sakellaropoulos, G., Manatakis, E., 2008. Towards an evaluation of accident investigation methods in terms of their alignment with accident causation models. Safety Science, doi:10.1016/j.ssci.2008.11.002 Lehto, M., Salvendy, G., 1991. Models of accident causation and their application: review and reappraisal. Journal of Engineering and Technology Management 8, 173–205. Ljung, M., Huang, A., Johansson, E., & Karlsson, N., 2004. Close calls on the road—a study of drivers‘ near misses. In 3rd International conference on traffic and transport psychology, Nottingham, UK, 5–9 September. Naing, C., Bayer, S., Van Elslande, P., Fouquet, K., 2007. Which Factors and Situations for human functional failures? Developing Grids for Accident Causation Analysis. Deliverable 5.2 of the EU FP6 project TRACE. Otte, D., Pund, B., Jänsch, M., 2009. A new approach of accident causation analysis by seven steps ACASS. ESV conference, 09-0245. Sagberg, F., 2007. A methodological study of the Driving Reliability and Error Analysis Method (DREAM). TØI report. Sandin, J., Ljung, M., 2007. Understanding the causation of single-vehicle crashes: a methodology for in-depth on-scene multidisciplinary case studies, International Journal of Vehicle Safety 2 (3), pp. 316–333
Accident causation models report
DaCoTA - WP5 - D5 9 vf.doc 41
Sandin, J. ,2009. An analysis of common patterns in aggregated causation charts from intersection crashes. Accident analysis and Prevention, 41(3), 624-632. Seeck, A., Gail, J., Sferco, R., Otte, D., Hannawald, L., Zwipp, H., Bakker, J., 2009. Development of the accident investigation and data handling methodology in the GIDAS project. ESV Conference, 09-0282. Van Elslande, P., Fouquet, K., 2007. Analyzing « human functional failures‖ in road accidents. Deliverable 5.1 of the EU FP6 project TRACE. Van Elslande, P., Fouquet, K., 2007. Which factors and situations for human functional failures? Developing a grid for accident causation analysis. Deliverable 5.2 of the EU FP6 project TRACE. Warner, H., Ljung Aust, M., Sandin, J., Johansson, E., & Bjorklund, G., 2008. Manual for DREAM 3.0, Driving reliability and error ananlysis method. Deliverable 5.6 of the EU FP6 project SafetyNet, TREN -04-FP6TR-S12.395465/506723. Wiegmann, D.A., Shappell, S.A., Boquet, A., Detwiler, C., Holcomb, K., and Faaborg, T., 2005. Human error and general aviation accidents: A comprehensive, fine-grained analysis using HFACS. Final Technical Report AHFD-05-08/FAA-05-03. Prepared for Federal Aviation Administration Atlantic City International Airport, NJ. Contract DOT 02-G-011. Wiener, N., 1948, Cybernetics, or Control and Communication in the Animal and Machine, 2nd edition, MIT press, Cambridge, MA.