72
5G key technology enableRs for Emerging media COntent pRoDuction services Deliverable D4.1 Integration of 5G Components (Phase 1) Version v1.0 Date: 2021/07/31

5G key technology enableRs for Emerging media COntent pRoDuction services
Deliverable D4.1
Integration of 5G Components
(Phase 1)
Version v1.0
Date: 2021/07/31

Document properties:
Grant Number:
Document Number:
957102
D4.1
Document Title: Integration of 5G Components (Phase 1)
Editors: Pablo Pérez (NOK), Manuel Fuentes (5CMM), Mika Skarp (CMC).
Authors: Pablo Pérez (NOK), Manuel Fuentes (5CMM), David Martín-Sacristán (5CMM), Mika Skarp (CMC), José Costa-Requena (CMC), Antonio García (ACC), Jan Duerre (SEN), Norbert Werner (SEN), Paola Sunna (EBU), Pavlo Kondratenko (EBU), Emilio Garrido (TID), Mohamed Nabil Ibrahim (EDD), Davide Milanesio (RAI), Baruch Altman (LU), Daniel Corregidor (UPM), Turker Yilmaz (EUR), Christophe Le Thierry (RED), Adrián Rodrigo (UPV), Salvador García (UPV), Cristina Avellán (UPV).
Reviewers: Paola Sunna (EBU), Mohamed Nabil Ibrahim (EDD), Álvaro Villegas (NOK)
Contractual Date of Delivery: 2021/07/31
Dissemination level: PU1
Status: Final
Version: 1.0
File Name: 5G-RECORDS_WP4_D4.1_v1.0
Abstract
The present document describes the integration of the different 5G and media components into test-bed and includes the monitoring tools required to measure their performance in the context of the three considered use cases: live audio production, multiple camera wireless studio and live immersive media production. The document also describes the 5G infrastructures to be used in each of the use cases and describes the preliminary tests that have been completed in this first phase of the project.
Keywords
5G components, integration, measurement, monitoring tools, testing, test-bed infrastructure
1 CO = Confidential, only members of the consortium (including the Commission Services)
PU = Public

Disclaimer
This 5G-RECORDS D4.1 deliverable is not yet approved nor rejected, neither financially nor
content-wise by the European Commission. The approval/rejection decision of work and
resources will take place at the Mid-Term Review Meeting planned in November 2021, after
the monitoring process involving experts has come to an end.
5G-RECORDS_D4.1
1
Executive Summary
The present document describes the phase-1 integration of the different 5G and media components into test-bed and includes the monitoring tools required to measure their performance in the context of the three considered use cases: 1) live audio production, 2) multiple camera wireless studio and 3) live immersive media production. This document also describes the 5G infrastructures to be used in each of the use cases.
The target of use case 1 is to provide a 5G-based solution for professional audio productions. It integrates professional audio equipment from Sennheiser (microphone, in-ear monitor system, and audio processing application) with a 5G network comprising a modem and Distributed Unit (DU)+Radio Unit (RU) open Radio Access Network (open-RAN) modules provided by Eurecom, the Central Unit (CU) module from Accelleran, the Shared Access Server from RED technologies, the 5G core network (5GC) from Cumucore, and the Multimedia Orchestration Control Gateway (MOCG) developed by Bisect. The test-bed for integration and testing is deployed at Eurecom open5GLab in Sophia Antipolis, France.
The critical Key Performance Indicator (KPI) is the mouth-to-ear latency below 4 ms. This is measured using an analogue hardware measurement tool with 100 µs precision. Related network KPIs such as latency, synchronicity, and packet loss are measured using network tools, i.e., a packet-based latency measurement software, iPerf3, ping and a logic analyser. Considering the integration of components from different participating companies deployed potentially on different servers, the demarcation points for measuring the individual delays between components have been carefully chosen.
The target of use case 2 is to develop a 5G based Internet Protocol (IP) media production solution. This is addressed in two different scenarios: an integrated production scenario, and a remote production scenario. The first scenario integrates an indoor camera, the video encoder/decoder from Image Matters, 5G modems provided by Fivecomm, the EBU media gateway, Bisect MOCG, and the 5G network (both RAN and 5GC) from Ericsson. This is tested in Ericsson test-bed in Aachen (Germany). The remote production scenario integrates several components in Aachen, i.e., an outdoor camera, an encoder-transmitter from LiveU, a third-party 5G modem and the Ericsson 5G network with the LiveU receiver-decoder located at RAI laboratory in Turin (Italy). The 5G infrastructure for this use case comprises two different sites: a test network in Ericsson Eurolab office in Aachen, as well as a trial network that is part of the 5G industry campus Europe hosted by the RWTH university in Aachen.
A number of measurement tools have been identified to characterize the integrated production scenario, including both professional content production tools. These tools are the EBU Live IP Software Toolkit (LIST), time-code Global Positioning System (GPS) locked measures for timing, a Self-Clocked Rate Adaptation for Multimedia (SCReAM) bandwidth tool, as well as different tools related to Precision Time Protocol (PTP) measurements. The scenario additionally identified two network measurement tools, i.e., crit-iPerf and nuttcp. Measurements in the remote production scenario are taken using Tektronix Prism test equipment, as well by sharing information (bandwidth, latency, and packet loss rate) between the encoder and the decoder. The tests of the individual components of the Remote Production, which took place in LiveU Israel R&D labs, RAI Turin labs, and Ericsson Aachen laboratory, are described in the document.
The target of use case 3 is to develop a high-definition free-viewpoint-video (FVV) solution that can work end-to-end over the 5G and transport network. It integrates UPM FVV-live system (cameras, capture servers, view renderer, virtual camera control system) with Nokia 5G infrastructure (millimetre-Wave RAN, 5GC and near-edge
5G-RECORDS_D4.1
2
computing), Nokia media delivery software, and Telefónica transport network, cloud infrastructure, and video player for end users. For the field trial, the capture system, 5G RAN and near-edge cloud (view renderer) will be located in Segovia (Spain), while the edge cloud (media deliver) will be located in Madrid (Spain), and the end-users will be distributed in several locations in Spain. For the integration and the performance testing prior to the trial, the systems in Segovia have been replicated in Nokia laboratory in Madrid.
Two level of measure and monitoring systems have been developed to measure the KPIs of this use case. Individual KPIs are measured in their respective system, using specifically developed video tools (motion-to-photon latency tool, offline view renderer, experimental video player) and standard network measurement tools (Wireshark, iPerf3, ping). Results of those measures are reported in the document. Besides, real-time monitoring of relevant KPIs (under operation) has been designed and is being added to the system. A third level of measurement, which is the analysis of user Quality of Experience (QoE), will be addressed in phase-2.
5G-RECORDS_D4.1
3
Table of Contents
Executive Summary ...................................................................................................... 1
Table of Contents ......................................................................................................... 3
List of Figures ............................................................................................................... 5
List of Tables ................................................................................................................ 7
List of Acronyms ........................................................................................................... 8
1 Introduction .......................................................................................................... 10
1.1 Scope ........................................................................................................... 10
1.2 Objectives ..................................................................................................... 10
1.3 Structure ....................................................................................................... 10
2 Live audio production infrastructure ..................................................................... 11
2.1 Integration of 5G components ....................................................................... 11
2.1.1 Component integration .......................................................................... 11
2.1.2 Network integration ................................................................................ 11
2.1.3 End-to-end integration ........................................................................... 13
2.2 Test-bed infrastructure .................................................................................. 13
2.3 Measurement and monitoring tools ............................................................... 16
2.3.1 Relevant KPIs ........................................................................................ 16
2.3.2 Application-related measurement tools .................................................. 17
2.3.3 5G network-related measurement tools ................................................. 17
2.4 Tests............................................................................................................. 19
2.4.1 Testing of individual components ........................................................... 19
2.4.2 End-to-end integrated solution ............................................................... 20
3 Multiple camera wireless studio infrastructure ...................................................... 23
3.1 Integration of 5G components ....................................................................... 23
3.1.1 Component integration .......................................................................... 23
3.1.2 Network integration ................................................................................ 23
3.1.3 End-to-end integration ........................................................................... 24
3.2 Test-bed infrastructure .................................................................................. 24
3.2.1 Test network description ........................................................................ 24
3.2.2 Trial network description ........................................................................ 26
3.3 Measurement and monitoring tools ............................................................... 27
3.3.1 Relevant KPIs ........................................................................................ 27
3.3.2 Professional content production tools and software ............................... 28
3.3.3 5G network-related measurement tools ................................................. 31
3.4 Tests............................................................................................................. 33
3.4.1 Testing of individual components ........................................................... 33

5G-RECORDS_D4.1
4
3.4.2 End-to-end integrated solution ............................................................... 37
4 Live immersive media production infrastructure ................................................... 44
4.1 Integration of 5G components ....................................................................... 44
4.1.1 Component integration .......................................................................... 44
4.1.2 Network integration ................................................................................ 44
4.1.3 End-to-end integration ........................................................................... 45
4.2 Test-bed infrastructure .................................................................................. 45
4.2.1 Media Acquisition and Production test-bed network description ............. 46
4.2.2 Edge and Media Delivery test-bed network description .......................... 47
4.3 Measurement and monitoring tools ............................................................... 48
4.3.1 Relevant KPIs ........................................................................................ 49
4.3.2 Application-related measurement tools .................................................. 50
4.3.3 5G network-related measurement tools ................................................. 51
4.3.4 KPI monitoring system ........................................................................... 52
4.4 Tests............................................................................................................. 52
4.4.1 Testing of individual components ........................................................... 53
4.4.2 End-to-end integrated solution ............................................................... 61
5 Conclusion ........................................................................................................... 65
5.1 Live audio production .................................................................................... 65
5.2 Multiple camera wireless studio .................................................................... 66
5.2.1 Integrated production scenario .............................................................. 66
5.2.2 Remote production scenario .................................................................. 67
5.3 Live immersive media production .................................................................. 67
References ................................................................................................................. 69

5G-RECORDS_D4.1
5
List of Figures
Figure 1: NG interoperability between Accelleran CU and Cumucore 5GC. ................ 12 Figure 2: F1-C interoperability between Accelleran CU and Eurecom DU. .................. 12 Figure 3: F1 and NR-UU interoperability between Accelleran CU and Eurecom DU/RU/UE .................................................................................................................. 13 Figure 4: Eurecom open5GLab infrastructure ............................................................. 14 Figure 5: OpenAirInteface k8s deployment on open5GLab. ........................................ 15 Figure 6: Setup for time offset calculation. .................................................................. 18 Figure 7: Setup for verification of audio network devices ............................................ 19 Figure 8: Latency of audio network packets in a direct connection of audio devices ... 19 Figure 9: 5GC + Network Slice Manager Application Function (NSM-AF) ................... 20 Figure 10: Mapping tools to KPIs in a single setup for the live audio production use case ................................................................................................................................... 21 Figure 11: End-to-end plane stack of the Live Audio Production use case .................. 21 Figure 12: Example of demarcation points of UC1 CU user plane. .............................. 22 Figure 13: 5G test network architecture. ..................................................................... 25 Figure 14: Ericsson Radio Dot (RD). ........................................................................... 25 Figure 15: Indoor Radio Unit (IRU). ............................................................................. 26 Figure 16: RWTH Campus Melaten map. ................................................................... 26 Figure 17: 5G infrastructure in RWTH campus ............................................................ 27 Figure 18: Live IP Software Toolkit (LIST) interface .................................................... 29 Figure 19: Time-code GPS locked main setup. ........................................................... 29 Figure 20: Prism SMPTE tests screen. ....................................................................... 31 Figure 21: Example of output of crit-iPerf tool. ............................................................ 32 Figure 22: PTP accuracy test setup. ........................................................................... 33 Figure 23: reference setup architecture....................................................................... 34 Figure 24: Bitrate measurement using SCReAM. ........................................................ 34 Figure 25: Setup at RAI Torino’s laboratory. ............................................................... 35 Figure 26: LU2000 SMPTE configuration screen ........................................................ 36 Figure 27: Prism SMPTE tests screen. ....................................................................... 37 Figure 28: Prism SMPTE tests connectivity. ............................................................... 37 Figure 29: Mapping tools to KPIs in a single setup for the wireless studio use case ... 38 Figure 30: phase 1 for the integrated production scenario setup. ................................ 39 Figure 31. Connection status with NAT. ...................................................................... 39 Figure 32. Port forwarding enabled. ............................................................................ 40 Figure 33: RAI Turin SMPTE Prism screen during the E2E tests in remote production41 Figure 34: Three examples of LU800 transmissions at 30mbps at a synthetic 5G SA laboratory, single feed. ................................................................................................ 42 Figure 35: 60mbps UL transmission of 4 simultaneous streams. ................................ 43 Figure 36: UC3 architecture. Shadowed modules are not included in this first release. ................................................................................................................................... 45 Figure 37: UC3 integration architecture (acquisition and production). ......................... 46 Figure 38: Nokia test-bed. ........................................................................................... 46 Figure 39: UC3 integration architecture (edge and delivery). ...................................... 47 Figure 40: Video ingestion connectivity details. ........................................................... 47 Figure 41: Video delivery connectivity details. ............................................................. 48 Figure 42: UC3 KPI Monitoring architecture. ............................................................... 52 Figure 43: UC3 measurement points and monitoring infrastructure. ............................ 53 Figure 44: Mapping tools to KPIs in a single setup for the live immersive media production use case ..................................................................................................................... 54 Figure 45: E2E Motion-to-photon latency calculation process. .................................... 55 Figure 46: Iperf3 testing at RAN. ................................................................................. 56 Figure 47: Scope of end user probes iPerf and ping measurement. ............................ 59

5G-RECORDS_D4.1
6
Figure 48: Media Delivery KPIs measurement method. .............................................. 60 Figure 49: General scenario for UC3. ......................................................................... 62 Figure 50: A/B testing logical view. ............................................................................. 62

5G-RECORDS_D4.1
7
List of Tables
Table 1: Overview of open5GLab capabilities. ............................................................ 15 Table 2: Delay budget of the live audio production use case. ...................................... 22 Table 3: SMPTE tests done in RAI laboratory. ............................................................ 36 Table 4: Tests to be continued with the Prism for SMPTE compliance. ....................... 36 Table 5: list of missing components and its replacement for phase 1 .......................... 38 Table 6: Camera capabilities. ...................................................................................... 39 Table 7: UC3 delivery server KPIs .............................................................................. 49 Table 8: UC3 player KPIs............................................................................................ 50 Table 9: KPIs measurement tools ............................................................................... 53 Table 10: Motion to photon latency test results. .......................................................... 55 Table 11: Camera bitrate test results. ......................................................................... 56 Table 12: Uplink throughput test results. ..................................................................... 57 Table 13: Round-trip time test results. ........................................................................ 58 Table 14: Rendering test results for 1 GPU. ................................................................ 58 Table 15: Rendering test results for 2 GPUs. .............................................................. 59 Table 16: Probe KPI measures ................................................................................... 59 Table 17: Remote User video measures ..................................................................... 60 Table 18: Capture server metrics. ............................................................................... 62 Table 19: Media renderer metrics. .............................................................................. 63 Table 20: Media delivery metrics................................................................................. 63 Table 21: Media player metrics. .................................................................................. 63 Table 22.:End device probe metrics. ........................................................................... 63 Table 23: Ping and nstatInput plugins. ........................................................................ 64 Table 24: Available measurement tools in UC1, mapped to the considered KPIs. ...... 65 Table 25: Available measurement tools in UC2 for the integrated production scenario, mapped to the considered KPIs. ................................................................................. 66 Table 26: Available measurement tools in UC2 for the remote production scenario, mapped to the considered KPIs. ................................................................................. 67 Table 27: Available measurement tools in UC3, mapped to the considered KPIs. ...... 68

5G-RECORDS_D4.1
8
List of Acronyms
5GC 5G Core AES Advanced Encryption Standard AF Application Function API Application Programming Interface AVC Advanced Video Coding BBU Baseband Unit CNF Cloud-native Network Function COTS Commercial Off-The-Shelf CPE Customer-Premises Equipment CU Centralized Unit CUPS Control and User Plane Separation DL Downlink DN Data Network DNS Domain Name System DSCP Differentiated Services Code Point DU Distributed Unit E2E End to End ELK Elasticsearch, Logstash and Kibana ETSI European Telecommunications Standards Institute eMBB enhanced Mobile Broadband EPC Evolved packet Core FDD Frequency Division Duplexing FPS Frames Per Second FTTH Fiber To The Home FW Firmware GOP Group Of Pictures GPS Global Positioning System GPU Graphics Processing Unit GTP GPRS Tunneling Protocol HARQ Hybrid Automatic Repeat Request HLS HTTP Live Streaming HTTP Hypertext Transfer Protocol HW Hardware ICMP Internet Control Message Protocol IEEE Institute of Electrical and Electronics Engineers IEM In-Ear Monitor IP Internet Protocol IPT Institute for Production Technology IT Information Technology IRU Indoor Radio Unit KPI Key Performance Indicator LED Light-emitting Diode LTE Long Term Evolution LTE-M Long Term Evolution for Machines LRT LiveU Reliable Transport Protocol MEC Mobile Edge Computing MIMO Multiple-Input Multiple-Output mMTC massive Machine Type Communications mmW millimeter Wave MOCG Media Orchestration Control Gateway NAT Network Address Translator NB-IoT Narrow Band Internet-of-Things

5G-RECORDS_D4.1
9
NFVI Network Function Virtualisation Infrastructure NMOS Networked Media open Specifications NR New Radio NSA Non-Standalone NSM-AF Network Slice Manager Application Function NTP Network Time Protocol OAI OpenAirInterface OCXO Oven-controlled Cristal Oscillator ONAP Open Network Automation Platform PCF Policy Control Function PDCP Packet Data Convergence Protocol PER Packet Error Ratio PNF Physical Network Function PPS Pulse Per Second PTP Precision Time Protocol QoE Quality of Experience QoS Quality of Service RAN Radio Access Network RD Radio Dot RF Radio Frequency RGB Red, Green and Blue RLC Radio Link Control RRU Remote Radio Unit RTCP Real Time Control Protocol RU Remote Unit SA Standalone SAS Shared Access Server SBA Service Based Architecture SCReAM Self-Clocked Rate Adaptation for Multimedia SCS Subcarrier Spacing SDAP Service Data Adaptation protocol SDI Serial Digital Interface SDN Software Defined Network SDP Session Description Protocol SIM Subscriber Identity Module SMPTE Society of motion picture and Television Engineers SSH Secure Shell Protocol SUT System Under Test SW Software TCP Transport Control Protocol TDD Time Division Duplexing TOS Type of Service UDP User Datagram Protocol UE User Equipment UL Uplink UM Unacknowledged Mode UP User Plane UPF User Plane Function URLLC Ultra Reliable Low Latency Communications VNF Virtual Network Function VPN Virtual Private Network

5G-RECORDS_D4.1
10
1 Introduction
1.1 Scope
The present document describes the integration of the different 5G and media components into test-bed and includes the monitoring tools required to measure their performance in the context of the three considered use cases: live audio production, multiple camera wireless studio and live immersive media production. This document also describes the 5G infrastructures to be used in each of the use cases.
The document uses as inputs the requirements and KPIs defined in D2.1 [1] and the description of the components in D3.1 [2]. Note that the system architecture of each of the use cases, including the internal architecture of the different components and how they interact and interface among them, is also described in D3.1. This deliverable D4.1 focuses on the actual deployment of the test-beds (test and field networks) towards the end-to-end trials in WP5, as well as the performance measurements and the feedback provided to WP2 and WP3. The end-to-end validation and trials of the use cases is out of the scope of this deliverable, as it will be described in D5.2.
This deliverable describes a first iteration over each of the use cases, covering phase-1 of the end-to-end integration and preliminary testing. The results of the tests will be used to develop the final version of the platforms in phase-2, which will be described in deliverable D4.2.
1.2 Objectives
The objectives of this deliverable are the following.
1. Describe the integration of the 5G-RECORDS individual components and key technologies into the 5G infrastructures of the project for test-bed realisation.
2. Describe how the components form an overall architecture which represents a subset of 5G network functions over an actual deployment.
3. Describe the monitoring tools required to measure the performance of the different components in the context of each of the use cases with respect to the expected requirements and KPIs.
4. Provide feedback to WP2 and WP3 for system optimisation. 5. Establish the necessary integration among components for readiness towards
the trials in WP5.
1.3 Structure
The document is divided into three Sections 2, 3 and 4, each one describing the test-bed infrastructure for each of the use cases: live audio production, multiple camera wireless studio, and live immersive media production, respectively. These sections also include:
a) Description of the activities performed to integrate the 5G components into the test-bed.
b) System architecture of the deployment: components, connectivity, and configuration.
c) Measurement elements introduced to monitor the performance of the test-bed and validate the KPIs.
d) Design of the validation tests to be performed in the system and description of their results when available.

5G-RECORDS_D4.1
11
2 Live audio production infrastructure
This chapter describes the component and infrastructure integration status in Phase 1 of the project, as well as the measurement and monitoring tools deployed to integrate and test the first use case in 5G-RECORDS on live audio production.
2.1 Integration of 5G components
Integration in use case 1 has been divided into three steps: (i) integration of related components, (ii) integration of components with the network, and (iii) end-to-end integration. The target in this use case is to provide a 5G-based solution for professional audio productions. The main challenge is to ensure a mouth-to-ear latency lower than 4 milliseconds since higher latency packets are handled as lost packet. Note that this latency already includes 2 milliseconds of audio processing.
2.1.1 Component integration
The related components for the first phase of integration are as follows:
• Microphone (UE): contains an audio input that is converted to a digital signal for the 5G modem. In a multi-microphone environment, microphones need to be synchronised using a centralized clock signal. Microphones are provided by Sennheiser and modem by Eurecom.
• In-ear monitor (IEM) (UE): contains the audio output that is converted from the 5G modem, which provided a digital signal. In-ear monitors (IEM) are provided by Sennheiser.
• Local audio processing: network application that is used to mix several incoming digital audio signals into one outgoing digital audio signal. Local audio processing application is provided by Sennheiser.
• Multimedia Orchestration Control Gateway (MOCG): software component, integrated in the network that discovers, registers, manages and controls audio User Equipment (UEs). The production operational audio controller requests QoS-specific dataflows for UEs from a slice that is designed and dedicated for the type of traffic in question. The MOCG is developed by BBC.
• 5G Radio Access Network (RAN): based on Open and Disaggregated RAN architecture. The CU is provided by Accelleran while the DU and RU are provided by Eurecom.
• 5GC including a Network Slicing Manager Application Function (AF) that has an open Application Programming Interface (API) to request data flows. Data flows are organised into slices and they can have different priorities inside the slice. The 5G Core (5GC) will also deliver needed synchronisation signals for UEs. This component is provided by Cumucore.
• Shared Access: functionality that aims at optimizing frequency reuse whenever possible, while making sure that different users do not interfere with each other. This is achieved via RED Technologies Shared Access Server (SAS) communicating with Accelleran’s Shared Access Client which controls the frequency and transmission power used by the RAN, based on the conditions of licences or leases.
2.1.2 Network integration
The second phase of integration, components with the network, is described below:
5G-RECORDS_D4.1
12
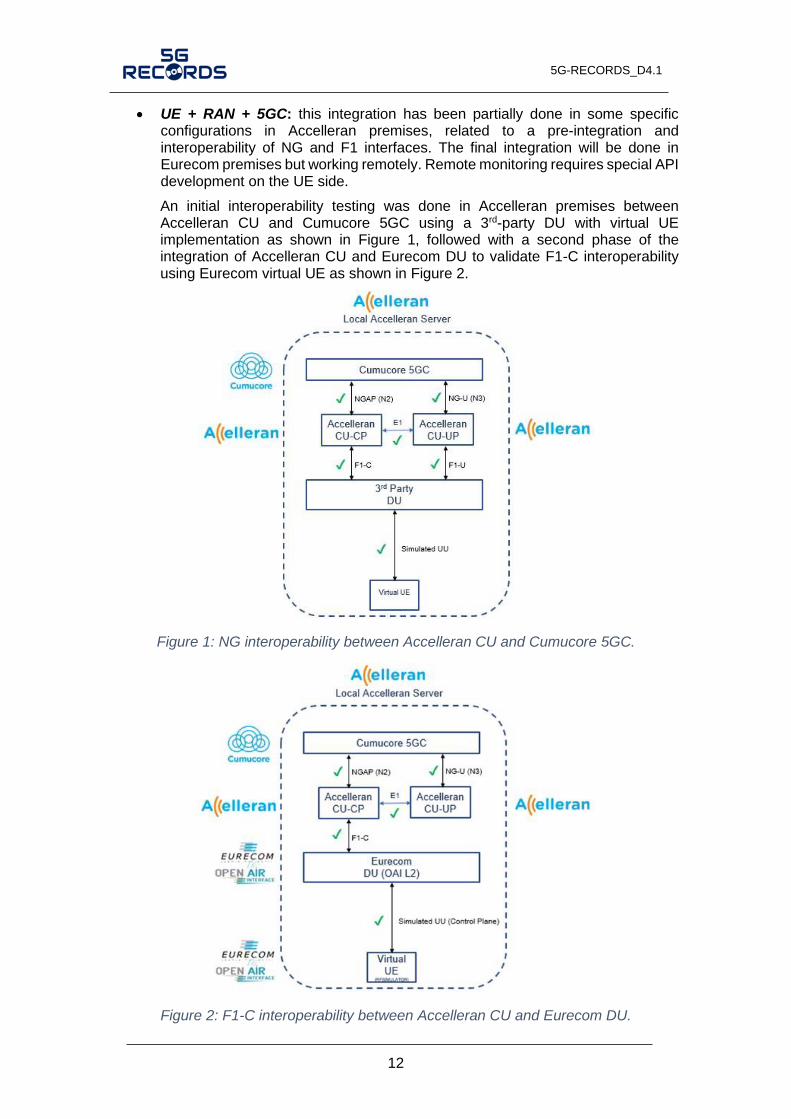
• UE + RAN + 5GC: this integration has been partially done in some specific configurations in Accelleran premises, related to a pre-integration and interoperability of NG and F1 interfaces. The final integration will be done in Eurecom premises but working remotely. Remote monitoring requires special API development on the UE side.
An initial interoperability testing was done in Accelleran premises between Accelleran CU and Cumucore 5GC using a 3rd-party DU with virtual UE implementation as shown in Figure 1, followed with a second phase of the integration of Accelleran CU and Eurecom DU to validate F1-C interoperability using Eurecom virtual UE as shown in Figure 2.
Figure 1: NG interoperability between Accelleran CU and Cumucore 5GC.
Figure 2: F1-C interoperability between Accelleran CU and Eurecom DU.

5G-RECORDS_D4.1
13
The final steps of the network integration to be done in Eurecom premises are used to validate fully the F1-U interoperability of Accelleran CU to Eurecom DU using a real SDR RU and SDR based UE as shown in Figure 3 before the full end to end integration steps with Cumucore 5GC and Sennheiser audio devices/server.
Figure 3: F1 and NR-UU interoperability between Accelleran CU and Eurecom DU/RU/UE
• RAN + Shared Access: this integration will be done by exchanging messages over the Hypertext Transfer Protocol (HTTP) between the Shared Access Client and the Shared Access Server. Integration means that the RAN can obtain, prior to any transmission, the allowed frequency range and transmission power from the Shared Access Server.
• Media Orchestration Controller (MOC) + MOCG + Local Audio Processing + 5GC Applications: they will be integrated with 5GC using standard 5G interface or open API. Local Audio Processor is a MEC functionality using N6 interface. The Media Orchestration Control Gateway is an external function that is integrated with a network through open API in the Network Slicing Manager (AF).
2.1.3 End-to-end integration
The third level of integration aiming the E2E implementation is described below.
• E2E functionality will be verified and improved to meet use case specific KPIs prior trialling phase. In this use case, the network frequency is defined by an external Radio Frequency (RF) lease solution. Network dataflow QoS and quantity are defined by the MOCG. The network is expected to be able to deliver a mouth-to-ear latency lower than 4 ms.
2.2 Test-bed infrastructure
This subsection describes the infrastructure deployed at the test-bed. For an overall description of the architecture, as well as the different components, please refer to the deliverable D3.1 [2].

5G-RECORDS_D4.1
14
Eurecom will provide for this use case both software and hardware resources and services for an experimental network test-bed infrastructure. This infrastructure will support RAN, 5GC, and edge functions in Sophia Antipolis, France. The infrastructure, termed open5GLab, is based around a real-time Kubernetes (k8s) cluster using the RedHat OpenShift 4.4 cloud infrastructure framework and combined with laboratory and field-deployable radio equipment on-site. A high-level overview of the open5GLab infrastructure is shown in Figure 4. Below, the primary components are detailed.
Figure 4: Eurecom open5GLab infrastructure
Switch Fabric: It is composed of 3 x 3.6 Tbit/s EdgeCore Tomahawk-based switches (AS7312-54XS), one spine switch and two top-of-rack (ToR) switches with seven double attachments (one per ToR switches) to servers. A second set of servers are interconnected with two additional P4 leaf switches (EdgeCore Wedge 100bf-32X) and on P4 spine switch (EdgeCore Wedge 100bf-32QS). The second spine also provides 4G/5G Serving Packet Data Network Gateway (SPGW)-U / User Plane Function (UPF) functionality using Kaloom Networks P4 software since Q1 2021. The six switches are fully interconnected in the data centre and was providing a 1Gbit/s link with the outside world, in particular the Virtual Private Network (VPN) tunnel to Orange Labs. In Q1 2021 an additional 400Gbit/s interconnection with INRIA/RENATER is added providing high-speed interconnection with European research infrastructure.
k8s Nodes: All nodes have 2 x 25Gbit/s double-attachment to the switching fabric. The eight primary worker nodes are high-performance Dell R640 Xeon Gold 6154/6254 (288 x86-64 cores @ 3 GHz). Two of the worker nodes are currently configured for hard real-time operation and additional 25Gbit/s networking interfaces for interconnection with Ethernet-based radio units. Some simpler worker nodes for applications are also available on the cluster. There are currently three k8s master nodes which are Dell R440 Xeon Silver (60 x86-64 cores @ 2.4 GHz).
Radio Units: The radio units are pooled via the switching fabric. These include:
• Eight N310 USRPs. Four reserved for testing, four interconnected with 3.3-3.8 GHz TDD outdoor power amplifiers for New Radio (NR) Band n78.
• Three X310 USRPs. Two reserved for testing, one deployed for indoor sub-6 GHz usage (n38 or n78).

5G-RECORDS_D4.1
15
• Two N320 USRPs interconnected with four InterDigital FR2 MHUs (24-29 GHz). Two deployed outdoors, and two indoors.
• Two AW2S eCPRI Jaguar 2.6 GHz radio units (four 43 dBm antenna ports) deployed outdoors.
• One Benetel 4G Remote Radio Unit (RRU) (2.6 GHz Frequency Division Duplexing (FDD)) deployed indoors for testing.
• One Benetel 5G RRU (3.5 GHz Time Division Duplexing (TDD)) deployed indoors for testing.
Bare-metal Nodes: Several bare-metal machines are connected to the cluster for unitary testing and development purposes. They can be used to manually test individual RAN and Core Network elements before deployment on OpenShift resources.
External Access: Access to the cluster services is provided via Secure Shell Protocol (SSH) access to a Jumphost (Dell R630 Xeon E5-v4, 20 Core 2.4 GHz). Project partners will be granted access to build and test network elements for OpenShift. An additional virtual machine is provided to allow project partners to manage and monitor exposed HTTP services running in the OpenShift cluster.
An example deployment of OpenAirInterface (OAI) 5G Non-Standalone (NSA) Core and RAN services is shown in Figure 5. All OAI networking functions are packaged as Helm charts and can be deployed via the central ONAP orchestration and automation framework deployed at Orange Labs.
Figure 5: OpenAirInteface k8s deployment on open5GLab.
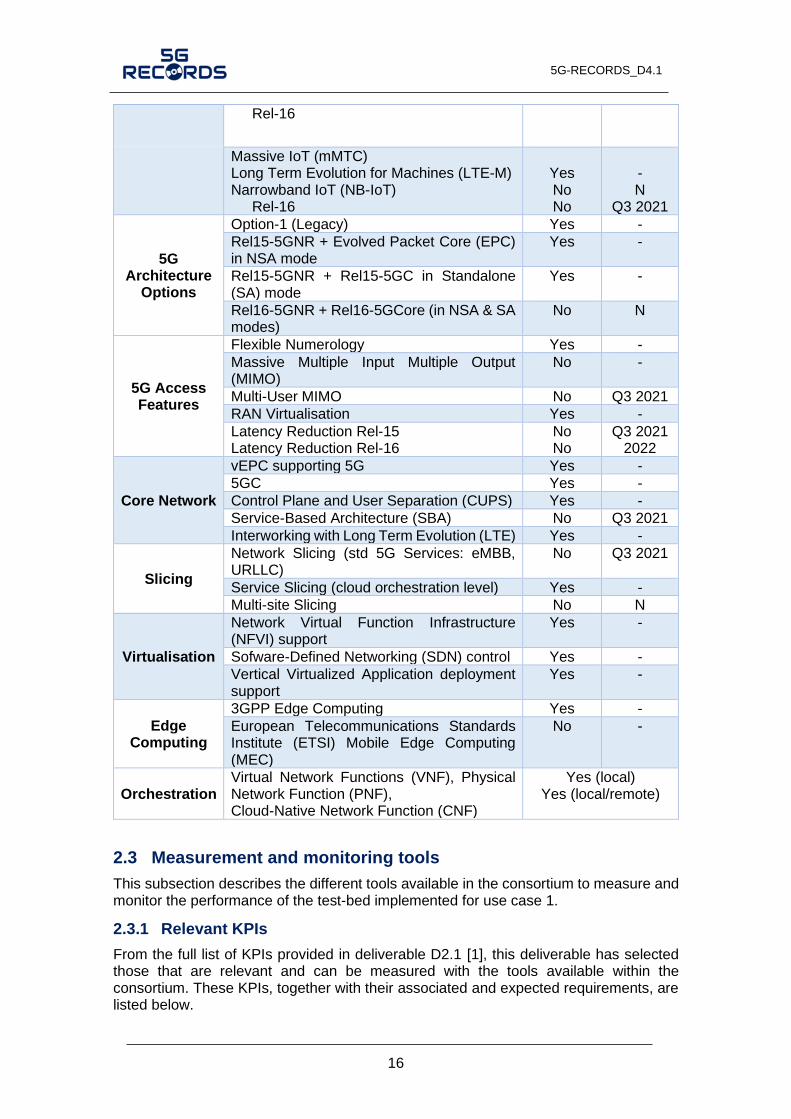
The following table shows the different open5GLab capabilities and features available or planned for the project window.
Table 1: Overview of open5GLab capabilities.
Capabilities Features Available Planned
5G Services
Enhanced MBB (eMBB) Yes -
Ultra Reliable Low Latency Communications (URLLC)
Rel-15
Yes No
-
2022
5G-RECORDS_D4.1
16
Rel-16
Massive IoT (mMTC) Long Term Evolution for Machines (LTE-M) Narrowband IoT (NB-IoT)
Rel-16
Yes No No
- N
Q3 2021
5G Architecture
Options
Option-1 (Legacy) Yes -
Rel15-5GNR + Evolved Packet Core (EPC) in NSA mode
Yes -
Rel15-5GNR + Rel15-5GC in Standalone (SA) mode
Yes -
Rel16-5GNR + Rel16-5GCore (in NSA & SA modes)
No N
5G Access Features
Flexible Numerology Yes -
Massive Multiple Input Multiple Output (MIMO)
No -
Multi-User MIMO No Q3 2021
RAN Virtualisation Yes -
Latency Reduction Rel-15 Latency Reduction Rel-16
No No
Q3 2021 2022
Core Network
vEPC supporting 5G Yes -
5GC Yes -
Control Plane and User Separation (CUPS) Yes -
Service-Based Architecture (SBA) No Q3 2021
Interworking with Long Term Evolution (LTE) Yes -
Slicing
Network Slicing (std 5G Services: eMBB, URLLC)
No Q3 2021
Service Slicing (cloud orchestration level) Yes -
Multi-site Slicing No N
Virtualisation
Network Virtual Function Infrastructure (NFVI) support
Yes -
Sofware-Defined Networking (SDN) control Yes -
Vertical Virtualized Application deployment support
Yes -
Edge Computing
3GPP Edge Computing Yes -
European Telecommunications Standards Institute (ETSI) Mobile Edge Computing (MEC)
No -
Orchestration Virtual Network Functions (VNF), Physical Network Function (PNF), Cloud-Native Network Function (CNF)
Yes (local) Yes (local/remote)
2.3 Measurement and monitoring tools
This subsection describes the different tools available in the consortium to measure and monitor the performance of the test-bed implemented for use case 1.
2.3.1 Relevant KPIs
From the full list of KPIs provided in deliverable D2.1 [1], this deliverable has selected those that are relevant and can be measured with the tools available within the consortium. These KPIs, together with their associated and expected requirements, are listed below.

5G-RECORDS_D4.1
17
1. Mouth-to-ear latency:
Defined as the maximum application latency tolerated by a live performer between the analogue audio source (wireless microphone) and the analogue audio output (IEM). It includes two times the network latency plus the audio processing time. It is assumed that 2 ms are used for audio processing within the mixing console. The total mouth-to-ear latency is expected to be below 4 milliseconds.
2. 5G network latency:
This is the latency from the application layer on the UE side to the application layer on a device connected via the UPF to the 5GC (or vice versa). It includes the transfer interval (periodicity of packet transfers). The 5G network latency shall be lower than 1 millisecond.
3. Synchronicity:
It is the absolute difference between any synchronised clock in the network and the time master, which shall be lower than 500 ns.
4. Packet error ratio:
The packet error ratio (PER) of the system for a packet size corresponding to 1 ms of audio data. Moreover, a consecutive minimum continuous error-free duration ≥ 100 ms must be ensured. This is because, to make packet errors inaudible, error concealment is used at application level. Every concealment is capable of handling one specific kind of error distribution. This KPI shall be lower than 10-6.
2.3.2 Application-related measurement tools
The following audio application-related measurement tool is planned to be used in the context of use case 1.
1. Analog audio latency measurement tool
This tool is a dedicated hardware device that can measure mouth-to-ear latency by generating analogue test tones, capturing analogue audio and calculating the propagation delay between those analogue signals. To measure for example the latency from a microphone through a processing system to an IEM, the measurement tool can be connected into the same interfaces replacing the microphone and IEM. The device is able to achieve a measurement precision better than 100 microseconds.
Related KPI: Mouth-to-ear latency
2.3.3 5G network-related measurement tools
There are three 5G-related KPIs that will be measured and tested in use case 1. The consortium will bring at least one tool per KPI as follows:
1. Packet-based application latency measurement tool
Based on a mechanism for time synchronisation (e.g., GPS or Precision Time Protocol (PTP)) this tool can insert highly precise timestamps into audio packets. The receiving end can capture timestamps of incoming audio packets. The comparison of send and receive timestamps allows precise calculation of network latency. This tool is part of the audio network device platform. The achievable measurement precision depends on the precision of the used time synchronisation mechanism. GPS would result in a precision of about 150 ns, a dedicated Ethernet-cable for PTP would allow latency measurements with a precision of about 20 ns.
Related KPIs: 5G network latency, packet error ratio
5G-RECORDS_D4.1
18
2. iPerf/ping
iPerf can be used to measure the one-way 5G network latency between any two probe points in the 5G user plane chain by setting up an iPerf client and a iPerf server operating before the UE modem (using Android iPerf application in case of smartphones or iPerf programme in laptop connected to the 5G wireless card) and after the UPF 5GC component. iPerf can provide minimum, maximum, average and standard deviation of the collected latency values. For the timestamps to lead to valid latency values, it is required that the client's and server's system clocks are synchronised to a common reference, e.g., PTP. A GPS disciplined Oven Controller Crystal Oscillator (OCXO) is a recommended reference. See [6].
Ping is a network utility to test the reachability of a host that can also measure the Round Trip Time (RTT) for messages sent from a source host to a destination host that echoes back to the source. The ping utility can be triggered from a probe point before the UE modem (using Android ping application in case of smartphones or ping programme in laptop connected to the 5G wireless card) towards any server IP address located after the UPF 5GC component. Since the timestamping is done based on the originating host system clock, no clock synchronisation is needed. However, since ping measures the roundtrip time, calculating the actual one-way 5G network latency needs to be extrapolated by RTT/2 and this relies on a very strong assumption that the one-way delays are symmetric which is most of the times not the case, particularly considering that in cellular radio protocols radio base stations are the ones responsible for scheduling UEs.
Related KPIs: 5G network latency, packet error ratio
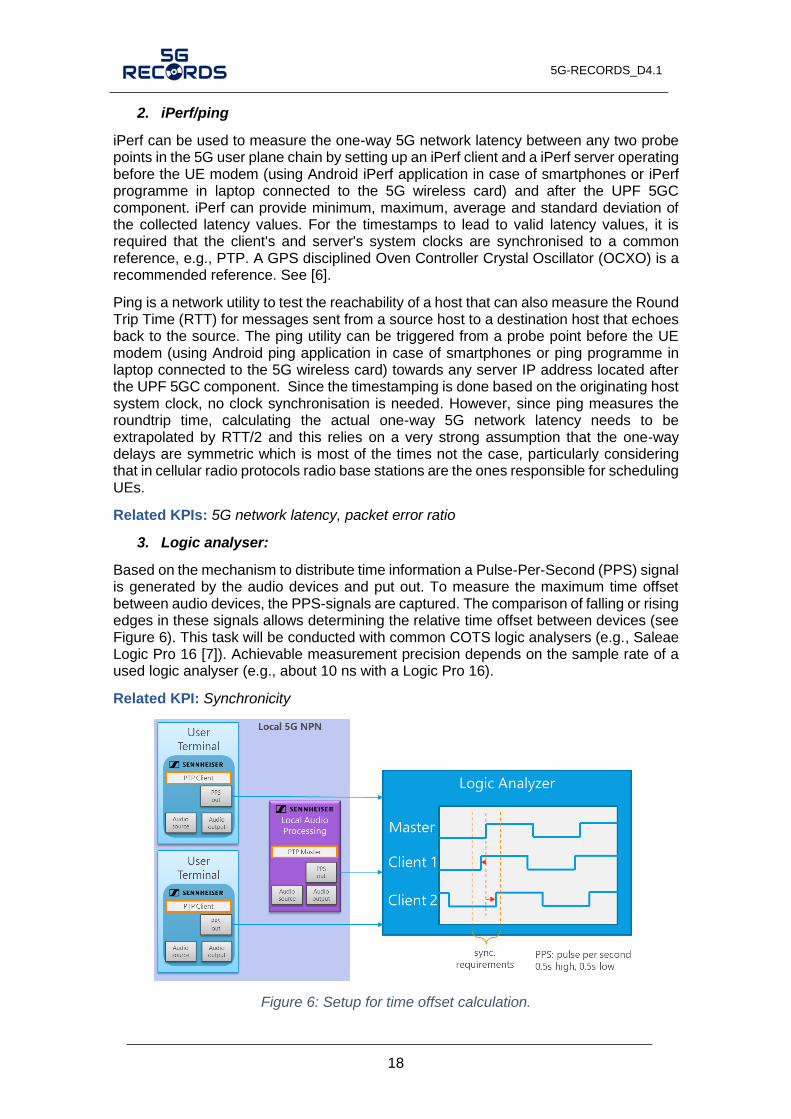
3. Logic analyser:
Based on the mechanism to distribute time information a Pulse-Per-Second (PPS) signal is generated by the audio devices and put out. To measure the maximum time offset between audio devices, the PPS-signals are captured. The comparison of falling or rising edges in these signals allows determining the relative time offset between devices (see Figure 6). This task will be conducted with common COTS logic analysers (e.g., Saleae Logic Pro 16 [7]). Achievable measurement precision depends on the sample rate of a used logic analyser (e.g., about 10 ns with a Logic Pro 16).
Related KPI: Synchronicity
Figure 6: Setup for time offset calculation.

5G-RECORDS_D4.1
19
2.4 Tests
This subsection describes the tests performed to guarantee the proper integration of the components and the fulfilment of the expected KPIs.
2.4.1 Testing of individual components
The following individual components are provided and tested in this use case:
1. User terminal (Sennheiser):
The delay portion of the audio application in the user terminal is deterministic and known due to a dedicated hardware implementation. It is smaller than 170 microseconds from network packet reception to analogue audio output and vice versa. Depending on the configured network packet periodicity in the sender (microphone) an additional delay for the collection of multiple audio samples for network transfer is required. If for example, the network packet periodicity is 500 microseconds the same delay must be added.
To verify the implementation of the PTP-based synchronisation and the network streaming a setup as shown in Figure 7 was used. One of the audio devices provides a PTP server and the other one synchronizes to that server. This is the baseline for the one-way network transmission latency measurement. The actual audio streaming is realized via a separate ethernet connector and cable. The results of the measurement using the “Packet-based application latency measurement tool” are shown in Figure 7. It is shown that the pure network transmission in a direct network connection is in the single-digit microsecond range for every packet as expected.
Figure 7: Setup for verification of audio network devices
Figure 8: Latency of audio network packets in a direct connection of audio devices

5G-RECORDS_D4.1
20
2. 5G RAN (Accelleran/Eurecom)
The 5G RAN user plane is divided in turn into two main components: the Control Unit (CU)- User Plane (UP) provided by Accelleran, which measures delay incurred in CU-UP by calculating the processing time of the packet across GPRS Tunnelling Protocol (GTP-U)/Packet Data Convergence Protocol (PDCP)/Service Data Adaptation protocol (SDAP)/GTP-U stack components; and the DU/RU from Eurecom to measure the delay incurred in DU/RU components, which can include not only processing in these components but also other delays such as Hybrid Automatic Repeat Request (HARQ).
3. 5GC + Network Slice Manager Application Function (NSM-AF) (Cumucore)
Network Slice Manager Function called Cumucore Network Wizard has an API specification. Using the API, an external application can request specific Data flows with QoS settings from the 5G network. Network Slice Manager Functions is integrated with Policy Control Function (PCF) using N5 interface.
Figure 9: 5GC + Network Slice Manager Application Function (NSM-AF)
4. Local audio processing (Sennheiser)
The latency of the local audio processing device consists of two portions. First, the 5G / network transmission-related handling and processing. This section is similar to the processing in the user terminal application, deterministic and known to be smaller than 50 microseconds from network packet reception to availability of individual digital audio samples and vice versa. Second, the audio-related processing, filtering, and mixing. This latency has typically a large portion of algorithmic audio delay and can vary between one and tens of milliseconds depending on the applied filtering and effects. In this 5G network evaluation we assume that the audio data is simply looped back, omitting the algorithmic audio delay. Again, when sending audio packets from the local audio processing the network transfer periodicity must be added to the latency.
Since the local audio processing device is based on the same hardware and software platform as the user terminal the verification measurement described in Figure 7 and Figure 8 is also valid for this device.
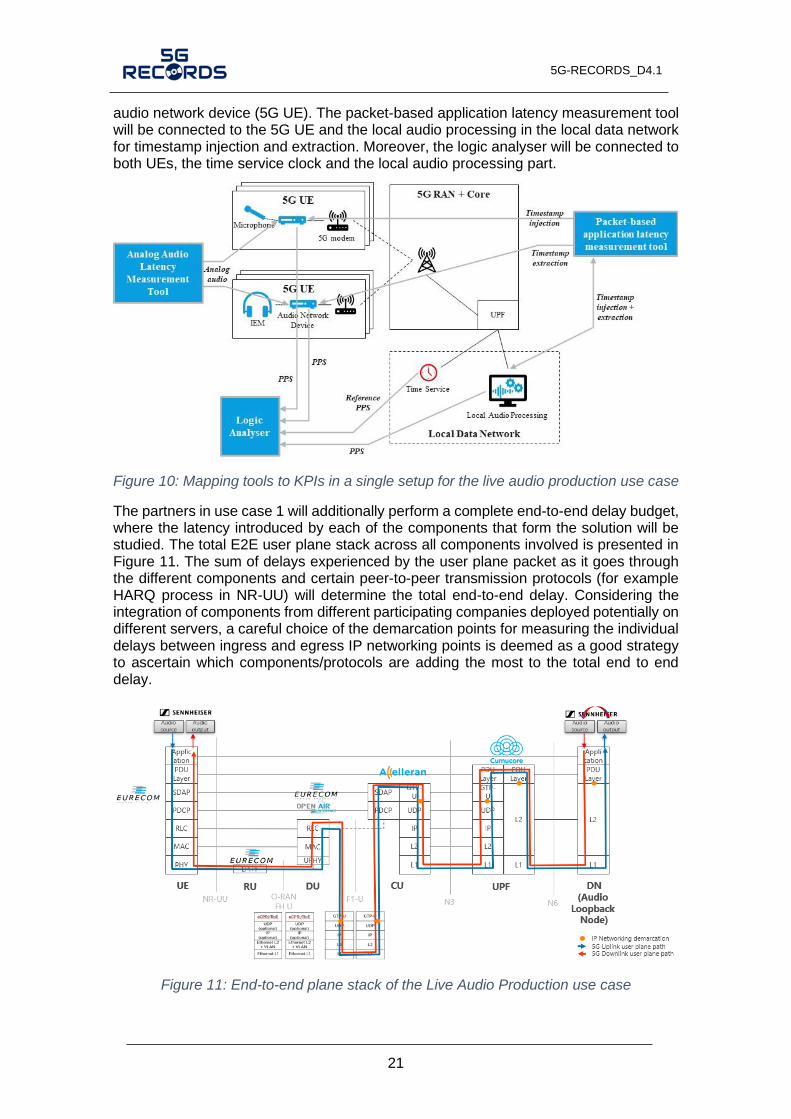
2.4.2 End-to-end integrated solution
The KPIs presented in Section 2.3.1 will be additionally measured using the tools described in previous subsections in an end-to-end solution as shown in Figure 10. As it can be observed, the analogue audio latency measurement tool will be connected to the
5G-RECORDS_D4.1
21
audio network device (5G UE). The packet-based application latency measurement tool will be connected to the 5G UE and the local audio processing in the local data network for timestamp injection and extraction. Moreover, the logic analyser will be connected to both UEs, the time service clock and the local audio processing part.
Figure 10: Mapping tools to KPIs in a single setup for the live audio production use case
The partners in use case 1 will additionally perform a complete end-to-end delay budget, where the latency introduced by each of the components that form the solution will be studied. The total E2E user plane stack across all components involved is presented in Figure 11. The sum of delays experienced by the user plane packet as it goes through the different components and certain peer-to-peer transmission protocols (for example HARQ process in NR-UU) will determine the total end-to-end delay. Considering the integration of components from different participating companies deployed potentially on different servers, a careful choice of the demarcation points for measuring the individual delays between ingress and egress IP networking points is deemed as a good strategy to ascertain which components/protocols are adding the most to the total end to end delay.
Figure 11: End-to-end plane stack of the Live Audio Production use case

5G-RECORDS_D4.1
22
One strategy to calculate the individual delay budgets can be to send packets in uplink and downlink across the system using iPerf or ping tools as discussed in Section 2.3.2. and measure the time difference in the timestamping of the packets within the individual component trace/log files. Since the individual component is meant to run within the same server with a common system clock time there is no need for time synchronisation for the individual component measurement. Note also that it does not matter from the point of the individual System Under Test (SUT) component, whether the system is fully integrated with the rest of the real components or with simulated ones.
The proposal is to measure this individual delay using the usual packet sizes and periodicity needed for the live audio production use case. Considering the overall delay budget, we assume the periodicity to be 500 microseconds at maximum. With two exemplary audio channels this results in a User Datagram Protocol (UDP) payload size of 153 bytes.
As an example, Accelleran individual CU-UP delay can be calculated between the ingress and egress demarcations points of the UDP networking stack to include the processing delay of the packet as it goes through GTP-U/PDCP/SDAP/GTP-U between F1-U and NG-U/N3 interfaces as shown below Figure 12.
Figure 12: Example of demarcation points of UC1 CU user plane.
The following table summarizes the different components, the partner that provides such components, and the budget that is expected at the time of writing this document. Note that some of these delays will be defined in a later stage of the project.
Table 2: Delay budget of the live audio production use case.
Component Partner Expected delay
(s)
UE layers processing (assuming Radio Link Control (RLC)
Unacknowledged Mode (UM)) Eurecom TBC
Slot boundary Eurecom 500 (Subcarrier
Spacing (SCS) 30 kHz)
Scheduling request delay (SR periodicity)
Eurecom TBC
Radio propagation Eurecom Negligible
RU/DU processing Eurecom TBC
DU to CU-UP networking Eurecom/Accelleran TBC
CU-UP processing (inc. GTP-U) Accelleran TBC
CU UP to UPF networking Accelleran/Cumucore TBC
UPF processing Cumucore < 50
UPF to Data Network (DN) networking Cumucore/Sennheiser TBC
TOTAL MAX 1000

5G-RECORDS_D4.1
23
3 Multiple camera wireless studio infrastructure
This chapter describes the infrastructure and measurement tools used in the context of the second use case: the multiple camera wireless studio.
3.1 Integration of 5G components
This section follows the same structure as Section 2.1, i.e., integration is divided into three steps: integration of related components, integration of components with the network, and end-to-end integration. The target of this use case is to develop a 5G based IP media production solution. The main challenge is to fulfil the required KPIs and desired functionalities of the system.
3.1.1 Component integration
The related components for the first level of integration are divided into two main scenarios:
Integrated production scenario
• The camera (UE) is equipped/connected with/to the Image Matters encoder and paired with the Fivecomm 5G modem. Both units are in a pre-commercial state at the beginning of the project and will be further developed in this scope. At the moment of writing, both modem and encoder are being developed and will be integrated in this use case for phase-2.
• The media gateway (MG) will be developed by EBU to provide media transport translation.
• Media orchestration and control gateway (MOCG) will be developed by Bisect and will provide control, discovery & registration of the media devices and QoS management.
• Network (RAN+5GC) will be provided by Ericsson and will be the basis for the use case communications.
Remote production scenario
• The camera/video player (UE) will be connected to the LiveU LU800 encoder-transmitter over a standard Serial Digital Interface (SDI) A/V interface. The LU800 integrates a 3rd party 5G modem using standardized interfaces as well as with its own embedded internal 5G modules with external antennas (and connected to the radio in the 5G network at Ericsson Aachen laboratory).
• Video receiver-decoder will be placed at the RAI facility and will receive and decode the video from the LU800 component, using for this transmission the LiveU’s Reliable Transport Protocol (LRT). There are two types of receiver devices: LU2000-SDI and LU2000 Society of Motion Picture and Television Engineers (SMPTE) Hardware (HW)/Software (SW) devices.
• Network Slicing Manager from Cumucore, which has an open API to request data flows. Data flows are organised into slices, and they can have different priorities inside the slice.
3.1.2 Network integration
The second level is about integrating the 5G components with the network. As before, this second level of integration is divided to reflect the two main scenarios.

5G-RECORDS_D4.1
24
Integrated production scenario
• UE + 5G network integration. The 5G indoor camera with the Fivecomm modem and the Image Matters encoders will be installed in the 5G SA network at Ericsson laboratory located in Aachen. This activity is also delayed to phase-2.
Remote production scenario
• The 5G outdoor deployment with the LiveU LU800 has been integrated in the 5G network at Ericsson Aachen laboratory (Subscriber Identity Module (SIM) cards, network parameters, registration process etc). The LiveU video server LU2000 is located at the RAI laboratory at Turin integrated with the Information Technologies (IT) network/routing to facilitate the IP video transfer and communication with the LU800 in Aachen. The RAI SDI-based video flow equipment, the RAI SMPTE PRISM testing equipment device and the PTP master clock are also integrated in Turin.
• MOCG, Media gateway, Network Slicing Manager will be installed in Aachen. RAI production outdoor production site will be connected to Aachen over a dedicated connection.
3.1.3 End-to-end integration
The third level of integration is about the end-to-end integration in the use case scenarios. The partners have agreed on the following plan:
Integrated production scenario
• E2E functionality of the indoor scenario will be tested in Aachen. The target is to verify that 5G with QoS and network slicing can provide reliable and stable connectivity for professional media productions.
Remote production scenario
• E2E functionality of the outdoor scenario with the LiveU equipment will be verified by transmitting from the Ericsson Aachen laboratory into the RAI Turin laboratory, hence tested in both locations/ends.
3.2 Test-bed infrastructure
This subsection describes the infrastructure deployed at the test-bed. For an overall description of the use case architecture, as well as the different components, please refer to deliverable D3.1 [2].
Ericsson administers two 5G infrastructure networks for testing and executing the use case. The use case partners will use the test network for intermediate testing and integration, while the trial network is used for trials, E2E testing and project closure events.
3.2.1 Test network description
The 5G test network is hosted in the Ericsson Eurolab office in Aachen. The test network is a 3GPP Release 15 Non-Public Network (NPN), in which all control plane and user plane functions are hosted on-premises. The test network architecture is depicted in Figure 13. It consists of a SA 5G core and indoor radio dot system solution for the RAN. The control-plane functions are shared with other 5G tests networks located in Eurolab; therefore, the hardware infrastructure is shared with other networks. The network provides the UE by internet connectivity and connectivity to MEC via the local breakout functionality. Ericsson uses The Enterprise Operations Support system (E-OSS) to

5G-RECORDS_D4.1
25
control the network. The test network provides 100 MHz of frequency in the NR band n78 (3.7-3.8 GHz).
Figure 13: 5G test network architecture.
The Ericsson Radio Dot System (RDS) provides a flexible, cost-effective architecture and superior network performance for indoor deployment. It can be easily installed in confined spaces. The test network is hosted indoors, therefore the usage of RDS for the RAN solution is the optimal solution. The RDS has three main components: The Indoor Radio Unit (IRU), the Radio Dots (RD), and the digital unit containing the baseband processing.
The Radio Dot (RD) is a radio front-end including the radio antennas and the RF part. Figure 14 depicts the radio dot used in the laboratory. The RD generates and receives the radio waves enabling radio coverage. It is connected to an IRU with a dedicated LAN cable. The IRU can manage multiple radio dots.
Figure 14: Ericsson Radio Dot (RD).
The Indoor Radio Unit (IRU) acts as an aggregator of signals sent by the Radio Dots and provides the digital interface towards the BBU. Moreover, it provides power to the RDs, radio processing functions, and Analog-to-Digital Conversion (ADC) / Digital-to-Analog Conversion (DAC). It is connected to the RD via a LAN cable and connected to the digital unit via fiber. The IRU is depicted in Figure 15.
g
R
S F
SA F
S C
UPF
SU
C evices
SAUSF
SInternet
S ther
labs
5G-RECORDS_D4.1
26
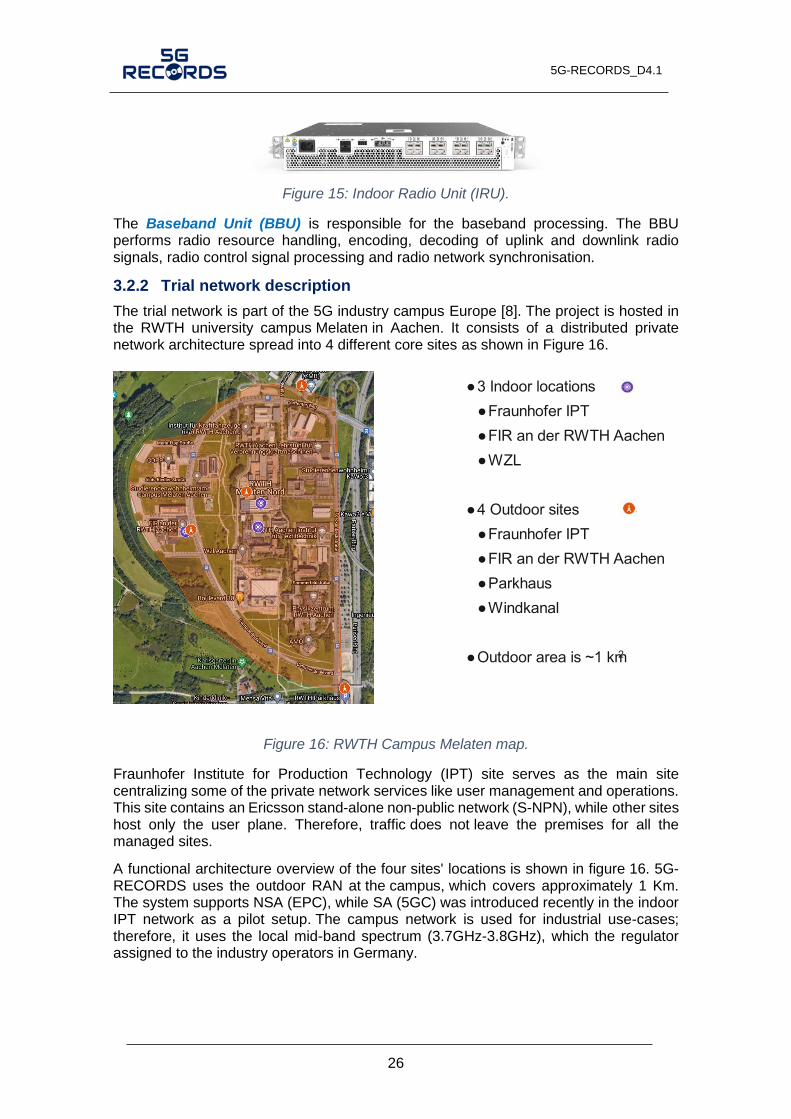
Figure 15: Indoor Radio Unit (IRU).
The Baseband Unit (BBU) is responsible for the baseband processing. The BBU performs radio resource handling, encoding, decoding of uplink and downlink radio signals, radio control signal processing and radio network synchronisation.
3.2.2 Trial network description
The trial network is part of the 5G industry campus Europe [8]. The project is hosted in the RWTH university campus Melaten in Aachen. It consists of a distributed private network architecture spread into 4 different core sites as shown in Figure 16.
Figure 16: RWTH Campus Melaten map.
Fraunhofer Institute for Production Technology (IPT) site serves as the main site centralizing some of the private network services like user management and operations. This site contains an Ericsson stand-alone non-public network (S-NPN), while other sites host only the user plane. Therefore, traffic does not leave the premises for all the managed sites.
A functional architecture overview of the four sites' locations is shown in figure 16. 5G-RECORDS uses the outdoor RAN at the campus, which covers approximately 1 Km. The system supports NSA (EPC), while SA (5GC) was introduced recently in the indoor IPT network as a pilot setup. The campus network is used for industrial use-cases; therefore, it uses the local mid-band spectrum (3.7GHz-3.8GHz), which the regulator assigned to the industry operators in Germany.
Indoor locations
Fraunhofer IPT
FIR an der R T Aachen
L
utdoor sites
Fraunhofer IPT
FIR an der R T Aachen
Par haus
ind anal
utdoor area is 1 m2

5G-RECORDS_D4.1
27
Figure 17: 5G infrastructure in RWTH campus
3.3 Measurement and monitoring tools
This subsection describes the different elements used to measure and monitor the performance of the test-bed. As done in Section 2.3, first the relevant KPIs that can be measured are explained. The section later describes both professional content production and 5G tools to measure such KPIs.
3.3.1 Relevant KPIs
From the full list of KPIs provided in deliverable D2.1 [1], the partners have selected those that are relevant from a measurement perspective for the wireless studio.
The use case consists of two main scenarios; each scenario has different requirements and hence different KPIs. Scenario 1 describes the integration of wireless cameras within production, while scenario 2 describes outside remote contribution. The following subsections describe the selected KPIs per scenario.
Integrated production scenario
1. Uplink throughput:
The system should support at least five cameras. To fulfil the video quality requirements, the video stream must be at least 50 Mbps. Note that typically a studio setup will consist of multiple signals. This KPI refers to the video itself. Other signals may need lower values that will be added to the total Uplink (UL)/Downlink (DL) throughput that needs to be supported by the network. These signals are:
• Return video: 5-10 Mbps (DL).
• Teleprompter: 5-10 Mbps (DL).
• Tally: very low throughput (DL)
• Telemetric: low throughput (bi-directional).
• Intercom: medium (bi-directional)
2. E2E (glass-to-glass) latency:
The system should support low latency profiles with an end-to-end latency in the region of 20-300 ms with ideal value below 40ms. The latency values apply to the programme video signal, but other signals may need similar values as well.
I
IRU
I5
IRU
I
Sv
SvSAPC
Sv S
Se SS
sg
v P
sd
v SS
RF
router
T IPT
I
IRU
I5
IRU
I
Sv
sg
v P
RF
router
T FIR
I
IRU
I5
IRU
I
Sv
sg
v P
RF
router
T L
5 RRU
5 RRU
5 RRU
5 RRU
utdoor IPT utdoor IC utdoor FIR
I
S
S S S
sg
sd R
F
router
SA trial IPT
ots
FIR
ots L
ots
IPT
R T
ac bone
5G-RECORDS_D4.1
28
3. Packet error ratio:
The system shall support a packet error rate of 10-8. Packets that do not conform with the end-to-end latency are also considered an error. The packet error rate requirement is calculated considering 1500 B packets, and 1 packet error per hour is 10-5/(3*x), where x is the data rate in Mbps and then rounded.
4. Timing accuracy:
The absolute difference between any synchronised clock in the network and the time master must be below 1 ms.
Remote production scenario
The remote production scenario with the LiveU equipment transmitting from Ericsson Aachen laboratory into RAI Turin laboratory is measuring slightly different KPIs due to the multiple public internet hops and different scenario attributes.
1. Uplink throughput:
This will be measured using standard networking tools. The throughput for each camera should be greater than 15 Mbps. The contribution camera uses high compression schemes.
2. E2E (glass to glass) latency:
The latency between the sensor capturing an image and the availability of the image in the production gallery should be less than 1000 ms. Due to the nature of the user story, the latency requirements are more relaxed than scenario 1.
3. SMPTE compliance:
The video stream output at the production gallery should be SMPTE compliant and with dual video redundancy supported. SMPTE compliance will be measured using the video signal received by the LiveU video server and outputted by it into the RAI PRISM SMPTE testing equipment.
4. Video quality:
The video received at the production gallery shall pass video quality tests. The exact benchmark video clips to be transmitted are TBD by the project broadcasters.
The partners will evaluate the transmission performance over the 5G and public internet
hops using LiveU application-level parameters. This implies not only UL bandwidth, but
also UL latency and UL loss rate with snapshots at time intervals. Additional functionality
tests such as of Networked Media Open Specifications (NMOS) over the LiveU IP-Pipe
(depending on availability of the NMOS nodes), remote intercom (from RAI laboratory
back into the Aachen laboratory), etc. will also take place.
3.3.2 Professional content production tools and software
The following professional content production tools are planned to be used in the context of use case 2.
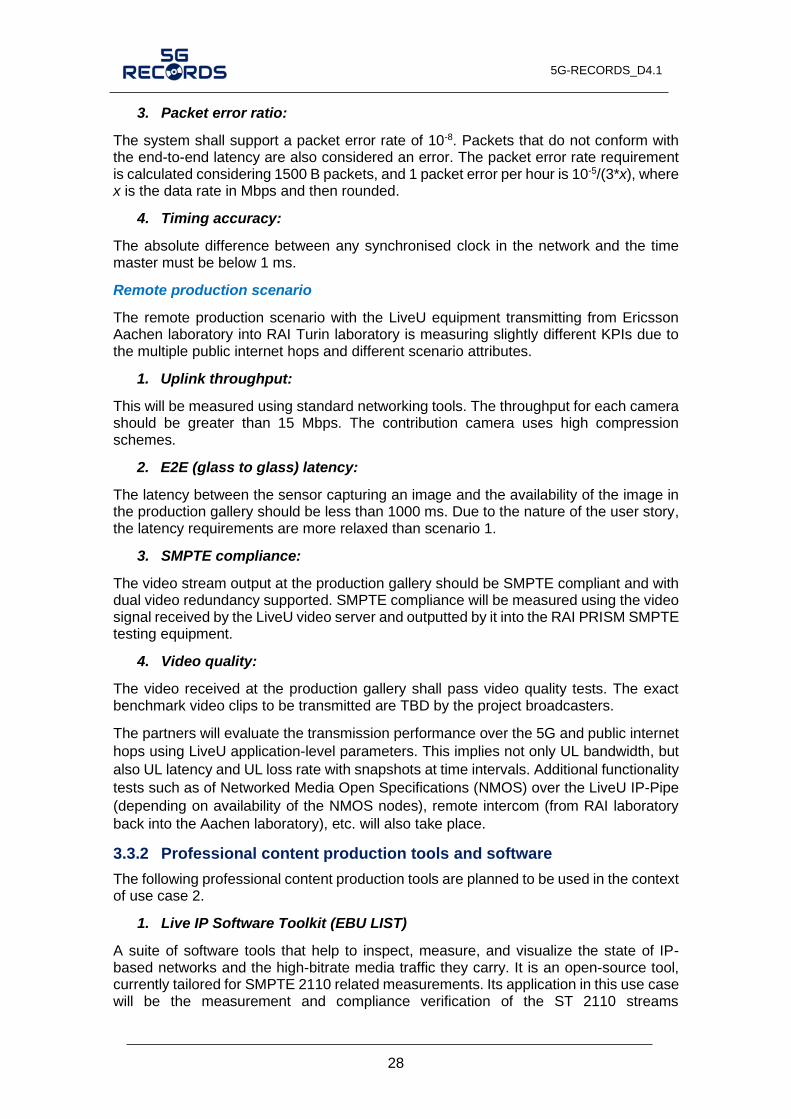
1. Live IP Software Toolkit (EBU LIST)
A suite of software tools that help to inspect, measure, and visualize the state of IP-based networks and the high-bitrate media traffic they carry. It is an open-source tool, currently tailored for SMPTE 2110 related measurements. Its application in this use case will be the measurement and compliance verification of the ST 2110 streams
5G-RECORDS_D4.1
29
regenerated by the media gateway. This tool will be used in both considered scenarios, i.e., the integrated production and remote production scenarios. In Figure 18, a part of the EBU LIST tool interface is shown:
Figure 18: Live IP Software Toolkit (LIST) interface
Related KPIs: UL throughput, packet error ratio.
The following tools will be used for each of the considered scenarios only.
Integrated production scenario
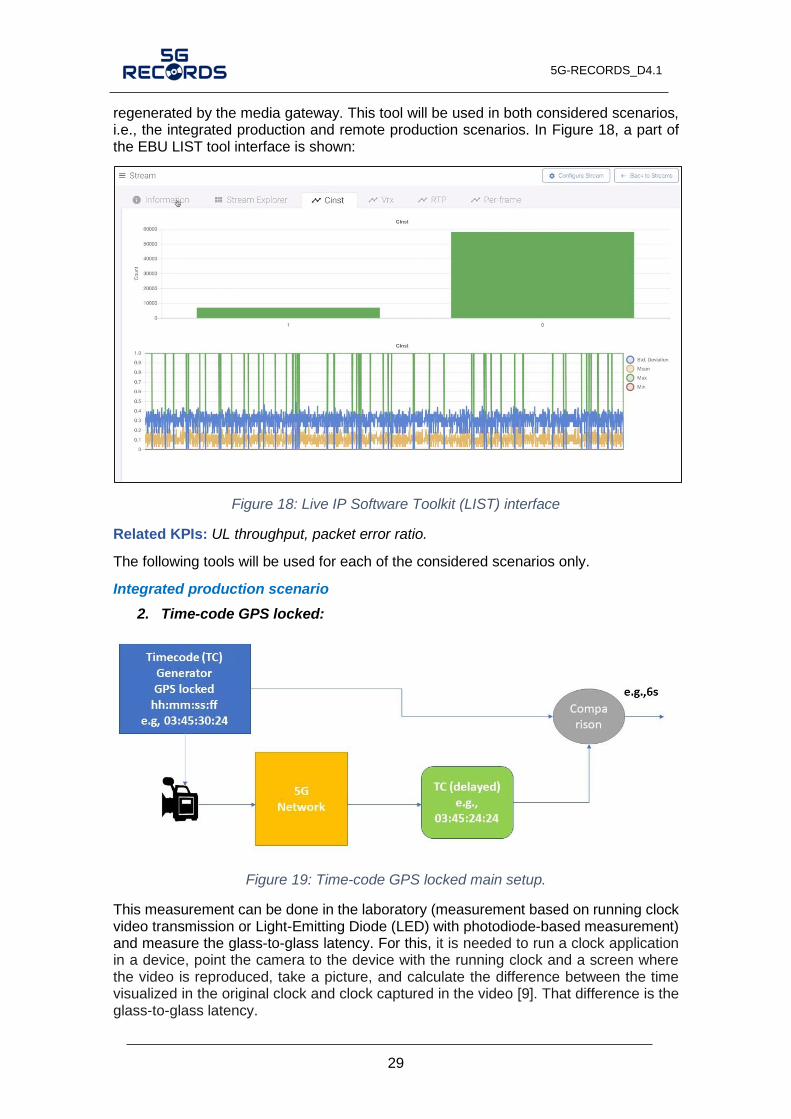
2. Time-code GPS locked:
Figure 19: Time-code GPS locked main setup.
This measurement can be done in the laboratory (measurement based on running clock video transmission or Light-Emitting Diode (LED) with photodiode-based measurement) and measure the glass-to-glass latency. For this, it is needed to run a clock application in a device, point the camera to the device with the running clock and a screen where the video is reproduced, take a picture, and calculate the difference between the time visualized in the original clock and clock captured in the video [9]. That difference is the glass-to-glass latency.

5G-RECORDS_D4.1
30
The accuracy of this measurement depends on several factors:
• The accuracy of the running clock (we consider a GPS locked timecode generator).
• The digital camera frame exposure time in case of rolling shutter capture if the clocks are not correctly aligned.
• The device display refresh rate.
In another method, a camera points to a LED and, a sensor is used to measure the time it takes to detect a change in a screen after the LED is lighted up. We choose photodiodes over photoresistors due to their high speed. The precision of this method is in the order of milliseconds.
Related KPI: E2E (glass-to-glass) latency
3. SCReAM Bandwidth measurement tool:
SCReAM (Self-Clocked Rate Adaptation for Multimedia) is a congestion control algorithm devised mainly for video. Unlike many other congestion control algorithms that are rate-based, i.e., they estimate the network throughput and adjust the media bitrate accordingly, SCReAM is self-clocked which means that the algorithm does not send more data into a network than what exits the network [3].
To achieve this, SCReAM implements a feedback protocol over Real-Time Control Protocol (RTCP) that acknowledges received RTP packets. The feedback determines the congestion window, which determines how many RTP packets can be in flight, i.e., transmitted but not yet acknowledged. An RTP queue is maintained at the sender side to store the pending RTP packets. The RTP queue is usually empty but can temporarily become long when the link throughput decreases. The congestion window is frequently adjusted for minimal E2E delay while maintaining as high link utilisation as possible.
The network congestion control of SCReAM is similar to how the congestion control mechanism in Transmission Control Protocol (TCP) behaves; the main difference is that SCReAM does not retransmit lost packets. Similar to TCP, network congestion control is self-clocked. Therefore, packets are transmitted if feedback is received. This technique prevents the transmission link from becoming overloaded with data, which is good when the throughput decreases rapidly.
The SCReAM library [4] provides a bandwidth test tool. it uses the same techniques used for congestion control during operation. It also allows the exposure of the actual estimation of the network bandwidth.
Related KPI: available system UL throughput
Remote production scenario
4. SMPTE test equipment – Tektronix Prism:
In the RAI Turin laboratory, the video output of the LiveU LU2000SMPTE server shall be connected to the Tektronix Prism test equipment to check for compliance. The Prism SMPTE tests screen for this component is shown in Figure 20.
Related KPIs: SMPTE compliance

5G-RECORDS_D4.1
31
Figure 20: Prism SMPTE tests screen.
5. LiveU LU800-LU2000 SMPTE equipment:
For measuring the application-level uplink bandwidth, latency, and packet loss rate, the LiveU LU800-LU2000 SMPTE is used, exchanging information that enables it to calculate these parameters that are then logged in the application.
Related KPIs: application-level uplink bandwidth, latency, and packet loss rate
3.3.3 5G network-related measurement tools
Integrated production scenario
1. Crit-iPerf:
This tool has been developed with the purpose of preliminary out-of-service assessment of the QoS (Quality of Service) of an IP link to be used for A/V streams delivery. In the context of the 5G-RECORDS, such IP link corresponds to the end-to-end path of the IP stream carrying audio and video packets, including the 5G network.
Specifically, the crit-iPerf tool adds a dedicated A/V-related IP measurements on top of the well-known iPerf tool: iPerf can measure throughput, packet loss (in %) and smoothed jitter according to IETF RFC 3550; crit-iPerf adds:
• Statistics on packet errors (i.e., time between losses, loss burst length, etc.),
• Instantaneous jitter,
• Delay Factor according to IETF RFC 4445.

5G-RECORDS_D4.1
32
Figure 21: Example of output of crit-iPerf tool.
Related KPI: Packet error ratio, packet timing.
2. Nuttcp:
This tool will be used for diagnosis, as an alternative to iPerf3 for analysing throughput. Nuttcp is known to provide more reliable results than iPerf when using UDP traffic.
It is a derivative of the ttcp programme used as a network performance measurement tool. Its main application is to determine TCP or UDP network layer throughput [5]. It can also provide information related to the data transfer such as loss percentage (for UDP transfers). To achieve this goal, nuttcp transfers data from a source system to a destination through a network, being the amount of data and other parameters configurable.
Some useful features are a server mode, rate limiting, multiple parallel streams, and timer-based usage. It includes IPv6 support, IPv4 multicast, and the ability to set the maximum segment size or Type of Service (TOS) or Differentiated Services Code Point (DSCP) bits.
Related KPI: available system UL throughput.
3. PTP testing tools:
A number of software and hardware testing tools will be used to assess PTP accuracy over 5G network. PTP was selected as the most accurate time synchronisation protocol available as of now. However, other options like NTP are also explored and tested. The following setup is used to test the PTP (and NTP) accuracy over 5G NPN:
Received bit-rate = 17958356 bits/s Total time = 112.48 s Packets = 194800 Lost = 19390 Packet Error Rate = 9.953799e-02 ------------------------------------------------------ VB_max total = 31332 Bytes VB_min total = 0 Bytes Delay Factor Max = 13.933868 ms Media Delivery Index = 0.013934 : 172.386708 ------------------------------------------------------ Jitter instantan. avg = 0.046 ms Jitter instantan. max = 250.402000 ms Jitter instantan. min = 0.000000 ms Jitter smoothed max = 15.725347 ms Jitter smoothed min = 0.005959 ms ------------------------------------------------------ Mean Time between loss = 0.005801 s Max Time between loss = 0.049877 s Min Time between loss = 0.000002 s Max loss burst length = 5 Max distance betw bursts = 11119 Min distance betw bursts = 2 Avg distance betw bursts = 11.827433
0
2000
4000
6000
8000
10000
12000
14000
16000
18000
1 2 3 4 5 6 7
No.
of o
ccur
renc
es
Burst length
0
200
400
600
800
1000
1200
1400
1600
1800
1 5 9 13 17 21 25 29 33 37 41 45 49 53 57 61 65 69 73 77 81 85 89 93 97
No.
of o
ccur
renc
es
Distance (no. of IP packets) between error bursts
0
5
10
15
20
25
30
0 20 40 60 80 100 120
ms
Time (s)
Delay FactorJitter smooth. AvgJitter smooth. MaxJitter instant. AvgJitter instant. Max
5G-RECORDS_D4.1
33
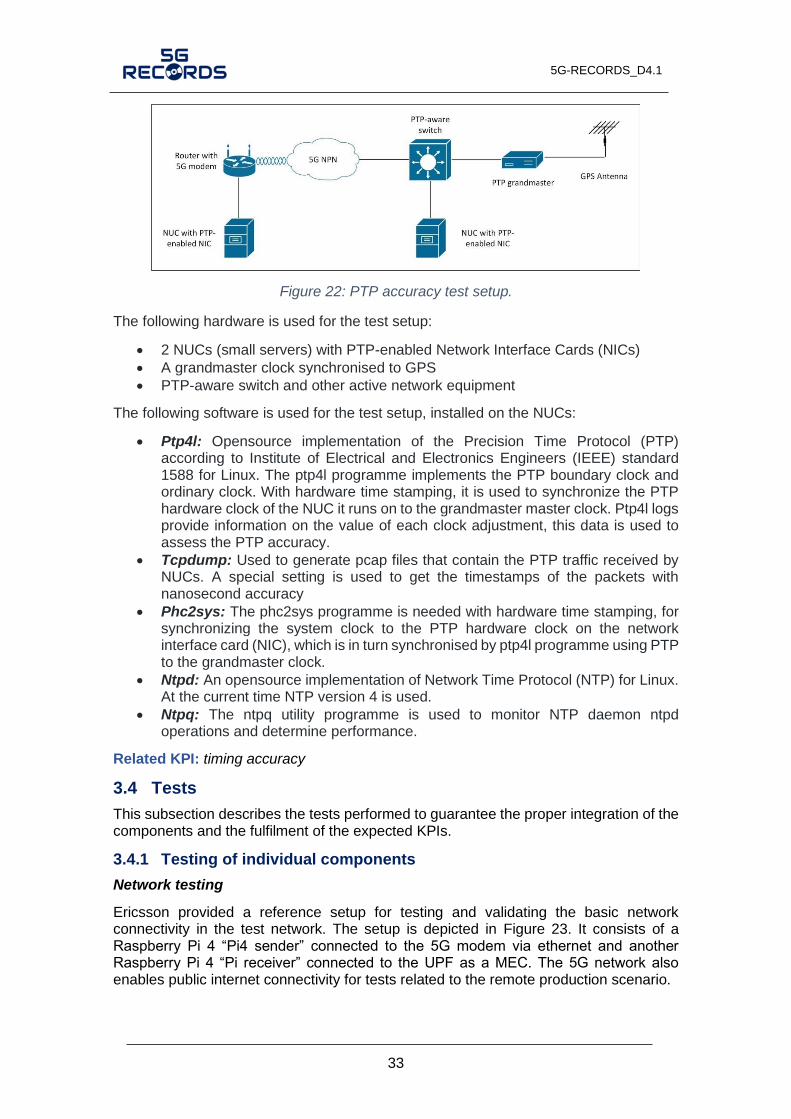
Figure 22: PTP accuracy test setup.
The following hardware is used for the test setup:
• 2 NUCs (small servers) with PTP-enabled Network Interface Cards (NICs)
• A grandmaster clock synchronised to GPS
• PTP-aware switch and other active network equipment
The following software is used for the test setup, installed on the NUCs:
• Ptp4l: Opensource implementation of the Precision Time Protocol (PTP) according to Institute of Electrical and Electronics Engineers (IEEE) standard 1588 for Linux. The ptp4l programme implements the PTP boundary clock and ordinary clock. With hardware time stamping, it is used to synchronize the PTP hardware clock of the NUC it runs on to the grandmaster master clock. Ptp4l logs provide information on the value of each clock adjustment, this data is used to assess the PTP accuracy.
• Tcpdump: Used to generate pcap files that contain the PTP traffic received by NUCs. A special setting is used to get the timestamps of the packets with nanosecond accuracy
• Phc2sys: The phc2sys programme is needed with hardware time stamping, for synchronizing the system clock to the PTP hardware clock on the network interface card (NIC), which is in turn synchronised by ptp4l programme using PTP to the grandmaster clock.
• Ntpd: An opensource implementation of Network Time Protocol (NTP) for Linux. At the current time NTP version 4 is used.
• Ntpq: The ntpq utility programme is used to monitor NTP daemon ntpd operations and determine performance.
Related KPI: timing accuracy
3.4 Tests
This subsection describes the tests performed to guarantee the proper integration of the components and the fulfilment of the expected KPIs.
3.4.1 Testing of individual components
Network testing
Ericsson provided a reference setup for testing and validating the basic network connectivity in the test network. The setup is depicted in Figure 23. It consists of a Raspberry Pi “Pi sender” connected to the 5 modem via ethernet and another Raspberry Pi “Pi receiver” connected to the UPF as a C. The 5 networ also enables public internet connectivity for tests related to the remote production scenario.

5G-RECORDS_D4.1
34
Figure 23: reference setup architecture.
Integrated production scenario
The uplink throughput was analysed using SCReAM and iPerf3 tools presented in previous sections. Both the SCReAM client and the iPerf client were hosted on the Pi4 sender, i.e., UE, while the SCReAM server and the iPerf server were hosted on the Pi4 receiver. The Pi4 sender is the only UE connected to the network with no background traffic. Therefore, the results reflect an ideal network condition. Figure 24 depicts the measurement of the bitrate over 60 seconds. It can be seen that the average value for the bitrate is 97 Mbps.
Figure 24: Bitrate measurement using SCReAM.
Note that the integration work for the integrated production scenario in phase-1 is taking more time than initially planned, since some of the core components are still under development. The components that will be integrated as part of this second phase are the 5G modem and the video encoder on the UE side, and the media gateway.

5G-RECORDS_D4.1
35
Remote production scenario
The tests of the individual components of the Remote Production took place in LiveU Israel R&D laboratory, RAI Turin laboratory (for the LiveU LU2000SMPTE server), and Ericsson Aachen laboratory (for the LU800 video encoder-transmitter).
The tests in LiveU labs included testing various 5G embedded modules including from Sierra Wireless to Quectel. The tests included testing of the module on a specially designed LiveU board, downloading and flashing Firmware (FW) and module FW configurations as LiveU discovered bugs and as the vendors’ own process matured. The Sierra Wireless EM9910 was chosen for this device. Then we continued to test as a full device over the 4G and 5G NSA over Israeli commercial networks, as no network laboratory exists in LiveU. Further tests included testing of various features, such as the bi-directional IP-pipe to allow remote control of cameras via the LiveU solution.
The LU2000 SMPTE server was also tested in LiveU labs to identify compatibility with the standard, to ensure the integration of the Mellanox Rivermax board in the LiveU device- based on SW APIS, achieves the time-critical synchronisation, etc.
Moving into Aachen and Turin labs (Ericsson and RAI, respectively), means the components tests also include an integration part, as the LU800 and the LU2000 server need to be integrated into the partners IT networks following their IT policies, receive and send packets, etc.
In the RAI laboratory the LU2000SMPTE was further tested when connected to a Prism test equipment. To achieve this, it first had to be connected to two RAI IP networks (sub-net addresses and ports forwarding as needed), and in a later stage – to a third network.
These networks were: IP network connected to the public internet – to receive the video packets from the LU800 and communicate with it; to the RAI SMPTE network, to output the video into; and later – to a 3rd IP subnet on which the RAI PTP master clock is connected. The dual SMPTE video outputs were tested against RAI Prism test equipment and was found standard compliant. The main goals of the component tests at RAI were the SMPTE functionality-compliance, as well as some integration into the IT networks environment. On Figure 25, the setup at RAI Torino’s laboratory is presented.
Figure 25: Setup at RAI Torino’s laboratory.
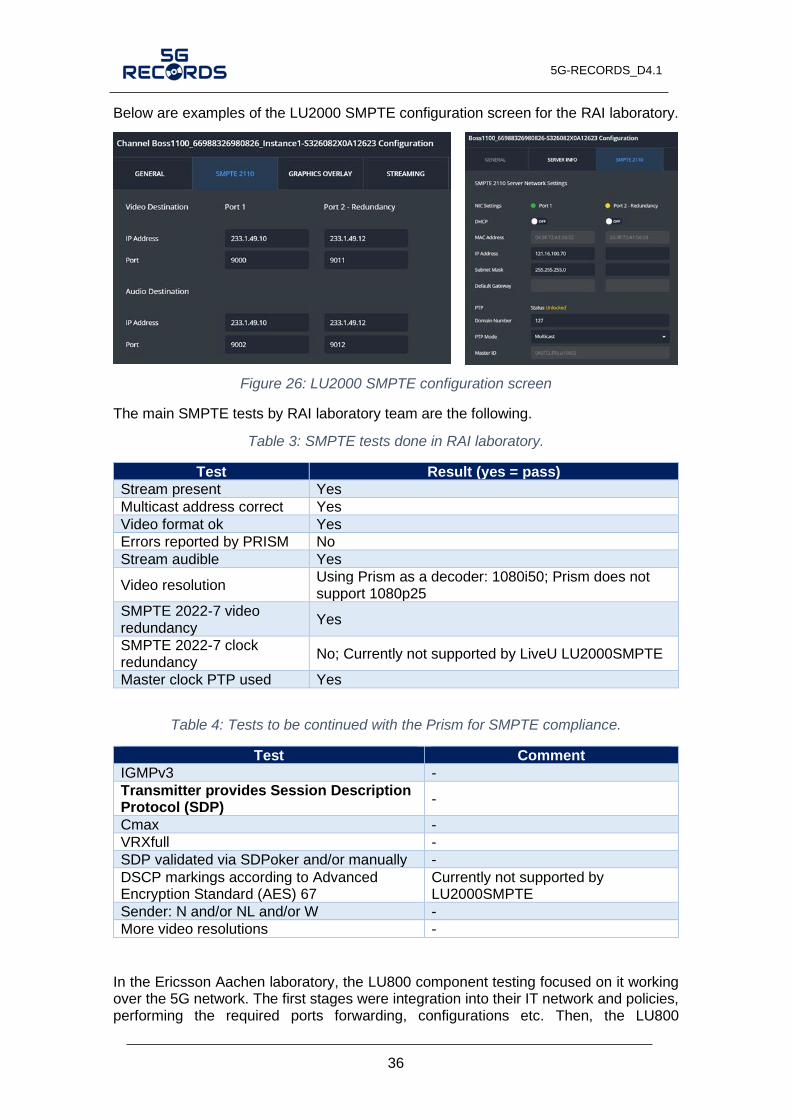
5G-RECORDS_D4.1
36
Below are examples of the LU2000 SMPTE configuration screen for the RAI laboratory.
Figure 26: LU2000 SMPTE configuration screen
The main SMPTE tests by RAI laboratory team are the following.
Table 3: SMPTE tests done in RAI laboratory.
Test Result (yes = pass)
Stream present Yes
Multicast address correct Yes
Video format ok Yes
Errors reported by PRISM No
Stream audible Yes
Video resolution Using Prism as a decoder: 1080i50; Prism does not support 1080p25
SMPTE 2022-7 video redundancy
Yes
SMPTE 2022-7 clock redundancy
No; Currently not supported by LiveU LU2000SMPTE
Master clock PTP used Yes
Table 4: Tests to be continued with the Prism for SMPTE compliance.
Test Comment
IGMPv3 -
Transmitter provides Session Description Protocol (SDP)
-
Cmax -
VRXfull -
SDP validated via SDPoker and/or manually -
DSCP markings according to Advanced Encryption Standard (AES) 67
Currently not supported by LU2000SMPTE
Sender: N and/or NL and/or W -
More video resolutions -
In the Ericsson Aachen laboratory, the LU800 component testing focused on it working over the 5G network. The first stages were integration into their IT network and policies, performing the required ports forwarding, configurations etc. Then, the LU800

5G-RECORDS_D4.1
37
configuration was done so to work with the laboratory 5G SA network. It was also connected via RF cables into the test network since Over-The-Air transmission is not allowed and an RF cage was not available. In another type of tests, as a benchmark, the LU800 was also connected to the laboratory 5G Industrial Router (a.k.a. Customer-Premises Equipment (CPE)) via the RJ45 of the unit. This router is connected into the laboratory 5G SA.
The results of these tests are that the LU800 works flawlessly with the 5G Industrial Router over the 5G SA. However, the embedded 5G Sierra module cannot yet connect with the network, neither using the RF cables setup nor OTA. The setup of the LU800 with the router and cell is shown in Figure 27 and Figure 28.
Figure 27: Prism SMPTE tests screen.
Figure 28: Prism SMPTE tests connectivity.
3.4.2 End-to-end integrated solution
Integrated production scenario
Figure 29 depicts the positioning of the tools and KPIs described in section 3.3. The G2G latency will be measured via a locked clock placed in front of the camera sensor, while the image is captured at the monitor located at the studio. The iPerf client and the
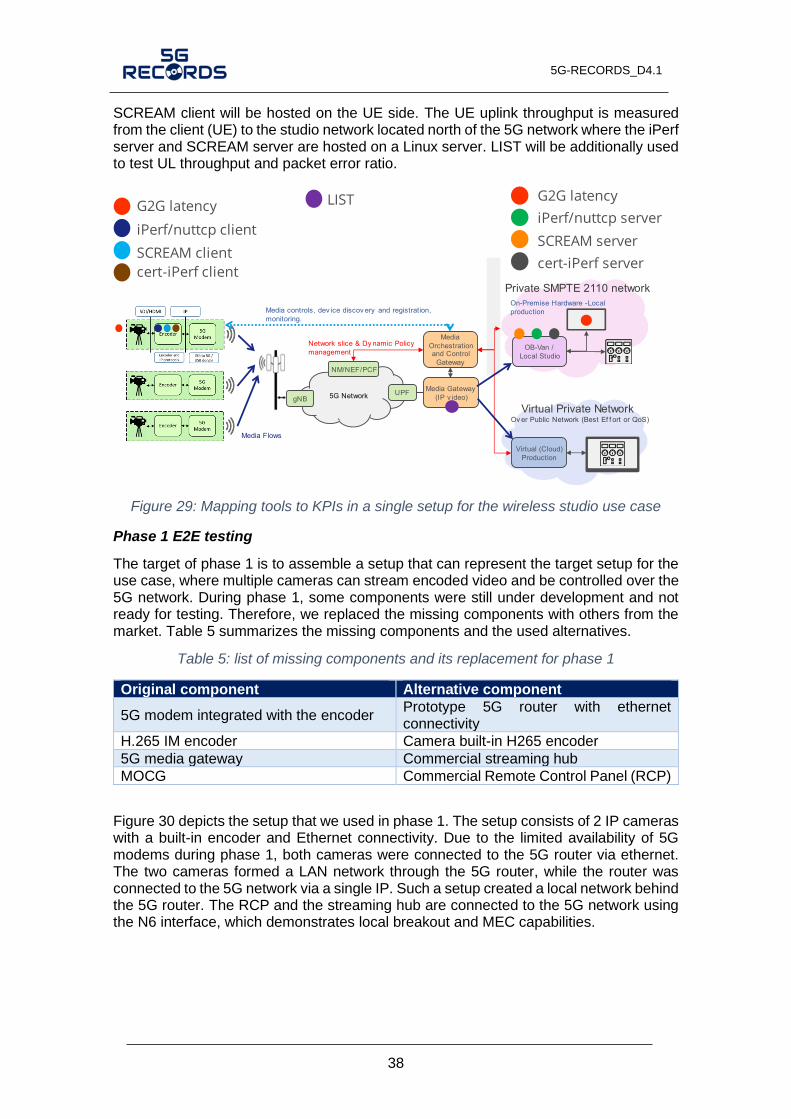
5G-RECORDS_D4.1
38
SCREAM client will be hosted on the UE side. The UE uplink throughput is measured from the client (UE) to the studio network located north of the 5G network where the iPerf server and SCREAM server are hosted on a Linux server. LIST will be additionally used to test UL throughput and packet error ratio.
Figure 29: Mapping tools to KPIs in a single setup for the wireless studio use case
Phase 1 E2E testing
The target of phase 1 is to assemble a setup that can represent the target setup for the use case, where multiple cameras can stream encoded video and be controlled over the 5G network. During phase 1, some components were still under development and not ready for testing. Therefore, we replaced the missing components with others from the market. Table 5 summarizes the missing components and the used alternatives.
Table 5: list of missing components and its replacement for phase 1
Original component Alternative component
5G modem integrated with the encoder Prototype 5G router with ethernet connectivity
H.265 IM encoder Camera built-in H265 encoder
5G media gateway Commercial streaming hub
MOCG Commercial Remote Control Panel (RCP)
Figure 30 depicts the setup that we used in phase 1. The setup consists of 2 IP cameras with a built-in encoder and Ethernet connectivity. Due to the limited availability of 5G modems during phase 1, both cameras were connected to the 5G router via ethernet. The two cameras formed a LAN network through the 5G router, while the router was connected to the 5G network via a single IP. Such a setup created a local network behind the 5G router. The RCP and the streaming hub are connected to the 5G network using the N6 interface, which demonstrates local breakout and MEC capabilities.
5 etwor
F PCF
UPFg
edia ateway
(IP v ideo
edia
rchestration and Control
ateway
edia controls dev ice discov ery and registration
monitoring.
Private S PT 2110 networ
irtual Private etwor ver Public etwor ( est f f ort or oS
irtual (Cloud
Production
an
Local Studio
n Premise ardware Local
production
edia Flows
etwor slice y namic Policy
management

5G-RECORDS_D4.1
39
Figure 30: phase 1 for the integrated production scenario setup.
Table 6 summarizes the camera capabilities
Table 6: Camera capabilities.
Camera connectivity Ethernet RJ45
Streaming protocols RTSP,SRT,RTMP,NDI
Codecs H.264, H.265 up to 30 Mbps
Camera connector SDI
Controller Web GUI via HTTP API
The setup was first validated over a local ethernet network, i.e., without 5G connectivity. However, once we connected the setup over 5G, the RCP failed to connect to both cameras, and only the SRT video signal was received.
Figure 31. Connection status with NAT.
Figure 31 depicts the connection status when the camera is connected to the network behind a Network Address Translator (NAT). We concluded that the control signals were

5G-RECORDS_D4.1
40
blocked because the HTTP client hosted in the RCP failed to establish a connection with the HTTP server hosted in the camera. We also made the same conclusion for the RTSP video signal. The reason for such behavior is that both the HTTP server and the RTSP server are hosted in the camera and listening for a connection on ports 80 and 554, respectively. However, the ports can only be accessed only inside the LAN network. Therefore, the RCP and the streaming hub were not able to connect to the cameras. In SRT, we could change its configuration to host the SRT listener in the streaming hub and the SRT caller in the camera. This configuration allowed the camera to establish a connection to the streaming hub and stream the video signal. The streaming hub is connected as a MEC in the 5G domain without a NAT, so it is accessible for the SRT caller.
Figure 32. Port forwarding enabled.
Figure 32 depicts the solution we used to allow connectivity behind a NAT. We enabled port forwarding in the NAT [10]. In this solution, the NAT is manually configured to listen to incoming requests on the WAN network, i.e., 5G domain, on an external port and forward it in the LAN network on an internal port.
Design considerations
It is expected that each device in the 5G network will have its own 5G modem which means that the scenario of having a LAN network within an S-NPN is highly unlikely to occur. However, the transition towards a cloud-based media production and multiple studios production as described in [1] will introduce a more complex setup that must be secured with firewalls and IT security to protect the assets against attacks. Therefore, any request to initialize a connection with a device inside the network from outside the network could be blocked. More information on the deployment scenarios can be found in [2].
e foresee devices such as cameras mics and monitors don’t host or expose a server e.g., HTTP server, RTSP server. But the device can establish a remote connection towards a trusted server that can interact and control the device. A detailed description of a service design with compatibility to cloud production can be found in MOCG and media getaway sections in [2].
Remote production scenario
During the E2E tests, the RAI Turin SMPTE Prism screen status is shown below.
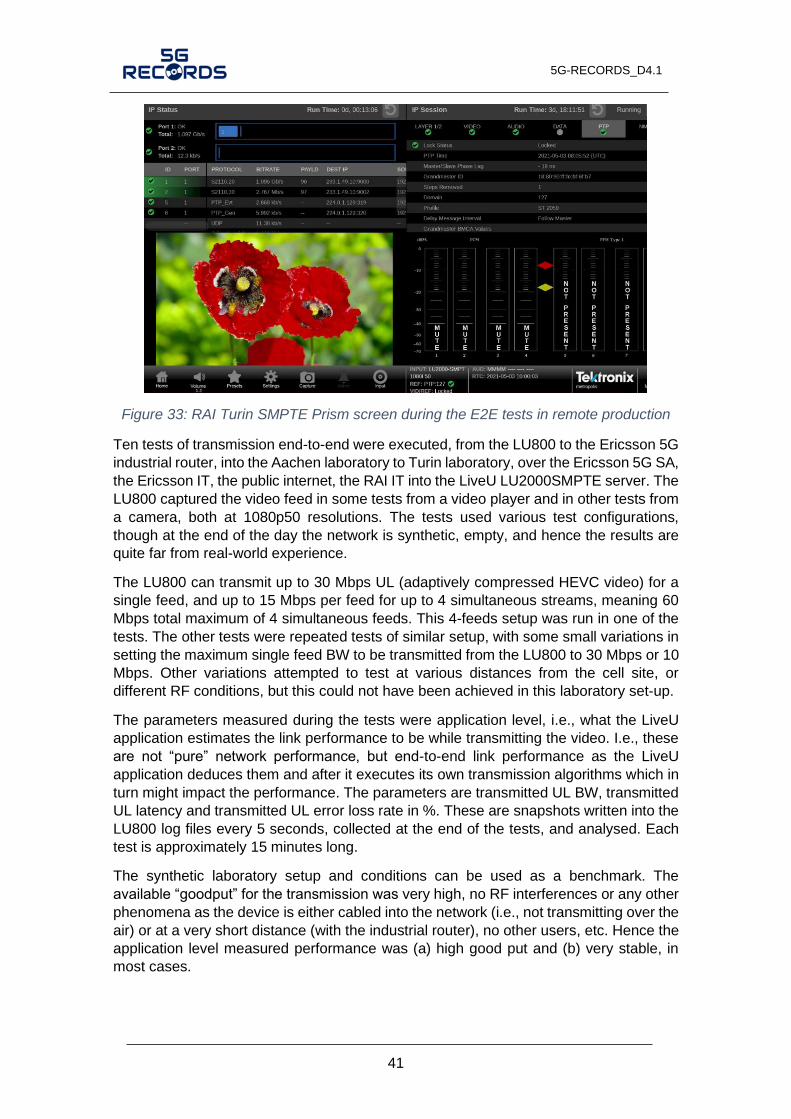
5G-RECORDS_D4.1
41
Figure 33: RAI Turin SMPTE Prism screen during the E2E tests in remote production
Ten tests of transmission end-to-end were executed, from the LU800 to the Ericsson 5G
industrial router, into the Aachen laboratory to Turin laboratory, over the Ericsson 5G SA,
the Ericsson IT, the public internet, the RAI IT into the LiveU LU2000SMPTE server. The
LU800 captured the video feed in some tests from a video player and in other tests from
a camera, both at 1080p50 resolutions. The tests used various test configurations,
though at the end of the day the network is synthetic, empty, and hence the results are
quite far from real-world experience.
The LU800 can transmit up to 30 Mbps UL (adaptively compressed HEVC video) for a
single feed, and up to 15 Mbps per feed for up to 4 simultaneous streams, meaning 60
Mbps total maximum of 4 simultaneous feeds. This 4-feeds setup was run in one of the
tests. The other tests were repeated tests of similar setup, with some small variations in
setting the maximum single feed BW to be transmitted from the LU800 to 30 Mbps or 10
Mbps. Other variations attempted to test at various distances from the cell site, or
different RF conditions, but this could not have been achieved in this laboratory set-up.
The parameters measured during the tests were application level, i.e., what the LiveU
application estimates the link performance to be while transmitting the video. I.e., these
are not “pure” networ performance but end-to-end link performance as the LiveU
application deduces them and after it executes its own transmission algorithms which in
turn might impact the performance. The parameters are transmitted UL BW, transmitted
UL latency and transmitted UL error loss rate in %. These are snapshots written into the
LU800 log files every 5 seconds, collected at the end of the tests, and analysed. Each
test is approximately 15 minutes long.
The synthetic laboratory setup and conditions can be used as a benchmark. The
available “goodput” for the transmission was very high, no RF interferences or any other
phenomena as the device is either cabled into the network (i.e., not transmitting over the
air) or at a very short distance (with the industrial router), no other users, etc. Hence the
application level measured performance was (a) high good put and (b) very stable, in
most cases.

5G-RECORDS_D4.1
42
In the next stages the partners will test in the laboratory with some UL load emulation
and, most importantly, go to a non-indoor laboratory facility to be able to transmit over-
the-air, even if network loads and other conditions will still be favourable.
Below, some of the tests’ results can be seen, as the LiveU application deduces them.
The line in blue with the left hand-side Y axis represents the transmitted bandwidth in
kbps, the grey line with the right hand-side Y axis is the UL latency in msec, while the
orange line with right hand-side Y axis is the UL loss rate in %. Note that the jigsaw
pattern of the latency, many times seen between 30 msec and 60 msec (E2E), is a result
of LiveU transmission algorithms for cellular networks.
Figure 34: Three examples of LU800 transmissions at 30mbps at a synthetic 5G SA laboratory, single feed.

5G-RECORDS_D4.1
43
Figure 35: 60mbps UL transmission of 4 simultaneous streams.

5G-RECORDS_D4.1
44
4 Live immersive media production infrastructure
This chapter describes the infrastructure and measurement tools deployed to integrate and test the third use case in 5G-RECORDS: live immersive media production.
4.1 Integration of 5G components
This section describes the activities that have been performed to integrate the 5G components into an end-to-end platform. Integration is done in three phases: integration of related components, integration of components with the network, and end-to-end integration.
The target of this use case is to develop a high-definition free-viewpoint-video (FVV) solution to provide a new kind of experience to viewers in the location of the live event, as well as to remote viewers. The most challenging part of the solution is the very high bit rate (especially in the upstream direction) that is enabled by the millimetre-wave (mmW) 5G radio interface.
4.1.1 Component integration
The related components for the first level of integration are the following:
• Cameras and capture servers, provided by UPM, generate the individual view streams. They are connected to the modem (UE), provided by Nokia, using an ethernet interface.
• 5G Network (RAN+5GC) is provided by Nokia. Integration of UEs with the network is performed in Nokia premises.
• View Renderer VNF, responsible for generating the free-viewpoint virtual view, is provided by UPM. It is integrated within Nokia-provided Multi-Access Edge Computing (MEC) infrastructure.
• Media Delivery/Media Proxy VNFs are developed by Nokia. They are responsible for the delivery of the FVV stream from the view renderer to the end user. Media Delivery VNF is integrated with TID Edge Cloud. Media Proxy is integrated with Nokia MEC.
• Transport network is provided by Telefónica. TID is responsible of integrating the Edge Cloud within the operator transport network. Delivery network (Fiber To The Home (FTTH)) is also provided by Telefónica.
• Slice selector is provided by TID and integrated with the transport and delivery network.
• Media player is provided by TID. It is an HTTP Live Streaming (HLS) player which is integrated, using standard HTTP delivery, with the Media Delivery VNF.
4.1.2 Network integration
The second level is about integrating the 5G components with the network.
• UE + Network (RAN+5GC) + MEC + Media Renderer integration is done in Nokia laboratory in Madrid. The second phase trials will be done in Segovia.
• Near Edge + Edge cloud integration is done by connecting Segovia central office and Peñuelas (Madrid) central office routers using two direct VLANs in the commercial transport network, one for each transport slice.

5G-RECORDS_D4.1
45
• Media Delivery + End users are performed by connecting Media Delivery deployed at Peñuelas TID laboratory with Telefonica Transport Network that has national coverage being able to reach remote users in any city of Spain.
4.1.3 End-to-end integration
The third level of integration is about the end-to-end integration in the considered scenario. The final end-to-end integration implies the connection of the capture + renderer section (integrated in Nokia premises) with the transport + delivery section (in transport network). In this first phase of the project, it will be done in a pilot 5G deployment in Segovia, Spain.
4.2 Test-bed infrastructure
This subsection describes the infrastructure deployed at the test-bed. For an overall description of the architecture, as well as the different components, please refer to deliverable D3.1 [2].
Figure 36 shows the architecture for UC3. It comprises several locations: a smart venue with the media acquisition system and the access network, a near-edge cloud with the media production functions, an edge cloud with the media delivery function, and the remote locations of the end-users.
Figure 36: UC3 architecture. Shadowed modules are not included in this first release.
For the first trial, the smart venue and near edge will be located in Segovia (Spain), while the Edge Cloud will be located in Madrid, and the end-users will be distributed in several locations in Spain.
For the integration and the performance testing prior to the trial, the test-bed has been divided in two sites:
• The access network and near-edge cloud (Media Acquisition and Production) is tested in a laboratory in Nokia premises. It replicates the conditions (hardware and configuration) that will be present in the trial site.
• The Media Delivery functionality is tested in the same locations as the trial. It includes the connectivity between the Near-Edge (Segovia) and the Edge (Madrid), as well as all the SDN and cloud functions required to progress the output of the view renderer to the end-users.

5G-RECORDS_D4.1
46
4.2.1 Media Acquisition and Production test-bed network description
The integration and testing of the content production will be done in the test-bed in the Nokia premises (Madrid). This test-bed will validate the complete E2E functionality from the perspective of the content producer: from the capture to the generation of the virtual view.
Figure 37: UC3 integration architecture (acquisition and production).
The network is described in Figure 37. It is comprised of the following components (see figure below):
• 3 capture servers (only one represented in the figure), each with 3 cameras. A test version of the software will also be developed so that the capture server can work without actual cameras (using pre-recorded captures), but still being able to perform the rest of the functionality.
• 3 mmW modems (Askey RTL305, represented as CPE in the figure) in band n257. They are connected via Gigabit ethernet with the capture servers.
• A Nokia AEUB AirScale mmW radio head at band n257.
• LTE radio heads (for NSA).
• A 5G NSA Base Station configuration, including a NR gNB and an LTE eNB (all of them Nokia products).
• A virtualized NSA core. It is a laboratory version from Nokia (different from, but with equivalent functionality as, the one which will be used in the test site).
• A Nokia AirFrame OpenEdge MEC platform running the appropriate VNFs.
Figure 38: Nokia test-bed.
For details on the different flows between the components, refer to deliverable D3.1 [2].

5G-RECORDS_D4.1
47
4.2.2 Edge and Media Delivery test-bed network description
The second test-bed will test the edge connectivity and the transport of the video for the delivery functionality. It will be mostly hosted by Telefónica I+D in the Edge Cloud location at Madrid (Peñuelas data centre). But it also includes the connectivity through the Telefónica production network, both with Nokia equipment at the Near-Edge cloud and with the end-users in the remote locations, as shown in Figure 39.
Figure 39: UC3 integration architecture (edge and delivery).
It is comprised of the following elements:
• Video ingestion connectivity: From Near Edge Cloud (Segovia) to Madrid (Edge Cloud) where two slices are configured (Multimedia and Best Effort).
• Video Delivery connectivity: From Madrid (Edge Cloud) to end-users where two slices are configured (Multimedia and Best Effort).
• Edge Cloud connectivity: within Edge Data Center that orchestrate the connection of the remote users into the different slices.
Two transport slices are defined end-to-end so that traffic of different level of relevance can be handled with different priority across the network. For details on the functionality, please refer to D3.1.
1. Video ingestion connectivity: From Near Edge Cloud (Segovia) to Madrid (Edge Cloud)
Two transport slices are defined: one slice will be in multimedia priority and the other one in best effort priority. Connectivity details are specified in Figure 40:
Figure 40: Video ingestion connectivity details.
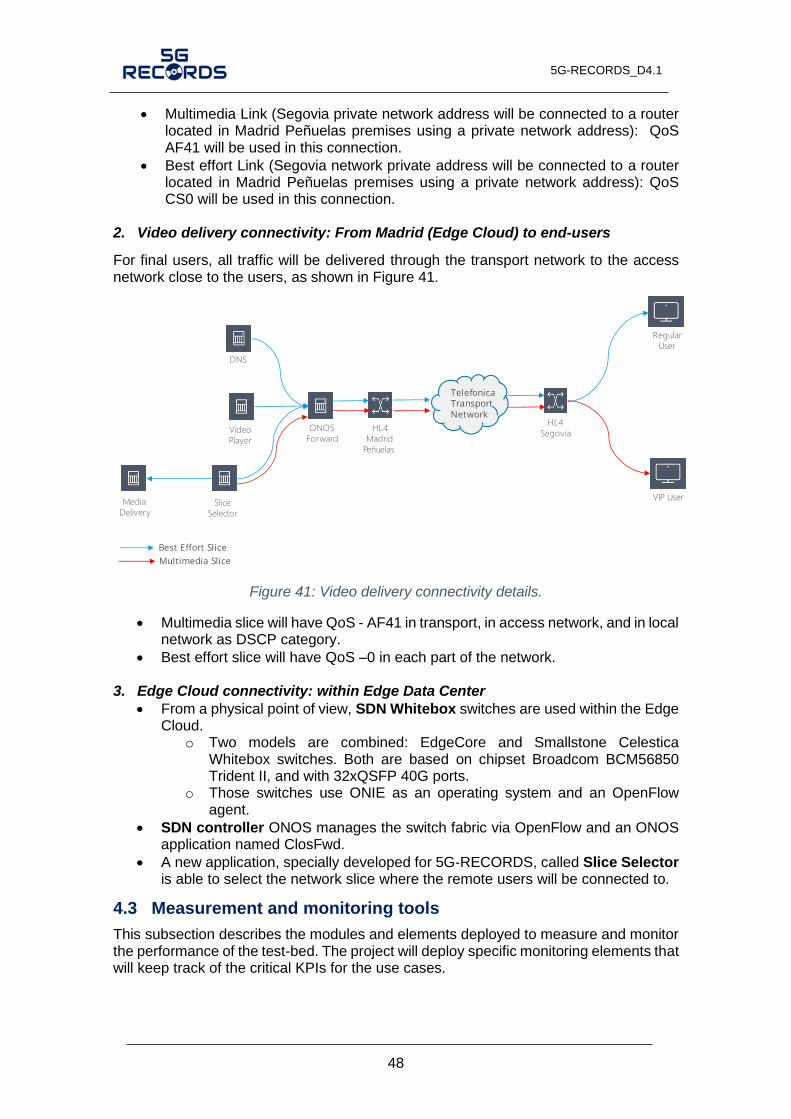
5G-RECORDS_D4.1
48
• Multimedia Link (Segovia private network address will be connected to a router located in Madrid Peñuelas premises using a private network address): QoS AF41 will be used in this connection.
• Best effort Link (Segovia network private address will be connected to a router located in Madrid Peñuelas premises using a private network address): QoS CS0 will be used in this connection.
2. Video delivery connectivity: From Madrid (Edge Cloud) to end-users
For final users, all traffic will be delivered through the transport network to the access network close to the users, as shown in Figure 41.
Figure 41: Video delivery connectivity details.
• Multimedia slice will have QoS - AF41 in transport, in access network, and in local network as DSCP category.
• Best effort slice will have QoS –0 in each part of the network.
3. Edge Cloud connectivity: within Edge Data Center
• From a physical point of view, SDN Whitebox switches are used within the Edge Cloud.
o Two models are combined: EdgeCore and Smallstone Celestica Whitebox switches. Both are based on chipset Broadcom BCM56850 Trident II, and with 32xQSFP 40G ports.
o Those switches use ONIE as an operating system and an OpenFlow agent.
• SDN controller ONOS manages the switch fabric via OpenFlow and an ONOS application named ClosFwd.
• A new application, specially developed for 5G-RECORDS, called Slice Selector is able to select the network slice where the remote users will be connected to.
4.3 Measurement and monitoring tools
This subsection describes the modules and elements deployed to measure and monitor the performance of the test-bed. The project will deploy specific monitoring elements that will keep track of the critical KPIs for the use cases.

5G-RECORDS_D4.1
49
4.3.1 Relevant KPIs
As explained in the other two use cases, from the full list of KPIs provided in deliverable D2.1, Section 5.4, partners have selected those that are relevant from a measurement perspective for the live immersive media production use case.
In particular, the following KPIs have been selected:
1. E2E (motion-to-photon) latency:
Motion-to-photon latency is the time needed in the system for a specific user movement to be reflected on a display screen. The system should support low latency profiles with an end-to-end latency in the region of 170 ms. This E2E latency refers to the virtual camera control loop: between the cameras, the view renderer, and the virtual camera operator (production console).
2. Uplink bitrate:
The system should support nine to twelve cameras that generate bitrates between 50 and 100 Mb/s uplink per camera. Note that this setup will consist of multiple cameras. This KPI can be split in three different areas:
a) Each camera should produce a bitrate of 100 Mbps or lower. The target bitrate would be ~ 50 Mbps.
b) Each Capture UE should at least support 150 Mbps (the uplink from three cameras). The target uplink throughput would be 300 Mbps.
c) The system should support several Capture UEs simultaneously. In the first release, only 3 to 5 cameras will be streaming simultaneously (o a total of 9 cameras in the deployment), but the target would be supporting up to 12 cameras simultaneously streaming over the UL.
3. Round-trip time (RTT) from UE to MEC:
Defined as the time it takes for a packet to go from the sending endpoint (UE) to the receiving endpoint (MEC) and back, and vice versa. It is required to support a low motion-to-photon latency on the camera control loop. It should be less than 40 ms.
4. Virtual View rendering frame rate:
Defined as the achieved frame rate in the View Renderer. In the first release, 15 frames per second (FPS) will be considered the reference operational point, but the target would be supporting 30 FPS.
5. Remote user throughput:
Remote premium users should support TCP/UDP throughputs as defined in the following table. Note that multiple users can be receiving service simultaneously.
Table 7: UC3 delivery server KPIs
User Flow Protocol Throughput Jitter Latency Packet Loss
Local Producer Delivery Server -> Media Proxy
UDP 10 Mbps (Video)
N/A* <40ms <1%
Remote Producer
Delivery Server -> End User
UDP 50 Mbps (Video)
N/A* <150ms <0.1%
End-users attending locally
Delivery Server -> End User
TCP 20 Mbps / 10 Mbps*
N/A* N/A* N/A*
Premium remote End-users
Delivery Server -> End User
TCP 40 Mbps / 20 Mbps*
N/A* N/A* N/A*

5G-RECORDS_D4.1
50
Regular remote End-users
Delivery Server -> End User
TCP Best effort N/A* N/A* N/A*
* Peak / Mean *Not Applicable
6. Remote user load time and pause (rebuffering) count:
Remote users should satisfy the KPIs described in the following table2. Note that several users may be receiving service simultaneously.
Table 8: UC3 player KPIs.
User Flow Protocol Initial Load
Time Pause Count t for each reproduction
End-users attending
locally
Video: Delivery
Server -> end user
HTTP <=1s =0
Premium remote End-
users
Video: Delivery
Server -> end user
HTTP <=1s =0
Regular remote End-users
Video: Delivery
Server -> end user
HTTP <=3s <=1
4.3.2 Application-related measurement tools
1. Motion-to-photon measurement tool:
The Motion-to-photon delay measurement is carried out using a custom software tool developed specifically for this purpose. This methodology is based on the detection of two specific visual signals that indicate the starting and ending instants of the delay under measurement. These signals are:
1. Abrupt image translation along the vertical axis when a virtual camera movement command is detected on the virtual camera control.
2. When the viewpoint is updated, and the new virtual view is sent to the production console, an abrupt viewpoint change in the direction indicated by the virtual camera movement is generated once it is received.
As both instants are tagged with highly visible effects, it is possible to easily isolate them on a recorded video of the production console using an external high frame rate camera (slow motion mode). If we know the number of frames span between both events and the framerate of the recorded external video, we can compute the time difference between both events. This procedure can be repeated several times so the average motion to photon delay can be computed.
Related KPI: motion-to-photon latency.
2. Offline renderer:
The render time will be measured with a specific component: the offline view renderer. Its goal is to allow the dimensioning of the MEC Graphics Processing Unit (GPU)
2 These KPIs were not originally included in deliverable D2.1. They have been added to have a first measurement of
end-to-end Quality of Experience parameters.

5G-RECORDS_D4.1
51
computing capabilities without the need of deploying a complete capture setup and the transmission of the cameras output streams through the 5G network. The offline renderer receives as input pre-recorded videos of each camera (both Red, Green and Blue (RGB) and depth) from a specific scene. In this way, using this pre-recorded video, the offline view renderer can decode the video streams and synthesize virtual views so the performance of the system can be measured. The offline view renderer implementation, and the pre-recorded videos, have been deployed on a Docker container so it can be easily executed on the MEC. The output of the offline view renderer (video stream of the synthesized result) and the system performance results (time measurements) are stored locally to be analysed after the execution.
Related KPI: virtual view rendering frame rate.
3. Experimental player
For the playback of the video by the users, their own video player will be used. This software video player will be developed by Telefonica I+D and will be based on the opensource framework Videojs. This framework uses HTML5, so the playback can be done on both personal computers and mobile devices. This video player can monitor E2E Media Delivery relevant KPIs.
Related KPIs: remote user load time and pause count.
4.3.3 5G network-related measurement tools
1. Wireshark (bitrate measures)
Wireshark will be used as an external validator of bitrate measures, in particular to test the actual bitrate generated by the cameras. Wireshark is a cross-platform packet capture and analyser tool, which also provides protocol and packet filtering and allows to plot the moving average of the bitrate. So, this piece of software allows for a useful, yet quite coarse study. Specific scripts will be developed to further analyse its results.
Related KPI: uplink bitrate (camera bitrate).
2. Iperf3
Iperf3 is a standard tool to test network throughput. It will be used to test uplink (and downlink) throughput in the RAN or, more specifically, between the capture server and the view renderer locations. It will also be part of the end-user probe, a process that will run on the end-user device that plays the video. These processes will execute the ping and iPerf commands against the media delivery server to obtain the measurements.
Related KPIs: uplink bitrate, remote user
throughput.
3. Ping
Standard Internet Control Message Protocol ICMP ping will be used to measure round-trip-time. These measures will be taken between the capture server and the MEC, as well as between the end clients and the delivery cloud.
Related KPIs: RTT from UE to MEC, remote user throughput.

5G-RECORDS_D4.1
52
4.3.4 KPI monitoring system
In addition to the tools described above, a KPI monitoring VNF will be deployed in the test-bed. Main use case components will include a monitoring module to actively monitor system performance during operation. The architecture of system monitoring, depicted in Figure 42, is common for all monitored elements:
• Application logs are produced with the relevant KPIs.
• Telegraf is used as agent to collect such data.
• Additionally, Telegraf agent retrieves performance logs from the system (CPU consumption, network logs, disk I/O stats, etc.) at infrastructure level. Standard Telefraf plugins are used for that.
• InfluxDb is used as database for time series. It stores the logs from all Telegraf agents.
• Grafana is used for data visualisation, dashboards, etc.
• Optionally, Elasticsearch, Logstash and Kibana (ELK) stack may be used for log management.
Figure 42: UC3 KPI Monitoring architecture.
Regarding security, these platforms will be available in the service management network, NOT offering services to the internet. It is foreseen to deploy two separate monitoring platforms: one for the capture and renderer systems (under Nokia cloud) and another one for delivery systems (under Telefónica cloud).
4.4 Tests
This subsection describes the tests that will be performed to guarantee the proper integration of the components and the fulfilment of the expected KPIs.
Measure and monitoring in this Use Case will be done at three different layers:
1. Individual KPI measurement / system performance evaluation. The KPIs will be measured in their respective systems, both in isolation and in the integrated test-bed. It will be based on standard performance tools, such as iPerf, ping, Wireshark.
2. Monitoring under operation / QoS monitoring. Real-time monitoring of relevant KPIs will be added to key measurement points in the system. Performance logs will be sent to a monitoring VNF (influxDB + Grafana collector). This will allow fine tuning and field trial monitoring.
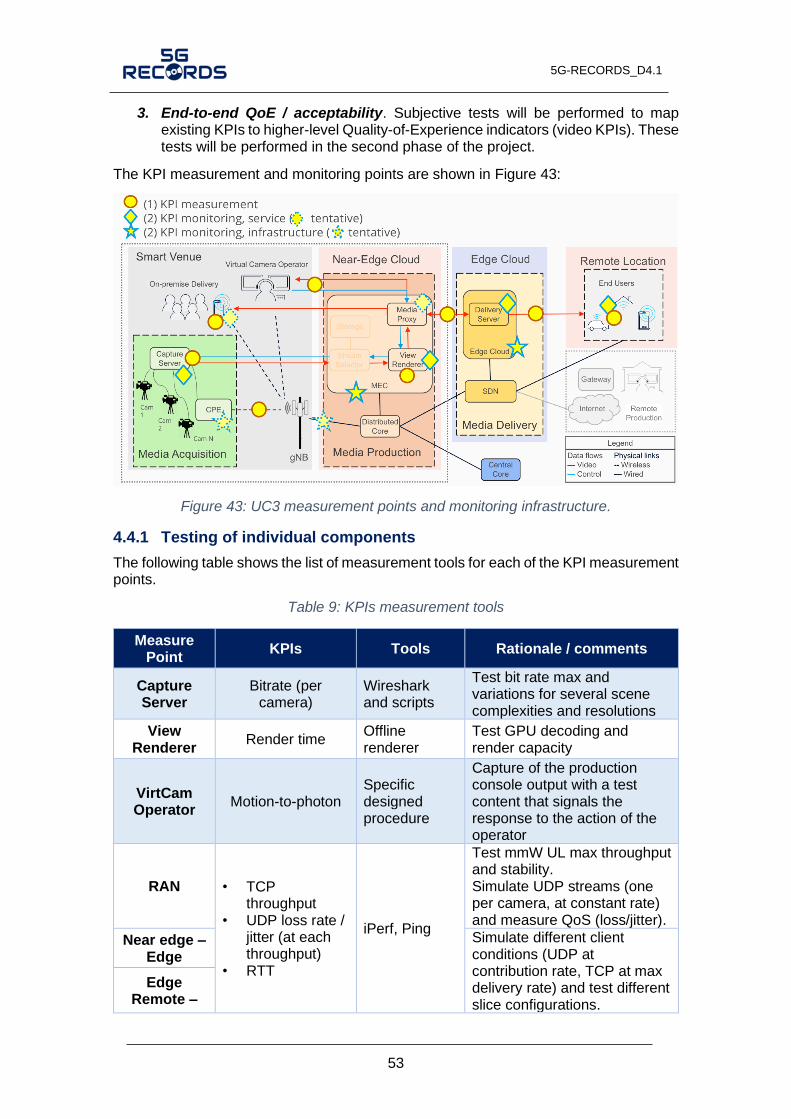
5G-RECORDS_D4.1
53
3. End-to-end QoE / acceptability. Subjective tests will be performed to map existing KPIs to higher-level Quality-of-Experience indicators (video KPIs). These tests will be performed in the second phase of the project.
The KPI measurement and monitoring points are shown in Figure 43:
Figure 43: UC3 measurement points and monitoring infrastructure.
4.4.1 Testing of individual components
The following table shows the list of measurement tools for each of the KPI measurement points.
Table 9: KPIs measurement tools
Measure Point
KPIs Tools Rationale / comments
Capture Server
Bitrate (per camera)
Wireshark and scripts
Test bit rate max and variations for several scene complexities and resolutions
View Renderer
Render time Offline renderer
Test GPU decoding and render capacity
VirtCam Operator
Motion-to-photon Specific designed procedure
Capture of the production console output with a test content that signals the response to the action of the operator
RAN • TCP throughput
• UDP loss rate / jitter (at each throughput)
• RTT
iPerf, Ping
Test mmW UL max throughput and stability. Simulate UDP streams (one per camera, at constant rate) and measure QoS (loss/jitter).
Near edge – Edge
Simulate different client conditions (UDP at contribution rate, TCP at max delivery rate) and test different slice configurations.
Edge Remote –

5G-RECORDS_D4.1
54
End user device
End User device
• Initial Load Time.
• Pause Count
Specific developed media player client
Test video player KPIs
The following figure shows the reference monitoring points in the architecture for each of the KPIs:
Figure 44: Mapping tools to KPIs in a single setup for the live immersive media production use case
1. E2E (motion-to-photon) latency
Motion-to-photon latency will be measured with the tool described before at subsection 4.3.2. Figure 45 shows all the delays involved on the Motion-to-photon delay where:
• T_tx1 is the time delay introduced by the transmission of the virtual view update command from the virtual camera control to the view renderer.
• T_synth is the time delay introduced by the new virtual view rendering.
• T_enc is the time delay introduced by the video encoding of the updated view on the view renderer.
• T_tx2 is the time delay introduced by the transmission of the updated virtual view renderer to the virtual camera control.
• T_dec is the time delay introduced by the video decoding of the stream received with the updated view on the camera control.

5G-RECORDS_D4.1
55
Figure 45: E2E Motion-to-photon latency calculation process.
Motion to Photon latency has been measured under the following conditions:
• Test at UPM laboratory.
• 3 capture servers wired (ethernet) to the rendering server.
• Wi-Fi connection between rendering server and smartphone (virtual camera position control and final rendered view visualizer)
• Evaluation of Motion to Photon latency (time span between a viewpoint update command and its result) over two different scenarios:
o Controlling the virtual camera position using a keyboard wired to the rendering server and displaying the resulting synthetic view on a monitor wired to the server.
o Controlling and displaying the virtual view on the smartphone.
The test results are as follows:
Table 10: Motion to photon latency test results.
Virtual view controller Min (ms) Max (ms) Mean (ms)
Keyboard on rendering server 30 63 47
Smartphone 139 172 156
The worst-case scenarios (63 and 172 ms) correspond to whenever a viewpoint update command is received in the edge server just after the synthesis of a new frame has started. In this case, the synthesis time of the frame at the new virtual viewpoint (30 ms) will not start until the current frame period is over (33 ms).
2. Camera bitrate
Every camera contributes two streams: one carries texture information and the other one transports depth data. The texture streams are set to a fixed bitrate, whereas the depth streams are encoded using lossless compression to avoid quality drops that could significantly impair the result of the synthesis. Thus, the bitrate of the latter can vary heavily depending on the specific captured scenario and so it is worth controlling. Therefore, to measure quantitatively the overall bitrate from each camera, a set of scenarios will be set up. Each scenario is the result of the combination of different parameter values: picture resolution, framerate, and scene complexity.
To measure the individual and aggregated stream bitrate in those scenarios, Wireshark is used at the receiver side. To extend it, enabling a finer-grained analysis, including the
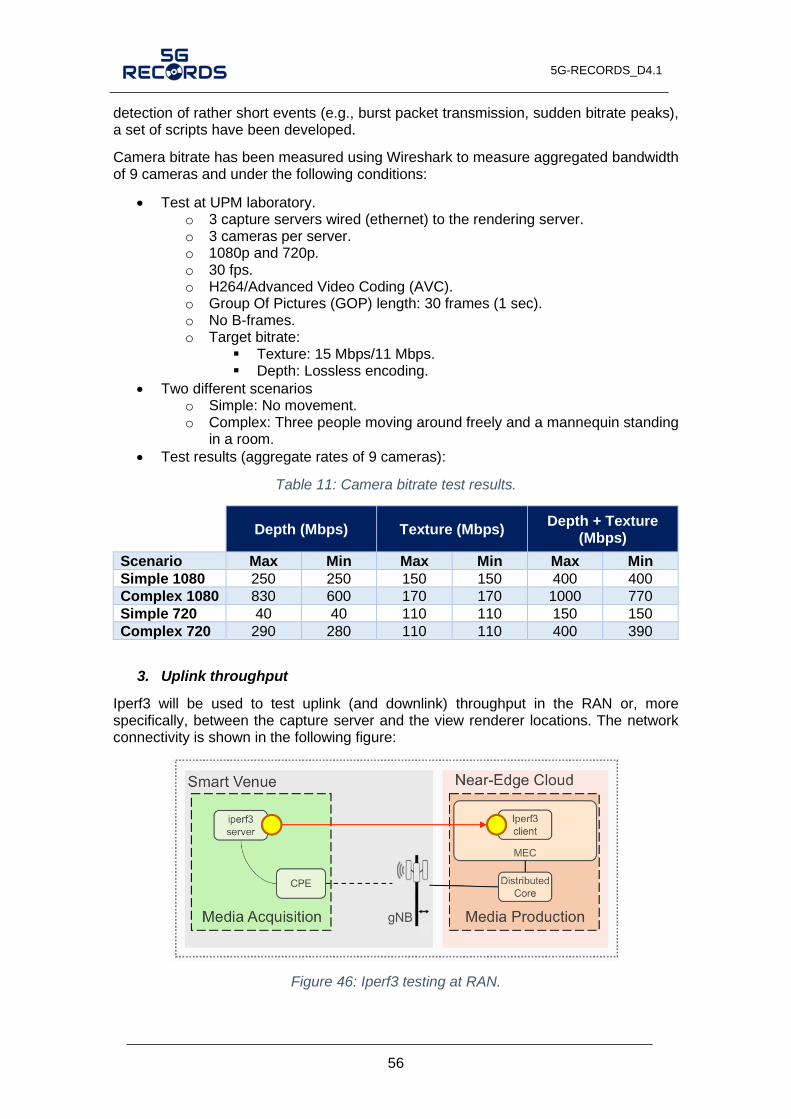
5G-RECORDS_D4.1
56
detection of rather short events (e.g., burst packet transmission, sudden bitrate peaks), a set of scripts have been developed.
Camera bitrate has been measured using Wireshark to measure aggregated bandwidth of 9 cameras and under the following conditions:
• Test at UPM laboratory. o 3 capture servers wired (ethernet) to the rendering server. o 3 cameras per server. o 1080p and 720p. o 30 fps. o H264/Advanced Video Coding (AVC). o Group Of Pictures (GOP) length: 30 frames (1 sec). o No B-frames. o Target bitrate:
▪ Texture: 15 Mbps/11 Mbps. ▪ Depth: Lossless encoding.
• Two different scenarios o Simple: No movement. o Complex: Three people moving around freely and a mannequin standing
in a room.
• Test results (aggregate rates of 9 cameras):
Table 11: Camera bitrate test results.
Depth (Mbps) Texture (Mbps)
Depth + Texture (Mbps)
Scenario Max Min Max Min Max Min
Simple 1080 250 250 150 150 400 400
Complex 1080 830 600 170 170 1000 770
Simple 720 40 40 110 110 150 150
Complex 720 290 280 110 110 400 390
3. Uplink throughput
Iperf3 will be used to test uplink (and downlink) throughput in the RAN or, more specifically, between the capture server and the view renderer locations. The network connectivity is shown in the following figure:
Figure 46: Iperf3 testing at RAN.

5G-RECORDS_D4.1
57
An iPerf3 server is run at/behind each CPE, and a client is run at the VNF at the MEC. The test session is run in reverse mode so that uplink is tested, and logs are recorded at the receptor (client), which is needed for UDP measures.
Two types of measures are foreseen:
• TCP throughput. The target is measuring the TCP throughput variation across time. In this case, no throughput limit is established for the test (or it is set much higher than the actual uplink capacity). Client command line is:
iperf3 -c $IP -P $num -t $DURATION -i $INTERVAL -b $TCP_BITRATE
-R --pacing-time 1 -J --logfile ${TMPDIR}/${test_id}.json
• UDP mode. Measures are done at fixed bitrate, with N streams, each one simulating the peak uplink from a camera. At each measurement interval, throughput, loss rate and jitter are recorded. Client command line is:
iperf3 -c $IP -P $num -t $DURATION -i $INTERVAL -b $br -u -R -J
--pacing-time 1 --logfile ${TMPDIR}/${test_id}.json
The following tests have been performed.
• Common conditions: o Test in Nokia integration laboratory o One mmW modem (Askey model) o One mmW antenna (Nokia AirScale), 2x100 Hz uplink carriers, TDD
4/1MIMO 2x2
• Test results:
Table 12: Uplink throughput test results.
Test Duration Throughput (Mbps) Jitter (ms) Loss Rate (%)
min mean max min mean max min mean max
TCP 20 min 140.2 178.6 200.0
UDP 2x50M 20 min 95.6 100.0 101.8 0.02 0.54 3.61 0.0 0.05 2.2
UDP 3x50M 20 min 144.1 150.0 151.5 0.04 0.61 5.23 0.0 0.05 1.8
4. Round-trip time (RTT) from UE to MEC
ICMP ping is used to measure RTT between the UE and the MEC. It can be run in parallel with the iPerf3 test.
The following tests has been performed.
• Common conditions: o Test in Nokia integration laboratory o One mmW modem (Askey model) o One mmW antenna (Nokia AirScale), 2x100 Hz uplink carriers, TDD
4/1MIMO 2x2 o Parallel uplink traffic: 0, 50 Mbps, 150 Mbps
• Test results:

5G-RECORDS_D4.1
58
Table 13: Round-trip time test results.
Test Duration RTT min RTT mean RTT max RTT mdev
Ping 20 min 7.6 ms 11.6 ms 19.0 ms 1.6 ms
Ping + 50 Mbps 20 min 6.8 ms 22.0 ms 70.1 ms 14.1 ms
Ping + 150 Mbps 20 min 47.3 ms 150.2 ms 567.0 ms 33.0 ms 1-second ping interval
5. Virtual view rendering frame rate
The output of the view renderer (video stream of the synthesized result) and the system performance results (time measurements) are stored locally to be analysed after the execution. The metrics include:
• Total number of rendered frames during the execution.
• Complete rendering time: the time span between the first and last frames are synthetized.
• Frame loading time: Is the time span between the rendering module requests a frame and the decoder delivers it.
• Rendering time for each frame.
Average frame period computed at the end of the execution as the complete rendering time divided by the total number of rendered frames. The frame rendering time has been measured under the following conditions:
• Test on o ia’s C using doc er container.
• Rendering of pre-recorded sequences using custom developed offline rendering software.
• Offline renderer generates a video stream of the synthesized virtual view and time measurements for post-execution analysis.
o 1080 (complex and simple scenario) and 720 resolutions
• Different GPU configurations: o Single Nvidia T4 GPU for all processing (decoding and view synthesis
computation). o Two Nvidia T4 GPUs, one for decoding and the other for view synthesis
computation.
• Different decoding strategies: o Decode 9 texture streams and 9 depth streams. o Decode only 5 texture streams and 5 depth streams.
• Different virtual camera paths for 9 and 5 streams cases.
Test results for 1 GPU and 2 GPUs are presented in Table 14 and Table 15, respectively.
Table 14: Rendering test results for 1 GPU.
Scenario Average frame rendering time (ms)
5 depth + 5 texture streams 9 depth + 9 texture streams
720 9,98 9,08
Complex 1080 27,48 36,29
Simple 1080 14,6 15,84
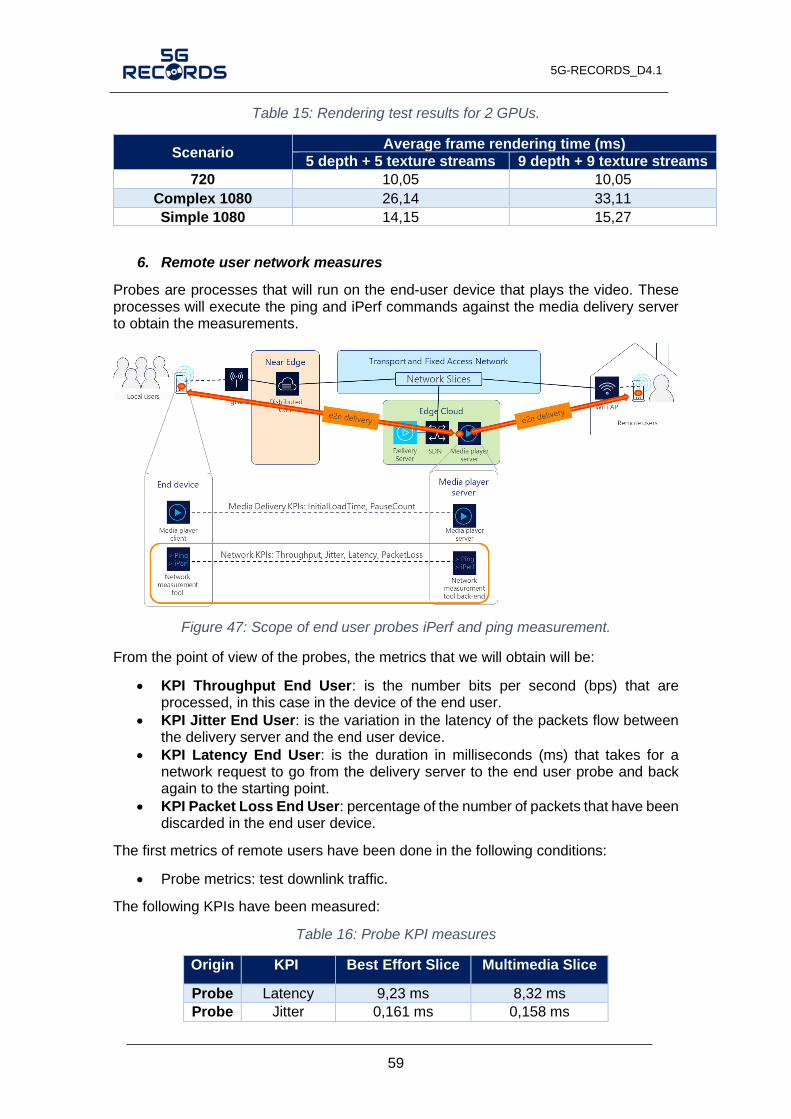
5G-RECORDS_D4.1
59
Table 15: Rendering test results for 2 GPUs.
Scenario Average frame rendering time (ms)
5 depth + 5 texture streams 9 depth + 9 texture streams
720 10,05 10,05
Complex 1080 26,14 33,11
Simple 1080 14,15 15,27
6. Remote user network measures
Probes are processes that will run on the end-user device that plays the video. These processes will execute the ping and iPerf commands against the media delivery server to obtain the measurements.
Figure 47: Scope of end user probes iPerf and ping measurement.
From the point of view of the probes, the metrics that we will obtain will be:
• KPI Throughput End User: is the number bits per second (bps) that are processed, in this case in the device of the end user.
• KPI Jitter End User: is the variation in the latency of the packets flow between the delivery server and the end user device.
• KPI Latency End User: is the duration in milliseconds (ms) that takes for a network request to go from the delivery server to the end user probe and back again to the starting point.
• KPI Packet Loss End User: percentage of the number of packets that have been discarded in the end user device.
The first metrics of remote users have been done in the following conditions:
• Probe metrics: test downlink traffic.
The following KPIs have been measured:
Table 16: Probe KPI measures
Origin KPI Best Effort Slice Multimedia Slice
Probe Latency 9,23 ms 8,32 ms
Probe Jitter 0,161 ms 0,158 ms

5G-RECORDS_D4.1
60
Probe Packet Loss 0 packet loss 0 packet loss
Probe Bandwidth 6 Mbps 6 Mbps
7. Remote user video measures
Measures in the remote user will be performed by the media player application as shown in Figure 48.
Figure 48: Media Delivery KPIs measurement method.
KPIs from player perspective are:
• KPI InitialLoadTime: number of milliseconds that elapse from when the video request is made until its playback begins, or the first frame is received.
• KPI Pause Count: number of times the video has stopped playing since it started.
The first metrics of remote users have been done in the following conditions:
• Video experimental player plays a video example from Media Delivery.
The following KPIs have been measured:
Table 17: Remote User video measures
Origin KPI Best Effort Slice Multimedia Slice
Player Pause Count 3 events 2 events
Player Pause Duration 2.7 s 1.2 s
Player Bitrate 2 Mbps 2 Mbps
Player Initial Load Time 692 ms 692 ms
Player Pause Count 6 event 1 event
Player Seek Count 0 events 0events
Player Total Duration Infinity seconds Infinity seconds
Player Watched Duration 1800 s 1800 s
Player Selected Quality Auto Auto
5G-RECORDS_D4.1
61
4.4.2 End-to-end integrated solution
The end-to-end solution will be tested in two different integration scenarios: i) Media capture and production, and ii) Media delivery. Besides, several application and infrastructure components will include a real-time monitoring component, which will be used to measure the relevant KPIs during the system operation.
1. Media capture and production tests
Media capture and production tests include the functionality of the use case from the captured scene in the cameras to the generation of the virtual view, including the real-time selection of the view by the remote operator. These tests will be performed in Nokia integration laboratory. Three different tests are performed: capture and uplink, rendering performance, and interactivity.
To test capture and uplink, a total of 3 to 5 cameras will capture the scene and send the resulting stream to the view renderer using the mmW uplink. Different combinations of cameras will be tested, as well as different scene complexities. Tests will monitor the response of the capture server coding to the different scene conditions, as well as the network uplink capabilities in terms of throughput and losses.
To test rendering performance, the set of 3 to 5 camera streams will be injected into the view renderer, which will synthesize the virtual camera viewpoint. The view renderer will be running within the edge-cloud infrastructure. Several scene complexities will be tested. The rendering time and frame rate will be analysed.
To test interactivity, the whole system will work together. The camera control subsystem will control the view that needs to be rendered at any time.
2. Media Delivery tests
Media delivery tests include the functionality of the use case from the output of the media renderer to the end client. These tests will be performed from the near-edge cloud infrastructure in Segovia (Nokia), to the edge cloud infrastructure in Madrid (Telefónica), and from there to remote users located in different places in Spain. Three different tests are performed at this level: media delivery functionality, conditional Domain Name System (DNS), and slice selection.
To test media delivery component, we attached a public IP address as an interface in the media delivery virtual machine, and from a web browser we play a video served from media delivery.
Conditional DNS is being tested by doing two kinds of requests from two different clients. One client is previously registered as VIP user and the other is register as regular user. VIP user is configured on bind on VIP view, and the regular one is on normal view. To test we use nslookup standard Linux command.
To test Network Slicing component, we will firstly verify it by performing a tcpdump on the interfaces of the selector slice (to confirm IP addresses from Best Effort users are served from Best Effort Slice and IP addresses from Multimedia users are served from Multimedia Slice). After that, during the experiments, it will be verified with the data registered by the Telegraf agent (nsstat plugin) as part of the monitoring tools.
Remember that the general scenario and flow are as follows:
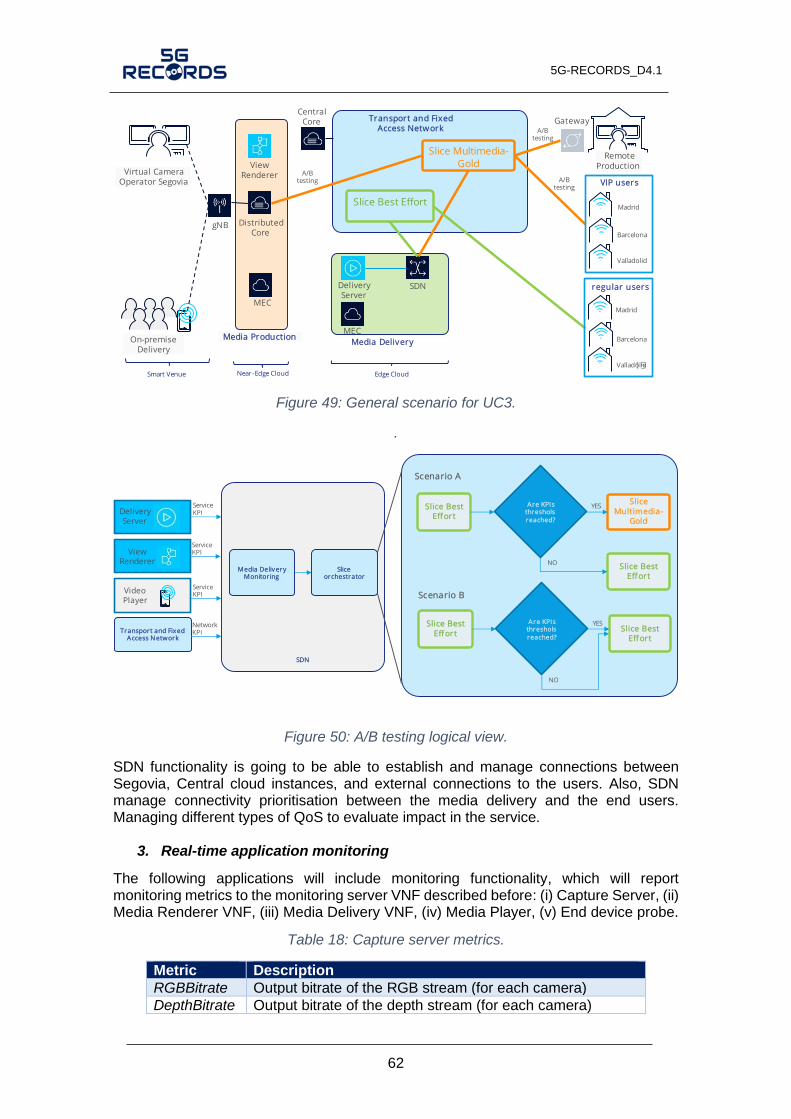
5G-RECORDS_D4.1
62
Figure 49: General scenario for UC3.
.
Figure 50: A/B testing logical view.
SDN functionality is going to be able to establish and manage connections between Segovia, Central cloud instances, and external connections to the users. Also, SDN manage connectivity prioritisation between the media delivery and the end users. Managing different types of QoS to evaluate impact in the service.
3. Real-time application monitoring
The following applications will include monitoring functionality, which will report monitoring metrics to the monitoring server VNF described before: (i) Capture Server, (ii) Media Renderer VNF, (iii) Media Delivery VNF, (iv) Media Player, (v) End device probe.
Table 18: Capture server metrics.
Metric Description
RGBBitrate Output bitrate of the RGB stream (for each camera)
DepthBitrate Output bitrate of the depth stream (for each camera)
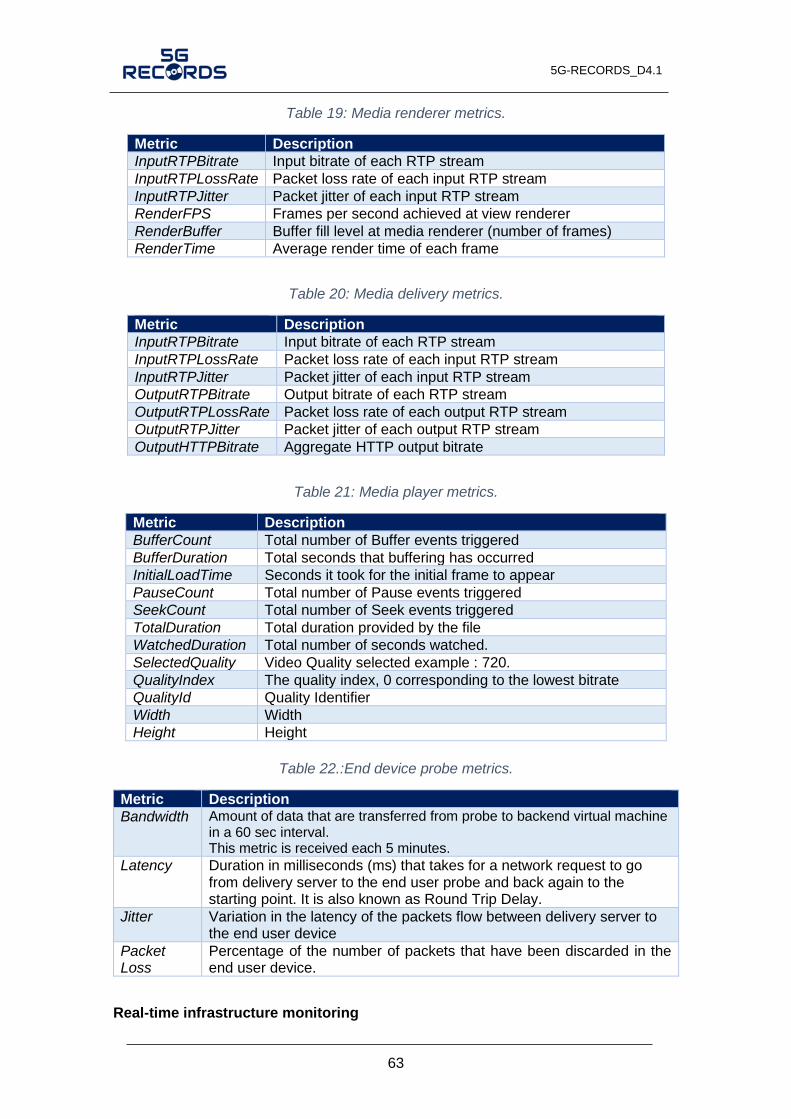
5G-RECORDS_D4.1
63
Table 19: Media renderer metrics.
Metric Description
InputRTPBitrate Input bitrate of each RTP stream
InputRTPLossRate Packet loss rate of each input RTP stream
InputRTPJitter Packet jitter of each input RTP stream
RenderFPS Frames per second achieved at view renderer
RenderBuffer Buffer fill level at media renderer (number of frames)
RenderTime Average render time of each frame
Table 20: Media delivery metrics.
Metric Description
InputRTPBitrate Input bitrate of each RTP stream
InputRTPLossRate Packet loss rate of each input RTP stream
InputRTPJitter Packet jitter of each input RTP stream
OutputRTPBitrate Output bitrate of each RTP stream
OutputRTPLossRate Packet loss rate of each output RTP stream
OutputRTPJitter Packet jitter of each output RTP stream
OutputHTTPBitrate Aggregate HTTP output bitrate
Table 21: Media player metrics.
Metric Description
BufferCount Total number of Buffer events triggered
BufferDuration Total seconds that buffering has occurred
InitialLoadTime Seconds it took for the initial frame to appear
PauseCount Total number of Pause events triggered
SeekCount Total number of Seek events triggered
TotalDuration Total duration provided by the file
WatchedDuration Total number of seconds watched.
SelectedQuality Video Quality selected example : 720.
QualityIndex The quality index, 0 corresponding to the lowest bitrate
QualityId Quality Identifier
Width Width
Height Height
Table 22.:End device probe metrics.
Metric Description
Bandwidth Amount of data that are transferred from probe to backend virtual machine in a 60 sec interval. This metric is received each 5 minutes.
Latency Duration in milliseconds (ms) that takes for a network request to go from delivery server to the end user probe and back again to the starting point. It is also known as Round Trip Delay.
Jitter Variation in the latency of the packets flow between delivery server to the end user device
Packet Loss
Percentage of the number of packets that have been discarded in the end user device.
Real-time infrastructure monitoring
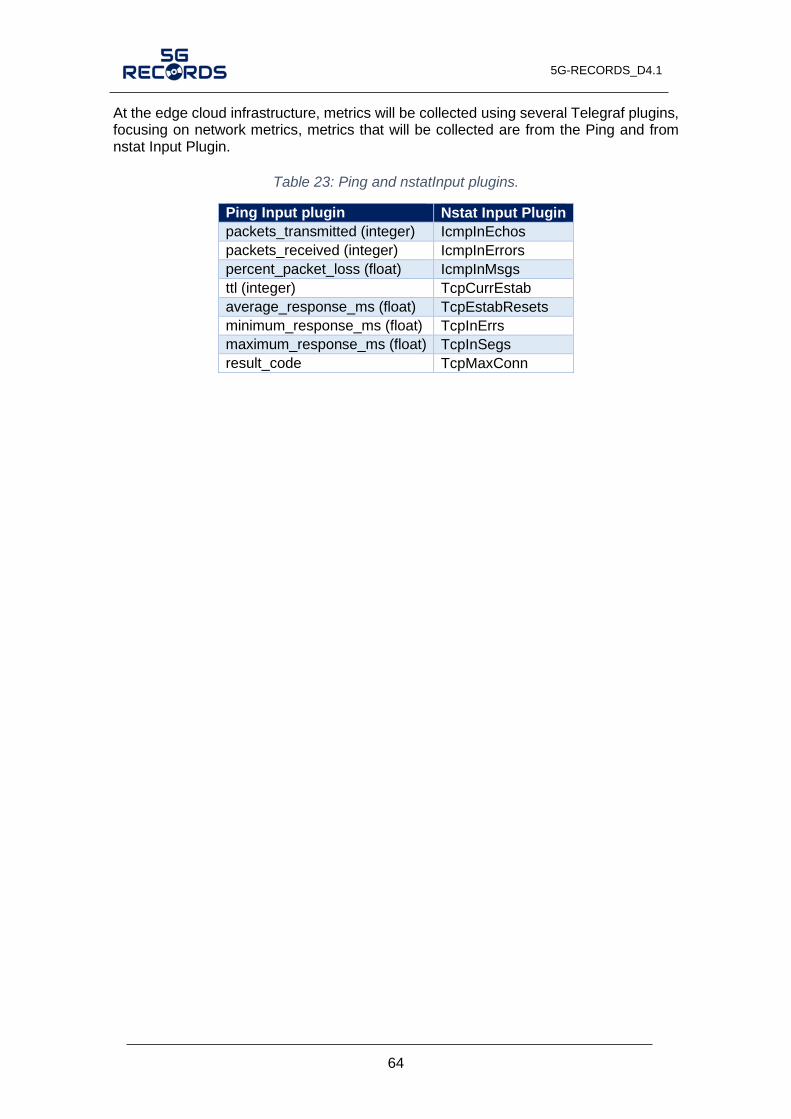
5G-RECORDS_D4.1
64
At the edge cloud infrastructure, metrics will be collected using several Telegraf plugins, focusing on network metrics, metrics that will be collected are from the Ping and from nstat Input Plugin.
Table 23: Ping and nstatInput plugins.
Ping Input plugin Nstat Input Plugin
packets_transmitted (integer) IcmpInEchos
packets_received (integer) IcmpInErrors
percent_packet_loss (float) IcmpInMsgs
ttl (integer) TcpCurrEstab
average_response_ms (float) TcpEstabResets
minimum_response_ms (float) TcpInErrs
maximum_response_ms (float) TcpInSegs
result_code TcpMaxConn
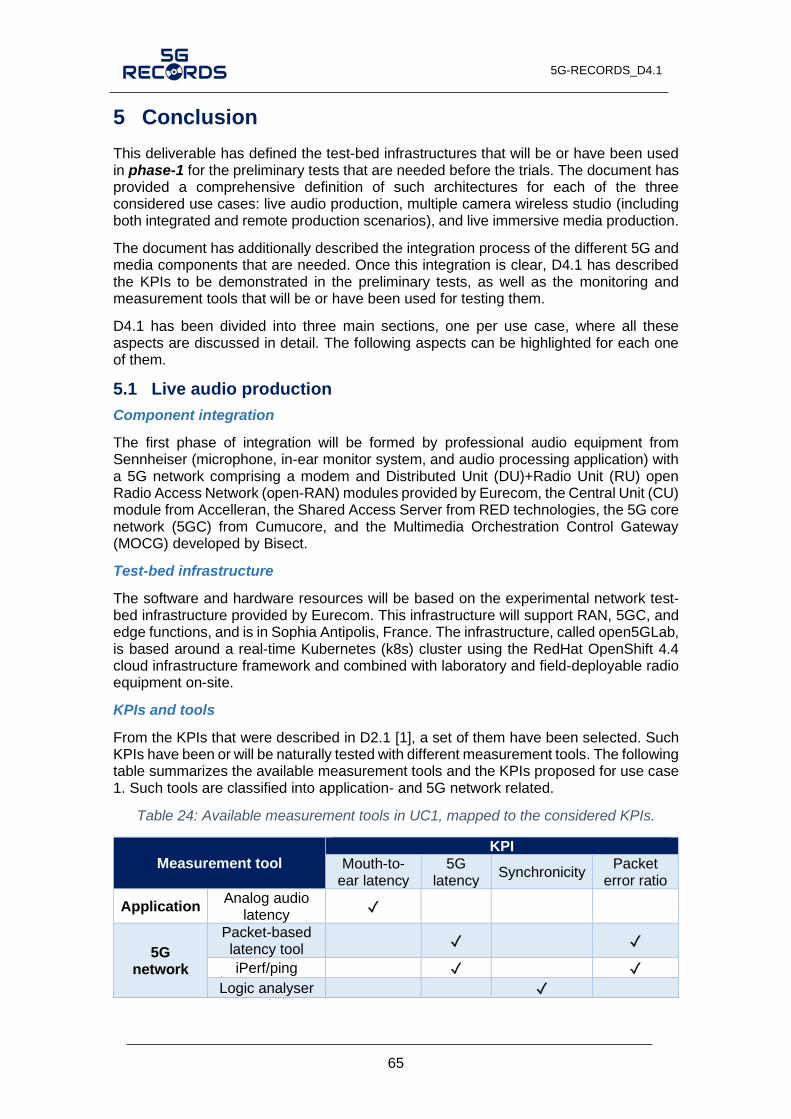
5G-RECORDS_D4.1
65
5 Conclusion
This deliverable has defined the test-bed infrastructures that will be or have been used in phase-1 for the preliminary tests that are needed before the trials. The document has provided a comprehensive definition of such architectures for each of the three considered use cases: live audio production, multiple camera wireless studio (including both integrated and remote production scenarios), and live immersive media production.
The document has additionally described the integration process of the different 5G and media components that are needed. Once this integration is clear, D4.1 has described the KPIs to be demonstrated in the preliminary tests, as well as the monitoring and measurement tools that will be or have been used for testing them.
D4.1 has been divided into three main sections, one per use case, where all these aspects are discussed in detail. The following aspects can be highlighted for each one of them.
5.1 Live audio production
Component integration
The first phase of integration will be formed by professional audio equipment from Sennheiser (microphone, in-ear monitor system, and audio processing application) with a 5G network comprising a modem and Distributed Unit (DU)+Radio Unit (RU) open Radio Access Network (open-RAN) modules provided by Eurecom, the Central Unit (CU) module from Accelleran, the Shared Access Server from RED technologies, the 5G core network (5GC) from Cumucore, and the Multimedia Orchestration Control Gateway (MOCG) developed by Bisect.
Test-bed infrastructure
The software and hardware resources will be based on the experimental network test-bed infrastructure provided by Eurecom. This infrastructure will support RAN, 5GC, and edge functions, and is in Sophia Antipolis, France. The infrastructure, called open5GLab, is based around a real-time Kubernetes (k8s) cluster using the RedHat OpenShift 4.4 cloud infrastructure framework and combined with laboratory and field-deployable radio equipment on-site.
KPIs and tools
From the KPIs that were described in D2.1 [1], a set of them have been selected. Such KPIs have been or will be naturally tested with different measurement tools. The following table summarizes the available measurement tools and the KPIs proposed for use case 1. Such tools are classified into application- and 5G network related.
Table 24: Available measurement tools in UC1, mapped to the considered KPIs.
Measurement tool KPI
Mouth-to-ear latency
5G latency
Synchronicity Packet
error ratio
Application Analog audio
latency ✓
5G network
Packet-based latency tool
✓ ✓
iPerf/ping ✓ ✓
Logic analyser ✓

5G-RECORDS_D4.1
66
The critical KPI is a mouth-to-ear latency below 4 ms. This is measured using an analogue hardware measurement tool with 100 µs precision. Related network KPIs such as 5G latency, synchronicity, and packet loss will be measured using network tools, i.e., a packet-based latency measurement software, iPerf3, ping and a logic analyser.
5.2 Multiple camera wireless studio
The target of use case 2 is to develop a 5G based IP media production solution. This is addressed in two different scenarios: an integrated production and a remote production scenario. Ericsson administers two 5G infrastructure networks for testing and executing the use case. Both networks are common to the two scenarios and are described below.
Common test-bed infrastructure
This is tested in Ericsson test-bed in Aachen (Germany). The use case partners will use the test network for intermediate testing and integration, while the trial network will be used for trials, E2E testing and project closure events. The 5G test network is hosted in the Ericsson Eurolab office in Aachen, and is a 3GPP Release 15 NPN, in which all control plane and user plane functions are hosted on-premises. The trial network is part of the 5G industry campus Europe [8], and is hosted in the RWTH university campus Melaten in Aachen. It consists of a distributed private network architecture spread into four different core sites.
5.2.1 Integrated production scenario
Component integration
The first scenario integrates an indoor camera, the video encoder/decoder from Image Matters, 5G modems provided by Fivecomm, the EBU media gateway, Bisect MOCG, and the 5G network (both RAN and 5GC) from Ericsson.
KPIs and tools
The following table maps the available measurement tools to the proposed KPIs for the integrated production scenario.
Table 25: Available measurement tools in UC2 for the integrated production scenario, mapped to the considered KPIs.
Measurement tool
KPI
UL throughput
Glass-to-glass
latency
Packet error ratio
Timing accuracy
Content production
EBU LIST ✓ ✓
Time-code GPS locked
✓
SCReAM bandwidth measurement tool
✓ ✓
5G
crit-iPerf ✓ ✓
nuttcp ✓ ✓
PTP tools ✓
A number of measurement tools have been identified to characterize the integrated production scenario, including both professional content production tools. These tools are the EBU LIST, time-code GPS locked measures for timing, the SCReAM bandwidth tool, as well as different tools related to PTP measurements. The scenario additionally identified other two network measurement tools, i.e., crit-iPerf and nuttcp.
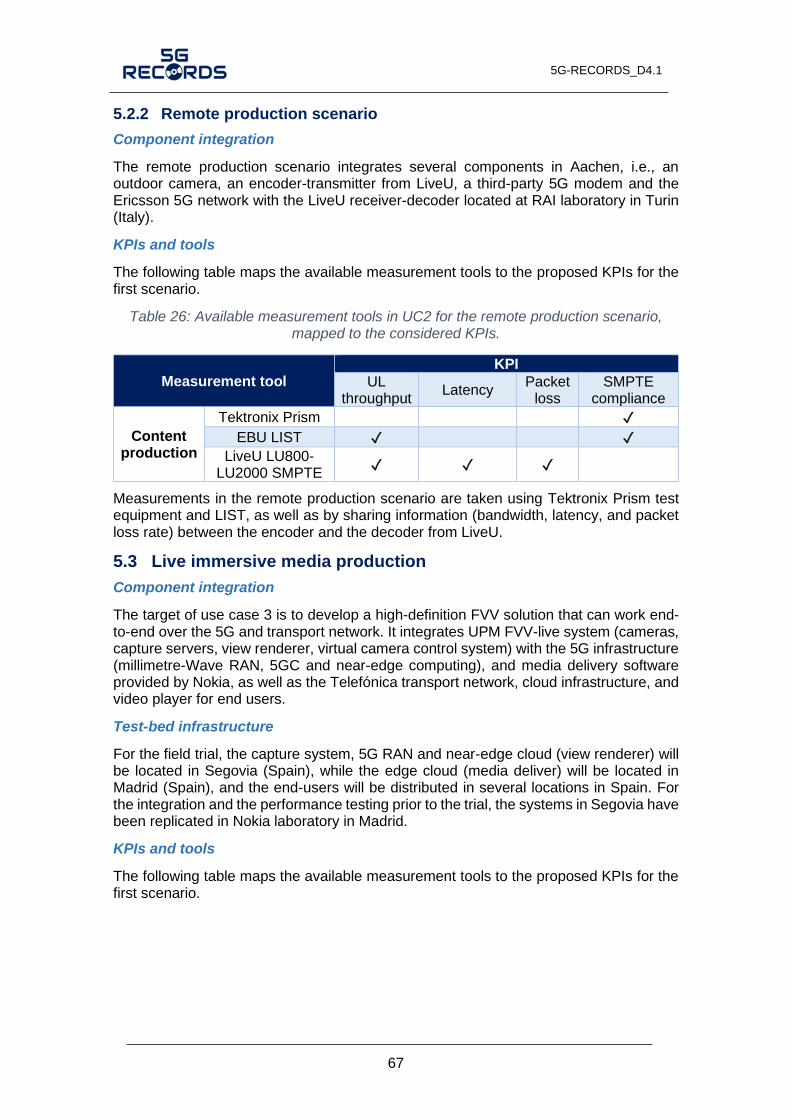
5G-RECORDS_D4.1
67
5.2.2 Remote production scenario
Component integration
The remote production scenario integrates several components in Aachen, i.e., an outdoor camera, an encoder-transmitter from LiveU, a third-party 5G modem and the Ericsson 5G network with the LiveU receiver-decoder located at RAI laboratory in Turin (Italy).
KPIs and tools
The following table maps the available measurement tools to the proposed KPIs for the first scenario.
Table 26: Available measurement tools in UC2 for the remote production scenario, mapped to the considered KPIs.
Measurement tool
KPI
UL throughput
Latency Packet
loss SMPTE
compliance
Content production
Tektronix Prism ✓
EBU LIST ✓ ✓
LiveU LU800-LU2000 SMPTE
✓ ✓ ✓
Measurements in the remote production scenario are taken using Tektronix Prism test equipment and LIST, as well as by sharing information (bandwidth, latency, and packet loss rate) between the encoder and the decoder from LiveU.
5.3 Live immersive media production
Component integration
The target of use case 3 is to develop a high-definition FVV solution that can work end-to-end over the 5G and transport network. It integrates UPM FVV-live system (cameras, capture servers, view renderer, virtual camera control system) with the 5G infrastructure (millimetre-Wave RAN, 5GC and near-edge computing), and media delivery software provided by Nokia, as well as the Telefónica transport network, cloud infrastructure, and video player for end users.
Test-bed infrastructure
For the field trial, the capture system, 5G RAN and near-edge cloud (view renderer) will be located in Segovia (Spain), while the edge cloud (media deliver) will be located in Madrid (Spain), and the end-users will be distributed in several locations in Spain. For the integration and the performance testing prior to the trial, the systems in Segovia have been replicated in Nokia laboratory in Madrid.
KPIs and tools
The following table maps the available measurement tools to the proposed KPIs for the first scenario.
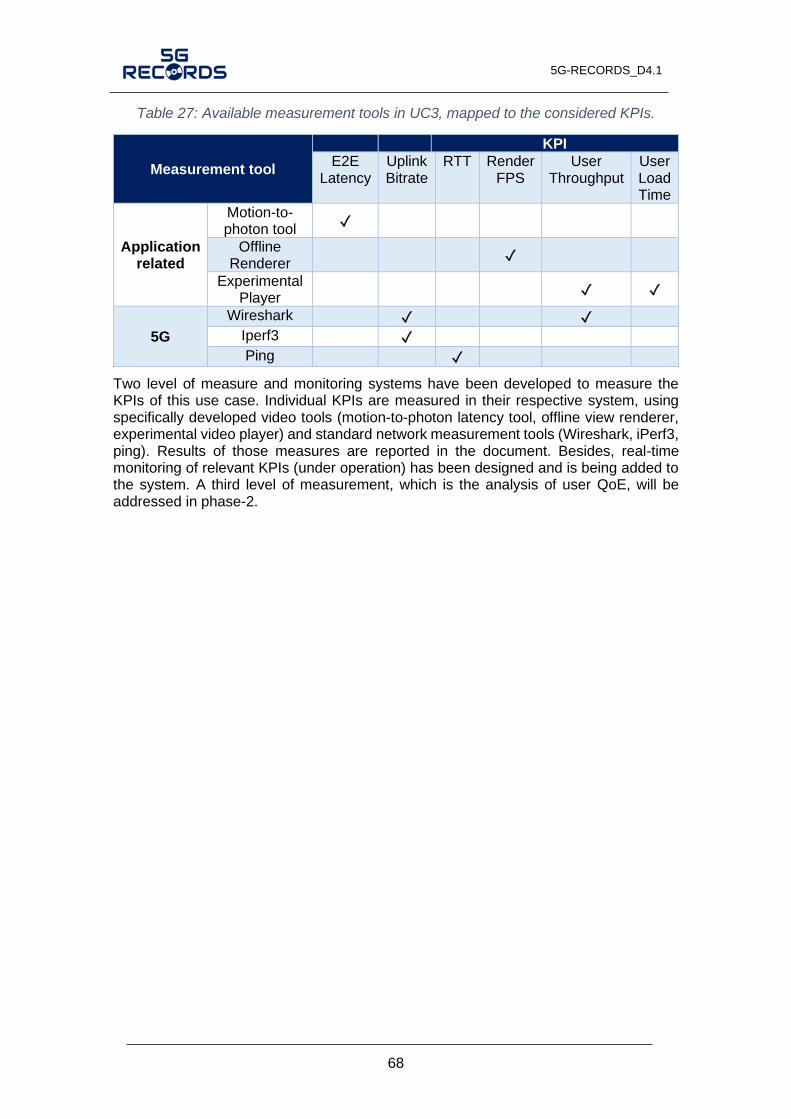
5G-RECORDS_D4.1
68
Table 27: Available measurement tools in UC3, mapped to the considered KPIs.
Measurement tool
KPI
E2E Latency
Uplink Bitrate
RTT Render FPS
User Throughput
User Load Time
Application related
Motion-to-photon tool
✓
Offline Renderer
✓
Experimental Player
✓ ✓
5G
Wireshark ✓ ✓
Iperf3 ✓
Ping ✓
Two level of measure and monitoring systems have been developed to measure the KPIs of this use case. Individual KPIs are measured in their respective system, using specifically developed video tools (motion-to-photon latency tool, offline view renderer, experimental video player) and standard network measurement tools (Wireshark, iPerf3, ping). Results of those measures are reported in the document. Besides, real-time monitoring of relevant KPIs (under operation) has been designed and is being added to the system. A third level of measurement, which is the analysis of user QoE, will be addressed in phase-2.
5G-RECORDS_D4.1
69
References
[1] C. Avellán, A. Rodrigo, I. Alepuz, S. García, E. Sánchez, R. Ortiz, Eds. “Use cases, requirements and KPIs,” eliverable 2.1 v1.0, 5G-PPP 5G-RECORDS project, May 2021.
[2] G. Stante d. “First Description of 5G components ” eliverable 3.1 v1.0, 5G-PPP 5G-RECORDS project, July 2021.
[3] Johanson, I., "Self clocked Rate Adaptation for Conversational video in LTE". ACM SIGCOMM, 2014.
[4] Ericsson research (2015) SCREAM [Source code]. https://github.com/EricssonResearch/scream
[5] Nuttcp. http://manpages.ubuntu.com/manpages/trusty/man8/nuttcp.8.html
[6] iPerf, User Manuals (1), June 2021. https://iPerf2.sourceforge.io/iPerf-manpage.html
[7] Saleae website, https://www.saleae.com/
[8] 5G Industry Campus Europe, https://5g-industry-campus.com/
[9] FPV Blue, “Glass to glass video latency is now under 50 milliseconds” July 201 .
[10] Port forwarding documentation, July 2021. https://docs.termius.com/termius-handbook/port-forwarding


