Page 1
Deliverable Report for MECON Project
Task 1.2
Baseline energy consumption of
MECON household in Thailand
Prepared by
Miss Jirapa Kamsamrong
January 2015
The Joint Graduate School of Energy and Environment (JGSEE)
King Mongkut’s University of Technology Thonburi (KMUTT)
Page 2
Effective energy efficiency policy implementation targeting
“New Modern Energy Consumer” in the Greater Mekong Subregion
Page 2
Contents
Table of Figures .............................................................................................................................. 3
Table ............................................................................................................................................... 3
1. Overview of energy consumption for MECON target group in Thailand .................................. 4
2. MECON target group percent share ........................................................................................... 5
3. Structure of demand use for MECON target group .................................................................... 8
4. Key assumptions ....................................................................................................................... 10
5. Results ....................................................................................................................................... 13
5.1 Lighting ................................................................................................................................... 14
5.2 Cooking ................................................................................................................................... 14
5.3 Cooling .................................................................................................................................... 15
5.4 Heating .................................................................................................................................... 18
5.5 Entertainment .......................................................................................................................... 20
5.6 Cleaning .................................................................................................................................. 21
5.7 Others ...................................................................................................................................... 23
6. Conclusion ................................................................................................................................ 24
Page 3
Effective energy efficiency policy implementation targeting
“New Modern Energy Consumer” in the Greater Mekong Subregion
Page 3
Table of Figures
Figure 1 LEAP structure for MECON target group........................................................................ 4
Figure 2 Percentage of the population whose income is 2-5$ (2005PPP) per capita ..................... 7
Figure 3 Electric appliance categories in MECON household in Thailand .................................... 9
Figure 4 Energy consumption by category for MECON group in Thailand in BAU scenario .... 13
Figure 5 Energy consumption for lighting of MECON group in Thailand in BAU scenario ..... 14
Figure 6 Energy consumption for cooking appliances of MECON group in Thailand in BAU . 15
Figure 7 Energy consumption for cooling of MECON group in Thailand in BAU scenario ...... 16
Figure 8 Energy consumption for AC by technology of MECON group in Thailand in BAU .... 17
Figure 9 Energy consumption for refrigerator by technology of MECON group in BAU ........... 17
Figure 10 Energy consumption for fan by technology of MECON group in Thailand in BAU .. 18
Figure 11 Energy consumption for heating for MECON group in Thailand in BAU scenario ... 19
Figure 12 Energy consumption for electric kettle by technology of MECON group in BAU ..... 19
Figure 13 Energy consumption for entertainment of MECON group in Thailand in BAU ......... 20
Figure 14 Energy consumption for TV by technology of MECON group in Thailand in BAU . 21
Figure 15 Energy consumption for cleaning of MECON group in Thailand in BAU scenario ... 22
Figure 16 Energy consumption for washing machine by technology of MECON group ............ 22
Figure 17 Energy consumption for other category of MECON group in Thailand in BAU ........ 23
Table
Table 1 Historical data for GDP, population and those whose income between $2-5 per day ...... 5
Table 2 Number of Thai MECON household in The future ........................................................... 8
Table 3 Fundamental key assumptions ......................................................................................... 10
Table 4 Energy consumption of each device for MECON target group in Thailand in 2013 ...... 11
Page 4
Effective energy efficiency policy implementation targeting
“New Modern Energy Consumer” in the Greater Mekong Subregion
Page 4
1. Overview of energy consumption for MECON target group in Thailand
In order to set energy consumption baseline for MECON target group in Thailand, it
needs to have energy consumption data for each electric appliances device that are used in the
household. In Thailand, there are many energy consumption surveys in household but they are
not exact information for MECON target group. This is because “New Modern Energy
Consumer” target group is the person who earn between 2-5 dollars per day. Therefore,
household energy consumption survey is really needed in order to have the right information for
this specific target group.
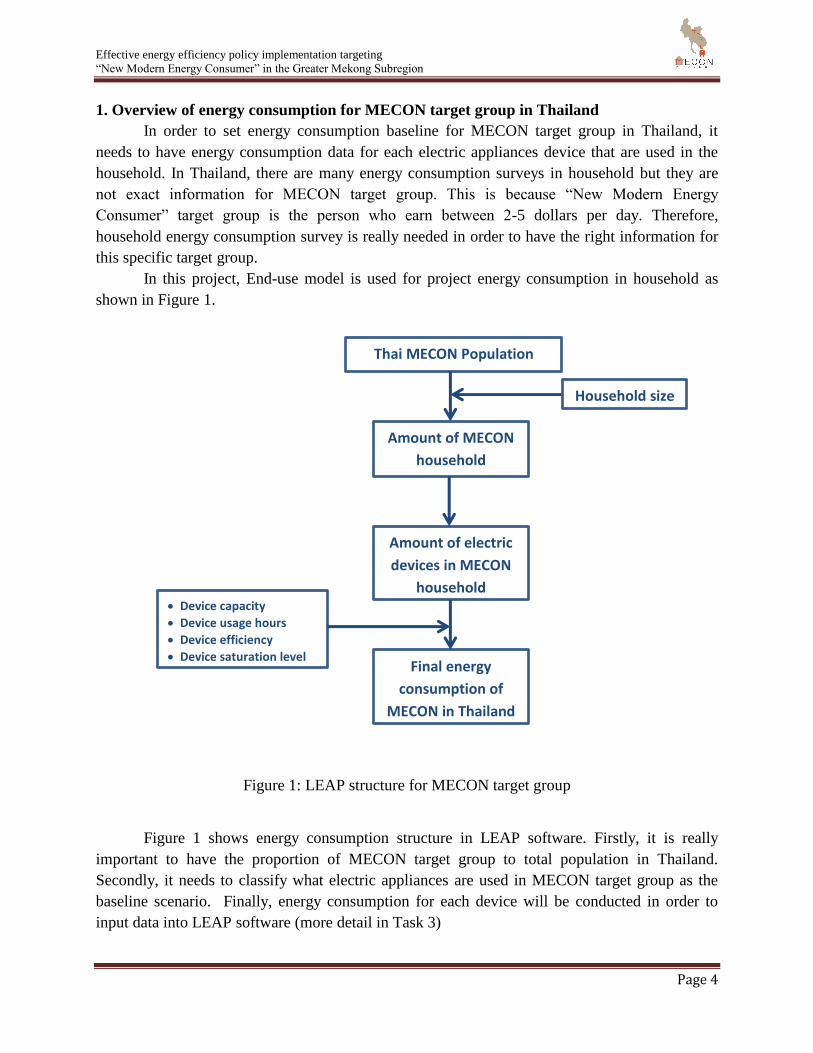
In this project, End-use model is used for project energy consumption in household as
shown in Figure 1.
Figure 1: LEAP structure for MECON target group
Figure 1 shows energy consumption structure in LEAP software. Firstly, it is really
important to have the proportion of MECON target group to total population in Thailand.
Secondly, it needs to classify what electric appliances are used in MECON target group as the
baseline scenario. Finally, energy consumption for each device will be conducted in order to
input data into LEAP software (more detail in Task 3)
Thai MECON Population
Amount of MECON
household
Household size
Amount of electric
devices in MECON
household Device capacity
Device usage hours
Device efficiency
Device saturation level
Final energy
consumption of
MECON in Thailand
Page 5
Effective energy efficiency policy implementation targeting
“New Modern Energy Consumer” in the Greater Mekong Subregion
Page 5
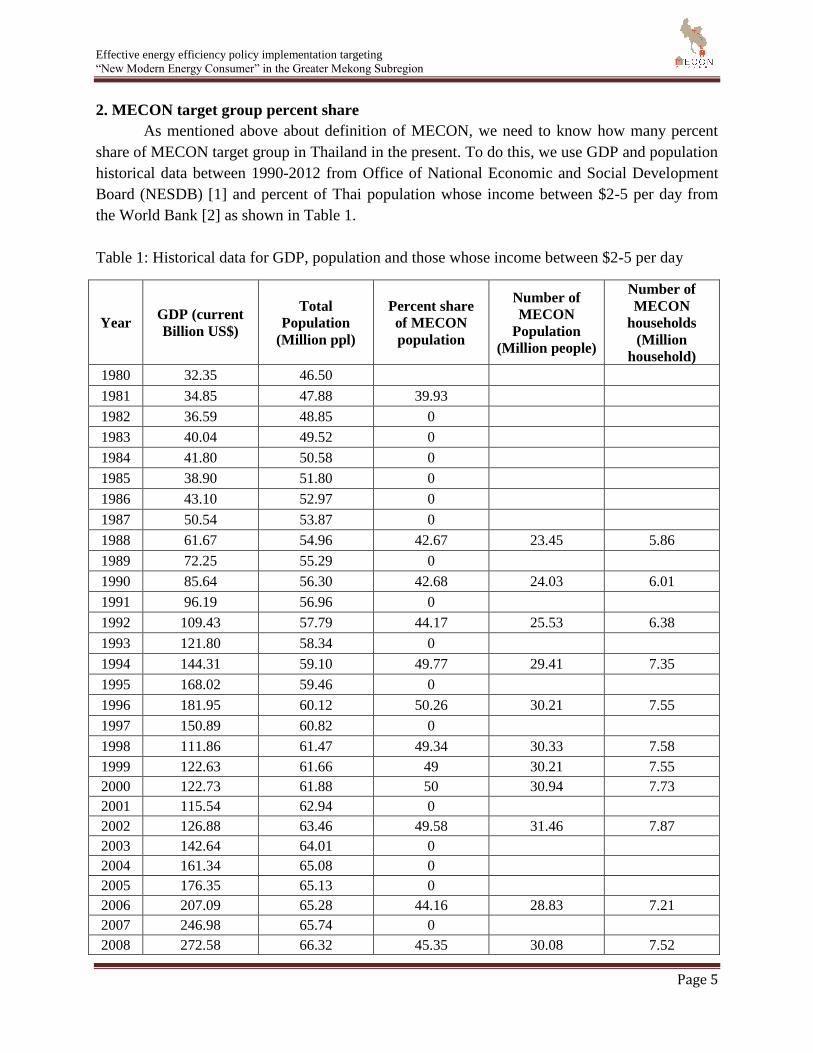
2. MECON target group percent share
As mentioned above about definition of MECON, we need to know how many percent
share of MECON target group in Thailand in the present. To do this, we use GDP and population
historical data between 1990-2012 from Office of National Economic and Social Development
Board (NESDB) [1] and percent of Thai population whose income between $2-5 per day from
the World Bank [2] as shown in Table 1.
Table 1: Historical data for GDP, population and those whose income between $2-5 per day
Year GDP (current
Billion US$)
Total
Population
(Million ppl)
Percent share
of MECON
population
Number of
MECON
Population
(Million people)
Number of
MECON
households
(Million
household)
1980 32.35 46.50
1981 34.85 47.88 39.93
1982 36.59 48.85 0
1983 40.04 49.52 0
1984 41.80 50.58 0
1985 38.90 51.80 0
1986 43.10 52.97 0
1987 50.54 53.87 0
1988 61.67 54.96 42.67 23.45 5.86
1989 72.25 55.29 0
1990 85.64 56.30 42.68 24.03 6.01
1991 96.19 56.96 0
1992 109.43 57.79 44.17 25.53 6.38
1993 121.80 58.34 0
1994 144.31 59.10 49.77 29.41 7.35
1995 168.02 59.46 0
1996 181.95 60.12 50.26 30.21 7.55
1997 150.89 60.82 0
1998 111.86 61.47 49.34 30.33 7.58
1999 122.63 61.66 49 30.21 7.55
2000 122.73 61.88 50 30.94 7.73
2001 115.54 62.94 0
2002 126.88 63.46 49.58 31.46 7.87
2003 142.64 64.01 0
2004 161.34 65.08 0
2005 176.35 65.13 0
2006 207.09 65.28 44.16 28.83 7.21
2007 246.98 65.74 0
2008 272.58 66.32 45.35 30.08 7.52
Page 6
Effective energy efficiency policy implementation targeting
“New Modern Energy Consumer” in the Greater Mekong Subregion
Page 6
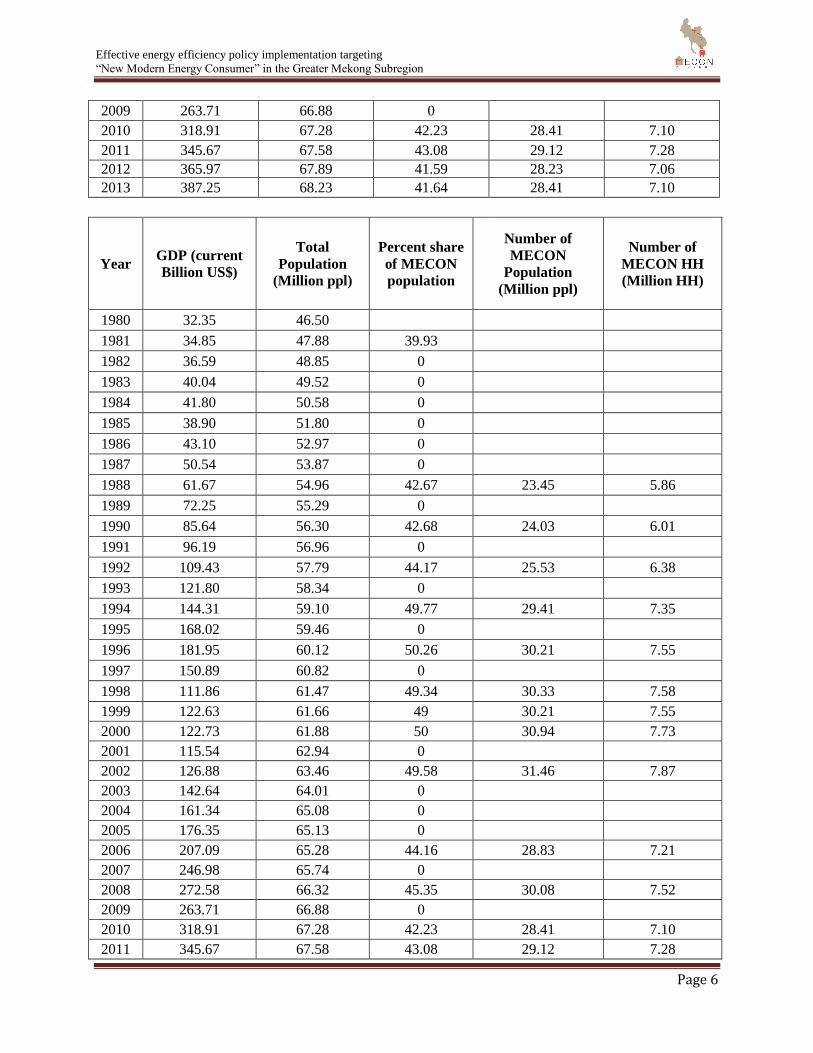
2009 263.71 66.88 0
2010 318.91 67.28 42.23 28.41 7.10
2011 345.67 67.58 43.08 29.12 7.28
2012 365.97 67.89 41.59 28.23 7.06
2013 387.25 68.23 41.64 28.41 7.10
Year GDP (current
Billion US$)
Total
Population
(Million ppl)
Percent share
of MECON
population
Number of
MECON
Population
(Million ppl)
Number of
MECON HH
(Million HH)
1980 32.35 46.50
1981 34.85 47.88 39.93
1982 36.59 48.85 0
1983 40.04 49.52 0
1984 41.80 50.58 0
1985 38.90 51.80 0
1986 43.10 52.97 0
1987 50.54 53.87 0
1988 61.67 54.96 42.67 23.45 5.86
1989 72.25 55.29 0
1990 85.64 56.30 42.68 24.03 6.01
1991 96.19 56.96 0
1992 109.43 57.79 44.17 25.53 6.38
1993 121.80 58.34 0
1994 144.31 59.10 49.77 29.41 7.35
1995 168.02 59.46 0
1996 181.95 60.12 50.26 30.21 7.55
1997 150.89 60.82 0
1998 111.86 61.47 49.34 30.33 7.58
1999 122.63 61.66 49 30.21 7.55
2000 122.73 61.88 50 30.94 7.73
2001 115.54 62.94 0
2002 126.88 63.46 49.58 31.46 7.87
2003 142.64 64.01 0
2004 161.34 65.08 0
2005 176.35 65.13 0
2006 207.09 65.28 44.16 28.83 7.21
2007 246.98 65.74 0
2008 272.58 66.32 45.35 30.08 7.52
2009 263.71 66.88 0
2010 318.91 67.28 42.23 28.41 7.10
2011 345.67 67.58 43.08 29.12 7.28
Page 7
Effective energy efficiency policy implementation targeting
“New Modern Energy Consumer” in the Greater Mekong Subregion
Page 7
2012 365.97 67.89 41.59 28.23 7.06
2013 387.25 68.23 41.64 28.41 7.10
The data (percentage of people whose income is 2-5$/day) has been projected using an
econometric model as shown below
MECON = a+ b*GDPP + c*Year where GDPP is GDP per capita (in 2005) (Eq.1)
Coefficients a, b and c were estimated using an econometric software “Eviews8”. Eviews
results are in the table below. The resulting equation is shown below
MECON=386.98 – 0.00159*GDPP - 0164*Year (Eq.2)
Equation 2 is used to project the future share of the income group for Thailand. The
projection also shows upper and lower values, which could be used to run sensitivity scenarios in
LEAP as shown in Figure 2 and Table 2.
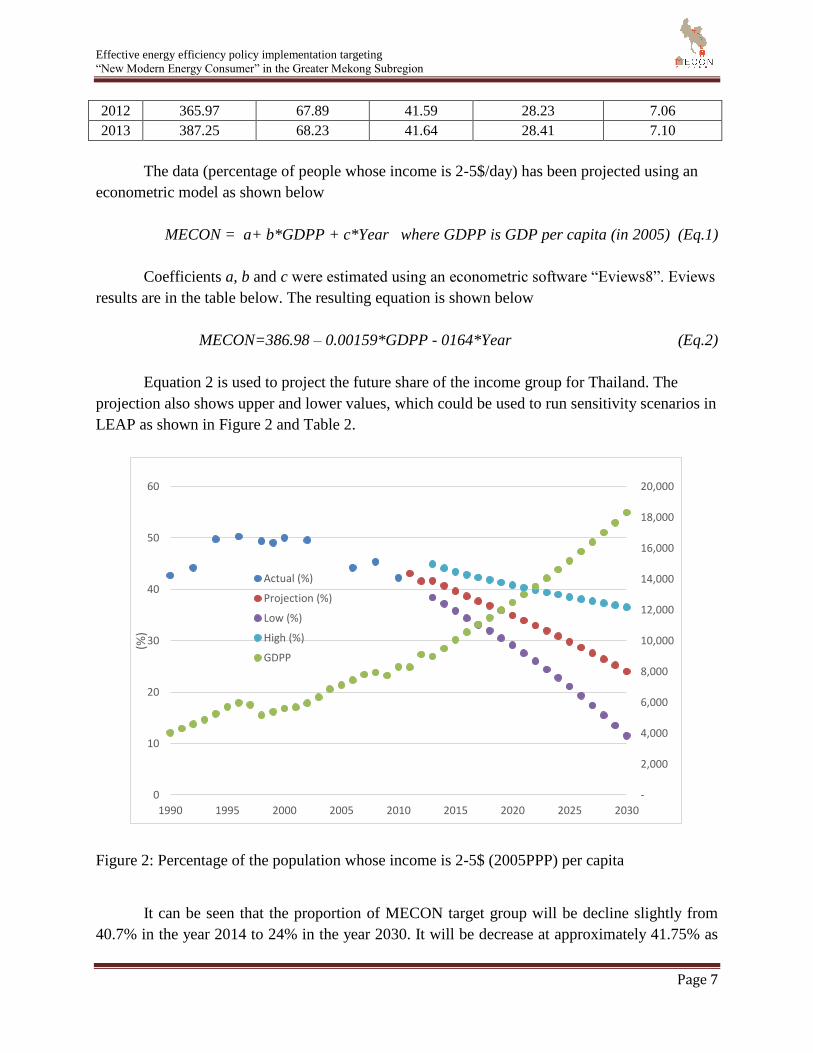
Figure 2: Percentage of the population whose income is 2-5$ (2005PPP) per capita
It can be seen that the proportion of MECON target group will be decline slightly from
40.7% in the year 2014 to 24% in the year 2030. It will be decrease at approximately 41.75% as
-
2,000
4,000
6,000
8,000
10,000
12,000
14,000
16,000
18,000
20,000
0
10
20
30
40
50
60
1990 1995 2000 2005 2010 2015 2020 2025 2030
(%)
Actual (%)
Projection (%)
Low (%)
High (%)
GDPP
Page 8
Effective energy efficiency policy implementation targeting
“New Modern Energy Consumer” in the Greater Mekong Subregion
Page 8
compared in 2014. This data will be inputted to LEAP as the percentage of MECON households
to total households in the country. In this study, the projection as medium case (red dot line) will
be used in LEAP software.
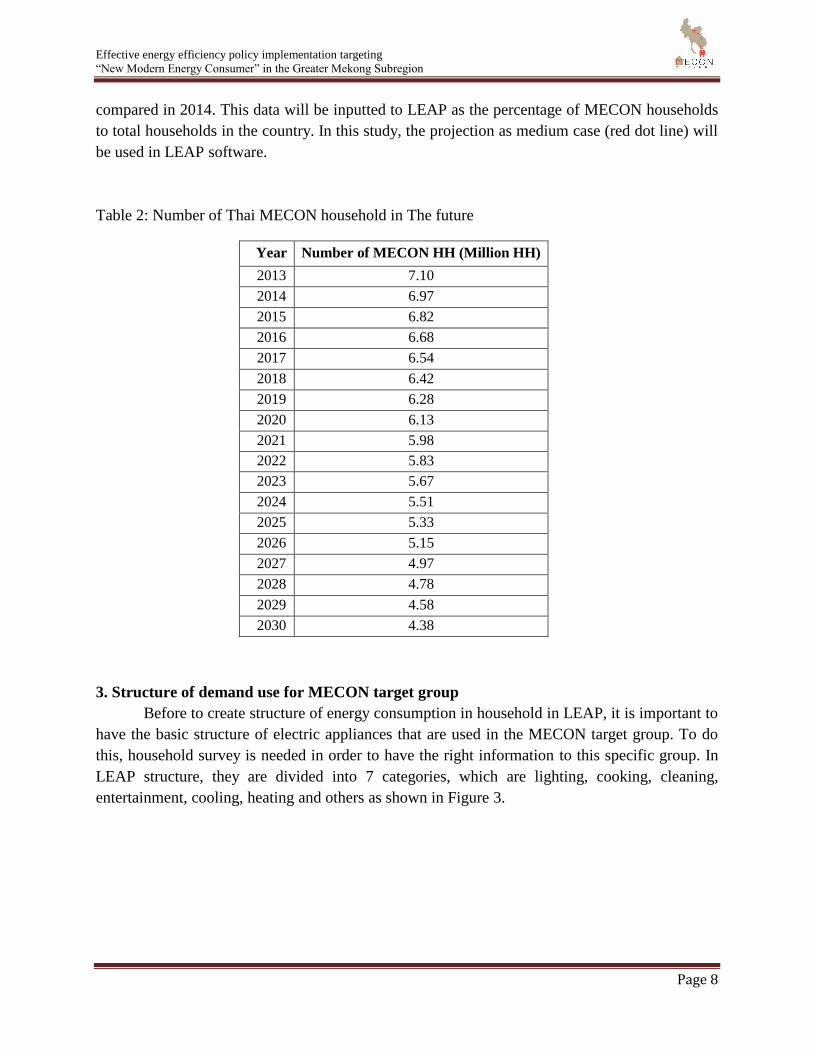
Table 2: Number of Thai MECON household in The future
3. Structure of demand use for MECON target group
Before to create structure of energy consumption in household in LEAP, it is important to
have the basic structure of electric appliances that are used in the MECON target group. To do
this, household survey is needed in order to have the right information to this specific group. In
LEAP structure, they are divided into 7 categories, which are lighting, cooking, cleaning,
entertainment, cooling, heating and others as shown in Figure 3.
Year Number of MECON HH (Million HH)
2013 7.10
2014 6.97
2015 6.82
2016 6.68
2017 6.54
2018 6.42
2019 6.28
2020 6.13
2021 5.98
2022 5.83
2023 5.67
2024 5.51
2025 5.33
2026 5.15
2027 4.97
2028 4.78
2029 4.58
2030 4.38
Page 9
Effective energy efficiency policy implementation targeting
“New Modern Energy Consumer” in the Greater Mekong Subregion
Page 9
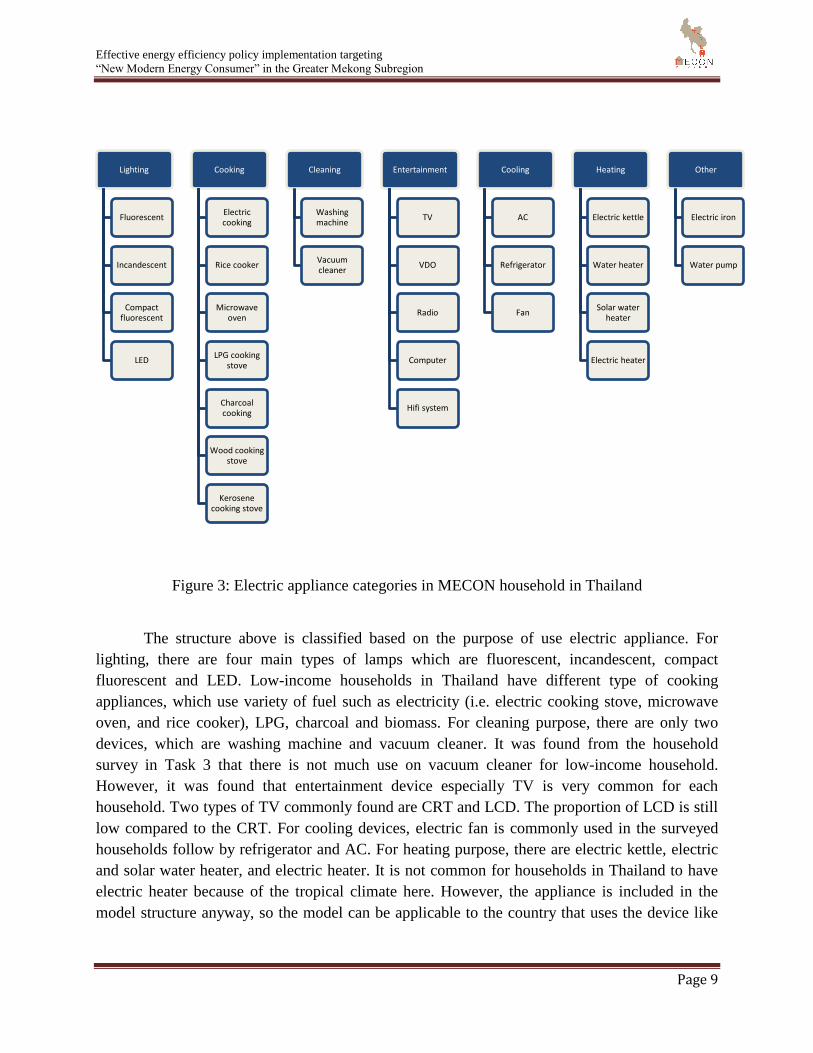
Figure 3: Electric appliance categories in MECON household in Thailand
The structure above is classified based on the purpose of use electric appliance. For
lighting, there are four main types of lamps which are fluorescent, incandescent, compact
fluorescent and LED. Low-income households in Thailand have different type of cooking
appliances, which use variety of fuel such as electricity (i.e. electric cooking stove, microwave
oven, and rice cooker), LPG, charcoal and biomass. For cleaning purpose, there are only two
devices, which are washing machine and vacuum cleaner. It was found from the household
survey in Task 3 that there is not much use on vacuum cleaner for low-income household.
However, it was found that entertainment device especially TV is very common for each
household. Two types of TV commonly found are CRT and LCD. The proportion of LCD is still
low compared to the CRT. For cooling devices, electric fan is commonly used in the surveyed
households follow by refrigerator and AC. For heating purpose, there are electric kettle, electric
and solar water heater, and electric heater. It is not common for households in Thailand to have
electric heater because of the tropical climate here. However, the appliance is included in the
model structure anyway, so the model can be applicable to the country that uses the device like
Lighting
Fluorescent
Incandescent
Compact fluorescent
LED
Cooking
Electric cooking
Rice cooker
Microwave oven
LPG cooking stove
Charcoal cooking
Wood cooking stove
Kerosene cooking stove
Cleaning
Washing machine
Vacuum cleaner
Entertainment
TV
VDO
Radio
Computer
Hifi system
Cooling
AC
Refrigerator
Fan
Heating
Electric kettle
Water heater
Solar water heater
Electric heater
Other
Electric iron
Water pump
Page 10
Effective energy efficiency policy implementation targeting
“New Modern Energy Consumer” in the Greater Mekong Subregion
Page 10
Vietnam. For those devices that are not related to categories that mentioned above, they will be
in the “Other” category such as electric iron, water pump and etc.
4. Key assumptions
Key assumptions for LEAP software to project energy baseline for MECON target group
are shown in Table 3
Table 3 Fundamental key assumptions
Parameter Detail Unit
Base year 2013
End year 2030
Population (2013) 68.23 Million people
Population growth rate 0.38% Percent
Household size 4 Person per household
Amount of total household 17.0573 Million households
MECON population share (2013) 41.64 Percent
Number of MECON population (2013) 28.4 Million people
Number of MECON household (2013) 7.0 Million households
From household survey in Task 3, we conducted 293 samples of MECON target group in
Thailand (see the Annex A). The data is used to calculate energy consumption in the household
as shown in below
Electricity consumption (kWh/year) = Power of appliance (Watt) x Hour use per year (Hr)
x amount of appliances x coefficient Eq.(3)
However, some of the household devices such as refrigerator do not use the rated power
all the time. This is because those devices have an on/off function in order to save electricity
while maintaining desirable temperatures. Therefore, a coefficient is used in Eq. (3) which is
applied from the study of China’s urban households. For this study, the coefficient for
refrigerator is 0.36.
As shown in Eq.3, there are three factors to calculate electricity and energy consumption
for each device. However, we cannot use the real number for LEAP software but the average
number. This is because we cannot do the survey for all over Thailand due to the budget and
time constraints. Therefore, the 293 samples are represented as the MECON household Thailand
which is used in LEAP software as presented in the Table 4.
Page 11
Effective energy efficiency policy implementation targeting
“New Modern Energy Consumer” in the Greater Mekong Subregion
Page 11
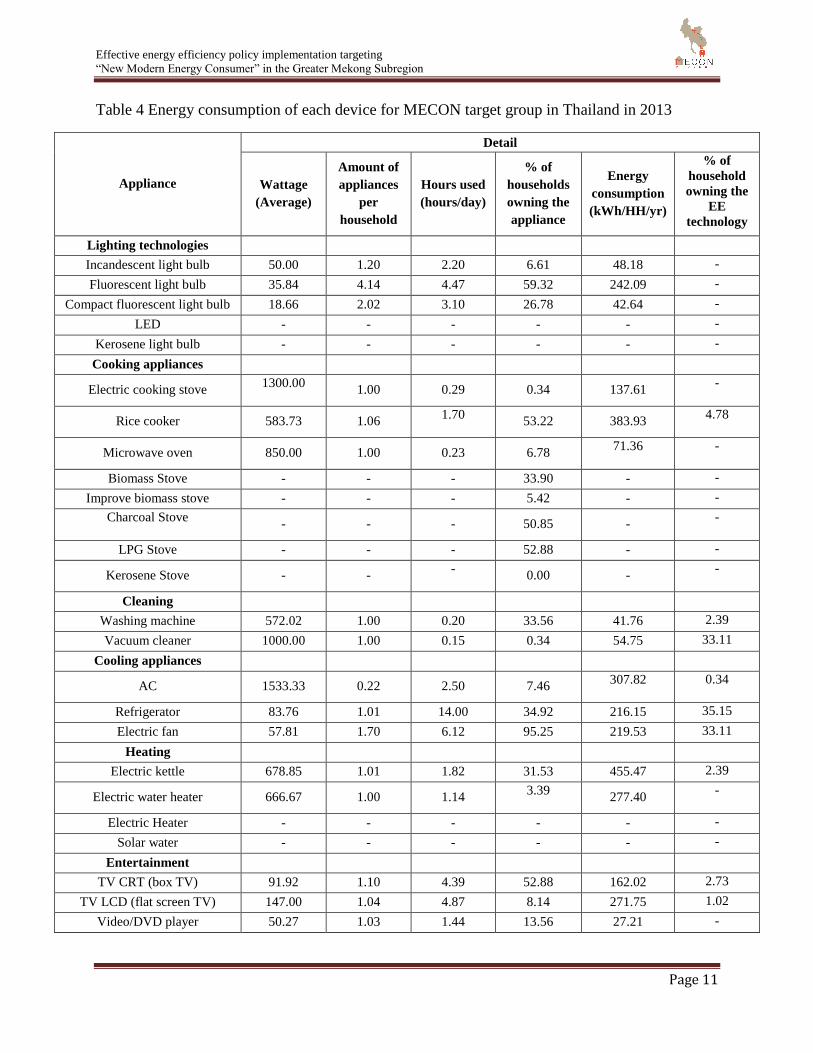
Table 4 Energy consumption of each device for MECON target group in Thailand in 2013
Appliance
Detail
Wattage
(Average)
Amount of
appliances
per
household
Hours used
(hours/day)
% of
households
owning the
appliance
Energy
consumption
(kWh/HH/yr)
% of
household
owning the
EE
technology
Lighting technologies
Incandescent light bulb 50.00 1.20 2.20 6.61 48.18 -
Fluorescent light bulb 35.84 4.14 4.47 59.32 242.09 -
Compact fluorescent light bulb 18.66 2.02 3.10 26.78 42.64 -
LED - - - - - -
Kerosene light bulb - - - - - -
Cooking appliances
Electric cooking stove 1300.00
1.00 0.29 0.34 137.61 -
Rice cooker 583.73 1.06 1.70
53.22 383.93 4.78
Microwave oven 850.00 1.00 0.23 6.78 71.36 -
Biomass Stove - - - 33.90 - -
Improve biomass stove - - - 5.42 - -
Charcoal Stove - - - 50.85 -
-
LPG Stove - - - 52.88 - -
Kerosene Stove - - -
0.00 - -
Cleaning
Washing machine 572.02 1.00 0.20 33.56 41.76 2.39
Vacuum cleaner 1000.00 1.00 0.15 0.34 54.75 33.11
Cooling appliances
AC 1533.33 0.22 2.50 7.46 307.82 0.34
Refrigerator 83.76 1.01 14.00 34.92 216.15 35.15
Electric fan 57.81 1.70 6.12 95.25 219.53 33.11
Heating
Electric kettle 678.85 1.01 1.82 31.53 455.47 2.39
Electric water heater 666.67 1.00 1.14 3.39
277.40 -
Electric Heater - - - - - -
Solar water - - - - - -
Entertainment
TV CRT (box TV) 91.92 1.10 4.39 52.88 162.02 2.73
TV LCD (flat screen TV) 147.00 1.04 4.87 8.14 271.75 1.02
Video/DVD player 50.27 1.03 1.44 13.56 27.21 -
Page 12
Effective energy efficiency policy implementation targeting
“New Modern Energy Consumer” in the Greater Mekong Subregion
Page 12
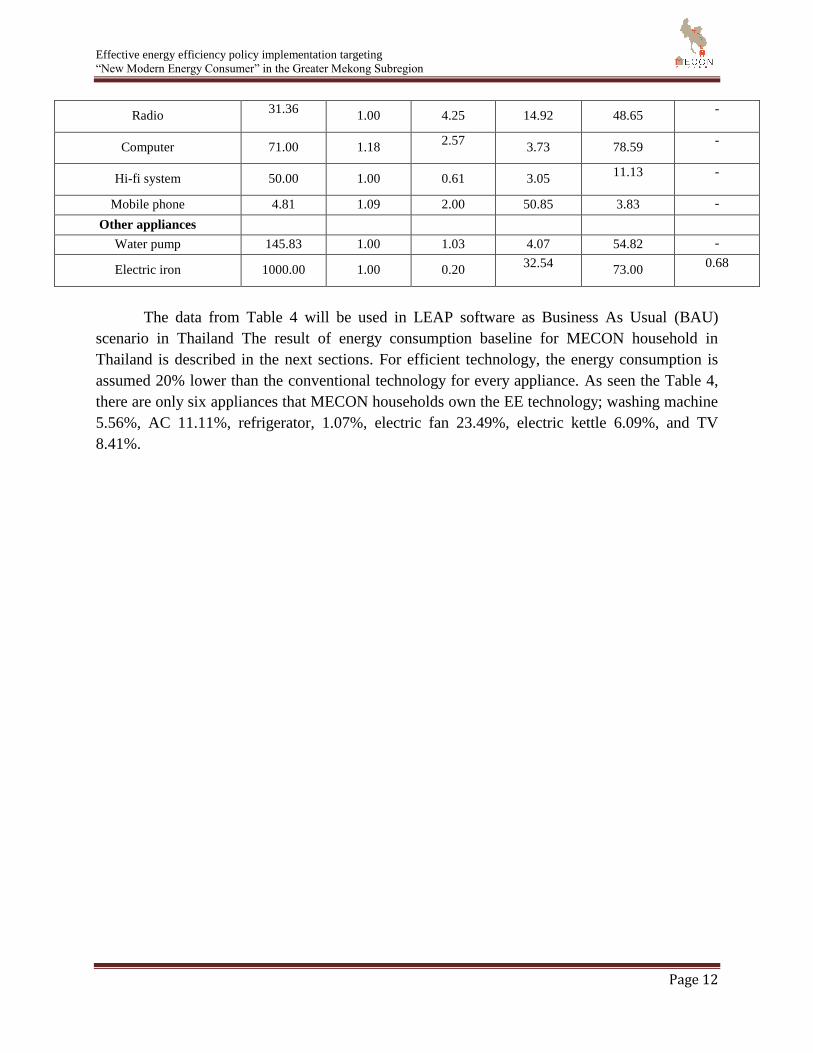
Radio 31.36
1.00 4.25 14.92 48.65 -
Computer 71.00 1.18 2.57
3.73 78.59 -
Hi-fi system 50.00 1.00 0.61 3.05 11.13 -
Mobile phone 4.81 1.09 2.00 50.85 3.83 -
Other appliances
Water pump 145.83 1.00 1.03 4.07 54.82 -
Electric iron 1000.00 1.00 0.20 32.54
73.00 0.68
The data from Table 4 will be used in LEAP software as Business As Usual (BAU)
scenario in Thailand The result of energy consumption baseline for MECON household in
Thailand is described in the next sections. For efficient technology, the energy consumption is
assumed 20% lower than the conventional technology for every appliance. As seen the Table 4,
there are only six appliances that MECON households own the EE technology; washing machine
5.56%, AC 11.11%, refrigerator, 1.07%, electric fan 23.49%, electric kettle 6.09%, and TV
8.41%.
Page 13
Effective energy efficiency policy implementation targeting
“New Modern Energy Consumer” in the Greater Mekong Subregion
Page 13
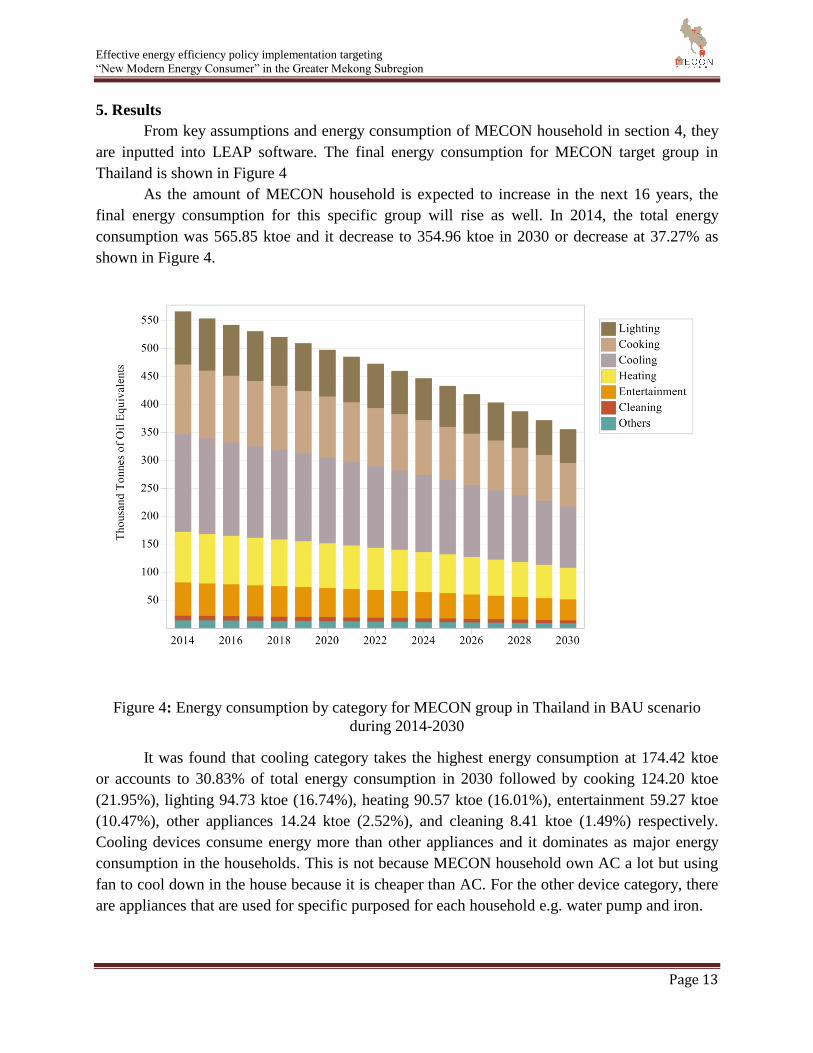
5. Results
From key assumptions and energy consumption of MECON household in section 4, they
are inputted into LEAP software. The final energy consumption for MECON target group in
Thailand is shown in Figure 4
As the amount of MECON household is expected to increase in the next 16 years, the
final energy consumption for this specific group will rise as well. In 2014, the total energy
consumption was 565.85 ktoe and it decrease to 354.96 ktoe in 2030 or decrease at 37.27% as
shown in Figure 4.
Figure 4: Energy consumption by category for MECON group in Thailand in BAU scenario
during 2014-2030
It was found that cooling category takes the highest energy consumption at 174.42 ktoe
or accounts to 30.83% of total energy consumption in 2030 followed by cooking 124.20 ktoe
(21.95%), lighting 94.73 ktoe (16.74%), heating 90.57 ktoe (16.01%), entertainment 59.27 ktoe
(10.47%), other appliances 14.24 ktoe (2.52%), and cleaning 8.41 ktoe (1.49%) respectively.
Cooling devices consume energy more than other appliances and it dominates as major energy
consumption in the households. This is not because MECON household own AC a lot but using
fan to cool down in the house because it is cheaper than AC. For the other device category, there
are appliances that are used for specific purposed for each household e.g. water pump and iron.
Page 14
Effective energy efficiency policy implementation targeting
“New Modern Energy Consumer” in the Greater Mekong Subregion
Page 14
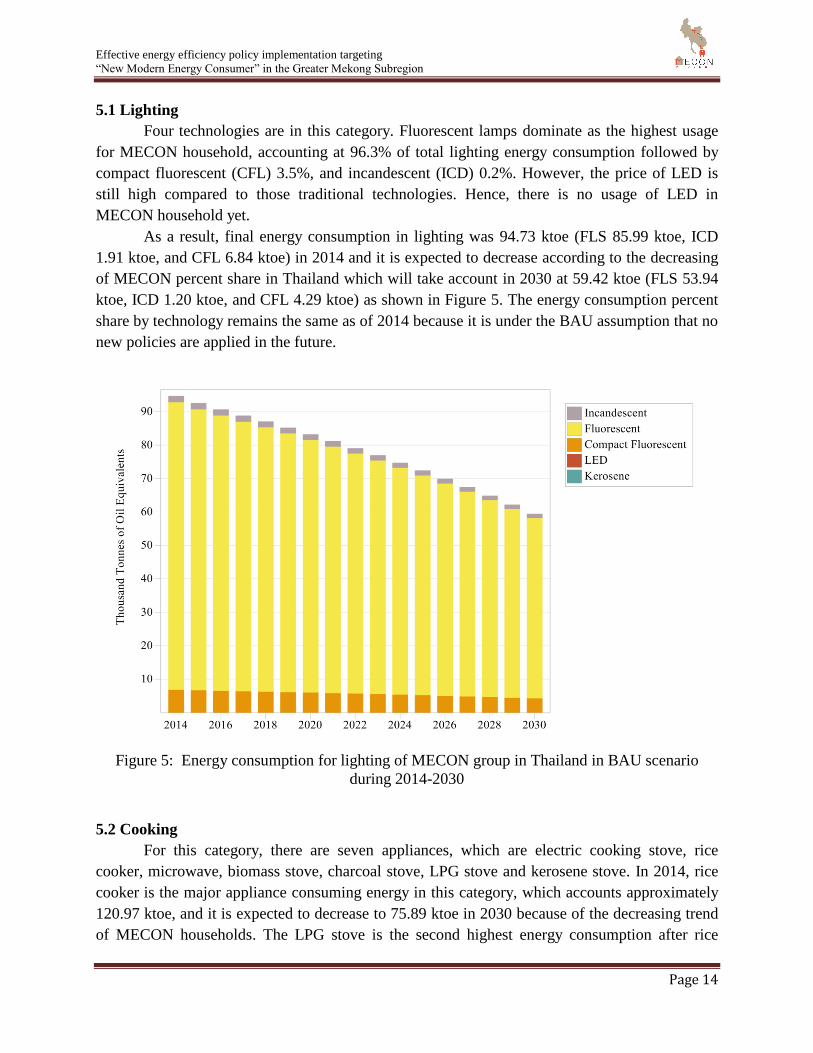
5.1 Lighting
Four technologies are in this category. Fluorescent lamps dominate as the highest usage
for MECON household, accounting at 96.3% of total lighting energy consumption followed by
compact fluorescent (CFL) 3.5%, and incandescent (ICD) 0.2%. However, the price of LED is
still high compared to those traditional technologies. Hence, there is no usage of LED in
MECON household yet.
As a result, final energy consumption in lighting was 94.73 ktoe (FLS 85.99 ktoe, ICD
1.91 ktoe, and CFL 6.84 ktoe) in 2014 and it is expected to decrease according to the decreasing
of MECON percent share in Thailand which will take account in 2030 at 59.42 ktoe (FLS 53.94
ktoe, ICD 1.20 ktoe, and CFL 4.29 ktoe) as shown in Figure 5. The energy consumption percent
share by technology remains the same as of 2014 because it is under the BAU assumption that no
new policies are applied in the future.
Figure 5: Energy consumption for lighting of MECON group in Thailand in BAU scenario
during 2014-2030
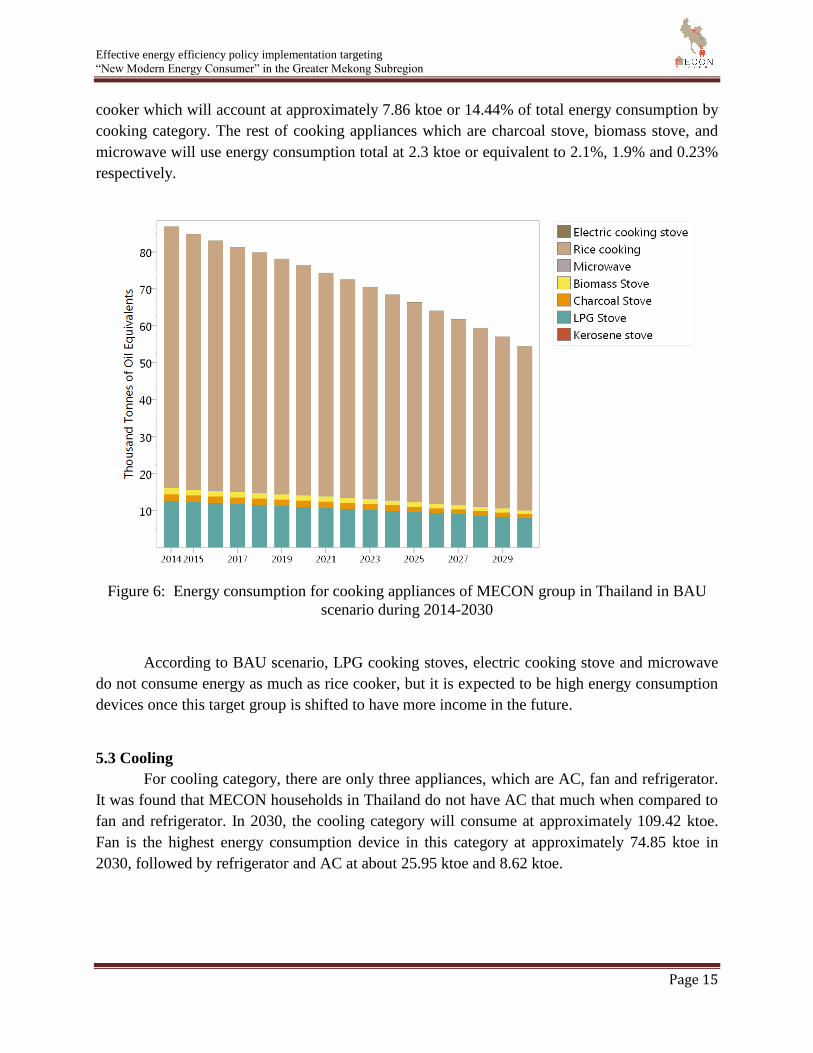
5.2 Cooking
For this category, there are seven appliances, which are electric cooking stove, rice
cooker, microwave, biomass stove, charcoal stove, LPG stove and kerosene stove. In 2014, rice
cooker is the major appliance consuming energy in this category, which accounts approximately
120.97 ktoe, and it is expected to decrease to 75.89 ktoe in 2030 because of the decreasing trend
of MECON households. The LPG stove is the second highest energy consumption after rice
Page 15
Effective energy efficiency policy implementation targeting
“New Modern Energy Consumer” in the Greater Mekong Subregion
Page 15
cooker which will account at approximately 7.86 ktoe or 14.44% of total energy consumption by
cooking category. The rest of cooking appliances which are charcoal stove, biomass stove, and
microwave will use energy consumption total at 2.3 ktoe or equivalent to 2.1%, 1.9% and 0.23%
respectively.
Figure 6: Energy consumption for cooking appliances of MECON group in Thailand in BAU
scenario during 2014-2030
According to BAU scenario, LPG cooking stoves, electric cooking stove and microwave
do not consume energy as much as rice cooker, but it is expected to be high energy consumption
devices once this target group is shifted to have more income in the future.
5.3 Cooling
For cooling category, there are only three appliances, which are AC, fan and refrigerator.
It was found that MECON households in Thailand do not have AC that much when compared to
fan and refrigerator. In 2030, the cooling category will consume at approximately 109.42 ktoe.
Fan is the highest energy consumption device in this category at approximately 74.85 ktoe in
2030, followed by refrigerator and AC at about 25.95 ktoe and 8.62 ktoe.
Page 16
Effective energy efficiency policy implementation targeting
“New Modern Energy Consumer” in the Greater Mekong Subregion
Page 16
Figure 7: Energy consumption for cooling of MECON group in Thailand in BAU scenario
during 2014-2030
It is clear that electric fan consumes higher energy than AC and refrigerator even its
power is much less those devices. The data collected from the household survey amongst low-
income households in Thailand1, the ownership of fan is 95.45% while refrigerator and AC are
only 34.92% and 7.46% of total households. As a result, fan will dominate energy consumption
in this category. Although fan has less capacity than refrigerator but it consumes electricity
similar to refrigerator. This is because the refrigerator has saving energy mode when it does not
use whereas conventional fan technology does not have.
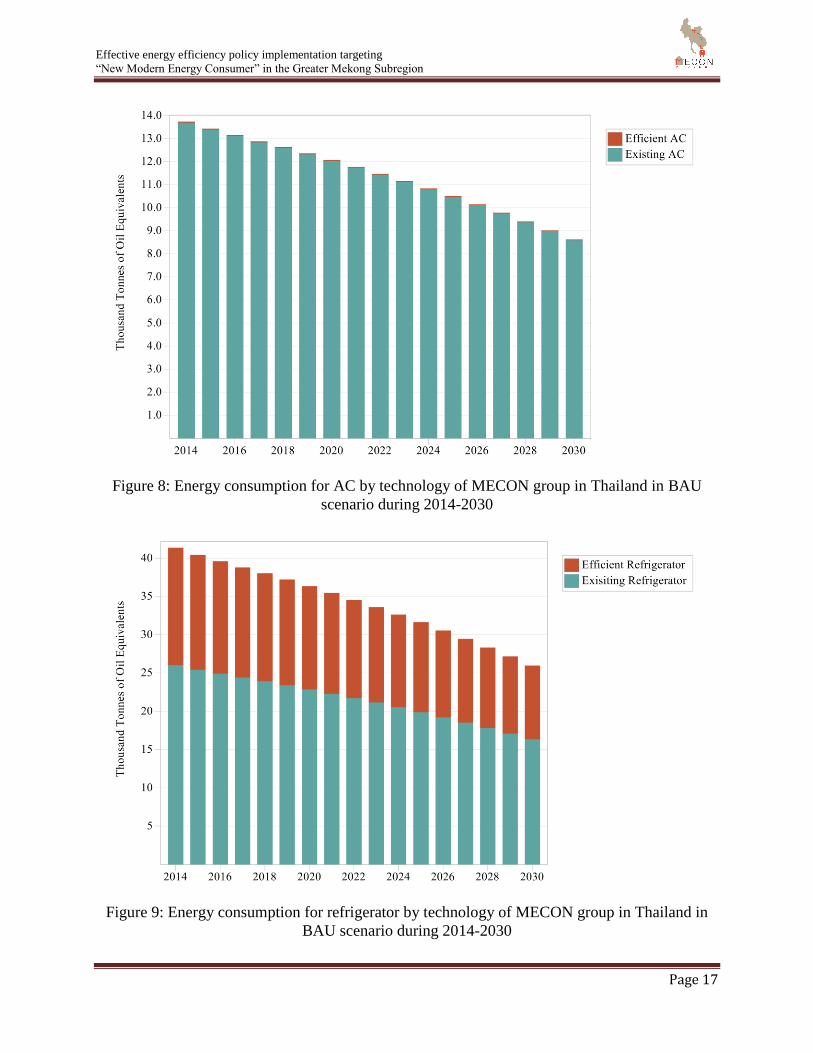
Under the BAU scenario, the household survey shows that EE technology accounts for
only 0.44% of total AC ownerships, 42.39% of total refrigerator ownerships, and 23.49% of total
fan ownerships. As a result, EE technology will take AC market share over than refrigerator and
fan as shown in Figure 8, 9 and 10. This is because AC consumes higher energy than fan and
refrigerator, therefore the producers are mandated to improve their product efficiency to use less
energy.
1 For more information on Thailand’s household survey, please see MECON Task 3 report: case
of Thailand.
Page 17
Effective energy efficiency policy implementation targeting
“New Modern Energy Consumer” in the Greater Mekong Subregion
Page 17
Figure 8: Energy consumption for AC by technology of MECON group in Thailand in BAU
scenario during 2014-2030
Figure 9: Energy consumption for refrigerator by technology of MECON group in Thailand in
BAU scenario during 2014-2030
Page 18
Effective energy efficiency policy implementation targeting
“New Modern Energy Consumer” in the Greater Mekong Subregion
Page 18
Figure 10: Energy consumption for fan by technology of MECON group in Thailand in BAU
scenario during 2014-2030
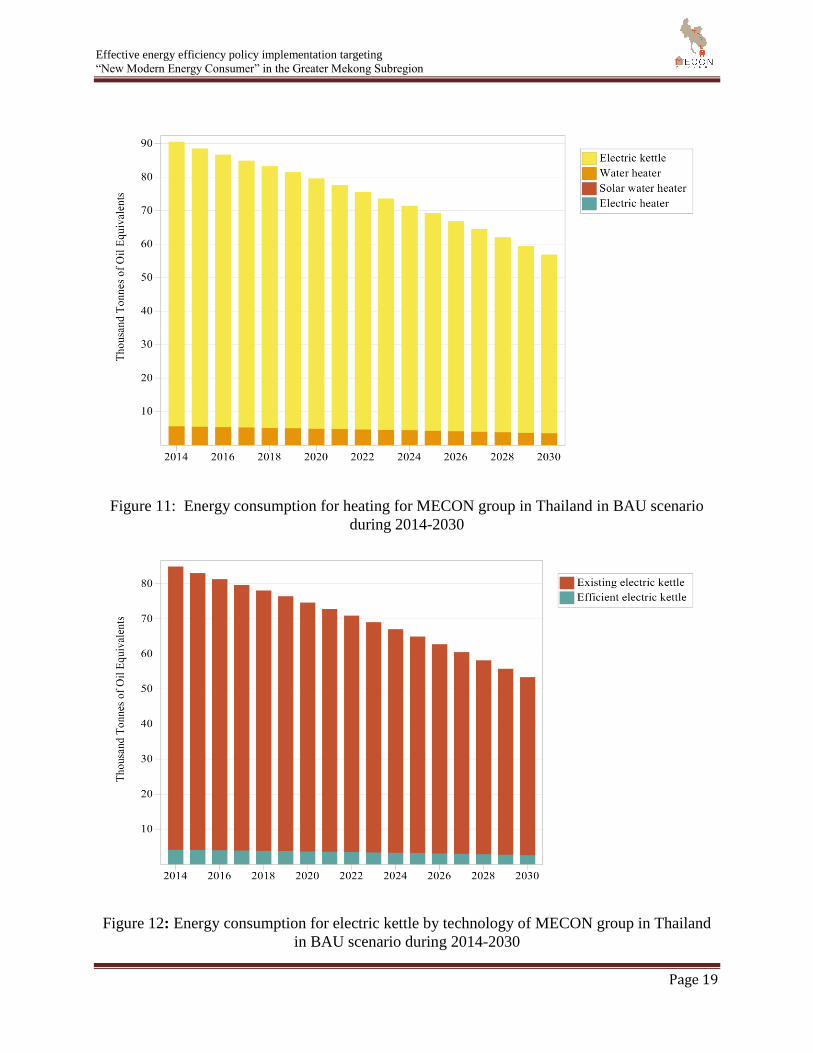
5.4 Heating
For heating category, it consists of electric kettle, water heater, solar water heater and
electric heater. In Thailand, there are only two appliances in this category, which are electric
kettle, and water heater because Thailand does not very cold winter therefore there is no need for
electric heater. Electric kettle and water heater consumes energy at 90.57 ktoe in 2014 and will
consume energy at approximately 56.82 ktoe in 2030. This is because of the declining of
MECON share in Thailand.
Page 19
Effective energy efficiency policy implementation targeting
“New Modern Energy Consumer” in the Greater Mekong Subregion
Page 19
Figure 11: Energy consumption for heating for MECON group in Thailand in BAU scenario
during 2014-2030
Figure 12: Energy consumption for electric kettle by technology of MECON group in Thailand
in BAU scenario during 2014-2030
Page 20
Effective energy efficiency policy implementation targeting
“New Modern Energy Consumer” in the Greater Mekong Subregion
Page 20
It was found that electric kettle and water heater consumes energy 99.4% of total energy
consumption by heating category while water heater takes only 0.6%. Electric kettle dominates
energy consumption in this category even its wattage is not high as water heater but the
percentage of household owning water heater is less than electric kettle as shown in Table 4.
Moreover, Thailand is tropical country and this specific MECON household is not likely to
afford the water heater in the daily life.
According to BAU scenario, it is assumed that 86.62% of MECON households own the
conventional technology of electric kettle, while the conventional technology of water heater
takes 100% of total water heater ownership. As a result, energy consumption for non-energy
efficient technology dominates energy consumption in this category.
5.5 Entertainment
Entertainment category consumes energy by 59.27 ktoe in 2014 and will decrease to
31.18 ktoe in 2030. In this category, TV is the highest energy consumer at approximately 36.17
ktoe in 2030 or 96.67% of total energy consumption by entertainment category. It was found that
even though there is LED technology in the market in the present, but it is still expensive for
low-income household. It was found that there are only two technologies that are used in low-
income household which are CRT and LCD technologies.
Figure 13: Energy consumption for entertainment of MECON group in Thailand in BAU
scenario during 2014-2030
Page 21
Effective energy efficiency policy implementation targeting
“New Modern Energy Consumer” in the Greater Mekong Subregion
Page 21
As can be seen in Figure 14, CRT still takes market share greater than LCD and LED
technology under BAU scenario. The assumption for conventional technology is 79.5% of total
TV ownership in MECON households. However, this trend is likely to change according to new
technology in the market. There will be higher share of LCD and LED in the future for new
policy scenario for this target group.
Figure 14: Energy consumption for TV by technology of MECON group in Thailand in BAU
scenario during 2014-2030
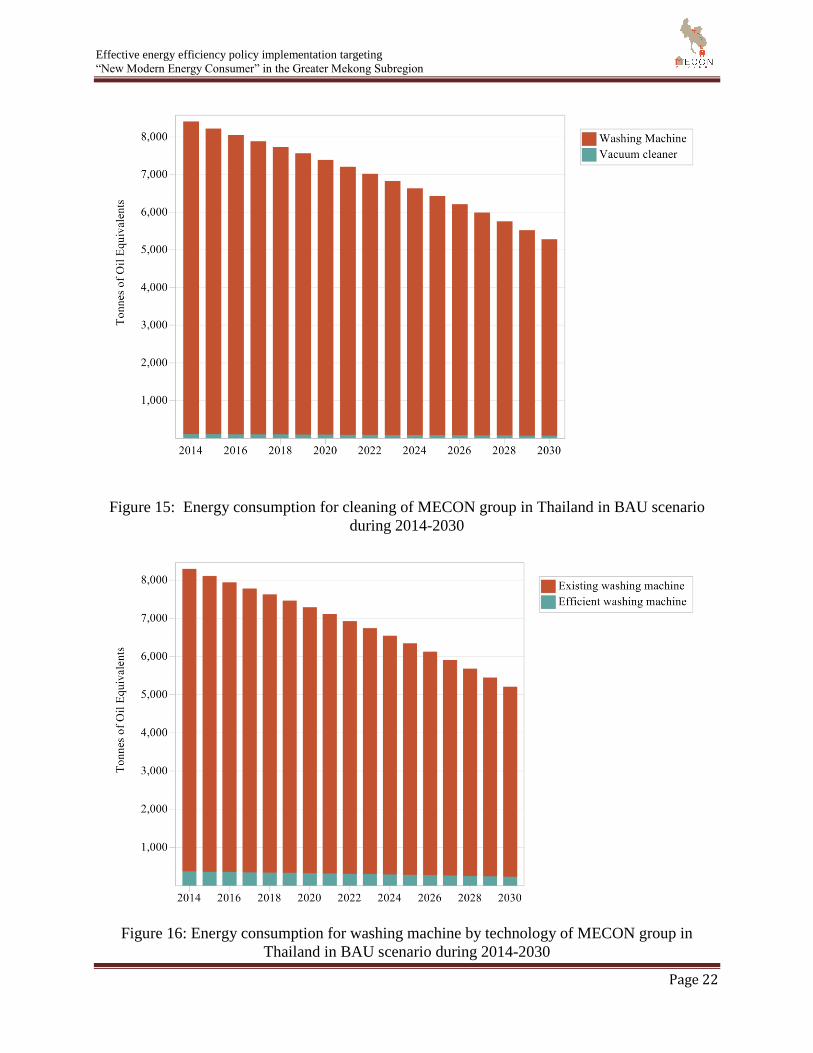
5.6 Cleaning
There are two major devices in this group, which are washing machine and vacuum
cleaner. However, the percent share of washing machine is higher than the vacuum cleaner
because of its price compared to other devices. The percent share of ownership of washing
machine takes accounts at approximately 99.99%.
Page 22
Effective energy efficiency policy implementation targeting
“New Modern Energy Consumer” in the Greater Mekong Subregion
Page 22
Figure 15: Energy consumption for cleaning of MECON group in Thailand in BAU scenario
during 2014-2030
Figure 16: Energy consumption for washing machine by technology of MECON group in
Thailand in BAU scenario during 2014-2030
Page 23
Effective energy efficiency policy implementation targeting
“New Modern Energy Consumer” in the Greater Mekong Subregion
Page 23
As a result, washing machine dominates energy consumption in this category. In 2014, it
consumes around 8.30 ktoe and it will decrease to 5.21 ktoe in 2030. The energy consumption is
expected to decrease at approximately 37.3%. Under the BAU scenario, traditional technology of
washing machine is assumed to dominate the market share of MECON household at
approximately 90.56%. As a result, the energy consumption of conventional technology is higher
than the energy efficient one.
5.7 Others
The rest of the household appliances, which are water pump and electric iron, are
included in “others” category. In 2014, it was found that these appliances consumed at
approximately 14.24 ktoe which electric iron dominate energy consumption in this category at
approximately 99.7% of total energy consumption by others category. In 2030, this category is
expected to consume energy at approximately 8.93 ktoe. This is because the MECON
households in Thailand do not own water pumps as much as electric irons. Under the BAU
scenario, both electric iron and water pump are conventional technology. As a result, there is no
energy efficient technology in this category.
Figure 17: Energy consumption for other category of MECON group in Thailand in BAU
scenario during 2014-2030
Page 24
Effective energy efficiency policy implementation targeting
“New Modern Energy Consumer” in the Greater Mekong Subregion
Page 24
6. Conclusion
MECON households in Thailand have common electric appliance such as fan, rice
cooker, TV, lighting and refrigerator. These appliances have been widely spread for quite some
time because most of the Thai citizens have had access to electricity for decades. However, this
benefit also results to the energy consumption in the country as well. It is found that daily
electric devices dominate energy consumption in household such as fan, rice cooker, TV and
lighting. This is because it is common used and most of households own these appliances.
Although, their power are not high comparing to large electric device e.g. AC, refrigerator,
washing machine but the frequency of use and the share of ownership are higher than the big
appliance with higher capacity e.g. AC and washing machine.
According to the projection, the percent share of Thailand’s MECON population is
expected to fall from 40.67% in 2013 to 24.21% in 2030. As a result, the total final energy
consumption for MECON household will be decrease at approximately 2.3% per annum under
BAU scenario.
Under the BAU scenario, the owning rates of all household appliances remain constant
while only the share percentage of MECON households and the total population are altered from
year 2013 to 2030. However, this target group is expected to have more income in the future, and
they will purchase more modern appliances in order to provide more comfortable and reduce
electricity bill such as AC, vacuum cleaner, lighting, TV, washing machine. This expectation
would affect to energy consumption in the future because MECON household will transfer as
medium income group and they will consume more energy. In Task 5 of the MECON project,
We will use alternative scenarios to foresee the changes that may take place if the owning rates
of some appliances are changed, and if some measures would have been implemented.
Key finding for this target group is a common device that usually use in daily such as rice
cooker and fan and lighting. It was found that these devices consume higher energy than those
large appliances such as AC, refrigerator, and washing machine. This is because, although
having lower wattage, these small devices are commonly owned by almost all surveyed
households as opposed to AC which is rarely found in these households. Moreover, each
household uses these small appliances for several hours per day while they only use washing
machine for a few hours per week.
On the owning trend of household appliances, modern entertainment devices such as
LCD and LCD television are expected to be more common among these households. . Moreover,
cooking device such as LPG cooking stove and rice cooking are more likely to be used in rural
area than urban area in Thailand. This is because urbanization lifestyle prefers buying food rather
than cooking regarding the free time and convenience. It should be noted than although stoves
might not be considered, as major appliances in the future in the city but microwave oven for
warming foods will take this important role for modern energy consumer household in Thailand.
Alternative scenarios for energy consumption in MECON household will be addressed in
order to analyze how low income household can shift from non-efficient products to efficient
product in the future and what appliances should be taken in to consideration. This will result in
energy consumption in the household as a whole picture when compared to BAU scenario.