70
DELIVERING CARE DELIVERING RESULTS Annual Report 2010

DELIVERINGCAREDELIVERINGREsults
Annual Report 2010

CoRpoRAtE pRofilE
Medical Facilities Corporation (“Medical Facilities” or “MFC”) owns majority interests
in four specialty surgical hospitals (“SSHs”) located in South Dakota and Oklahoma,
as well as a majority interest in one ambulatory surgery center (“ASC”) in California.
Medical Facilities’ SSHs focus on a limited number of high-volume, non-emergency
procedures, and diagnostic and imaging services, which are delivered on both an
inpatient and outpatient basis. The ASC is a specialized surgical center that performs
planned, non-emergency procedures on an outpatient basis.
The majority of free cash flows from operations of Medical Facilities is distributed
to holders of its Income Participating Securities (“IPSs” or “IPS units”) in the form
of interest and dividend on the subordinated debt and common share components,
respectively, of the IPS. The IPS units of the company are publicly traded on the
Toronto Stock Exchange under the symbol “DR.UN”.
Medical Facilities has a Distribution Reinvestment and Unit Purchase Plan, which
allows unitholders resident in Canada to automatically reinvest in a cost-effective
manner the monthly cash distributions on their IPS units in additional IPS units.
This Plan is administered by Computershare Investor Services Inc.
spECiAltY suRGiCAl HospitAls
Black Hills Surgical Hospital Rapid City, South Dakota
Dakota Plains Surgical Center Aberdeen, South Dakota
Oklahoma Spine Hospital Oklahoma City, Oklahoma
Sioux Falls Surgical Hospital Sioux Falls, South Dakota
AMBulAtoRY suRGERY CENtER
The Surgery Center of Newport Coast Newport Beach, California

Annual Report 2010
1
2010 — Year in Review
HIGHLIGHTS
• In a year marked by uncertainties created by healthcare reform, high
unemployment, and continued economic weakness, we recorded:
• Revenue of US$217.9 million, representing a four-year CAGR* of 10.1%
• Strong operating margin of 37.4%
• Robust cash generation, with cash available for distribution of
US$36.7 million, representing a four-year CAGR of 3.6%
• Comfortable payout ratio of 82.6%
• Completed organic expansions started in 2009 at our specialty surgical hospitals,
adding a total of 36 overnight stay rooms that increased our overnight stay
capacity by 55.4%
• Repurchased 107,200 units at an average price of C$9.24 per unit
• IPS unit price increased by 18.8% during the year to C$10.74 per unit
• Including distributions, our IPS units delivered a total return of 31.0% in 2010
FINANCIAL HIGHLIGHTS In US$ millions, unless otherwise noted
2010 2009 2008 2007 2006
Revenue $217.9 $207.4 $199.4 $168.8 $148.5
Operating income $81.4 $77.0 $80.7 $67.5 $60.1
Operating margin (%) 37.4% 37.1% 40.5% 40.0% 40.5%
Net income (loss) $(0.6) $(0.7) $19.6 $(17.6) $2.0
Cash available for distribution
$36.7 $33.1 $37.7 $34.2 $31.8
Cash available for distribution (C$ millions)
$37.8 $37.8 $40.2 $36.8 $36.0
Payout ratio 82.6% 82.6% 79.3% 84.6% 85.5%
Unit Price High (C$) Low (C$)
$11.11 $8.39
$9.12 $6.49
$11.99 $5.50
$12.85 $9.00
$12.00 $8.20
*Compound annual growth rate

Medical Facilities Corporation
2
It is with great pleasure that we report on our achievements in 2010. Despite a challenging
environment and weakness in the first two quarters of the year, we achieved the highest level of
revenue and operating income in our history. Our consolidated revenue for 2010 grew by 5.1% to
US$217.9 million and our consolidated operating income increased by 5.7% to US$81.4 million,
reflecting a strong increase in orthopedic and neurosurgical revenues. We saw both an increase
in the number of these cases and the average revenue generated by each case. As a result of
strong overall operations, our cash available for distribution increased by 10.7% in U.S.-dollar
terms, but was only in line with the previous year’s level in Canadian-dollar terms due to the
strength of the Canadian dollar.
This level of performance was made possible, at least in part, by our expansion projects which
began in 2009, which saw our overnight room capacity increase by 55.4% at our specialty
surgical hospitals. We have begun to see the positive impact of increased capacity in the form of
higher case volumes and an 11.0% increase in inpatient cases. We are pleased to have completed
these strategic projects in light of restrictions introduced with the Patient Protection and
Affordable Care Act (PPACA). This legislation prohibits future expansions of physician-owned
hospitals that treat Medicare patients. In addition, the legislation also prohibits these hospitals
from increasing the percentage owned by physicians. We would note, however, that while we
cannot increase this percentage, Medical Facilities can still add new physician-owners especially if
the economics are favorable to existing physician-owners. The status of the PPACA continues to
be uncertain given various judicial and legislative challenges facing it. Accordingly, it is impossible
to predict the impact, if any, that healthcare reform will have on the Medical Facilities’ operations.
As a result of the recession, over the past year, we have seen the percentage of services paid for
by governmental plans such as Medicare and Medicaid increase above historical norms. While
management expects this increased level of activity with the lower-paying governmental payors
to continue in the short term, we are especially pleased to observe favorable changes in our
payor mix in the fourth quarter, which, combined with impressive revenue growth during the
quarter, drove our operating margin up to 41.3%, the highest level in two years, and only slightly
below the level recorded in the fourth quarter of 2008. It is encouraging to see this improvement
in payor mix following two years during which we and many of our peers have reported
recession-induced reductions in the proportion of revenues coming from higher-reimbursing
non-governmental payors. However, it is also difficult to assess the sustainability of this recent
improvement, because although the U.S. economy has exhibited occasional positive signs on
certain economic indicators, many factors and events, both within the U.S. and globally, can
impact U.S. economic recovery.
Notwithstanding the general state of the U.S. economy, South Dakota and Oklahoma continue
to be among the states with lower unemployment and residential foreclosure rates, and provide
over 95% of Medical Facilities’ revenues. As for our California ASC, while the recession has
impacted the performance of Newport Coast, management is confident in the long-term outlook
for Newport Coast and the ambulatory surgery center (ASC) market in general.
Dear Unitholders,

Annual Report 2010
3
As we enter 2011, we expect to continue with the strategic initiatives we undertook in 2010 —
namely, cost control and physician recruitment. In addition, we are monitoring the market for
potential accretive acquisition opportunities while continuing to leverage our recent capacity
expansions to drive organic growth. Combined with growth in the areas serviced by our facilities,
we expect revenue to grow as case volumes increase and as case mix continues to shift to utilize
the expanded facilities at our SSHs and unused capacity at our ASC.
Over the longer term, our operating results will be affected by demographic and healthcare
spending trends. As the U.S. population increases and as the baby boomers continue to grow as
a proportion of total U.S. population over the next two decades, we expect that the demand for
healthcare services will also continue to increase.
Our balance sheet remains strong, giving us the financial flexibility to pursue strategic
opportunities as they arise, and to continue building value for our stakeholders. We are confident
that we will continue to produce cash available for distribution that is more than adequate to
continue paying the current level of distributions to our unitholders.
Sincerely,
Dr. Donald Schellpfeffer
Chief Executive Officer
TOTAL RETURN IN 2010
31.0%

Medical Facilities Corporation
4
HiGHlY EffiCiENt WoRK ENViRoNMENt
DEliVERiNG
MODERNBryan Den Hartog, M.D., orthopedic surgeonFoot and Ankle Specialist at Black Hills Surgical Hospital’s Orthopedic and Spine Center
Dr. Bryan Den Hartog joined Black Hills Surgical Hospital as a physician-owner in 1999,
after having previously worked in over a dozen hospitals. “It’s really the doctors that
run the hospital… administration is very responsive to our suggestions and to improving
quality of care, and the resulting efficiencies are staggering,” says Dr. Den Hartog, as he
highlights what differentiates Black Hills from other hospitals where he has practiced.
As a foot and ankle surgeon, his cases are higher-volume, shorter procedures. At Black
Hills, he can finish 10 to 12 cases a day and leave by 5:00 p.m. — more cases in less time
than a traditional hospital — due to the fast operating room turnaround time and a highly
skilled surgical team. Working at Black Hills has provided a significant balance in his life,
allowing him to spend quality time with family and pursue other interests. “This is as
perfect as I’ve seen it for hospital environments,” he adds.
CARE
Dr. Den Hartog and his sons were in Haiti as volunteers for Mission to Haiti when the devastating earthquake struck in January 2010. His team performed emergency surgical procedures on earthquake victims.
Annual Report 2010
5
World-class Surgical Teams in Leading-edge Facilities
At Medical Facilities, we recognize the importance of professionals who
provide high-quality care for our patients. Our facilities attract the best
surgeons and specialists in their respective areas of specialization because
of our focus on process efficiency and physician productivity. Our surgeons,
both owners and non-owners alike, are directly involved in establishing
operational processes and the resulting efficiencies. These efficiencies are
evident in our operating room turnaround time, which ranges between 5 and
22 minutes on average across our facilities, and in some cases, is almost
negligible as surgeons may be given two rooms in which to operate, allowing
them to move quickly from one procedure to another. Our surgeons are ably
supported by well-trained and highly skilled physician assistants (typically
employed by the surgeons in their practices) and nurses, whose value is
never overlooked. The support staff is a critical element of our success.
The objective of management of our facilities is to select the best nursing,
patient care, and support staff, provide continuous training, and foster a
collaborative, enthusiastic, team-oriented environment. This allows our
surgical teams to function harmoniously in providing quality care.
Donna Skinner, Chief Nursing Officer, Black Hills Surgical Hospital
“ We are successful not only because of our skilled
surgeons, but because of the very hardworking, dedicated,
caring, and professional staff throughout the hospital.
I am privileged to be a part of this organization.”
Medical Facilities Corporation
6
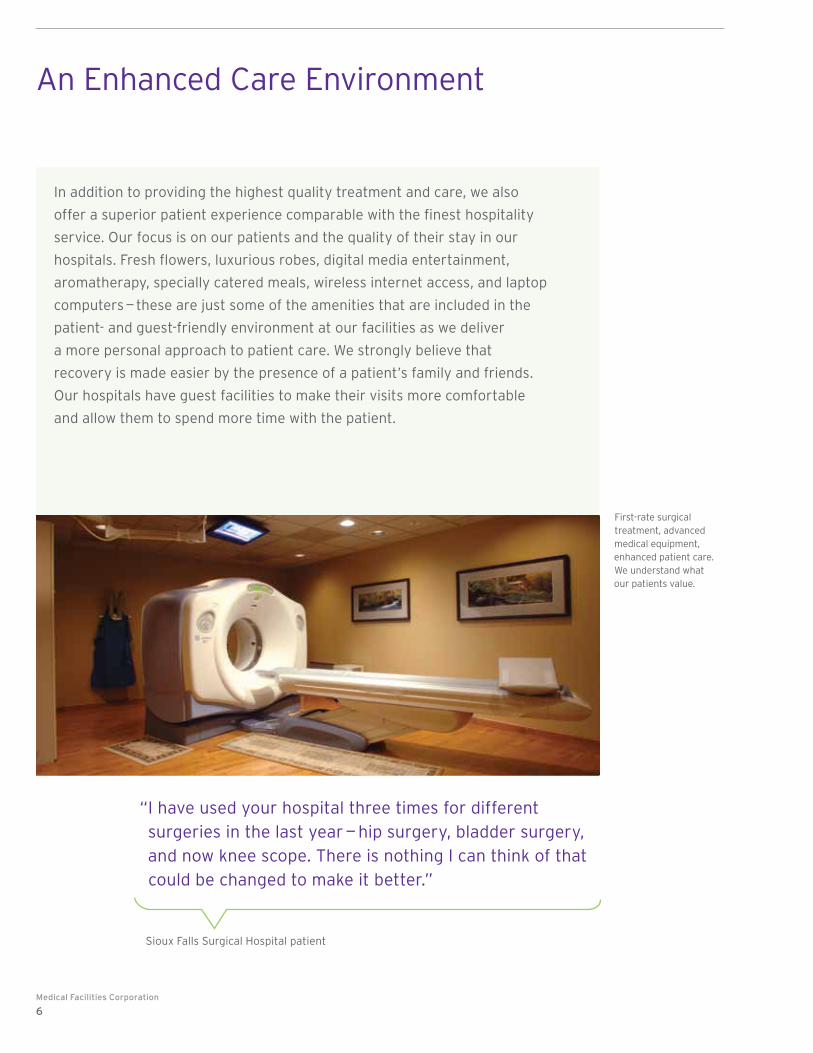
An Enhanced Care Environment
In addition to providing the highest quality treatment and care, we also
offer a superior patient experience comparable with the finest hospitality
service. Our focus is on our patients and the quality of their stay in our
hospitals. Fresh flowers, luxurious robes, digital media entertainment,
aromatherapy, specially catered meals, wireless internet access, and laptop
computers — these are just some of the amenities that are included in the
patient- and guest-friendly environment at our facilities as we deliver
a more personal approach to patient care. We strongly believe that
recovery is made easier by the presence of a patient’s family and friends.
Our hospitals have guest facilities to make their visits more comfortable
and allow them to spend more time with the patient.
First-rate surgical treatment, advanced medical equipment, enhanced patient care. We understand what our patients value.
Sioux Falls Surgical Hospital patient
“ I have used your hospital three times for different
surgeries in the last year — hip surgery, bladder surgery,
and now knee scope. There is nothing I can think of that
could be changed to make it better.”

Annual Report 2010
7
DEliVERiNG
EXCEPTIONAL
supERioR pAtiENt EXpERiENCE
REsults
Black Hills Surgical Hospital patient
“ I have never been to a more professional facility —
exceptional, first-class service from admissions
through to discharge.”

Medical Facilities Corporation
8
CARENECEssARyDEliVERiNG
A soCiAllY REspoNsiBlE EMploYER
Annual Report 2010
9
An Intrinsic Part of the Local Community
Our hospitals are integral and active members of the communities where
they are located. Aside from providing easy access to superior surgical
services to these communities, they also provide employment and training
to the best talent they can find, thereby helping support the local economy.
Our commitment to our locations is not limited to being employers in these
cities, but it extends to being active participants and sponsors of various
community programs. Black Hills is a major sponsor of the Wellspring
Stampede 10K, which benefits Wellspring Family-based Services. Additionally,
Black Hills sponsors clothing bins around the city to benefit the local rescue
mission. Oklahoma Spine has sponsored the Regional Food Bank, which
collects and distributes food to the needy in the Oklahoma City area, and the
Go Red for Women movement, which helps raise awareness of heart disease
among women. Furthermore, many Oklahoma Spine employees participate
in Hot Dogs for the Homeless, a weekly event where volunteers cook and
distribute hot dogs for homeless people in and around the city. Dakota Plains
offered free bone density testing at the Red Cross Community Fair. These are
just some examples of our hospitals’ involvement in their local communities.
Black Hills is a major sponsor of the Wellspring Stampede 10K,
which benefits Wellspring Family-based Services.
Medical Facilities Corporation
10
REsults
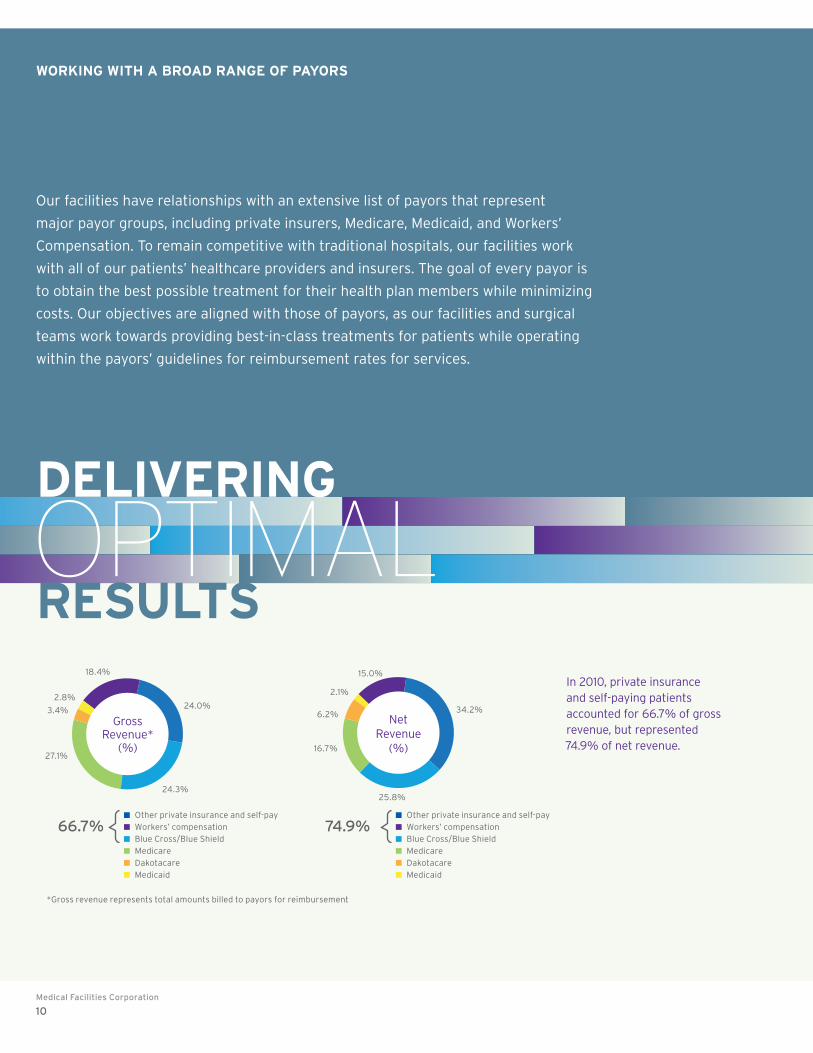
*Gross revenue represents total amounts billed to payors for reimbursement
DEliVERiNG
OPTIMAL
WoRKiNG WitH A BRoAD RANGE of pAYoRs
Our facilities have relationships with an extensive list of payors that represent
major payor groups, including private insurers, Medicare, Medicaid, and Workers’
Compensation. To remain competitive with traditional hospitals, our facilities work
with all of our patients’ healthcare providers and insurers. The goal of every payor is
to obtain the best possible treatment for their health plan members while minimizing
costs. Our objectives are aligned with those of payors, as our facilities and surgical
teams work towards providing best-in-class treatments for patients while operating
within the payors’ guidelines for reimbursement rates for services.
In 2010, private insurance and self-paying patients accounted for 66.7% of gross revenue, but represented 74.9% of net revenue.
18.4%
24.0%
24.3%
27.1%
3.4%
2.8%
Gross Revenue*
(%)
66.7% Other private insurance and self-pay
Workers’ compensation
Blue Cross/Blue Shield
Medicare
Dakotacare
Medicaid
15.0%
34.2%
25.8%
16.7%
6.2%
2.1%
Net Revenue
(%)
74.9% Other private insurance and self-pay
Workers’ compensation
Blue Cross/Blue Shield
Medicare
Dakotacare
Medicaid

Annual Report 2010
11
Healthcare Spending and Population Growth — Our Industry Drivers
0
1000
2000
3000
4000
5000
‘04 ‘05 ‘06 ‘07 ‘08 ‘09 ‘10 ‘11 ‘12 ‘13 ‘14 ‘15 ‘16 ‘17 ‘18 ‘19
National Health Expenditure projections* (us$ billions)
Source: U.S. Census Bureau,
National Population
Projections 2008
Source: Centers for Medicare & Medicaid Services, National
Health Expenditure Projections 2009-2019, September 2010
* 2009-2019 are projections
The U.S. population is expected to grow to 390 million in 2035 from 310 million now. The 45-and-over age group alone is expected to increase by 44 million during this period.
Demand for surgery increases for the higher age groups.
u.s. population projection Distribution (thousands)
0
100,000
200,000
300,000
400,000
500,000
‘10 ‘15 ‘20 ‘25 ‘30 ‘35 ‘40 ‘45 ‘50
65 yrs & over
45-64 yrs
25-44 yrs
18-24 yrs
Under 18
Our long-term operating results will be affected by demographic and healthcare
spending trends. As the U.S. population increases and as the baby boomers continue
to grow as a proportion of total U.S. population over the next two decades, it is
expected that the demand for healthcare services will continue to increase. In its
national population projections, the U.S. Census Bureau expects the over-65 age
group to grow from 13% of total population in 2010 to almost 20% of the population
by 2035. Combined with the 45-to-64 age group, the proportion of 45-and-over
population is expected to increase from 39% of the total population in 2010 to
42% in 2035.
The Centers for Medicare & Medicaid Services projects national health expenditures
to grow at an average annual rate of 6.3% from 2009 to 2019. This estimate, which
reflects the impact of the Patient Protection and Affordable Care Act enacted in
March 2010, is slightly higher than the pre-reform estimate of 6.1%.

Medical Facilities Corporation
12
Our SSHs are located in states that were less affected by the recession that gripped
the U.S. over the last few years. The unemployment rates in 2008 and 2009 in
South Dakota and Oklahoma were significantly lower than the national averages.
In addition, the 65-years-and-over age group represented a higher percentage
of the population compared with the national percentage.
SPeCIALTy SuRGICAL HOSPITALS
Name primary specialties
location size (‘000 sq.ft.)
licensed operating Rooms
licensed overnight Rooms
Black Hills Surgical Hospital Neurosurgery, Orthopaedics
Rapid City, SD 55 11 26
Dakota Plains Surgical Center Orthopaedics Aberdeen, SD 19 3 15
Oklahoma Spine Hospital Neurosurgery, Pain Management
Oklahoma City, OK 61 8 25
Sioux Falls Surgical Hospital Orthopaedics, E.N.T. Sioux Falls, SD 76 13 35
AMBuLATORy SuRGeRy CeNTeRS
Name primary specialties
location size (‘000 sq.ft.)
operating Rooms
overnight Rooms
The Surgery Center of Newport Coast Orthopaedics Newport Beach, CA 7 2 —
‘08 ‘09 ‘09
USA
SOUTHDAKOTA
OKLAHOMA
0
2
4
6
8
10
0
3
6
9
12
15
unemployment Rate (%) 65 & over (% of population)
Source: USDA Economic Research Service, U.S. Census
Bureau State & Country Quick Facts
Black Hills Surgical Hospital
Locations
Annual Report 2010
13
Management’s Discussion & Analysis 14
Management’s Responsibility for Financial Reporting 41
Auditors’ Report to the Shareholders 42
Consolidated Balance Sheets 44
Consolidated Statements of Income and Deficit 45
Consolidated Statements of Cash Flows 46
Notes to Consolidated Financial Statements 47
Corporate Information Inside Back Cover
Table of Contents

Medical Facilities Corporation
14
Management’s Discussion & Analysis Of Consolidated Financial Condition and Results of Operations
For the three-month and twelve-month periods ended December 31, 2010
March 17, 2011
The information in this Management’s Discussion and Analysis (“MD&A”) is supplemental to and should be read in conjunction with the consolidated financial statements of Medical Facilities Corporation (the “Corporation”) for the year ended December 31, 2010 and the notes thereto, which financial statements have been prepared in accordance with Canadian generally accepted accounting principles (“GAAP”). Substantially all of the Corporation’s operating cash flows are in U.S. dollars and all amounts presented in the financial statements and herein are stated in thousands of U.S. dollars, unless indicated otherwise.
This MD&A contains forward-looking statements (including, without limitation, in the section of this MD&A entitled “Outlook”). Such statements involve known and unknown risks, uncertainties and other factors outside of management's control that could cause actual results to differ materially from those described or anticipated in the forward-looking statements. Those risks include the risks identified in the section of this MD&A entitled “Risk Factors” (in particular in this regard, those identified under the subheading “Risks Related to the Business and the Industry of the Corporation”). The Corporation does not assume responsibility for the accuracy and completeness of these forward-looking statements and, except as may be required by law, does not undertake the obligation to publicly revise these forward-looking statements to reflect subsequent events or circumstances.
This discussion also makes reference to certain non-GAAP measures which assist in assessing the Corporation’s financial performance. Non-GAAP measures do not have any standard meaning prescribed by GAAP and are therefore unlikely to be comparable to similar measures presented by other issuers. Non-GAAP measures should not be considered as alternatives to comparable measures determined in accordance with GAAP as indicators of the Corporation’s financial performance, including its liquidity, cash flows and profitability. Reference should be made to the discussion under Section 2 “Non-GAAP Financial Measures – Standardized Distributable Cash and Cash Available for Distribution.”
Additional information about the Corporation and its Annual Information Form are available on SEDAR at www.sedar.com or the Corporation’s website at www.medicalfacilitiescorp.ca.
This MD&A is presented in the following sections:
1. Corporate Overview
2. Non-GAAP Financial Measures – Standardized Distributable Cash and Cash Available for Distribution
3. Condensed Consolidated Financial Highlights
4. Operating and Financial Results
5. Liquidity, Capital Resources and Financial Condition
6. Market Activities of the Corporation’s Securities
7. Financial Instruments
8. Related Party Transactions
9. Critical Accounting Estimates
10. Management’s Responsibility for Financial Reporting and Disclosure Controls
11. Risk Factors
12. Outlook
13. Supplementary Information

Annual Report 2010
15
1. CORPORATE OVERVIEW
The Corporation is a British Columbia corporation and is subject to corporate taxation in both Canada and the United
States. The capital of the Corporation is in the form of Income Participating Securities (“IPS”) units, convertible secured
debentures and other debt facilities at the corporate level. Each IPS unit represents: (a) Cdn$5.90 aggregate principal
amount of 12.5% subordinated notes payable of the Corporation and (b) one common share of the Corporation. In
December 2010, 10,000 IPS units separated into 10,000 common shares and $59,000 aggregate principal amount of
12.5% subordinated notes payable. For the purposes of this MD&A, the term “IPS unit” shall include the common shares
and subordinated notes that separated in December, 2010 and the term “IPS unitholders” shall include the holders of
common shares and subordinated notes payable that have separated.
The Corporation, through its wholly-owned U.S. subsidiary, owns majority interests in, and derives substantially all of its
income from, five limited liability entities (collectively the “Centers”), each of which owns either a specialty surgical
hospital (“SSH”) or an ambulatory surgery center (“ASC”). Three SSHs are located in South Dakota, one SSH is located in
Oklahoma and one ASC is located in California. On August 13, 2010, the holders of the minority interest in Barranca
Surgery Center, LLC (“Barranca”), a second ASC in California, redeemed the Corporation’s indirect 51% interest in
Barranca (see note 5 to the Corporation’s consolidated financial statements for the year ended December 31, 2010). ASCs
are specialized surgical centers that only provide outpatient procedures, whereas SSHs are licensed for both inpatient and
outpatient surgeries. The Centers provide facilities, including staff, surgical materials and supplies, and other support
necessary for scheduled surgical, pain management, imaging, and diagnostic procedures and derive their revenue
primarily from the fees charged for the use of these facilities. The Centers mainly focus on a limited number of clinical
specialties such as orthopaedic, neurosurgery, pain management and other non-emergency elective procedures.
Facility service revenue of the Centers (“facility service revenue”) for any given period is dependent on the volume of the
procedures performed as well as the acuity and complexity of the procedures (“case mix”) and composition of payors
(“payor mix”) as various payors have different reimbursement rates for the same type of procedures. The volume of
procedures performed at the Centers depends on (among other things): (i) the Centers’ ability to deliver high quality care
and superior services to patients and their family members; (ii) the Centers’ success in encouraging physicians to perform
procedures at the Centers through, among other things, maintenance of an efficient work environment for physicians as
well as availability of facilities; and (iii) established relationships with major third-party payors in the geographic areas
served. The case mix at each Center is a function of the clinical specialties of the physicians and medical staff and is also
dependent on the equipment and infrastructure at each Center.
Minority interests in the Centers are indirectly owned primarily by physicians practicing at the Centers. Upon acquisition
by the Corporation of the SSHs located in South Dakota and Oklahoma, the minority interest owners were granted the
right to exchange up to 14% of the ownership interest in their respective Centers for IPS units of the Corporation. The
minority interest owners of several Centers have exercised portions of their exchangeable interests. In April 2010,
pursuant to the terms of the exchange agreement between the Corporation and Oklahoma Spine Hospital, LLC, the
minority owners of Oklahoma Spine Hospital, LLC, exchanged 0.75% of the ownership in the Center for IPS units of the
Corporation. In connection with this transaction, the Corporation issued 64,443 IPS units.
As of December 31, 2010, the minority interests in the Centers were as follows:
Sioux Falls Surgical Hospital, LLP 49.0%
Dakota Plains Surgical Center, LLP 35.4%
Black Hills Surgical Hospital, LLP 45.8%
Oklahoma Spine Hospital, LLC 43.9%
The Surgery Center of Newport Coast, LLC 49.0%

Medical Facilities Corporation
16
Center Descriptions
Sioux Falls Surgical Hospital, LLP
Sioux Falls Surgical Hospital, LLP (“SFSH”), established in October 1985, is a multi-specialty surgical facility located in
Sioux Falls, South Dakota. SFSH performs orthopaedic, ear, nose and throat, urology, neurosurgery, gynecology, plastic,
gastrointestinal, pain management, general surgery and ophthalmology procedures. The SFSH service area includes Sioux
Falls and the communities east of Chamberlain, north of Yankton and south of Aberdeen in South Dakota, as well as
districts west of Worthington, Minnesota.
Dakota Plains Surgical Center, LLP
Dakota Plains Surgical Center, LLP (“DPSC”) is located in Aberdeen, South Dakota, and is attached to an orthopaedic clinic
that is the primary office of the orthopaedic physicians who account for 92% of the hospital's admissions. DPSC has been
operating as a licensed specialty hospital since 1998 and focuses primarily on orthopaedic procedures. The primary service
area for DPSC is the city of Aberdeen and surrounding townships.
Black Hills Surgical Hospital, LLP
Black Hills Surgical Hospital, LLP (“BHSH”) is located in Rapid City, South Dakota, and has been operating as a licensed
specialty hospital since January, 1997. BHSH is a multi-specialty surgical hospital, which focuses primarily on orthopaedic,
neurosurgical and pain management procedures. Other specialties include ear, nose and throat, general surgery,
gynecology, ophthalmology, podiatry and bariatric surgery. The BHSH service area includes western South Dakota, eastern
Wyoming, northwestern Nebraska and western North Dakota.
Oklahoma Spine Hospital, LLC
Oklahoma Spine Hospital, LLC (“OSH”) is located in Oklahoma City, Oklahoma, and has been operating as a licensed
specialty hospital since December 1999. OSH focuses on a limited number of clinical and surgical specialities, including
neurosurgery, pain management, orthopaedic surgery and podiatry. OSH’s primary service area extends beyond Oklahoma
City, a city with a metropolitan area of over one million people, into central and western Oklahoma. OSH is the only facility
in the Oklahoma City metropolitan area that focuses on the treatment of disorders of the spine.
The Surgery Center of Newport Coast, LLC
The Surgery Center of Newport Coast, LLC (“Newport Coast”) is located in Newport Beach, California. Newport Coast has
been operating since 2004 and is accredited by the AAAHC as a Medicare Deemed Multi-Specialty Facility. Newport Coast
focuses primarily on orthopaedic, gastroenterology, gynecology, cosmetic surgery and pain management procedures.
Table 1: Summary of Center information
SFSH DPSC BHSH OSH Newport Coast
Location Sioux Falls
SD Aberdeen
SD Rapid City
SD Oklahoma City
OK Newport Beach
CA
Size 76,000 sq ft 19,000 sq ft 75,000 sq ft 61,000 sq ft 7,000 sq ft
Operating Rooms 13 3 11 7 2
Overnight Rooms 35 15 26 25 -
Annual Report 2010
17
2. NON-GAAP FINANCIAL MEASURES – STANDARDIZED DISTRIBUTABLE CASH AND CASH AVAILABLE FOR DISTRIBUTION
The following is a discussion of two distinct non-GAAP measures: standardized distributable cash and cash available for
distribution.
Standardized Distributable Cash
Standardized distributable cash is a non-GAAP measure, defined in the Canadian Institute of Chartered Accountants
(“CICA”) 2007 interpretive release regarding standardized distributable cash, but it does not have any standardized
meaning within GAAP. While it is intended to provide a consistent and comparable measurement of distributable cash
across entities, standardized distributable cash as presented by the Corporation is unlikely to be comparable to similar
measures presented by other issuers. This measure is applicable primarily to income trusts. While the Corporation
distributes a significant portion of its cash available for distribution on a monthly basis, Medical Facilities Corporation is a
corporation and is not an income trust and some of the recommendations of the CICA’s interpretive release would not be
meaningful when applied to it. Therefore, certain recommendations have not been applied in determining the standardized
distributable cash and related ratios in the accompanying table (see Notes 2 and 9 to Table 2).
According to the CICA’s interpretive release, “standardized distributable cash is defined as the GAAP measure of cash
provided by operating activities after adjusting for capital expenditures, restrictions on distributions arising from
compliance with financial covenants restrictive at the time of reporting, and minority interests.” There are no restrictions
on distributions of the Corporation arising from its financial covenants as at December 31, 2010. Therefore, no adjustment
is made in respect of such restrictions in the calculation of standardized distributable cash.
Cash Available for Distribution
The Corporation distributes the majority of its free cash flows from operations to holders of its IPS units, taking into
account the anticipated working capital and liquidity needs of the Corporation, with a portion of such distributions being
interest payments on its subordinated notes and a portion being dividends on its common shares. The Corporation
believes that cash available for distribution on its IPS units provides a useful measure for evaluation of the Corporation’s
performance as it outlines the net cash flow generated by the Corporation, which is available for distribution in the period.
In particular, the Corporation believes that investors should be able to ascertain the extent to which the distributions are
funded by operations, as discussed below.
Cash available for distribution is a non-GAAP financial measure, does not have any standardized meaning prescribed by
GAAP and is therefore unlikely to be comparable to similar measures presented by other issuers. It is not intended to be
representative of cash flow or results of operations determined in accordance with GAAP. Table 2 below presents the
reconciliation of cash available for distribution to the cash provided by operating activities. The Corporation’s primary
source of cash for distribution is the Centers’ operating activities. Deficiencies arising from short-term working capital
requirements and capital expenditures may be financed with bank indebtedness. Investors are cautioned that cash
available for distribution, as calculated by the Corporation, may not be comparable to similar measures used by other
issuers.
Medical Facilities Corporation
18
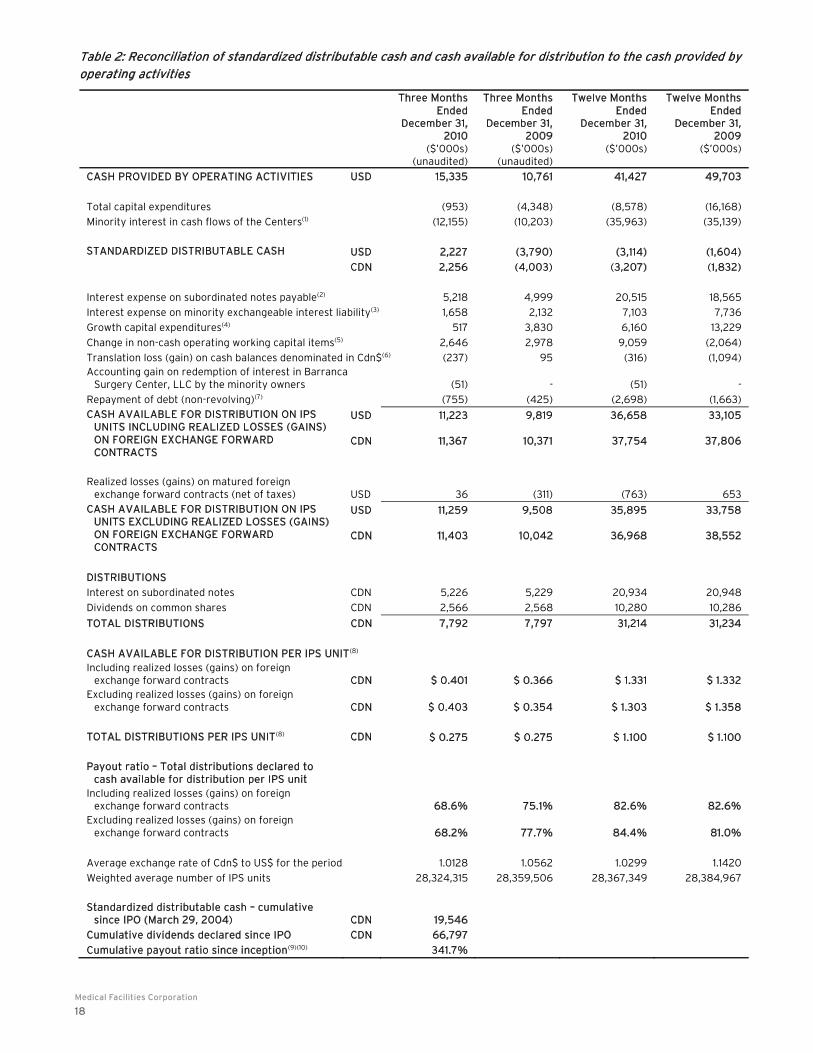
Table 2: Reconciliation of standardized distributable cash and cash available for distribution to the cash provided by operating activities
Three MonthsEnded
December 31,2010
($’000s)(unaudited)
Three MonthsEnded
December 31,2009
($’000s)(unaudited)
Twelve Months Ended
December 31, 2010
($’000s)
Twelve MonthsEnded
December 31,2009
($’000s)
CASH PROVIDED BY OPERATING ACTIVITIES USD 15,335 10,761 41,427 49,703
Total capital expenditures (953) (4,348) (8,578) (16,168)
Minority interest in cash flows of the Centers(1) (12,155) (10,203) (35,963) (35,139)
STANDARDIZED DISTRIBUTABLE CASH USD 2,227 (3,790) (3,114) (1,604)
CDN 2,256 (4,003) (3,207) (1,832)
Interest expense on subordinated notes payable(2) 5,218 4,999 20,515 18,565
Interest expense on minority exchangeable interest liability(3) 1,658 2,132 7,103 7,736
Growth capital expenditures(4) 517 3,830 6,160 13,229
Change in non-cash operating working capital items(5) 2,646 2,978 9,059 (2,064)
Translation loss (gain) on cash balances denominated in Cdn$(6) (237) 95 (316) (1,094) Accounting gain on redemption of interest in Barranca Surgery Center, LLC by the minority owners (51) - (51) -
Repayment of debt (non-revolving)(7) (755) (425) (2,698) (1,663)
CASH AVAILABLE FOR DISTRIBUTION ON IPS UNITS INCLUDING REALIZED LOSSES (GAINS) ON FOREIGN EXCHANGE FORWARD CONTRACTS
USD 11,223 9,819 36,658 33,105
CDN 11,367 10,371 37,754 37,806
Realized losses (gains) on matured foreign exchange forward contracts (net of taxes) USD 36 (311) (763) 653
CASH AVAILABLE FOR DISTRIBUTION ON IPS UNITS EXCLUDING REALIZED LOSSES (GAINS) ON FOREIGN EXCHANGE FORWARD CONTRACTS
USD 11,259 9,508 35,895 33,758
CDN 11,403 10,042 36,968 38,552
DISTRIBUTIONS
Interest on subordinated notes CDN 5,226 5,229 20,934 20,948
Dividends on common shares CDN 2,566 2,568 10,280 10,286
TOTAL DISTRIBUTIONS CDN 7,792 7,797 31,214 31,234
CASH AVAILABLE FOR DISTRIBUTION PER IPS UNIT(8) Including realized losses (gains) on foreign exchange forward contracts CDN $ 0.401 $ 0.366 $ 1.331 $ 1.332 Excluding realized losses (gains) on foreign exchange forward contracts CDN $ 0.403 $ 0.354 $ 1.303 $ 1.358 TOTAL DISTRIBUTIONS PER IPS UNIT(8) CDN $ 0.275 $ 0.275 $ 1.100 $ 1.100
Payout ratio – Total distributions declared to cash available for distribution per IPS unit Including realized losses (gains) on foreign exchange forward contracts 68.6% 75.1% 82.6% 82.6% Excluding realized losses (gains) on foreign exchange forward contracts 68.2% 77.7% 84.4% 81.0%
Average exchange rate of Cdn$ to US$ for the period 1.0128 1.0562 1.0299 1.1420
Weighted average number of IPS units 28,324,315 28,359,506 28,367,349 28,384,967
Standardized distributable cash – cumulative since IPO (March 29, 2004) CDN 19,546
Cumulative dividends declared since IPO CDN 66,797
Cumulative payout ratio since inception(9)(10) 341.7%

Annual Report 2010
19
Note 1: Minority interest in the cash flows of the Centers is deducted in determining standardized distributable cash as distributions from
the Centers to the minority interest holders are required to be made concurrently with distributions from the Centers to the Corporation.
Note 2: Interest expense on the subordinated notes payable is deducted in the determination of net income and cash provided by
operating activities and is added back to determine cash available for distribution as the subordinated notes payable are a component of
the IPS units.
Note 3: Interest expense attributable to the minority exchangeable interest liability represents a notional amount of interest expense
deducted in the determination of net income. It is added back to determine cash available for distribution as it is a non-cash charge and is
not distributable to the holders of the minority interest.
Note 4: Growth capital expenditures relate to the acquisition of capital assets to increase the productive capacity of the Centers beyond
maintaining existing productive capacity. Growth capital expenditures are financed by the Centers through long-term financing
arrangements and the use of general funds. Growth capital expenditures are added back in the determination of cash available for
distribution and the payments associated with these financing arrangements are deducted (see Note 7 below).
Note 5: While changes in non-cash operating working capital are included in the calculation of the cash provided by operating activities
and standardized distributable cash, they are not included in the calculation of the cash available for distribution as they represent only
temporary sources or uses of cash due to the differences in timing of recording facility service revenue and corresponding expenses and
actual receipts and outlays of cash. Such changes in the non-cash operating working capital are financed from the available cash or credit
facilities of the Centers.
Note 6: Unrealized losses (gains) on the translation into US$ of cash balances denominated in Cdn$ are adjusted in the determination of
cash available for distribution as such losses (gains) do not affect the amount of cash available for distribution in Cdn$.
Note 7: Repayment of non-revolving debt at the Centers’ level reflects contractual obligations of the Centers and is deducted in the
calculation of cash available for distribution.
Note 8: Calculated based on the weighted average number of IPS units outstanding.
Note 9: Interest on the subordinated debt portion of IPS units is deducted in the calculation of the cash provided by operating activities
and standardized distributable cash and, therefore, only dividends on the common share portion of IPS units are included in the
calculation of this ratio.
Note 10: The payout ratio of cumulative dividends declared since the IPO to the cumulative standardized distributable cash since IPO
exceeds the ratio of distributions declared to cash available for distribution due to the fact that the standardized cash includes growth
capital expenditures, interest on subordinated notes payable and changes in non-cash operating working capital, while these items are
adjusted in determining the amount of cash available for distribution.
In the three-month period ended December 31, 2010, the Corporation generated cash available for distribution including
realized losses (gains) on foreign exchange forward contracts of Cdn$11.4 million, which exceeded distributions of
Cdn$7.8 million declared in respect of this period by Cdn$3.6 million. On a per IPS unit basis, cash available for distribution
including realized losses (gains) on foreign exchange forward contracts of Cdn$0.401 was Cdn$0.126 or 45.8% higher than
distributions declared of Cdn$0.275, resulting in a payout ratio of 68.6% compared to 75.1% in the same period in 2009.
In the twelve-month period ended December 31, 2010, the Corporation generated cash available for distribution including
realized losses (gains) on foreign exchange forward contracts of Cdn$37.8 million, which exceeded distributions of
Cdn$31.2 million declared in respect of this period by Cdn$6.6 million. On a per IPS unit basis, cash available for
distribution including realized losses (gains) on foreign exchange forward contracts of Cdn$1.331 was Cdn$0.231 or 21.0%
higher than distributions declared of Cdn$1.100, resulting in a payout ratio of 82.6%, which was consistent with the payout
ratio in the same period last year.
Medical Facilities Corporation
20
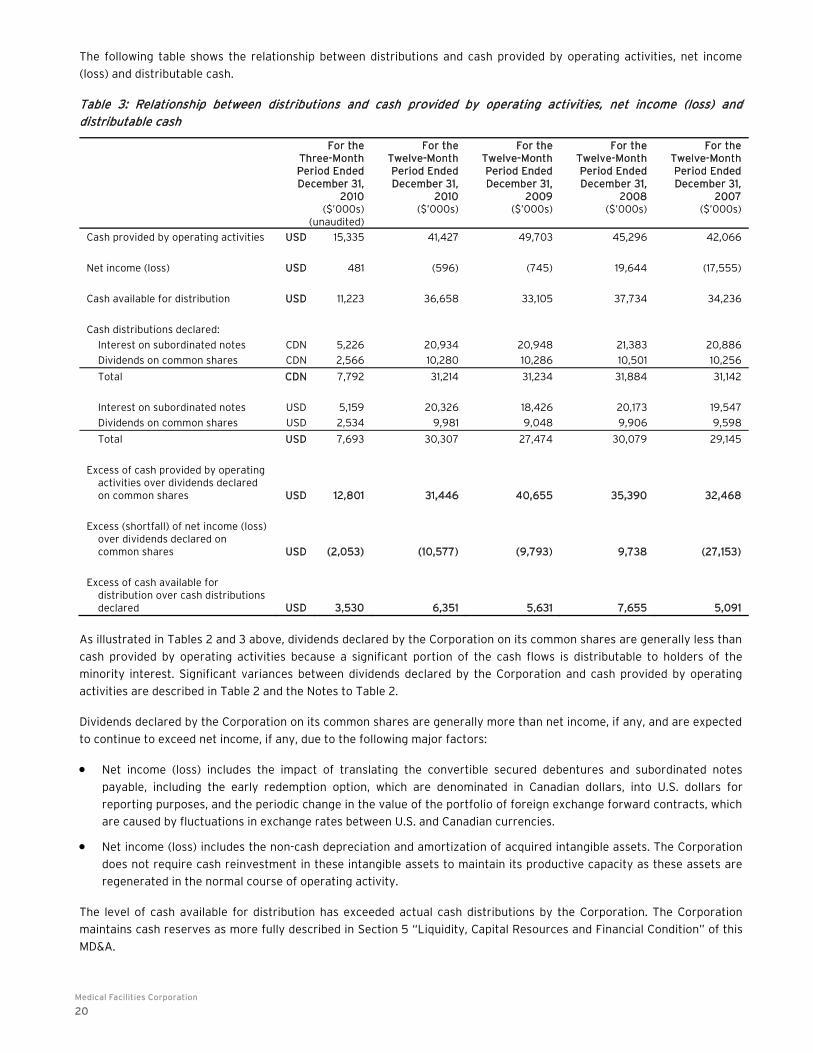
The following table shows the relationship between distributions and cash provided by operating activities, net income
(loss) and distributable cash.
Table 3: Relationship between distributions and cash provided by operating activities, net income (loss) and distributable cash
For the Three-MonthPeriod EndedDecember 31,
2010($’000s)
(unaudited)
For the Twelve-MonthPeriod EndedDecember 31,
2010($’000s)
For the Twelve-MonthPeriod EndedDecember 31,
2009($’000s)
For the Twelve-Month Period Ended December 31,
2008 ($’000s)
For theTwelve-Month Period EndedDecember 31,
2007($’000s)
Cash provided by operating activities USD 15,335 41,427 49,703 45,296 42,066
Net income (loss) USD 481 (596) (745) 19,644 (17,555)
Cash available for distribution USD 11,223 36,658 33,105 37,734 34,236
Cash distributions declared:
Interest on subordinated notes CDN 5,226 20,934 20,948 21,383 20,886
Dividends on common shares CDN 2,566 10,280 10,286 10,501 10,256
Total CDN 7,792 31,214 31,234 31,884 31,142
Interest on subordinated notes USD 5,159 20,326 18,426 20,173 19,547
Dividends on common shares USD 2,534 9,981 9,048 9,906 9,598
Total USD 7,693 30,307 27,474 30,079 29,145
Excess of cash provided by operating activities over dividends declared on common shares USD 12,801 31,446 40,655 35,390 32,468
Excess (shortfall) of net income (loss) over dividends declared on common shares USD (2,053) (10,577) (9,793) 9,738 (27,153)
Excess of cash available for distribution over cash distributions declared USD 3,530 6,351 5,631 7,655 5,091
As illustrated in Tables 2 and 3 above, dividends declared by the Corporation on its common shares are generally less than
cash provided by operating activities because a significant portion of the cash flows is distributable to holders of the
minority interest. Significant variances between dividends declared by the Corporation and cash provided by operating
activities are described in Table 2 and the Notes to Table 2.
Dividends declared by the Corporation on its common shares are generally more than net income, if any, and are expected
to continue to exceed net income, if any, due to the following major factors:
Net income (loss) includes the impact of translating the convertible secured debentures and subordinated notes
payable, including the early redemption option, which are denominated in Canadian dollars, into U.S. dollars for
reporting purposes, and the periodic change in the value of the portfolio of foreign exchange forward contracts, which
are caused by fluctuations in exchange rates between U.S. and Canadian currencies.
Net income (loss) includes the non-cash depreciation and amortization of acquired intangible assets. The Corporation
does not require cash reinvestment in these intangible assets to maintain its productive capacity as these assets are
regenerated in the normal course of operating activity.
The level of cash available for distribution has exceeded actual cash distributions by the Corporation. The Corporation
maintains cash reserves as more fully described in Section 5 “Liquidity, Capital Resources and Financial Condition” of this
MD&A.

Annual Report 2010
21
3. CONDENSED CONSOLIDATED FINANCIAL HIGHLIGHTS
Table 4: Condensed consolidated financial highlights
Years Ended December 31,
2010 2009 2008
($’000s, except per share and per IPS unit amounts)
Total assets 391,715 365,708 333,549
Total long-term financial liabilities(1) 243,758 220,044 193,439
Facility service revenue 217,918 207,426 199,375
Net income (loss) (596) (745) 19,644
Basic earnings (loss) per share $ (0.053) $ (0.027) $ 0.683
Fully diluted earnings (loss) per share $ (0.053) $ (0.027) $ 0.637
Cash distributions declared in the respective periods, per IPS unit Cdn$ 1.100 Cdn$ 1.100 Cdn$ 1.100
Note 1: Total long-term financial liabilities consist of long-term debt, convertible secured debentures and subordinated notes payable.
Table 5: Condensed consolidated income statement highlights
4th Q2010
($'000s)(unaudited)
3rd Q2010
($'000s)(unaudited)
2nd Q2010
($'000s)(unaudited)
1st Q2010
($'000s)(unaudited)
Twelve MonthsEnded
2010($'000s)
FACILITY SERVICE REVENUE 64,356 51,016 51,183 51,363 217,918
EXPENSES 37,773 32,073 32,086 34,545 136,478
OTHER INCOME 76 29 15 30 150
DEPRECIATION AND AMORTIZATION 4,978 5,110 4,958 4,830 19,876
INTEREST EXPENSE, NET(1) 6,785 6,667 7,289 5,908 26,647
INTEREST EXPENSE ON MINORITY EXCHANGEABLE INTEREST LIABILITY 1,658 1,808 1,801 1,836 7,103
CHANGE IN FAIR MARKET VALUE OF EARLY REDEMPTION OPTION (1,426) (5,385) 854 (4,382) (10,338)
MINORITY INTEREST 9,269 6,222 6,227 5,632 27,350
NET INCOME (LOSS) BEFORE GAIN (LOSS) ON FOREIGN CURRENCY AND INCOME TAX RECOVERY (EXPENSE) 5,395 4,550 (2,017) 3,024 10,952
GAIN (LOSS) ON FOREIGN CURRENCY(2) (4,282) (3,707) 6,070 (5,306) (7,225)
INCOME TAX RECOVERY (EXPENSE) (632) (2,703) (1,600) 612 (4,323)
NET INCOME (LOSS) FOR THE PERIOD 481 (1,860) 2,453 (1,670) (596)
BASIC AND FULLY DILUTED EARNINGS (LOSS) PER SHARE $ (0.015) $ (0.068) $ 0.085 $ (0.054) $ (0.053)
4th Q
2009($'000s)
(unaudited)
3rd Q2009
($'000s)(unaudited)
2nd Q2009
($'000s)(unaudited)
1st Q2009
($'000s)(unaudited)
Twelve MonthsEnded2009
($'000s)
FACILITY SERVICE REVENUE 58,048 48,960 52,178 48,239 207,426
EXPENSES 36,450 31,564 32,810 29,556 130,381
OTHER INCOME (LOSS) 72 (42) 82 58 169
DEPRECIATION AND AMORTIZATION 4,834 4,930 4,855 4,768 19,387
INTEREST EXPENSE, NET(1) 6,406 5,970 5,724 5,413 23,513
INTEREST EXPENSE ON MINORITY EXCHANGEABLE INTEREST LIABILITY 2,132 1,656 2,207 1,742 7,736
CHANGE IN FAIR MARKET VALUE OF EARLY REDEMPTION OPTION (1,408) (16,793) - - (18,201)
GOODWILL AND OTHER INTANGIBLES IMPAIRMENT - 4,661 - - 4,661
MINORITY INTEREST 7,717 5,961 6,869 6,511 27,058
NET INCOME (LOSS) BEFORE GAIN (LOSS) ON FOREIGN CURRENCY AND INCOME TAX RECOVERY (EXPENSE) 1,989 10,969 (205) 307 13,060
GAIN (LOSS) ON FOREIGN CURRENCY(2) (1,618) (7,161) (6,463) 2,381 (12,862)
INCOME TAX RECOVERY (EXPENSE) (557) (1,510) 2,165 (1,042) (943)
NET INCOME (LOSS) FOR THE PERIOD (186) 2,298 (4,503) 1,646 (745)
BASIC EARNINGS (LOSS) PER SHARE $ (0.009) $ 0.078 $ (0.149) $ 0.053 $ (0.027)
FULLY DILUTED EARNINGS (LOSS) PER SHARE $ (0.009) $ 0.078 $ (0.149) $ 0.050 $ (0.027)

Medical Facilities Corporation
22
Note 1: Interest expense, net, consists primarily of interest expense on the convertible secured debentures, subordinated notes payable
and long-term debt, offset by the interest earned on cash balances held by the Corporation.
Note 2: Gain (loss) on foreign currency is comprised of unrealized gains (losses) resulting from the translation into US$ of cash balances,
convertible secured debentures and subordinated notes payable denominated in Cdn$, changes in the value of the portfolio of foreign
exchange forward contracts held by the Corporation (as described in Section 7 “Financial Instruments” of this MD&A), and realized gains
or losses on the foreign exchange forward contracts matured in the respective periods (see note 19 to the consolidated financial
statements for the year ended December 31, 2010).
Changes in facility service revenue and expenses are discussed in Section 4 “Operating and Financial Results” of this
MD&A. Changes in other items for the three and twelve months ended December 31, 2010 compared to three and twelve
months ended December 31, 2009 are discussed below.
Depreciation and Amortization
Depreciation and amortization expense includes depreciation of property, plant and equipment and amortization of other
intangibles. The increase in depreciation and amortization expense of $0.1 million and $0.5 million for the three and twelve
months ended December 31, 2010, respectively, compared to the same periods last year is attributable to placing in service
and commencing the depreciation of assets constructed at some of the Centers in 2009 and 2010.
Interest Expense
Interest expense, net, consists primarily of interest expense on the convertible secured debentures, subordinated notes
payable (which are all denominated in Canadian dollars) and long-term debt, offset by the interest earned on the cash
balances held by the Corporation. The increase in net interest expense of $0.4 million and $3.1 million for the three and
twelve months ended December 31, 2010, respectively, compared to the same periods in 2009 is mainly attributable to (i)
the impact of a stronger Canadian dollar on the interest on borrowings in Canadian dollars in the three-month and twelve-
month periods ended December 31, 2010 and (ii) the interest on the credit facilities used to finance expansions at some of
the Corporation’s Centers which is no longer capitalized upon completion of the projects in 2009 and 2010.
Interest on Minority Exchangeable Interest Liability
Interest expense on minority exchangeable interest liability is calculated based on the portion of actual distributions from
the Centers to minority interests that is deemed attributable to the exchangeable interest. The change in the interest
expense on the minority exchangeable interest liability during the three-month and twelve-month periods ended
December 31, 2010 compared to the three-month and twelve-month periods ended December 31, 2009 is due to the
changes in the levels of distribution from the Centers in the respective periods.
Early Redemption Option
The Corporation has the right to redeem its subordinated notes payable at various premium rates prior to maturity of the
notes on March 29, 2014. The fair market value of the early redemption option on the Corporation’s subordinated notes
payable is calculated taking into account several factors, including the spread between the redemption strike price and
market yields, volatility of interest rates and the remaining time to maturity of the subordinated notes payable. The
continuing volatility in the credit markets in 2010 has led to substantial changes in the value of the early redemption
option in 2010. This value may fluctuate period by period and will be zero at the scheduled maturity date.
Goodwill and Other Intangibles Impairment
The Corporation performed its annual impairment test for goodwill and other intangibles as at December 31, 2010 and
determined that there was no impairment of goodwill and other intangibles.
Foreign Currency Gains (Losses)
Gains (losses) on foreign currency are comprised of unrealized gains (losses) resulting from the translation into U.S.
dollars of cash balances, convertible secured debentures and subordinated notes payable denominated in Canadian
dollars, changes in the value of the portfolio of foreign exchange forward contracts held by the Corporation (as described
in Section 7 “Financial Instruments” of this MD&A) and realized gains or losses on the foreign exchange forward contracts
matured in the respective periods (see note 19 to the Corporation’s consolidated financial statements for the year ended

Annual Report 2010
23
December 31, 2010). These gains (losses) on foreign currency are mainly attributable to the fluctuations in the exchange
rate between Canadian and U.S. dollars during the respective periods.
Income Tax
Income tax recovery (expense) relates to both current and future tax portions. The current tax portion is driven mostly by
the operating results of the Centers, corporate office expenses and realized gains or losses on the foreign exchange
forward contracts matured in the respective periods, while the future tax portion is driven by the temporary differences
between book and tax values of the reported assets and liabilities. The change in the income tax recovery (expense) for
the three-month and twelve-month periods ended December 31, 2010 compared to the same periods in 2009 is largely
attributable to the impact on future tax of the changes in the value of early redemption option described above and the
impact on current and future taxes of fluctuations in the exchange rate between Canadian and U.S. dollars in relation to:
(i) the fair market value of foreign exchange forward contracts held by the Corporation;
(ii) the translation of the Corporation’s convertible secured debentures and subordinated notes payable; and
(iii) the realized gains or losses on the Corporation’s foreign exchange forward contracts matured in the
respective periods.
In addition, the Corporation’s income tax expense in 2010 increased due to the tax effect of the redemption of the
Corporation’s 51% indirect interest in Barranca.
Net Income
The changes in net income for the three-month and twelve-month periods ended December 31, 2010 compared to the same
periods in 2009 are due to a number of off-setting factors, including stronger performance of the Corporation, the
changes in the value of the early redemption option, fluctuations in the exchange rate between Canadian and U.S. dollars
in the respective periods and a provision for goodwill and other intangibles impairment in 2009.
The increase in net income for the three months ended December 31, 2010 compared to the same period in 2009 is
primarily due to the stronger performance of the Centers and the reduced interest expense on minority exchangeable
interest liability, which offset the increase in the consolidated interest expense, an increased loss on foreign currency and
higher income tax expense. The small increase in net income for the twelve months ended December 31, 2010 compared to
the same period in 2009 is primarily due to the stronger performance of the Centers, the reduced interest expense on the
minority exchangeable interest liability, the absence of goodwill impairment in 2010 and a reduced loss on foreign
currency, all of which offset the increase in the consolidated interest expense, an increase in the value of the early
redemption option and higher income tax expense. The impact of operations on net income is discussed in detail in
Section 4 “Operating and Financial Results.”

Medical Facilities Corporation
24
4. OPERATING AND FINANCIAL RESULTS
Three months ended December 31, 2010 compared to three months ended December 31, 2009
Table 6.1: Operating and financial results for the three months ended December 31, 2010 compared to the three months ended December 31, 2009
Three Months Ended
December 31, 2010
Three Months Ended
December 31, 2009
% Change (unaudited) (unaudited)
($'000s)
% of facility service
revenue ($'000s)
% of facility service
revenue
Facility service revenue 64,356 58,048 10.9%
Operating expenses:
Salaries and benefits 14,771 23.0% 13,978 24.1% 5.7%
Drugs and supplies 14,682 22.8% 14,245 24.5% 3.1%
General, administrative and other operating expenses 8,320 12.9% 8,227 14.2% 1.1%
Total operating expenses 37,773 58.7% 36,450 62.8% 3.6%
Income before interest expense, depreciation and amortization, and other expenses (income) 26,583 41.3% 21,598 37.2% 23.1%
Facility service revenue for the three months ended December 31, 2010 of $64.4 million increased by $6.3 million or 10.9%
over the same period in 2009. The increased facility service revenue is primarily a reflection of a favourable case mix at
most of the Centers which resulted in a 9.5% increase in aggregate average revenue per case along with higher pain
management, imaging and anesthesia revenues at some of the Centers. Combined surgical case counts increased
marginally by 1.2% compared to the same period last year while combined pain management procedures increased by
10.6%. The positive impact of the foregoing was partially offset by a continuing trend of a higher proportion of cases
funded by payors with lower reimbursement rates (e.g., Medicare, Medicaid, Workers’ Compensation and private insurers
with fixed reimbursement schedules).
Consolidated expenses, including salaries and benefits, drugs and supplies, and general, administrative and other
operating expenses, for the three months ended December 31, 2010 totaled $37.8 million, an increase of $1.3 million or
3.6% over the same period in 2009. As a percentage of facility service revenue, the consolidated expenses decreased to
58.7% from 62.8% a year earlier.
Salaries and benefits for the three months ended December 31, 2010 increased by $0.8 million or 5.7% compared to the
same period in 2009. Such increase is primarily attributable to the additional staffing requirements to accommodate
increased case load at three out of five Centers which is consistent with the growth in facility service revenue at those
Centers. Annual wage adjustments and changes in employee health insurance costs were additional factors contributing to
the rise in salaries and benefits compared to the same period in 2009. Changes in the value of the Corporation’s Deferred
Share Unit Plan between the reporting periods was the primary cause of an increase in the salaries and benefits at the
corporate level.
Drugs and supplies expenses increased by $0.4 million or 3.1% for the three-month period ended December 31, 2010
compared to the same period in 2009. As a percentage of facility service revenue, the cost of drugs and supplies
decreased to 22.8% from 24.5% a year earlier due to the change in the case mix at all Centers which led to lower cost of
drugs and supplies per case.
General, administrative and other operating expenses for the three months ended December 31, 2010 increased by
$0.1 million or 1.1% compared to the three months ended December 31, 2009, primarily due to increases at BHSH related to
the increased facility service revenue, higher bad debt expense and physician recruiting cost, partially offset by a decline
in general, administrative and other operating expenses at SFSH due to lower bad debt expenses and a reduction in
professional fees and other public company-related costs. Other Centers saw marginal changes in their general,
administrative and other operating expenses.
Annual Report 2010
25
Consolidated income before interest expense, depreciation and amortization, and other expenses (income) of $26.6 million
for the three months ended December 31, 2010 was $5.0 million or 23.1% higher than the consolidated income for the
same period a year earlier, or 41.3% of facility service revenue compared to 37.2% in 2009.
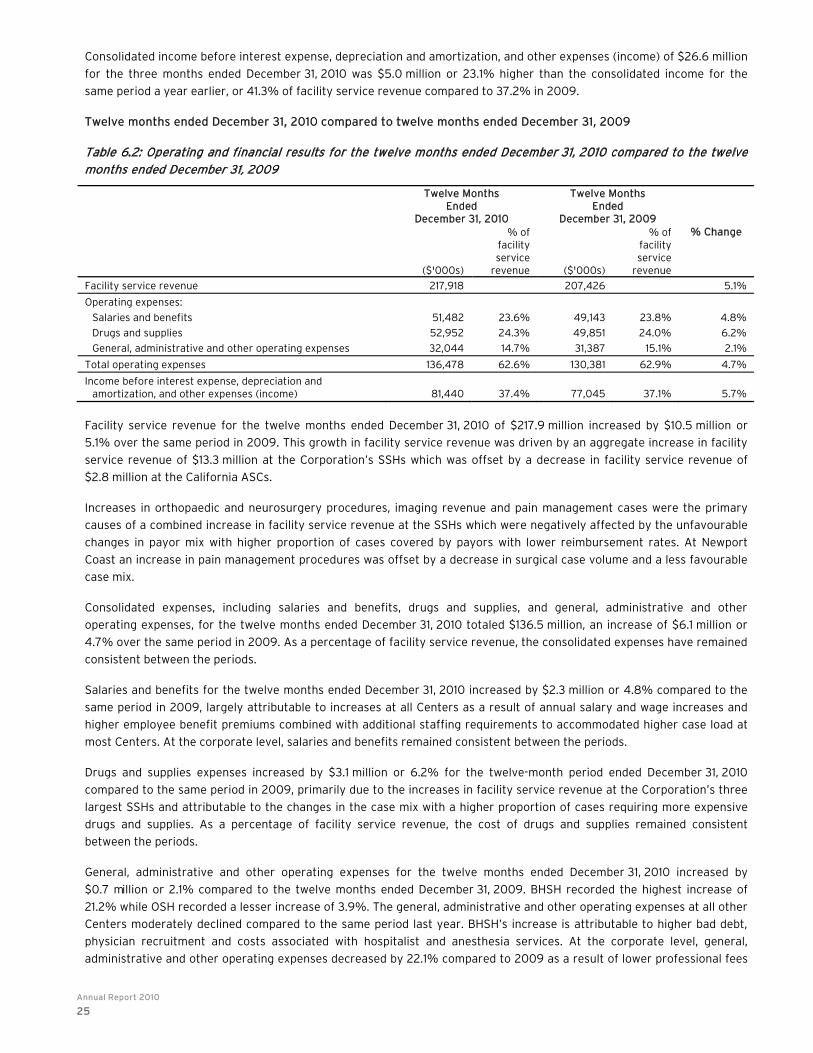
Twelve months ended December 31, 2010 compared to twelve months ended December 31, 2009
Table 6.2: Operating and financial results for the twelve months ended December 31, 2010 compared to the twelve months ended December 31, 2009
Twelve Months Ended
December 31, 2010
Twelve Months Ended
December 31, 2009 % Change
($'000s)
% of facility service
revenue ($'000s)
% of facility service
revenue
Facility service revenue 217,918 207,426 5.1%
Operating expenses:
Salaries and benefits 51,482 23.6% 49,143 23.8% 4.8%
Drugs and supplies 52,952 24.3% 49,851 24.0% 6.2%
General, administrative and other operating expenses 32,044 14.7% 31,387 15.1% 2.1%
Total operating expenses 136,478 62.6% 130,381 62.9% 4.7%
Income before interest expense, depreciation and amortization, and other expenses (income) 81,440 37.4% 77,045 37.1% 5.7%
Facility service revenue for the twelve months ended December 31, 2010 of $217.9 million increased by $10.5 million or
5.1% over the same period in 2009. This growth in facility service revenue was driven by an aggregate increase in facility
service revenue of $13.3 million at the Corporation’s SSHs which was offset by a decrease in facility service revenue of
$2.8 million at the California ASCs.
Increases in orthopaedic and neurosurgery procedures, imaging revenue and pain management cases were the primary
causes of a combined increase in facility service revenue at the SSHs which were negatively affected by the unfavourable
changes in payor mix with higher proportion of cases covered by payors with lower reimbursement rates. At Newport
Coast an increase in pain management procedures was offset by a decrease in surgical case volume and a less favourable
case mix.
Consolidated expenses, including salaries and benefits, drugs and supplies, and general, administrative and other
operating expenses, for the twelve months ended December 31, 2010 totaled $136.5 million, an increase of $6.1 million or
4.7% over the same period in 2009. As a percentage of facility service revenue, the consolidated expenses have remained
consistent between the periods.
Salaries and benefits for the twelve months ended December 31, 2010 increased by $2.3 million or 4.8% compared to the
same period in 2009, largely attributable to increases at all Centers as a result of annual salary and wage increases and
higher employee benefit premiums combined with additional staffing requirements to accommodated higher case load at
most Centers. At the corporate level, salaries and benefits remained consistent between the periods.
Drugs and supplies expenses increased by $3.1 million or 6.2% for the twelve-month period ended December 31, 2010
compared to the same period in 2009, primarily due to the increases in facility service revenue at the Corporation’s three
largest SSHs and attributable to the changes in the case mix with a higher proportion of cases requiring more expensive
drugs and supplies. As a percentage of facility service revenue, the cost of drugs and supplies remained consistent
between the periods.
General, administrative and other operating expenses for the twelve months ended December 31, 2010 increased by
$0.7 million or 2.1% compared to the twelve months ended December 31, 2009. BHSH recorded the highest increase of
21.2% while OSH recorded a lesser increase of 3.9%. The general, administrative and other operating expenses at all other
Centers moderately declined compared to the same period last year. BHSH’s increase is attributable to higher bad debt,
physician recruitment and costs associated with hospitalist and anesthesia services. At the corporate level, general,
administrative and other operating expenses decreased by 22.1% compared to 2009 as a result of lower professional fees

Medical Facilities Corporation
26
and non-recurring expenses incurred in 2009. As a percentage of facility service revenue, general, administrative and
other operating expenses decreased to 14.7% from 15.1% last year.
Consolidated income before interest expense, depreciation and amortization, and other expenses (income) of $81.4 million
for the twelve months ended December 31, 2010 was $4.4 million or 5.7% higher than the consolidated income for the
same period a year earlier, or 37.4% of facility service revenue compared to 37.1% in 2009.
The year-to-date results presented above include results of operations for Barranca through August 13, 2010, at which
time the holders of the minority interest in Barranca redeemed the Corporation’s indirect 51% interest in the Center.
Without including results for Barranca for 2010 and 2009, facility service revenue for the twelve months ended
December 31, 2010 of $217.3 million would have been higher by $12.4 million or 6.0% compared to the same period in 2009
and operating income of $81.9 million would have been higher by $5.4 million or 7.1%.
5. LIQUIDITY, CAPITAL RESOURCES AND FINANCIAL CONDITION
Cash generated from operating activities of the Centers is the source of financing for the Corporation’s operations and for
meeting its contractual obligations. In combination with Table 2 in Section 2 “Non-GAAP Financial Measures –
Standardized Distributable Cash and Cash Available for Distribution,” Table 7 below provides further insight into the
composition of the Corporation’s cash available for distribution.
Table 7: Reconciliation of cash flows from the Centers to cash available for distribution to IPS unitholders
Three MonthsEnded
December 31,2010
($’000s)(unaudited)
Three MonthsEnded
December 31,2009
($’000s)(unaudited)
Twelve Months Ended
December 31, 2010
($’000s)
Twelve MonthsEnded
December 31,2009
($’000s)
Cash flows from the Centers:
Income before interest expense, depreciation and amortization, and other income 28,419 23,424 85,827 81,976
Other income (loss) (6) 72 87 169
Income before interest expense, depreciation and amortization 28,413 23,496 85,914 82,145
Less:
Debt service cost:
Interest (540) (386) (2,062) (1,147)
Repayments (755) (425) (2,698) (1,663)
Maintenance capital expenditures (436) (518) (2,419) (2,940)
Cash available for distribution at Center level 26,682 22,167 78,735 76,395
Less:
Minority interest in cash available for distribution at Center level (12,155) (10,203) (35,963) (35,139)
Corporation's share of the cash available for distribution at Center level 14,527 11,964 42,772 41,256
Less:
Corporate expenses (1,795) (1,816) (4,275) (4,861)
Interest on convertible secured debentures (803) (770) (3,132) (2,836)
Realized gains (losses) on matured foreign exchange forward contracts (61) 527 1,293 (1,106)
Current income taxes (645) (86) - 652
Cash available for distribution to IPS unitholders including realized gains (losses) on foreign exchange forward contracts USD 11,223 9,819 36,658 33,105
Cash available for distribution to IPS unitholders including realized gains (losses) on foreign exchange forward contracts CDN 11,367 10,371 37,754 37,806
Per IPS unit CDN $ 0.401 $ 0.366 $ 1.331 $ 1.332
Average exchange rate of Cdn$ to US$ for the period 1.0128 1.0562 1.0299 1.1420
Annual Report 2010
27
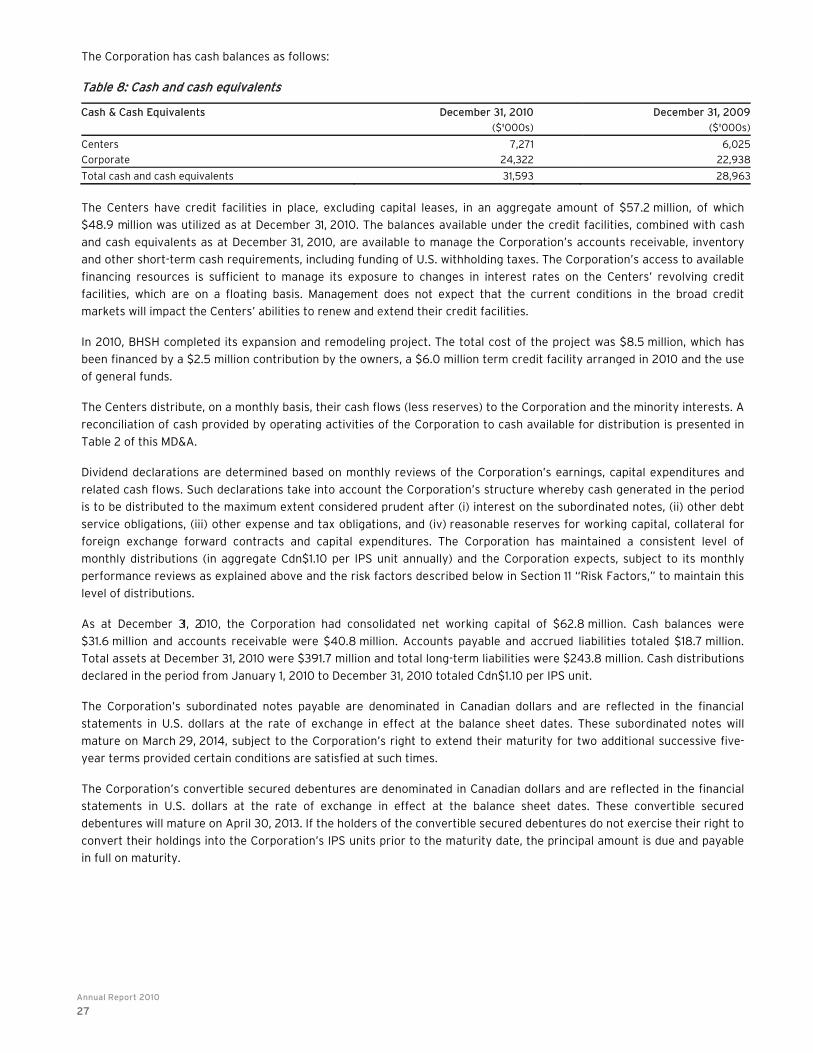
The Corporation has cash balances as follows:
Table 8: Cash and cash equivalents
Cash & Cash Equivalents December 31, 2010 December 31, 2009
($'000s) ($'000s)
Centers 7,271 6,025
Corporate 24,322 22,938
Total cash and cash equivalents 31,593 28,963
The Centers have credit facilities in place, excluding capital leases, in an aggregate amount of $57.2 million, of which
$48.9 million was utilized as at December 31, 2010. The balances available under the credit facilities, combined with cash
and cash equivalents as at December 31, 2010, are available to manage the Corporation’s accounts receivable, inventory
and other short-term cash requirements, including funding of U.S. withholding taxes. The Corporation’s access to available
financing resources is sufficient to manage its exposure to changes in interest rates on the Centers’ revolving credit
facilities, which are on a floating basis. Management does not expect that the current conditions in the broad credit
markets will impact the Centers’ abilities to renew and extend their credit facilities.
In 2010, BHSH completed its expansion and remodeling project. The total cost of the project was $8.5 million, which has
been financed by a $2.5 million contribution by the owners, a $6.0 million term credit facility arranged in 2010 and the use
of general funds.
The Centers distribute, on a monthly basis, their cash flows (less reserves) to the Corporation and the minority interests. A
reconciliation of cash provided by operating activities of the Corporation to cash available for distribution is presented in
Table 2 of this MD&A.
Dividend declarations are determined based on monthly reviews of the Corporation’s earnings, capital expenditures and
related cash flows. Such declarations take into account the Corporation’s structure whereby cash generated in the period
is to be distributed to the maximum extent considered prudent after (i) interest on the subordinated notes, (ii) other debt
service obligations, (iii) other expense and tax obligations, and (iv) reasonable reserves for working capital, collateral for
foreign exchange forward contracts and capital expenditures. The Corporation has maintained a consistent level of
monthly distributions (in aggregate Cdn$1.10 per IPS unit annually) and the Corporation expects, subject to its monthly
performance reviews as explained above and the risk factors described below in Section 11 “Risk Factors,” to maintain this
level of distributions.
As at December 31, 2010, the Corporation had consolidated net working capital of $62.8 million. Cash balances were
$31.6 million and accounts receivable were $40.8 million. Accounts payable and accrued liabilities totaled $18.7 million.
Total assets at December 31, 2010 were $391.7 million and total long-term liabilities were $243.8 million. Cash distributions
declared in the period from January 1, 2010 to December 31, 2010 totaled Cdn$1.10 per IPS unit.
The Corporation’s subordinated notes payable are denominated in Canadian dollars and are reflected in the financial
statements in U.S. dollars at the rate of exchange in effect at the balance sheet dates. These subordinated notes will
mature on March 29, 2014, subject to the Corporation’s right to extend their maturity for two additional successive five-
year terms provided certain conditions are satisfied at such times.
The Corporation’s convertible secured debentures are denominated in Canadian dollars and are reflected in the financial
statements in U.S. dollars at the rate of exchange in effect at the balance sheet dates. These convertible secured
debentures will mature on April 30, 2013. If the holders of the convertible secured debentures do not exercise their right to
convert their holdings into the Corporation’s IPS units prior to the maturity date, the principal amount is due and payable
in full on maturity.

Medical Facilities Corporation
28
The mandatory repayments under the credit facilities, notes payable and other contractual obligations and commitments
including expected interest payments, on a non-discounted basis, as of December 31, 2010, are as follows:
Table 9: Mandatory repayments under credit facilities, notes payable and other contractual obligations and commitments
Future payments (including principal and interest)
Contractual Obligations
Carrying values at Dec. 31, 2010
($’000s) Total
($’000s)
Less than1 year
($’000s) 1-3 years ($’000s)
4-5 years($’000s)
Thereafter($’000s)
Accounts payable 6,877 6,877 6,877 - - -
Accrued liabilities 11,819 11,819 11,819 - - -
Accrued interest payable 2,262 2,262 2,262 - - -
Dividends payable 849 849 849 - - -
Revolving credit facilities 12,808 12,808 6,583 6,225 - -
Notes payable and term loans 36,084 42,857 4,194 12,532 22,765 3,366
Capital lease obligation 1,476 1,527 687 840 - -
Operating leases and other commitments (not recorded in the financial statements) - 15,704 4,375 6,705 3,183 1,441
Convertible secured debentures (carrying amounts are net of finance costs)(1) 42,006 50,778 3,241 47,537 - -
IPS subordinated notes payable (carrying amounts are net of finance costs)(1) 161,034 236,216 20,997 41,994 173,225 -
Total contractual obligations 275,215 381,697 61,884 115,833 199,173 4,807
Note 1: Finance costs are amortized using the effective interest method and the current amortization expense is included in the interest
expense for the respective periods.
The Corporation maintains a three-year revolving line of credit of Cdn$35.0 million with National Bank Financial.
The Corporation anticipates renewing, extending or replacing its revolving credit facilities which fall due during 2011 and
expects, subject to the risk factors described below in Section 11 “Risk Factors,” that cash flows from operations and
working capital will be adequate to meet future payments on other contractual obligations over the next twelve months.
The Centers derive revenues, incur expenses and make distributions to their owners, including the Corporation, in U.S.
dollars. The Corporation makes distributions to IPS unitholders and incurs a portion of its expenses in Canadian dollars.
The amounts of distributions from the Centers to their owners, including the Corporation and minority interests, are
dependent on the results of the operations and cash flow generated by the Centers in any particular period.
The strengthening of the Canadian dollar against the U.S. dollar negatively impacts currency translation differences with
respect to the Corporation’s Canadian dollar denominated distributions, convertible secured debentures and subordinated
notes payable. A weakening Canadian currency in relation to U.S. currency has the opposite effect.
Since the Corporation’s formation in March 2004, the value of the Canadian dollar has fluctuated from Cdn$1.31 = US$1.00
on March 29, 2004 to Cdn$1.08 = US$1.00 on February 28, 2011, reaching a high of Cdn$0.93 = US$1.00 and a low of
Cdn$1.40 = US$1.00 between these dates.
Annual Report 2010
29
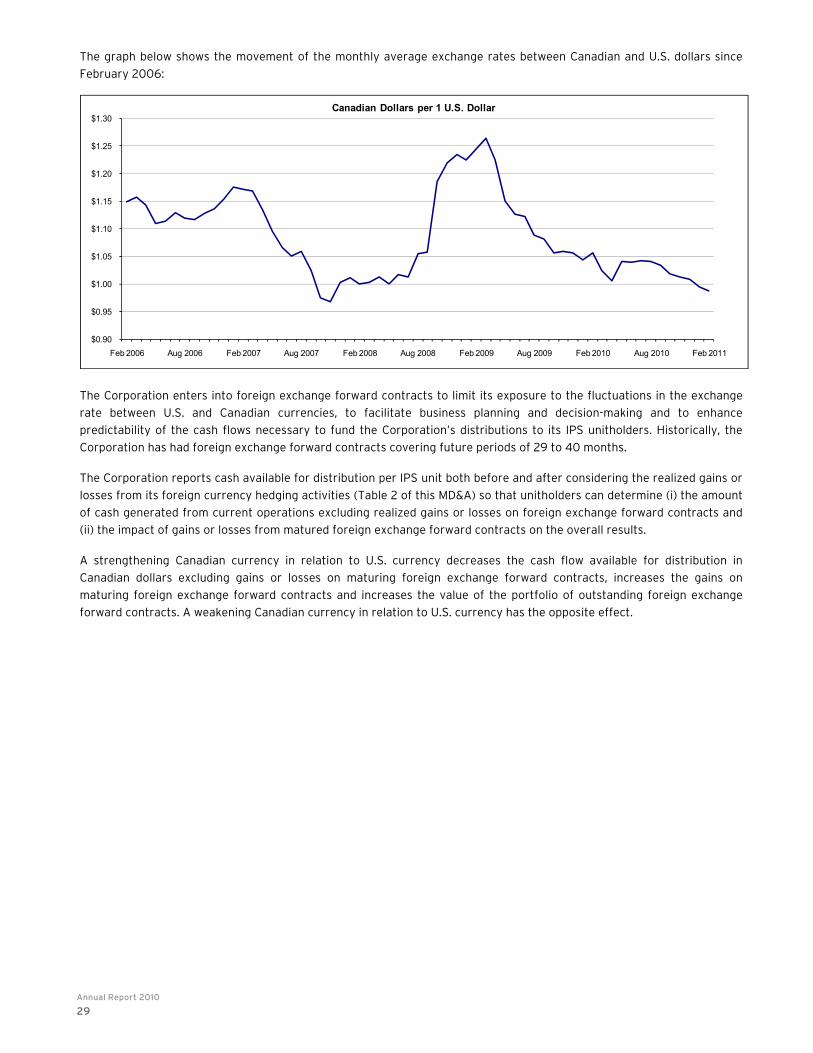
The graph below shows the movement of the monthly average exchange rates between Canadian and U.S. dollars since
February 2006:
$0.90
$0.95
$1.00
$1.05
$1.10
$1.15
$1.20
$1.25
$1.30
Feb 2006 Aug 2006 Feb 2007 Aug 2007 Feb 2008 Aug 2008 Feb 2009 Aug 2009 Feb 2010 Aug 2010 Feb 2011
Canadian Dollars per 1 U.S. Dollar
The Corporation enters into foreign exchange forward contracts to limit its exposure to the fluctuations in the exchange
rate between U.S. and Canadian currencies, to facilitate business planning and decision-making and to enhance
predictability of the cash flows necessary to fund the Corporation’s distributions to its IPS unitholders. Historically, the
Corporation has had foreign exchange forward contracts covering future periods of 29 to 40 months.
The Corporation reports cash available for distribution per IPS unit both before and after considering the realized gains or
losses from its foreign currency hedging activities (Table 2 of this MD&A) so that unitholders can determine (i) the amount
of cash generated from current operations excluding realized gains or losses on foreign exchange forward contracts and
(ii) the impact of gains or losses from matured foreign exchange forward contracts on the overall results.
A strengthening Canadian currency in relation to U.S. currency decreases the cash flow available for distribution in
Canadian dollars excluding gains or losses on maturing foreign exchange forward contracts, increases the gains on
maturing foreign exchange forward contracts and increases the value of the portfolio of outstanding foreign exchange
forward contracts. A weakening Canadian currency in relation to U.S. currency has the opposite effect.

Medical Facilities Corporation
30
Table 10 below shows the relationship between (i) total cash available for distribution excluding gains or losses on matured
foreign exchange forward contracts for the twelve months ended December 31, 2010 (assuming, for illustrative purposes,
achievement of a consistent result for the periods covered by the portfolio of foreign exchange forward contracts in place
as of December 31, 2010 as illustrated in Table 12 below), (ii) total amount of U.S. dollars to deliver and Canadian dollars to
receive for the foreign exchange forward contracts that will mature in the same periods, and (iii) total pro-forma
distributions on the IPS units for the same periods.
Table 10: Summary of cash available for distribution, foreign exchange forward contracts and pro-forma distributions
Total Cash Available for Distribution Excluding Realized
Gains or Losses on Foreign Exchange Forward Contracts and
Interest Expense on Convertible Secured Debentures(1)
US$
US$ to be Delivered under Foreign
Exchange Forward Contracts in Place
US$
Cdn$ to be Received under Foreign
Exchange Forward Contracts in Place
Cdn$
TotalPro-forma
Distribution(2)
Cdn$
Jan 2011 – Dec 2011 39,027 35,074 35,452 34,813
Jan 2012 – Dec 2012 39,027 31,150 34,619 34,813
Jan 2013 – Oct 2013(3) 32,522 29,000 30,160 29,011
Note 1: Assumes the actual amounts generated for the twelve months ended December 31, 2010 (without taking into consideration the
interest expense on the convertible secured debentures that are deemed to be converted for the purposes of this table) will be generated
in each of these years.
Note 2: Based on the actual number of outstanding IPS units as of December 31, 2010 and the assumed number of IPS units issued upon
conversion of the convertible secured debentures and assuming the current level of distributions (Cdn$1.10 annually) is continued for
these years.
Note 3: As of December 31, 2010, the Corporation had a portfolio of monthly foreign exchange forward contracts through October 2013
and, therefore, only ten months of data is presented for the period from January 2013 to October 2013.
The current level of performance would generate sufficient U.S. dollars to satisfy the obligations under the foreign
exchange forward contracts for the periods covered by the portfolio of foreign exchange forward contracts in place as of
December 31, 2010. The Canadian dollar amounts to be received upon maturity of these contracts and accumulated cash
on hand will provide the Corporation sufficient Canadian dollars to satisfy the anticipated distributions assuming a
consistent level of distribution (Cdn$1.10 per IPS unit) and the number of IPS units described in Note 2 to Table 10 above.
There is no assurance that the current level of performance will continue, and the Corporation’s performance is subject to
the risk factors described in Section 11 “Risk Factors” of this MD&A.
6. MARKET ACTIVITIES OF THE CORPORATION’S SECURITIES
As at December 31, 2010, the Corporation had 28,306,749 IPS units outstanding not including those IPS units that
separated in December 2010. Accordingly, in addition to the 28,306,749 IPS units, the Corporation had 10,000 common
shares and $59,000 aggregate principal amount of subordinated notes outstanding as at December 31, 2010.
IPS Normal Course Issuer Bids
On April 23, 2009, the Corporation received regulatory approval for a normal course issuer bid to purchase up
to 1,420,049 of its IPS units during the period from April 25, 2009 to April 24, 2010.
On April 22, 2010, the Corporation received regulatory approval for a normal course issuer bid to purchase up to 1,417,975
of its IPS units during the period from April 26, 2010 to April 25, 2011.

Annual Report 2010
31
Table 11: Summary of IPS units purchased during the year ended December 31, 2010
2010
Total Number of IPS Units Purchased
Total Amount Paidin Cdn$
($‘000s)
Total Amount Paid in US$
($‘000s)
IPS Units Outstanding at the End of the Period
Q1 - - - 28,359,506
Q2 22,900 224 217 28,401,049(1)
Q3 68,200 604 584 28,332,849
Q4 16,100 162 159 28,316,749
Total 107,200 990 960
Note 1: The increase in IPS units outstanding at June 30, 2010 is due to the issuance of 64,443 IPS units as a result of minority owners of
OSH exchanging 0.75% of the ownership of OSH for IPS units of the Corporation. Refer to Section 1 “Corporate Overview” of this MD&A.
Cancellation of IPS units purchased in 2010 will reduce the annual distributions paid by the Corporation by Cdn$117,920 (at
a current rate of Cdn$1.10 per IPS unit).
Convertible Secured Debentures Normal Course Issuer Bid
In November 2010, the Corporation received regulatory approval for a normal course issuer bid under which the
Corporation may purchase up to Cdn$3.4 million aggregate principal amount of its outstanding 7.50% convertible secured
debentures during the period from November 24, 2010 to November 23, 2011. In 2010, the Corporation purchased
Cdn$18,000 aggregate principal amount of its outstanding 7.50% convertible secured debentures for a total consideration
of Cdn$19,255 (US$19,130).
Dividend Reinvestment and Unit Purchase Plan (“DRIP”)
The Corporation has implemented a DRIP which allows unitholders resident in Canada to automatically re-invest in a cost-
effective manner the monthly cash distributions on their IPS units into additional IPS units of the Corporation.
7. FINANCIAL INSTRUMENTS
Foreign Exchange Forward Contracts
The Corporation enters into foreign exchange forward contracts to manage its exposure to fluctuations in the exchange
rate between U.S. and Canadian currencies, which exposure arises from payment of interest and dividends on its IPS units
and payment of certain corporate expenses in Canadian dollars.
As of December 31, 2010, the Corporation is committed to deliver between US$2.1 million and US$3.1 million monthly
through October 2013 in exchange for Canadian dollars at stipulated exchange rates as follows:
Table 12: Foreign exchange forward contracts summary
Contract Dates US$ to be Delivered (thousands)
Cdn$ to be Received (thousands)
Cdn$ per US$ (weighted average)
Jan 2011 – Dec 2011 35,074 35,452 1.0108
Jan 2012 – Dec 2012 31,150 34,619 1.1114
Jan 2013 – Oct 2013 29,000 30,160 1.0400
95,224 100,231
The fair value of the outstanding contracts as at December 31, 2010 was a net asset of $3.6 million (December 31, 2009: a
net asset of $1.1 million) as reflected in the consolidated financial statements for the year ended December 31, 2010, while
the change in the fair value of these contracts since December 31, 2009 is recorded as part of the loss on foreign currency
(see note 19 to the Corporation’s consolidated financial statements for the year ended December 31, 2010). It is the
Corporation’s intention to maintain these contracts in place until their scheduled maturity dates.
The Corporation has provided collateral in the amount of $4.5 million to secure its performance under these contracts.

Medical Facilities Corporation
32
8. RELATED PARTY TRANSACTIONS
Physicians, who constitute the minority interests in each of their respective Centers, routinely provide independent
professional services directly to patients utilizing the facilities of the Centers. Note 17 to the audited consolidated financial
statements of the Corporation for the year ended December 31, 2010 contains details of transactions with related parties.
9. CRITICAL ACCOUNTING ESTIMATES
The preparation of the financial statements requires management to make estimates and assumptions that affect the
reported amounts of assets and liabilities, the disclosure of contingent assets and liabilities at the date of the financial
statements and the reported amounts of revenue and expenses during the period. Actual results could differ from those
estimates.
Management estimates are required with respect to the (i) facility service revenue and accounts receivable, (ii) supply
inventory, (iii) valuation of financial instruments, (iv) acquired assets and liabilities, (v) impairment of goodwill and other
intangibles, (vi) provisions for potential liabilities, and (vii) income tax provisions.
Facility service revenue of the Corporation includes amounts for services billed to federal and state agencies, private
insurance carriers, employers, managed care programs and patients. Facility service revenue is recorded net of the
estimated contractual adjustments provided for under the various agreements with the majority of these third-party
payors. Management determines the estimates of contractual allowances and allowances for doubtful accounts based on
third-party contracts in effect, historical payment data, current economic conditions and other factors pertinent to each
Center.
10. MANAGEMENT’S RESPONSIBILITY FOR FINANCIAL REPORTING AND DISCLOSURE CONTROLS
Management Responsibility
Management is responsible for the financial information published by the Corporation. In accordance with National
Instrument 52-109, the Chief Executive Officer (“CEO”) and the Chief Financial Officer (“CFO”) have certified that annual
filings fairly present the financial condition, results of operations and cash flows and have also certified regarding controls
as described below. By their nature, controls, no matter how well conceived or operated, provide reasonable assurance,
but not absolute assurance, that the objectives of the control systems will be met.
Internal Controls over Financial Reporting (“ICOFR”)
Under the supervision of, and with the participation of the CEO and the CFO, management performed an evaluation of the
design and effectiveness of the ICOFR in order to provide reasonable assurance regarding the reliability of financial
reporting and the preparation of financial statements for external purposes in accordance with Canadian GAAP. The CEO
and the CFO have concluded that the design and operation of the ICOFR as of December 31, 2010 were effective, except as
detailed below.
Due to the limited number of staff at the corporate office, finance personnel do not have all the technical knowledge to
address complex and non-routine accounting issues such as the identification of differences between U.S. and Canadian
GAAP (as Centers maintain their accounts under U.S. GAAP and the Corporation reports under Canadian GAAP), valuation
of complex financial instruments and requirements of new accounting pronouncements as they might apply to the
Corporation, and, in this respect, the Corporation utilizes resources of outside experts and advisors.
Management has evaluated whether there were any material changes to the Corporation’s ICOFR since December 31, 2009
and determined that there were no changes that have materially affected, or are reasonably expected to materially affect,
its ICOFR.
Disclosure Controls
Under the supervision of, and with the participation of the CEO and the CFO, management performed an evaluation of the
design and effectiveness of the disclosure controls and procedures that provide reasonable assurance that material

Annual Report 2010
33
information relating to the Corporation (including its subsidiaries) is made known to the CEO and the CFO by others within
the Corporation. Based on that evaluation, the CEO and the CFO have concluded that the design and operation of these
disclosure controls and procedures as of December 31, 2010 were effective.
International Financial Reporting Standards (“IFRS”)
Effective January 1, 2011 (and for all reporting periods beginning on or after this date), all Canadian publicly accountable
enterprises, including the Corporation, are required to issue financial statements under IFRS. The conversion to IFRS will
impact the way the Corporation presents its financial results. Accordingly, the Corporation identified the differences
between Canadian GAAP and IFRS as applicable to the Corporation and the potential effects of IFRS on the Corporation’s
accounting and reporting processes, information systems, business processes and external disclosures. Based on this, the
Corporation prepared an IFRS implementation plan and established a timeline for conversion to IFRS.
The transition to IFRS requires that the IFRS standards to be applied are those in existence as of the first date of
reporting, beginning January 1, 2011. The comments herein are based on the standards as they exist at the end of the
fourth quarter of 2010. These standards could change before the actual transition to IFRS.
The Corporation’s Audit Committee receives updates on the progress, costs and major milestones of this conversion
project quarterly and at special IFRS meetings.
Accounting Policies
The Corporation has completed its detailed assessment of differences between Canadian GAAP and IFRS as applicable to
the Corporation, including accounting and disclosure differences upon transition to IFRS. The selection of accounting
policies under IFRS, as it currently exists, and transitional adjustments, as applicable, were presented to and approved by
the Corporation’s Audit Committee, subject to final review at the time when IFRS financial statements are initially
published.
The Corporation has determined that there will be no change under IFRS to several fundamental policies, including, in
particular: its reporting and functional currency, basis of consolidation, segment reporting and treatment of foreign
currency transactions.
Although changes will occur in the sequencing, grouping and description of specific items, only two items will have a
significantly different impact on the measurement and presentation of financial position and results of operations of the
Corporation as of the transition date and for subsequent reporting periods, namely: (i) the accounting for the minority
exchangeable interest liability and (ii) the presentation of minority interest.
The liability for the minority exchangeable interest, which is considered a financial liability, is recorded at fair market
value. The fair market value is remeasured at each reporting date under both accounting bases. While the measurement of
the liability is consistent under both Canadian GAAP and IFRS, the treatment of the changes in fair market value of the
liability from one reporting period to another is different in each system. Under Canadian GAAP the change in the value of
the liability is added to or deducted from the recorded value of goodwill on the balance sheet, whereas under IFRS the
amount of the change in the fair market value of the liability is reflected in the results of operations.
Minority interest, called non controlling interest under IFRS, is presented differently under Canadian GAAP and IFRS.
Under Canadian GAAP minority interest is presented as a liability on the balance sheet, while under IFRS it is presented as
a component of equity. The minority interest in the results of operations, presented under GAAP as a deduction in arriving
at net income, will, under IFRS, be presented after arriving at net income.
These two differences will impact the amount and volatility of net earnings and asset, liability and equity ratios. In addition,
IFRS has established standards which require accounting policy selections upon the initial application of IFRS. Those policy
selections applicable to the Corporation are explained below.

Medical Facilities Corporation
34
Upon conversion to IFRS, the Corporation intends to use the following voluntary exemptions available under IFRS 1 First-
time Adoption of International Financial Reporting Standards (“IFRS 1”). References to “Transition Date” below are to
January 1, 2010.
Business combinations – IFRS 3 Business Combinations (“IFRS 3”) may be applied prospectively or
retrospectively, which latter basis would require restatement of all business combinations that occurred prior to
the Transition Date. The Corporation intends to elect to prospectively apply IFRS 3 and accordingly, business
combinations that occurred prior to the Transition Date will not be restated. As a result, the fair market value
adjustments and the intangibles, including goodwill, arising on such business combinations before the Transition
Date will not be adjusted from the carrying values previously determined under Canadian GAAP.
Fair value as deemed cost – IFRS 1 provides a choice between measuring property, plant and equipment at fair
values or on a cost model basis. On the latter basis, IFRS permits the adoption of fair values at the Transition Date
and using those amounts as deemed cost or using the historical cost amounts under the prior GAAP. The
Corporation intends to continue to apply the cost model for property, plant and equipment and to use the
historical cost amounts under Canadian GAAP as deemed cost under IFRS at the Transition Date.
In addition to the voluntary exemptions under IFRS 1 that the Corporation intends to use, there is also a mandatory
exception that the Corporation will follow:
Estimates – Hindsight is not used to create or revise estimates. The estimates previously made under Canadian
GAAP cannot be revised for application of IFRS at the Transition Date, except where necessary to reflect any
difference in accounting policies.
Information Systems and Controls
Management of the Corporation has evaluated the impact of the conversion to IFRS on its accounting and information
systems and has updated them accordingly during 2010. Management believes that existing resources and internal
controls and disclosure controls and processes will not require further significant modifications as a result of the
conversion to and continuance under IFRS.
Business Processes and Activities
Management of the Corporation has assessed the impact of adopting IFRS on the main performance measures, debt
covenants and other contractual arrangements and has not identified any material issues. Also, management has
determined that the adoption of IFRS will have no significant impact on the Corporation’s internal planning process and
compensation arrangements.
The Corporation has communicated the changes required under IFRS to the relevant personnel both at the corporate and
subsidiary levels, including to those in subsidiary accounting functions, shared service functions and other functional
areas.
Financial Reporting Expertise
Beginning in 2008, the IFRS transition team, executives, Audit Committee and Board have been enhancing their financial
and accounting expertise as it relates to IFRS. Such training has and continues to include participation in Corporation-
specific seminars, presentations and webcasts hosted by regulators, accounting and legal firms, IFRS related courses
offered by CICA and the Institute of Chartered Accountants of Ontario and self-study of available materials. An additional
Corporation-specific seminar was held in August 2010.
Preliminary IFRS Restatements in 2010
In preparation for the implementation of IFRS on January 1, 2011, the Corporation has been preparing financial statements
throughout 2010 on an IFRS basis as well as under Canadian GAAP, the latter being the basis for financial reporting in
2010. The 2010 financial statements on an IFRS basis will be required as comparative information in the 2011 IFRS financial
statements.
Annual Report 2010
35
The Corporation has completed its analysis of the initial impact of the conversion to IFRS and has prepared an opening
statement of financial position under current IFRS as of January 1, 2010. The most significant difference in the IFRS
transition balance sheet relates to the presentation of minority interest, as discussed above under Accounting Policies.
Another less significant adjustment relates to the recording of a lease arrangement as of January 1, 2010.
In addition to the determination of IFRS net income before deducting minority interest, the most significant difference
between Canadian GAAP and IFRS in determining net income is the treatment of the changes in the fair market value of
the minority exchangeable interest liability from one reporting period to another, as described above. The combined effect
of these two adjustments for the three and twelve months ended December 31, 2010 will result in (i) a decrease of
$5.9 million and $8.2 million in IFRS net income and (ii) a decrease of $0.210 and $0.290 in earnings per share attributable
to the shareholders of the Corporation, respectively.
External Communications
Management continues to assess the impact of the transition to IFRS on all of the Corporation’s communications to the
public. The IFRS transition team includes individuals involved in the process of external communications. IFRS disclosure in
each period’s MD&A has been updated throughout the project as per CSA Staff Notice 52-320 Disclosure of Expected Changes in Accounting Policies Relating to Changeover to International Financial Reporting Standards.
Status Summary
The transition to IFRS will be implemented in reporting on the first quarter of 2011. Management believes the IFRS
implementation project is progressing as planned and that the completion of the implementation will occur without
significant negative impact on systems, resources and controls.
11. RISK FACTORS
Risks Related to the Business and the Industry of the Corporation
The revenue and profitability of the Corporation and its subsidiaries, including the Centers, depend heavily on payments
from third-party payors, including government healthcare programs (Medicare and Medicaid) and managed care
organizations, which are subject to frequent cost containment initiatives. Changes in the terms and conditions of, or
reimbursement levels under, insurance or healthcare programs, which are typically short-term agreements, could
adversely affect the revenue and profitability of the Corporation. The Corporation’s revenue and profitability could be
impacted by its ability to obtain and maintain contractual arrangements with insurers and payors active in its service area
and by changes in the terms of such contractual arrangements.
The revenue and profitability of the Centers is dependent upon physician relationships. There can be no assurance that
physician groups performing procedures at the Centers will maintain successful medical practices, or that one or more key
members of a particular physician group will continue practicing with that group or that the members of that group will
continue to perform procedures at the Centers at current levels or at all.
Healthcare facilities, such as the Centers, are subject to numerous legal, regulatory, professional and private licensing,
certification and accreditation requirements. Receipt and renewal of such licenses, certifications and accreditations are
often based on inspections, surveys, audits, investigations or other reviews, some of which may require affirmative
compliance actions by the Centers that could be burdensome and expensive.
There are a number of U.S. federal and state regulatory initiatives, which apply to healthcare providers, and in particular
SSHs, including the Centers. Among the most significant are the federal Anti-Kickback Statute, the federal Stark Act, and
the federal rules relating to management and protection of patient records and patient confidentiality.

Medical Facilities Corporation
36
On March 23, 2010, the Patient Protection and Affordable Care Act (“PPACA”) was signed into law providing for significant
changes to healthcare delivery and regulation in the United States. This new law, and modifying language in a
subsequently passed Reconciliation Bill, contains provisions that prohibit, after a certain date, the formation or
development of any new physician owned hospitals in the United States. The new law, however, has grandfathering
provisions that permit existing physician owned hospitals, such as the Centers, to continue their operations and billings to
government payors like Medicare and Medicaid for hospital services, provided they meet certain investment and patient
transparency requirements.
The new law, among other things:
(a) Prohibits the existing or grandfathered hospitals from expanding the number of overnight beds, operating rooms
or procedure rooms from the number of rooms that the existing hospital had as of the date of enactment of the
legislation, unless certain narrowly-drawn growth criteria are present;
(b) Prohibits increases in the percentage total value of physician ownership or investment in physician owned
hospitals, or entities whose investments include the hospitals, from the percentage of aggregate physician
ownership as of the date of enactment;
(c) Imposes restrictions on the manner of physician investment in physician owned hospitals; and
(d) Requires disclosure to patients of physician ownership and whether the hospital has physicians present at the
hospital twenty four hours a day, seven days a week and signed acknowledgement by the patients that they
understand that fact.
While the Centers carry general and professional liability insurance against claims arising in the ordinary course of
business, the insurance market is dynamic and there can be no assurance that adequate coverage will be available in the
future or that any coverage in place will be adequate to cover claims.
Any expansion of the Centers will require additional capital, which may be funded through additional debt or equity
financings. These funding sources could result in significant additional interest expense or ownership dilution to current
holders of the Corporation’s securities.
There is significant competition in the healthcare business. The Centers compete with other healthcare facilities in
providing services to physicians and patients, contracting with managed care payors and recruiting qualified staff.
The Centers may be vulnerable to economic downturns and may be limited in their ability to withstand such financial
pressures. Increased unemployment or other adverse economic conditions may impact the volume of services performed,
cause shifts to payors with lower reimbursements (e.g., Medicare) and/or result in higher uncollectible accounts.
Maintenance capital expenditures, which are deducted in the calculation of cash available for distribution (see Section 2
“Non-GAAP Measure – Standardized Distributable Cash and Cash Available for Distribution” above), represent
expenditures that are required to maintain the productive capacity of the Centers. Historically, such expenditures have
represented on average 1.5% of the facility service revenue of the Centers. Management believes that such level of
maintenance capital expenditures will continue in the future and, accordingly, will not adversely impact the cash available
for distribution generated by the Corporation.
Risks Related to the Structure of the Corporation
The Corporation is entirely dependent on the operations and assets of the Centers through the indirect ownership of
between 51.0% and 64.6% of these Centers. Future distributions by the Corporation are not guaranteed and are totally
dependent upon the operating results and related cash flows from the Centers.
The payout by the Centers and the Corporation of a substantial majority of their operating cash flows will make additional
capital and operating expenditures dependent on increased cash flows or additional financing in the future.
The Corporation’s distributions to its security holders are denominated in Canadian dollars, whereas all of its revenue is
denominated in U.S. dollars. To the extent that future distributions are not covered by foreign exchange forward contracts,
the Corporation is exposed to currency exchange risk.
Annual Report 2010
37
Interest on the Corporation’s subordinated notes will be deducted for purposes of calculating taxes payable in the United
States by the Corporation. There can be no assurance that U.S. tax authorities will not seek to challenge the treatment of
these notes as debt or the amount of interest expense deducted. This would reduce the Corporation’s after-tax income
available for distribution, thereby reducing the Corporation’s ability to declare dividends.
There can be no assurance that the Corporation will be able to repay the principal amounts outstanding on its
subordinated notes and convertible secured debentures when due. Additionally, the subordinated notes and convertible
secured debentures are payable in Canadian dollars. Therefore, the Corporation is exposed (at maturity and/or
repayment) to currency exchange risk with respect to the principal amounts of these instruments.
The limited cash flow guarantees provided by certain of the Centers with respect to the interest payments on the
subordinated notes may not be enforceable, thereby reducing the cash available for payment of interest on the
subordinated notes. Non-competition agreements executed by physician owners of the minority interests in the Centers
may not be enforceable, which lack of enforceability could impact the revenue and profitability of the Centers.
The Corporation does not have the ability to direct day-to-day governance or management inputs in respect of the
Centers, except in certain limited circumstances.
The degree to which the Corporation is leveraged on a consolidated basis could have important consequences to the
holders of IPS units, including:
(a) The Corporation and Centers’ ability in the future to obtain additional financing for working capital, capital
expenditures, acquisitions or other purposes may be limited. Under the terms attached to the Corporation’s
subordinated notes and convertible secured debentures, the Corporation’s ability to incur additional debt,
including the issuance of IPS units, which contain a debt component, is dependent upon the Corporation meeting
certain pro forma financial ratios at the time of incurring additional debt.
(b) The Corporation or Centers being unable to refinance indebtedness on terms acceptable to the Corporation or at
all.
(c) A significant portion of the Corporation’s cash flow (on a consolidated basis) from operations is likely to be
dedicated to the payment of the principal of and interest on its indebtedness, thereby reducing funds available for
future operations, capital expenditures, acquisitions and/or dividends on its common shares.
The Corporation has credit facilities that contain restrictive covenants which limit the discretion of the Corporation or its
management with respect to certain matters. Furthermore, the Centers have credit facilities that contain restrictive
covenants which may limit the Centers’ abilities to make distributions.
Additional IPS units, common shares or securities convertible into IPS units or common shares may be issued by the
Corporation pursuant to exchange agreements with the holders of the minority interests in the Centers or in connection
with future financing or acquisitions by the Corporation. The issuance of additional IPS units, common shares or securities
convertible into IPS units or common shares may dilute an investor’s investment in the Corporation and reduce
distributable cash per common share or per IPS unit.
Medical Facilities Holdings (USA), LLC, the Corporation’s subsidiary which holds interests in the Centers, is organized
under the laws of the State of Delaware. The Centers that are located in South Dakota are formed under the laws of the
State of South Dakota. The Center that is located in Oklahoma is formed under the laws of the State of Oklahoma. The
Center located in California is formed under the laws of the State of Delaware. All of the assets of the Centers are located
outside of Canada and certain of the directors and officers are residents of the United States. As a result, it may be
difficult or impossible for investors to effect service within Canada upon the Corporation’s subsidiary, the Centers, or their
directors and officers who are not residents of Canada, or to realize against them in Canada upon judgments of courts of
Canada predicated upon the civil liability provisions of applicable Canadian provincial securities laws.
There can be no assurance that the common shares and subordinated notes represented by the IPS units will continue to
be qualified investments for trusts governed by registered retirement savings plans, registered retirement income funds,
deferred profit sharing plans, registered education savings plans, tax-free savings accounts and registered disability
savings plans.

Medical Facilities Corporation
38
The market price of the IPS units may be subject to general volatility.
The rules (Article IV(7)) contained in the Fifth Protocol to the Canada-U.S. Income Tax Convention which entered into force
on December 15, 2008 deny the Corporation the reduced rate of U.S. federal branch profits tax beginning January 1, 2010.
Management has assessed the effect of these rules and is not anticipating any significant impact on the Corporation’s
income taxes prior to 2012. For 2012 and beyond, management is evaluating potential alternatives to mitigate any
resulting increased income taxes. If the Corporation pays additional U.S. federal branch profits tax, then the cash available
for distribution will be reduced.
The foregoing information is a summary of risk factors and is qualified in its entirety by reference to, and must be read in
conjunction with, the detailed information appearing in the Corporation’s most recently filed Annual Information Form
available on SEDAR at www.sedar.com or on the Corporation’s website at www.medicalfacilitiescorp.ca.
12. OUTLOOK
Please refer to the cautionary language concerning forward-looking disclosures on the cover page of this MD&A.
The outlook for the Corporation is influenced by many inter-related factors including healthcare reform, the economy in
general and the management strategies of the Corporation.
Healthcare Reform
As discussed under Risk Factors, the PPACA effects the first major overhaul of the U.S. healthcare system in forty years
and includes many provisions that will affect the Corporation. The status of the PPACA continues to be uncertain given
various judicial and legislative challenges facing it. Accordingly, it is impossible to predict the impact, if any, that
healthcare reform legislation will have on the Corporation’s operations. However, as currently enacted, the legislation
provides for near universal healthcare coverage for all legal citizens and residents of the United States. This initiative will
add to the already increasing demand for healthcare services in the United States which results from the increasing
average age and life expectancy, overall population growth and advances in science and technology.
The Economy
Although the outlook for the economy is uncertain, ninety-five percent of the Corporation’s revenues are generated in
South Dakota and Oklahoma, the states that continue to have unemployment and residential foreclosure rates far below
the national average thereby mitigating the impact of the current downturn on the Corporation. While the recession has
impacted the performance of Newport Coast, situated in Southern California, management is confident in the long-term
outlook for Newport Coast and the ASC market in general.
The Corporation continues to benefit from increased case loads, more favorable case mix and ancillary services such as
imaging and pain management made possible by the expansions undertaken at its specialty surgical hospitals over the last
two years. Similar to many providers, the Corporation’s SSHs have seen the percentage of services paid for by
governmental plans such as Medicare and Medicaid increase above historical norms and, by inference, a decrease in the
proportion of services covered by private insurance. While management expects this increased level of activity with the
lower paying governmental payors to continue in the short term, management believes that this trend will reverse when
the economy recovers.
Management Strategies
Management continues to believe that a continued focus on providing high quality healthcare services, enhancing the
experience of patients and offering expanded and new services will enable the Corporation to benefit from the increasing
demand for healthcare services and respond to any challenges arising from healthcare reform.
Increasing utilization of the capacity created by the recent expansions combined with an increase in the percentage of
services covered by private insurance will further contribute to increased revenues and operating margins.
The Centers owned by the Corporation continue to pursue the recruitment of additional physicians and cost containment
initiatives to enhance the operating efficiencies.

Annual Report 2010
39
In the longer term, management expects that there will be an increase in the number of physicians holding both (i) medical
staff privileges at, and (ii) ownership interests in, its SSHs and ASC. Combined with growth in the areas serviced by the
Corporation’s facilities, management expects the consolidated facility service revenue of the Corporation will grow as case
volumes increase and case mix continues to shift to utilize the expanded facilities at the SSHs and unused capacity at its
ASC.
At the same time, the Corporation intends to pursue accretive acquisitions and continue the cash distribution practices
referred to in Section 5 “Liquidity, Capital Resources and Financial Condition” of this MD&A.
Summary
Management is confident that, subject to the impact of the factors discussed in this MD&A, the Corporation’s operations
will produce cash available for distribution more than adequate to continue the current level of annual distribution of
Cdn$1.10 per IPS unit and meet its obligations under the Corporation’s hedging program.
13. SUPPLEMENTARY INFORMATION
The following tables present supplementary financial information.
Table 13.1: Supplementary financial information for the three months ended December 31, 2010 compared to the three months ended December 31, 2009
Three Months Ended
December 31, 2010 (unaudited)
Three Months Ended
December 31, 2009 (unaudited) % Change
($’000s)
% of facility service
revenue ($’000s)
% of facility service
revenue
Facility service revenue: Black Hills Surgical Hospital, LLP 19,285 14,822 30.1%
Sioux Falls Surgical Hospital, LLP 18,613 18,632 (0.1%)
Dakota Plains Surgical Center, LLP 3,883 3,357 15.7%
Oklahoma Spine Hospital, LLC 19,404 17,464 11.1%
The Surgery Center of Newport Coast, LLC 3,171 3,001 5.7%
Barranca Surgery Center, LLC - 772 N/A
Income before interest expense, depreciation and amortization, and other expenses (income): Black Hills Surgical Hospital, LLP 8,782 45.5% 6,307 42.6% 39.2%
Sioux Falls Surgical Hospital, LLP 9,380 50.4% 8,414 45.2% 11.5%
Dakota Plains Surgical Center, LLP 1,726 44.5% 1,266 37.7% 36.3%
Oklahoma Spine Hospital, LLC 6,743 34.8% 5,508 31.5% 22.4%
The Surgery Center of Newport Coast, LLC 1,788 56.4% 1,687 56.2% 6.0%
Barranca Surgery Center, LLC - - 242 31.3 N/A
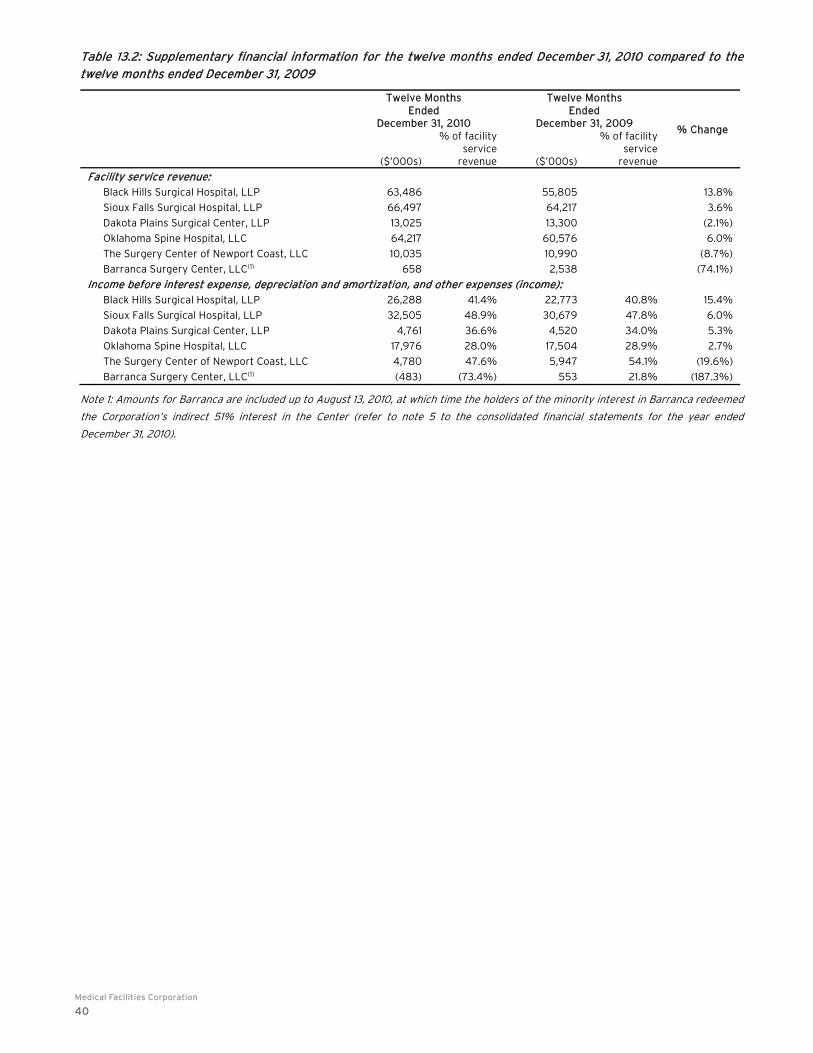
Medical Facilities Corporation
40
Table 13.2: Supplementary financial information for the twelve months ended December 31, 2010 compared to the twelve months ended December 31, 2009
Twelve Months Ended
December 31, 2010
Twelve Months Ended
December 31, 2009 % Change
($’000s)
% of facility service
revenue ($’000s)
% of facility service
revenue
Facility service revenue: Black Hills Surgical Hospital, LLP 63,486 55,805 13.8%
Sioux Falls Surgical Hospital, LLP 66,497 64,217 3.6%
Dakota Plains Surgical Center, LLP 13,025 13,300 (2.1%)
Oklahoma Spine Hospital, LLC 64,217 60,576 6.0%
The Surgery Center of Newport Coast, LLC 10,035 10,990 (8.7%)
Barranca Surgery Center, LLC(1) 658 2,538 (74.1%)
Income before interest expense, depreciation and amortization, and other expenses (income): Black Hills Surgical Hospital, LLP 26,288 41.4% 22,773 40.8% 15.4%
Sioux Falls Surgical Hospital, LLP 32,505 48.9% 30,679 47.8% 6.0%
Dakota Plains Surgical Center, LLP 4,761 36.6% 4,520 34.0% 5.3%
Oklahoma Spine Hospital, LLC 17,976 28.0% 17,504 28.9% 2.7%
The Surgery Center of Newport Coast, LLC 4,780 47.6% 5,947 54.1% (19.6%)
Barranca Surgery Center, LLC(1) (483) (73.4%) 553 21.8% (187.3%)
Note 1: Amounts for Barranca are included up to August 13, 2010, at which time the holders of the minority interest in Barranca redeemed
the Corporation’s indirect 51% interest in the Center (refer to note 5 to the consolidated financial statements for the year ended
December 31, 2010).

Annual Report 2010
41
Management's Responsibility for Financial Reporting
The accompanying consolidated financial statements of Medical Facilities Corporation (the “Corporation”) and all the
information in this annual report are the responsibility of the management of the Corporation. The consolidated financial
statements have been prepared in accordance with Canadian generally accepted accounting principles and where
appropriate include management’s best estimates and judgments. Management has reviewed the financial information
presented throughout this report and has ensured it is consistent with the consolidated financial statements.
Management maintains a system of internal controls designed to provide reasonable assurance that assets are
safeguarded from loss or unauthorized use, and that financial information is timely and reliable. In addition, management
has reviewed the Corporation’s disclosure controls and procedures, which are designed to ensure the quality and
timeliness of the disclosures made to the public. A summary of the results of that review is included in the Management’s
Discussion and Analysis of Consolidated Financial Condition and Results of Operations for the three-month and twelve-
month periods ended December 31, 2010.
The Board of Directors of the Corporation are responsible for ensuring that management fulfills its responsibilities for
financial reporting and are ultimately responsible for reviewing and approving the consolidated financial statements. The
Board of Directors carries out this responsibility principally through the Audit Committee. The Board of Directors of the
Corporation appoints the Audit Committee and all of the members of the Audit Committee are independent members of
the Board of Directors. The Audit Committee meets periodically with management and the Corporation’s auditors to
review internal controls, audit results and accounting principles. Acting on the recommendation of the Audit Committee,
the consolidated financial statements are forwarded to the Board of Directors of the Corporation for their approval.
KPMG LLP, an independent firm of Chartered Accountants, has been appointed by the shareholders to express an
independent professional opinion on the fairness of the consolidated financial statements.
KPMG LLP has full and free access to the Audit Committee and management to discuss matters arising from their audit,
which includes a review of accounting records and internal controls.
Donald A. Schellpfeffer, MD Michael Salter, CA, CPA Chief Executive Officer Chief Financial Officer
Toronto, Canada March 17, 2011

Medical Facilities Corporation
42
KPMG LLP Telephone (416) 777-8500 Chartered Accountants Fax (416) 777-8818 Bay Adelaide Centre Internet www.kpmg.ca 333 Bay Street Suite 4600 Toronto ON M5H 2S5 Canada
KPMG LLP is a Canadian limited liability partnership and a member firm of the KPMG network of independent member firms affiliated with KPMG International, a Swiss cooperative. KPMG Canada provides services to KPMG LLP.
Independent Auditors’ Report
Audit report to the shareholders We have audited the accompanying consolidated financial statements of Medical Facilities Corporation, which comprise
the consolidated balance sheets as at December 31, 2010 and December 31, 2009, the consolidated statements of
operations, retained earnings and cash flows for the years then ended, and notes, comprising a summary of significant
accounting policies and other explanatory information.
Management’s Responsibility for the Consolidated Financial Statements Management is responsible for the preparation and fair presentation of these consolidated financial statements in
accordance with Canadian generally accepted accounting principles, and for such internal control as management
determines is necessary to enable the preparation of consolidated financial statements that are free from material
misstatement, whether due to fraud or error. Auditors’ Responsibility Our responsibility is to express an opinion on these consolidated financial statements based on our audits. We conducted
our audits in accordance with Canadian generally accepted auditing standards. Those standards require that we comply
with ethical requirements and plan and perform the audit to obtain reasonable assurance about whether the consolidated
financial statements are free from material misstatement. An audit involves performing procedures to obtain audit evidence about the amounts and disclosures in the consolidated
financial statements. The procedures selected depend on our judgment, including the assessment of the risks of material
misstatement of the consolidated financial statements, whether due to fraud or error. In making those risk assessments,
we consider internal control relevant to the entity’s preparation and fair presentation of the consolidated financial
statements in order to design audit procedures that are appropriate in the circumstances, but not for the purpose of
expressing an opinion on the effectiveness of the entity’s internal control. An audit also includes evaluating the
appropriateness of accounting policies used and the reasonableness of accounting estimates made by management, as
well as evaluating the overall presentation of the consolidated financial statements.

Annual Report 2010
43
KPMG LLP Telephone (416) 777-8500 Chartered Accountants Fax (416) 777-8818 Bay Adelaide Centre Internet www.kpmg.ca 333 Bay Street Suite 4600 Toronto ON M5H 2S5 Canada
KPMG LLP is a Canadian limited liability partnership and a member firm of the KPMG network of independent member firms affiliated with KPMG International, a Swiss cooperative. KPMG Canada provides services to KPMG LLP.
We believe that the audit evidence we have obtained in our audits is sufficient and appropriate to provide a basis for our
audit opinion. Opinion In our opinion, the consolidated financial statements present fairly, in all material respects, the consolidated financial
position of Medical Facilities Corporation as at December 31, 2010 and December 31, 2009, and its consolidated results of
operations and its consolidated cash flows for the years then ended in accordance with Canadian generally accepted
accounting principles.
March 17, 2011 Toronto, Canada

Medical Facilities Corporation
44
Consolidated Balance Sheets (In thousands of U.S. dollars)
December 31,
Note 2010
$ 2009
$ ASSETS Current assets Cash and cash equivalents 31,593 28,963 Accounts receivable 13.4.2 40,818 36,586 Supply inventory 3,807 3,838 Prepaid expenses and other 2,955 2,796 Income tax receivable 16 15,116 8,791 Total current assets 94,289 80,974 Non-current assets Property and equipment 6 58,621 57,039 Restricted cash 13.1 4,483 4,483 Foreign exchange forward contracts 13.1 3,835 1,205 Subordinated notes payable early redemption option 12.2 28,539 18,201 Future income tax assets 16 14,617 11,878 Investment in and loan receivable from an associate 7 404 - Goodwill 8.1 90,843 82,607 Other intangibles 8.2 96,084 109,321 Total non-current assets 297,426 284,734 TOTAL ASSETS 391,715 365,708
LIABILITIES AND SHAREHOLDERS' EQUITY Current liabilities Accrued interest payable 2,262 2,164 Dividends payable 849 812 Accounts payable 6,877 6,912 Accrued liabilities 11,819 9,958 Current portion of long-term debt 9 9,650 14,730 Total current liabilities 31,457 34,576 Non-current liabilities Long-term debt 9 40,718 29,114 Foreign exchange forward contracts 13.1 284 150 Future income tax liabilities 16 14,633 7,571 Convertible secured debentures 11 42,006 39,185 Subordinated notes payable 12.1 161,034 151,745 Minority exchangeable interest liability 13.2 59,010 50,913 Minority interest 15,957 15,231 Total non-current liabilities 333,642 293,909 Shareholders' equity Share capital 12.3 98,764 98,794 Deficit (72,148) (61,571) Total shareholders’ equity 26,616 37,223 Commitments and contingencies 18 TOTAL LIABILITIES AND SHAREHOLDERS’ EQUITY 391,715 365,708
The accompanying notes are an integral part of these consolidated financial statements. On behalf of the Board: Seymour Temkin Alan J. Dilworth
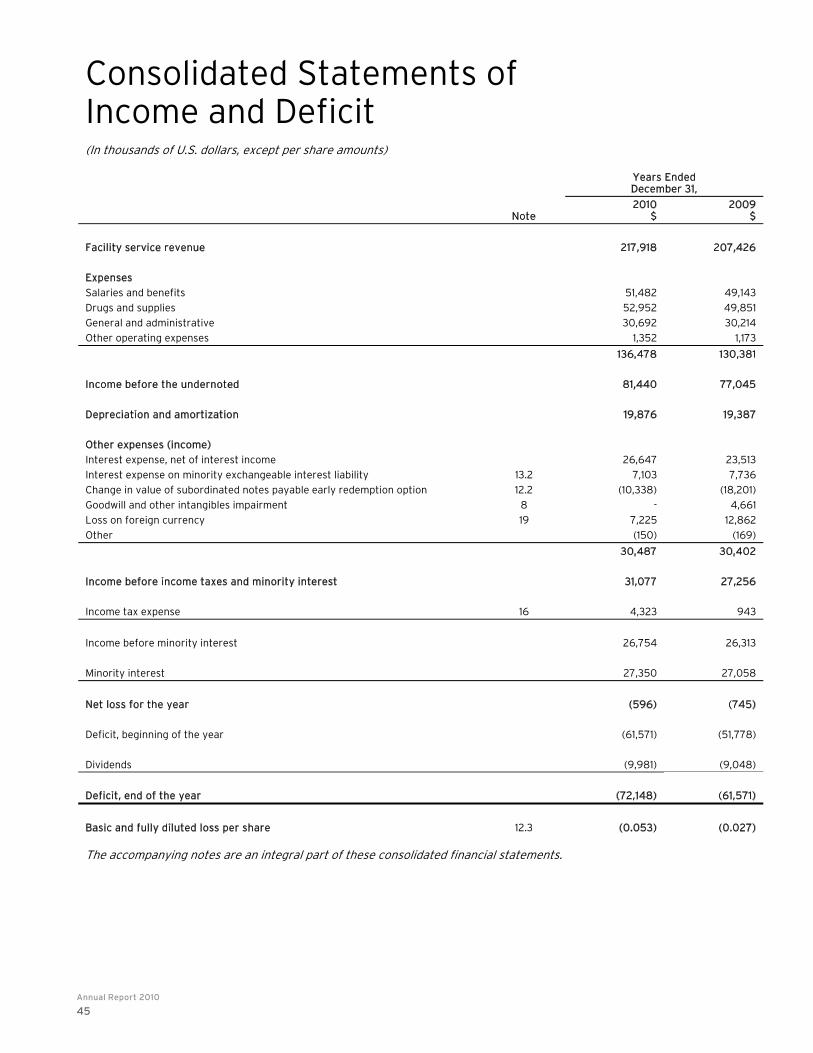
Annual Report 2010
45
Consolidated Statements of Income and Deficit (In thousands of U.S. dollars, except per share amounts)
Years Ended December 31,
Note
2010 $
2009$
Facility service revenue 217,918 207,426
Expenses
Salaries and benefits 51,482 49,143
Drugs and supplies 52,952 49,851
General and administrative 30,692 30,214
Other operating expenses 1,352 1,173
136,478 130,381
Income before the undernoted 81,440 77,045
Depreciation and amortization 19,876 19,387
Other expenses (income)
Interest expense, net of interest income 26,647 23,513
Interest expense on minority exchangeable interest liability 13.2 7,103 7,736
Change in value of subordinated notes payable early redemption option 12.2 (10,338) (18,201)
Goodwill and other intangibles impairment 8 - 4,661
Loss on foreign currency 19 7,225 12,862
Other (150) (169)
30,487 30,402
Income before income taxes and minority interest 31,077 27,256
Income tax expense 16 4,323 943
Income before minority interest 26,754 26,313
Minority interest 27,350 27,058
Net loss for the year (596) (745)
Deficit, beginning of the year (61,571) (51,778)
Dividends (9,981) (9,048)
Deficit, end of the year (72,148) (61,571)
Basic and fully diluted loss per share 12.3 (0.053) (0.027)
The accompanying notes are an integral part of these consolidated financial statements.

Medical Facilities Corporation
46
Consolidated Statements of Cash Flows (In thousands of U.S. dollars)
Years Ended December 31,
Note 2010
$ 2009
$
Cash provided by (used in)
Operating activities
Net loss for the year (596) (745)
Items not affecting cash:
Depreciation of property and equipment 6 6,639 5,411
Amortization of other intangibles 8.2 13,237 13,976
Amortization of debt issue costs 1,034 1,034
Goodwill and other intangibles impairment 8 - 4,661
Share of equity loss of an associate 7 3 -
Minority interest 27,350 27,058
Change in value of subordinated notes payable early redemption option 12.2 (10,338) (18,201)
Unrealized loss on foreign currency 19 8,834 12,850
Future income tax expense 16 4,323 1,595
Change in non-cash operating working capital (9,059) 2,064
41,427 49,703
Financing activities
Net proceeds from credit facilities at the Centers 6,524 6,431
Equity contribution by minority owners to Black Hills Surgical Hospital, LLP - 1,145
Distributions received from an associate 7 33 -
Distributions to minority interest (25,315) (27,141)
Dividends (9,945) (8,936)
Purchase of IPS units under the terms of normal course issuer bids 12.4 (960) (1,814) Purchase of convertible secured debentures under the terms of normal course issuer bid 11 (18) -
(29,681) (30,315)
Investing activities
Purchase of property and equipment 6 (8,578) (16,168)
Cash impact of redemption of interest in Barranca Surgery Center, LLC 5 (98) -
Investment in and loan receivable from an associate 7 (440) -
(9,116) (16,168)
Increase in cash and cash equivalents 2,630 3,220
Cash and cash equivalents, beginning of the year 28,963 25,743
Cash and cash equivalents, end of the year 31,593 28,963
Supplemental cash flow information
Interest expense on minority exchangeable interest liability 7,103 7,736
Interest paid on subordinated notes payable 20,326 18,426
Other interest paid 5,311 3,970
Taxes paid 48 1,197
Non-cash transactions
Acquisition of additional interest in Oklahoma Spine Hospital, LLC 4 695 246
The accompanying notes are an integral part of these consolidated financial statements.
Annual Report 2010
47
Notes to Consolidated Financial Statements (In thousands of U.S. dollars, except per share amounts and where otherwise indicated) For the years ended December 31, 2010 and 2009
1. REPORTING ENTITY
Medical Facilities Corporation (the “Corporation”) owns indirect controlling interests in five (2009: six) limited liability
entities (the "Centers"), each of which owns a specialty hospital or an ambulatory surgical center. These Centers are:
- Sioux Falls Surgical Hospital, LLP (“SFSH”) located in Sioux Falls, South Dakota;
- Dakota Plains Surgical Center, LLP (“DPSC”) located in Aberdeen, South Dakota;
- Black Hills Surgical Hospital, LLP (“BHSH”) located in Rapid City, South Dakota;
- Oklahoma Spine Hospital, LLC (“OSH”) located in Oklahoma City, Oklahoma; and
- The Surgery Center of Newport Coast, LLC (“Newport Coast”) located in Newport Beach, California.
These consolidated financial statements include the results of the above Centers for the reporting periods and the results
of operations of Barranca Surgery Center, LLC (“Barranca”), a second ambulatory surgical center in California, up to
August 13, 2010, at which time the Corporation’s indirect 51% interest in the Center was redeemed by the holders of the
minority interest (see note 5).
As the Corporation’s Centers operate in the same industry and in the same country, they are treated as one segment for
financial reporting and disclosure purposes.
2. FUTURE CHANGES IN ACCOUNTING POLICIES
2.1 Business Combinations
In January 2009, the Canadian Institute of Chartered Accountants (“CICA”) issued Handbook Section 1582 Business Combinations which requires that all assets and liabilities of an acquired business be recorded at fair value at the
acquisition date. Obligations for contingent consideration and contingencies will also be recorded at fair value at the
acquisition date. The standard also states that acquisition-related costs will be expensed as incurred and that
restructuring charges will be expensed in periods after the acquisition date. The new standard applies prospectively to
business combinations for which the acquisition date is on or after the beginning of the first annual reporting period on or
after January 1, 2011. The Corporation will apply this new standard at the time of any applicable acquisitions.
2.2 Consolidations and Non-Controlling Interests
In January 2009, the CICA issued Handbook Section 1601 Consolidations and Section 1602 Non-Controlling Interests.
Section 1601 establishes standards for the preparation of consolidated financial statements. Section 1602 establishes
standards for accounting for a non-controlling interest in a subsidiary in the consolidated financial statements. These
standards apply to interim and annual consolidated financial statements relating to fiscal years beginning on or after
January 1, 2011. The Corporation does not expect these new standards to have any impact on its financial statements.
2.3 International Financial Reporting Standards (“IFRS”)
In February 2008, the Canadian Accounting Standards Board confirmed the transition to IFRS effective for years
beginning on or after January 1, 2011. The conversion to IFRS is required for the interim and annual financial statements of
the Corporation beginning on January 1, 2011.
Medical Facilities Corporation
48
3. SIGNIFICANT ACCOUNTING POLICIES
These consolidated financial statements have been prepared by management in accordance with accounting principles
generally accepted in Canada and include the accounts of the Corporation and all of its Centers. Intercompany
transactions and balances have been eliminated. The significant accounting policies are described below.
3.1 Functional currency
The Corporation's consolidated financial statements are reported in U.S. dollars as the principal operations of its Centers
are conducted in U.S. dollars. All financial information presented in U.S. and Canadian dollars has been rounded to the
nearest thousand, unless otherwise indicated.
The Corporation translates monetary assets and liabilities denominated in Canadian dollars, principally its subordinated
notes payable, convertible secured debentures and certain of its cash balances, at exchange rates in effect at the
consolidated balance sheet date and non-monetary items at rates of exchange in effect when the assets were acquired or
obligations were incurred. Revenue and expenses are translated at rates in effect at the time of the transactions. Foreign
exchange gains and losses, including translation adjustments, are included in the determination of income (loss) for the
respective reporting periods.
3.2 Use of estimates
The preparation of financial statements requires management to make estimates and assumptions that affect the
reported amounts of assets and liabilities and disclosure of contingent assets and liabilities at the date of the financial
statements and the reported amounts of revenue and expenses during the period. On an ongoing basis, management
evaluates its estimates in relation to assets, liabilities, facility service revenue and expenses. Management uses historical
experience and other factors it believes to be reasonable under the circumstances as the basis for its estimates. Actual
results could differ from those estimates. Changes to accounting estimates are recognized prospectively in the period in
which they are revised. Management estimates are required with respect to the (i) facility service revenue and accounts
receivable, (ii) supply inventory, (iii) valuation of financial instruments, (iv) acquired assets and liabilities, primarily
goodwill and other intangibles, (v) impairment of goodwill and other intangibles, (vi) provisions for potential liabilities, and
(vii) income tax provisions.
3.3 Cash and cash equivalents
Cash and cash equivalents consist of cash on hand and all liquid investments with a maturity of three months or less.
3.4 Accounts receivable
Accounts receivable are recorded at the time services are rendered. Payments from third party payors are generally
received on average within 60 days of the billing date. Residual amounts due from patients are considered past due 30
days after receiving payment from third party payors. Accounts receivable are recorded net of allowances for contractual
discounts with the third party payors and uncollectible amounts from the patients, by applying the following policies:
(i) An allowance for third party payor discounts is maintained at a level management believes is adequate to cover
estimated future discounts on accounts receivable balances. The allowance is established using either the third party
payor contracts effective at period end and/or based on historical payment rates.
(ii) An allowance for non-collectible receivable balances is maintained at a level which management believes is adequate
to absorb probable losses. Management determines the adequacy of the allowance based on historical data, current
economic conditions and other pertinent factors for the respective Center. Patient receivables are written off as non-
collectible when all reasonable collection efforts are exhausted (see note 13.4.2 for details of the allowance for non-
collectible receivable balances).

Annual Report 2010
49
3.5 Supply inventory
Supply inventory is stated at lower of cost or net realizable value, using a first-in, first-out valuation.
3.6 Foreign exchange forward contracts
The Corporation enters into foreign exchange forward contracts to manage the Corporation’s exposure to fluctuations in
the exchange rate between U.S. and Canadian currencies. This exposure arises from the payment of interest and dividends
on its Income Participating Securities (“IPS”) units and the payment of certain corporate expenses in Canadian dollars,
while all of its revenues are in U.S. dollars. The foreign exchange forward contracts are treated as freestanding derivative
financial instruments and are recorded at fair value. Unrealized gains and losses resulting from changes in fair value and
realized gains and losses upon settlement of the foreign exchange forward contracts are included in “Loss (gain) on
foreign currency” in the consolidated statement of income and deficit (note 19).
3.7 Property and equipment
Property and equipment are stated at cost less accumulated depreciation. Cost includes expenditures that are directly
attributable to the acquisition of the asset. The cost of self-constructed assets includes the cost of materials and direct
labour, any other costs directly attributable to bringing the assets to a working condition for their intended use and
interest capitalized during construction of the asset.
Depreciation of property and equipment is computed using the straight-line and declining-balance methods over the
estimated useful lives of the assets. Depreciation of self-constructed assets commences when they are placed in service.
Assets under capital lease are depreciated over the shorter of the lease term and their useful lives unless it is reasonably
certain that the Centers will obtain ownership by the end of the lease term. Land is not depreciated.
The estimated useful lives for the current and comparative periods are as follows:
Building and improvements 15-39 years
Equipment and furniture 3-7 years
Leases that substantially transfer the risk and benefits of ownership are capitalized with the cost included in property and
equipment and the related liability recorded in long-term debt.
Depreciation methods, useful lives and residual values are reviewed at each reporting date.
3.8 Goodwill and other intangibles
Goodwill represents the excess of cost over the fair value of net assets acquired. Goodwill is not amortized but is reviewed
for impairment at least annually. Other intangibles represent the value of the hospital operating licenses, medical charts
and records, referral sources and trade names. All other intangibles, except trade names, are amortized on a straight-line
basis over their respective economic lives. Trade names have an indefinite life and are not amortized but are reviewed for
impairment at least annually.
3.9 Financial instruments
The Corporation classifies its financial assets and liabilities as follows:
(i) Cash and cash equivalents, foreign exchange forward contracts and embedded derivatives requiring bifurcation
from their host contracts are classified as “Assets or liabilities held for trading” and are carried at fair value;
(ii) Accounts receivable are classified as “Loans and receivable” and are carried at estimated recoverable amounts,
net of allowances for contractual adjustments and uncollectible amounts;
(iii) Restricted cash, long-term debt, convertible secured debentures and subordinated notes payable are classified as
“Assets or liabilities held to maturity” and are carried at amortized cost using the effective interest rate method;

Medical Facilities Corporation
50
(iv) Investment in and loan receivable from an associate is classified as “Loans and receivable” and is carried at cost;
(v) Accrued interest and dividends payable, accounts payable and accrued liabilities are classified as “Other
liabilities” and are carried at cost; and
(vi) Transaction costs that are directly attributable to the acquisition or issue of financial instruments that are
classified as other than “Assets or liabilities held for trading” are included in the carrying value of such
instruments.
3.10 Facility service revenue
Facility service revenue consists of the actual amounts received and the estimated net realizable amounts receivable from
patients, third party payors and others for services rendered.
Each Center has agreements with third party payors that provide for payments at amounts different from the Center's
established rates. Payment arrangements include prospectively determined rates per diagnosis, reimbursed costs,
discounted charges and per diem payments. Settlements under reimbursement arrangements are accrued on an estimated
basis in the period the services are rendered and are adjusted in future periods as final settlements are determined.
Differences between the estimated amounts accrued and interim and final settlements are reported in operations in the
period of settlement.
3.11 Income taxes
The Corporation uses the asset and liability method of accounting for income taxes. Under the asset and liability method,
future tax assets and liabilities are recognized for the future tax consequences attributable to differences between the
financial statement carrying amounts of existing assets and liabilities and their respective tax bases. Future tax assets
and liabilities are measured using enacted or substantively enacted tax rates expected to apply to taxable income in the
periods in which those temporary differences are expected to be recovered or settled. The effect on future tax assets and
liabilities of a change in tax rates is recognized in income in the period that includes the date of enactment or substantive
enactment.
3.12 Comprehensive income
The Corporation has determined that there were no comprehensive income items that should be included in a statement
of comprehensive income and consequently no such statement is presented.
4. ACQUISITION OF ADDITIONAL INTEREST IN OSH
In December 2009, pursuant to the terms of the exchange agreement between the Corporation and the holders of the
minority interest in OSH (“minority owners”), the minority owners exchanged 0.38% of the ownership in the Center for
IPS units of the Corporation which were valued at $246 (Cdn$256) based on the market value of the IPS units on the date
of the transaction. This consideration is allocated between subordinated notes payable and share capital as presented in
notes 12.1 and 12.3, respectively.
In April 2010, the minority owners of OSH further exchanged 0.75% of the ownership in the Center for IPS units of the
Corporation which were valued at $695 (Cdn$700) based on the market value of the IPS units on the date of the
transaction. This consideration is allocated between subordinated notes payable and share capital as presented in
notes 12.1 and 12.3, respectively.
5. REDEMPTION OF INDIRECT INTEREST IN BARRANCA
On August 13, 2010, the holders of the minority interest in Barranca redeemed the Corporation’s indirect 51% interest in
the Center for consideration that approximated the carrying value of the net assets of the Center. The results of the
operations of Barranca through the date of the redemption are included in the consolidated net loss.
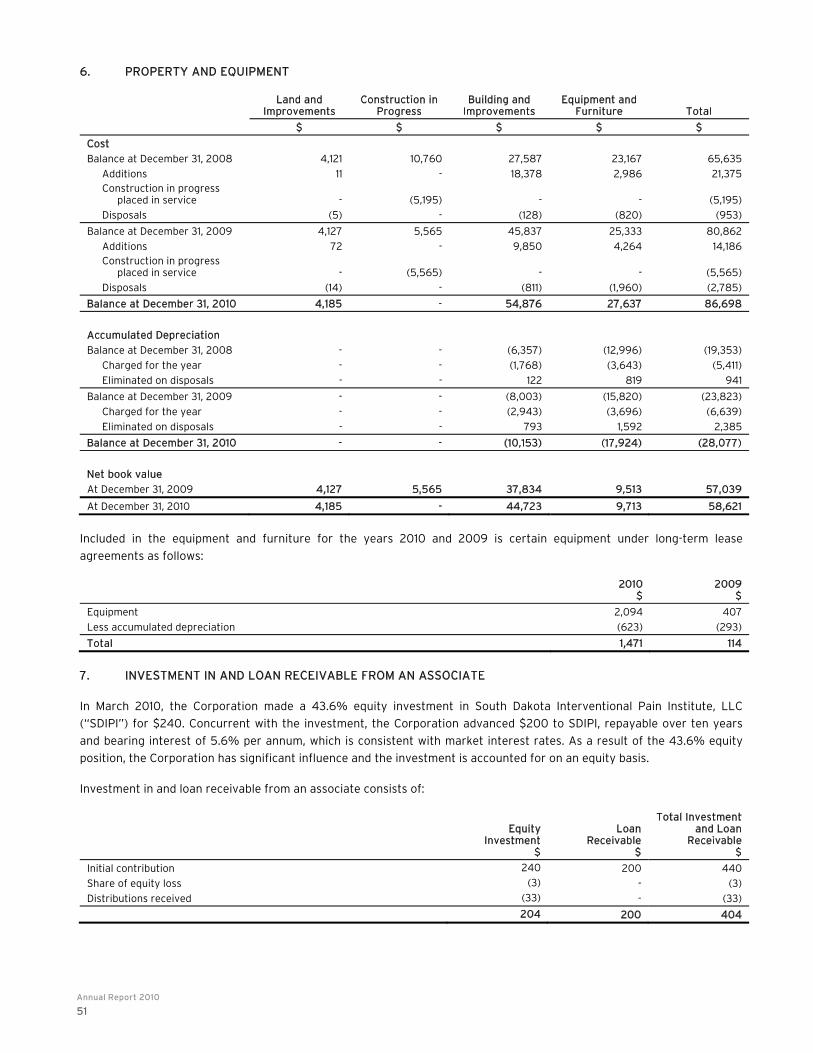
Annual Report 2010
51
6. PROPERTY AND EQUIPMENT
Land and
Improvements Construction in
Progress Building and
Improvements Equipment and
Furniture Total
$ $ $ $ $
Cost
Balance at December 31, 2008 4,121 10,760 27,587 23,167 65,635
Additions 11 - 18,378 2,986 21,375 Construction in progress placed in service - (5,195) - - (5,195)
Disposals (5) - (128) (820) (953)
Balance at December 31, 2009 4,127 5,565 45,837 25,333 80,862
Additions 72 - 9,850 4,264 14,186 Construction in progress placed in service - (5,565) - - (5,565)
Disposals (14) - (811) (1,960) (2,785)
Balance at December 31, 2010 4,185 - 54,876 27,637 86,698
Accumulated Depreciation
Balance at December 31, 2008 - - (6,357) (12,996) (19,353)
Charged for the year - - (1,768) (3,643) (5,411)
Eliminated on disposals - - 122 819 941
Balance at December 31, 2009 - - (8,003) (15,820) (23,823)
Charged for the year - - (2,943) (3,696) (6,639)
Eliminated on disposals - - 793 1,592 2,385
Balance at December 31, 2010 - - (10,153) (17,924) (28,077)
Net book value
At December 31, 2009 4,127 5,565 37,834 9,513 57,039
At December 31, 2010 4,185 - 44,723 9,713 58,621
Included in the equipment and furniture for the years 2010 and 2009 is certain equipment under long-term lease
agreements as follows:
2010
$ 2009
$
Equipment 2,094 407
Less accumulated depreciation (623) (293)
Total 1,471 114
7. INVESTMENT IN AND LOAN RECEIVABLE FROM AN ASSOCIATE
In March 2010, the Corporation made a 43.6% equity investment in South Dakota Interventional Pain Institute, LLC
(“SDIPI”) for $240. Concurrent with the investment, the Corporation advanced $200 to SDIPI, repayable over ten years
and bearing interest of 5.6% per annum, which is consistent with market interest rates. As a result of the 43.6% equity
position, the Corporation has significant influence and the investment is accounted for on an equity basis.
Investment in and loan receivable from an associate consists of:
Equity Investment
$
Loan Receivable
$
Total Investment and Loan
Receivable$
Initial contribution 240 200 440
Share of equity loss (3) - (3)
Distributions received (33) - (33)
204 200 404

Medical Facilities Corporation
52
8. GOODWILL AND OTHER INTANGIBLES
8.1 Goodwill
Changes in the carrying amount of goodwill for the years 2010 and 2009 are as follows:
$
Balance as at December 31, 2008 72,297 Change in value of goodwill related to the increase in the value of the minority exchangeable interest liability (note 13.2) 11,086 Goodwill impairment (776)
Balance as at December 31, 2009 82,607
Change in value of goodwill related to the increase in the value of the minority exchangeable interest liability (note 13.2) 8,236
Balance as at December 31, 2010 90,843
Due to indications of a potential impairment of goodwill and other intangibles for Barranca, the Corporation tested this
Center’s goodwill and other intangibles for impairment as at September 30, 2009 and determined that goodwill and other
intangibles should be completely written off. Therefore, an impairment of $4,661 ($776 for goodwill and $3,885 for other
intangibles) is reflected in the results of the Corporation for the year 2009.
The Corporation performed its annual impairment test for goodwill and other intangibles as at December 31, 2010 and
determined that there was no impairment of goodwill and other intangibles.
8.2 Other intangibles
Hospital Operating Licenses
Medical Charts and Records
Referral Sources Trade Names Total
$ $ $ $ $
Cost
Balance at December 31, 2008 714 6,981 162,352 9,826 179,873
Impairment charges - - (3,885) - (3,885)
Balance at December 31, 2009 714 6,981 158,467 9,826 175,988
Disposal of Barranca’s assets - - (1,225) - (1,225)
Balance at December 31, 2010 714 6,981 157,242 9,826 174,763
Accumulated Amortization
Balance at December 31, 2008 (675) (4,808) (47,208) - (52,691)
Amortization charges (39) (1,116) (12,821) - (13,976)
Balance at December 31, 2009 (714) (5,924) (60,029) - (66,667)
Amortization charges - (892) (12,345) - (13,237)
Disposal of Barranca’s assets - - 1,225 - 1,225
Balance at December 31, 2010 (714) (6,816) (71,149) - (78,679)
Net book value
At December 31, 2009 - 1,057 98,438 9,826 109,321
At December 31, 2010 - 165 86,093 9,826 96,084
Amortization period (years) 5 5-7 10-15 None (indefinite life)

Annual Report 2010
53
9. LONG-TERM DEBT
December 31,
2010 2009
Authorized Balance Effective
Interest Rate Balance Effective
Interest Rate
$ $ % $ %
Revolving credit facilities
SFSH 6,400 5,488 2.31 5,488 2.25
DPSC 2,000 1,095 4.50 604 4.00
BHSH 6,000 2,750 3.25 3,805 3.00
OSH 5,000 3,475 5.00 2,670 2.48
Newport Coast 1,600 - 2.25 - 2.23
21,000 12,808 12,567
Notes payable
SFSH 19,788 19,788 4.87 20,919 4.88
DPSC 3,600 3,600 4.50 3,600 4.00
BHSH 11,486 11,486 5.35 6,415 5.93
OSH 1,300 1,159 5.00 - -
Newport Coast 51 51 4.90 136 4.90
36,225 36,084 31,070
Capital leases
SFSH (note 10) 1,476 N/A 207 N/A
50,368 43,844
Less current portion (9,650) (14,730)
40,718 29,114
The credit facility for SFSH bears interest at one month London Interbank Offered Rate (“LIBOR”) plus 2.0% and notes
payable bear fixed interest rates. The credit facility and note payable for DPSC bear interest at a rate that varies with
prime but a minimum of 4.5%. The credit facilities for BHSH vary with prime and notes payable bear fixed interest rates.
The interest on the OSH credit facility and notes payable is payable monthly at the greater of 5.0% per annum or the
prime rate. The credit facility and note payable for Newport Coast bear interest at rates that vary with prime.
The SFSH’s credit facility and notes payable mature between 2011 and 2016. The DPSC’s credit facility matures on
July 15, 2011 and note payable matures on November 1, 2020. The BHSH’s credit facilities and notes payable mature
during 2012 and 2015. The credit facility related to OSH is due in full on May 31, 2012 and the note payable matures on
May 31, 2015. The Newport Coast’s credit facility matures on May 1, 2011 and the note payable matures on July 28, 2011.
Each credit facility is secured by a security interest in all property and a mortgage on real property owned by the
respective Center. These credit facilities contain certain restrictive financial and non-financial covenants. As of the
reporting date, there were no breaches of these covenants.
The following are the future maturities of long-term debt, including capital leases (note 10), for the years ending
December 31:
$
2011 6,911
2012 12,051
2013 7,245
2014 13,363
2015 and thereafter 10,798
Future maturities of long-term debt 50,368

Medical Facilities Corporation
54
10. CAPITAL LEASES
SFSH leases certain equipment under long-term lease agreements which have been capitalized. Minimum future lease
payments for the capital leases are as follows:
$
2011 693
2012 628
2013 202
Total minimum lease payments 1,523
Less interest (47)
Present value of minimum lease payments 1,476
11. CONVERTIBLE SECURED DEBENTURES
On April 14, 2008, the Corporation issued, in a public offering, Cdn$43,000 (US$42,124) aggregate principal amount
of 7.5% convertible secured debentures. The convertible secured debentures pay interest semi-annually in arrears on
April 30 and October 30 of each year. The convertible secured debentures mature on April 30, 2013 and are convertible
into approximately 76.3359 IPS units per Cdn$1,000 principal amount of debentures, at any time, at the option of the
holder, representing a conversion price of Cdn$13.10 per IPS unit.
The convertible secured debentures are secured by a general security interest over all assets and property, currently held
or acquired in the future, both real and personal, of the Corporation, together with a guarantee provided by Medical
Facilities Holdings (USA), LLC (a company 100% owned by the Corporation) in favour of the debenture holders to secure
the payment by the Corporation of all present and future indebtedness under the Trust Indenture for the convertible
secured debentures. The interests of the convertible secured debenture holders rank in priority to the subordinated notes
and other unsecured indebtedness of the Corporation.
In November 2010, the Corporation received regulatory approval for a normal course issuer bid under which the
Corporation may purchase up to Cdn$3,440 aggregate principal amount of its outstanding convertible secured debentures
during the period from November 24, 2010 to November 23, 2011. In 2010, the Corporation purchased Cdn$18 aggregate
principal amount of convertible secured debentures for a total consideration of $19.
The following table represents changes in the convertible secured debentures for the years 2010 and 2009:
$
Balance as at December 31, 2008 35,304
Unrealized loss on foreign currency translation (note 19) 5,610
Balance as at December 31, 2009 40,914
Less financing costs related to convertible secured debentures (1,729)
Net balance as at December 31, 2009 39,185
Balance as at December 31, 2009 40,914
Convertible secured debentures purchased and cancelled under the normal course issuer bid (18)
Unrealized loss on foreign currency translation (note 19) 2,320
Balance as at December 31, 2010 43,216
Less financing costs related to convertible secured debentures (1,210)
Net balance as at December 31, 2010 42,006
The fair value of the convertible secured debentures as of December 31, 2010 was $45,376 (December 31, 2009: $42,345).
Interest expense on the convertible secured debentures was $3,132 for 2010 (2009: $2,836).
12. SUBORDINATED NOTES PAYABLE AND SHARE CAPITAL
As at December 31, 2010, the Corporation had 28,306,749 IPS units outstanding. Each IPS unit represents: (a) Cdn$5.90
aggregate principal amount of 12.5% subordinated notes payable of the Corporation and (b) one common share of the

Annual Report 2010
55
Corporation. Holders of IPS units have the right to separate the IPS units into the common shares and subordinated notes
represented thereby. Separation of the IPS units will occur automatically upon a repurchase, redemption or maturity of
the subordinated notes. Similarly, any holder of common shares and subordinated notes may, at any time, combine the
applicable number of common shares and principal amount of subordinated notes to form IPS units.
In December 2010, 10,000 IPS units were separated into 10,000 common shares and $59,000 aggregate principal amount
of 12.5% subordinated notes payable, which, in addition to 28,306,749 IPS units, were outstanding as at December 31,
2010.
In December 2009 and April 2010, the Corporation issued 30,931 and 64,443 IPS units, respectively, for the acquisition of
additional interest in OSH pursuant to an exchange agreement between the Corporation and the Center’s minority owners
(see note 4).
12.1 Subordinated notes payable
The aggregate principal of the subordinated notes payable outstanding at December 31, 2010 was Cdn$167,069
(December 31, 2009: Cdn$167,321). The subordinated notes payable are reflected on an unamortized cost basis as follows:
$
Balance as at December 31, 2008 138,607
Less financing costs related to subordinated notes payable (7,973)
Net balance as at December 31, 2008 130,634
Balance as at December 31, 2008 138,607
Subordinated notes payable issued for acquisition of additional interest in OSH (note 4) 175
IPS units purchased and cancelled under normal course issuer bids (note 12.4) (1,369)
Unrealized loss on foreign currency translation (note 19) 21,789
Balance as at December 31, 2009 159,202
Less financing costs related to subordinated notes payable (7,457)
Net balance as at December 31, 2009 151,745
Balance as at December 31, 2009 159,202
Subordinated notes payable issued for acquisition of additional interest in OSH (note 4) 377
IPS units purchased and cancelled under normal course issuer bids (note 12.4) (613)
Unrealized loss on foreign currency translation (note 19) 9,010
Balance as at December 31, 2010 167,976
Less financing costs related to subordinated notes payable (6,942)
Net balance as at December 31, 2010 161,034
The subordinated notes payable mature on March 29, 2014 and can be extended by the Corporation for two additional
successive five-year terms if a majority of the holders consent to the extensions and certain other conditions are satisfied.
As of March 29, 2009, the Corporation has the option to redeem the subordinated notes payable in whole or in part at any
time, for cash, at a redemption price including a premium over the principal amount of the subordinated notes payable,
which premium decreases over time. The fair value of the subordinated notes payable as of December 31, 2010 based on a
discounted cash flow model was $207,242.
12.2 Embedded derivatives in the subordinated notes payable
The Corporation identified the following embedded derivatives in the subordinated notes payable that require separate
presentation at fair value in these consolidated financial statements:
(i) An early redemption option (“Early Redemption Option”); and
(ii) An extension option (“Renewal Option”).
The Early Redemption Option permits the Corporation to call its outstanding subordinated notes payable after the fifth
anniversary date for a premium over the principal amount of 4% in 2010, 3% in 2011, 2% in 2012, 1% in 2013 and at par in

Medical Facilities Corporation
56
2014 and thereafter. Management has determined that the fair value of this Early Redemption Option at
December 31, 2010 was $28,539 (December 31, 2009: $18,201). The increase in the value of the Early Redemption Option
of $10,338 is included in loss for the year 2010 (2009: an increase of $18,201).
Under the Renewal Option, the Corporation may extend the maturity of its subordinated notes payable for two additional
successive five-year terms subject to the consent of debtholders and other conditions. Management has determined that
the fair value of this Renewal Option is nominal and, therefore, not separately reflected in these financial statements.
12.3 Share capital and earnings (loss) per share
2010 2009
Number of
Shares $ Number of
Shares $
Opening balance 28,359,506 98,794 28,614,075 99,168
Issued on exchange for interest in OSH (note 4) 64,443 317 30,931 71
Purchased and cancelled under the terms of normal course issuer bids (note 12.4) (107,200) (347) (285,500) (445)
Closing balance 28,316,749 98,764 28,359,506 98,794
Basic loss per share for the years 2010 and 2009 is calculated as follows:
2010
$ 2009
$
Net loss (596) (745)
Add imputed interest expense on minority exchangeable interest liability 7,103 7,736
Less portion of income attributable to minority exchangeable interest liability (7,997) (7,756)
Net loss attributable to common shares (1,490) (765)
Divided by weighted average number of shares outstanding for the period 28,367,349 28,384,967
Basic loss per share (0.053) (0.027)
For 2010 and 2009, issuance of IPS units upon exchange of the outstanding minority exchangeable interest liability and
conversion of the outstanding convertible secured debentures would have been anti-dilutive and, therefore, the calculation
of fully diluted loss per share is not presented.
12.4 Normal course issuer bids
In April 2009, the Corporation received regulatory approval for a normal course issuer bid under which the Corporation
may purchase up to 1,420,049 of its IPS units during the period from April 25, 2009 to April 24, 2010. In 2009, the
Corporation purchased 285,500 of its IPS units for a total consideration of $1,814, allocated between subordinated notes
payable ($1,369) and share capital ($445) (notes 12.1 and 12.3, respectively).
In April 2010, the Corporation received regulatory approval for a normal course issuer bid under which the Corporation
may purchase up to 1,417,975 of its IPS units during the period from April 26, 2010 to April 25, 2011. In 2010, the
Corporation purchased 107,200 of its IPS units for a total consideration of $960, allocated between subordinated notes
payable ($613) and share capital ($347) (notes 12.1 and 12.3, respectively).
13. FINANCIAL INSTRUMENTS AND RISK MANAGEMENT
The Corporation’s financial instruments consist of cash and cash equivalents, accounts receivable, restricted cash, foreign
exchange forward contracts, subordinated notes payable early redemption option (note 12.2), investment in and loan
receivable from an associate (note 7), accrued interest payable, dividends payable, accounts payable and accrued
liabilities, long-term debt (note 9), convertible secured debentures (note 11), subordinated notes payable (note 12) and
minority exchangeable interest liability (note 13.2).
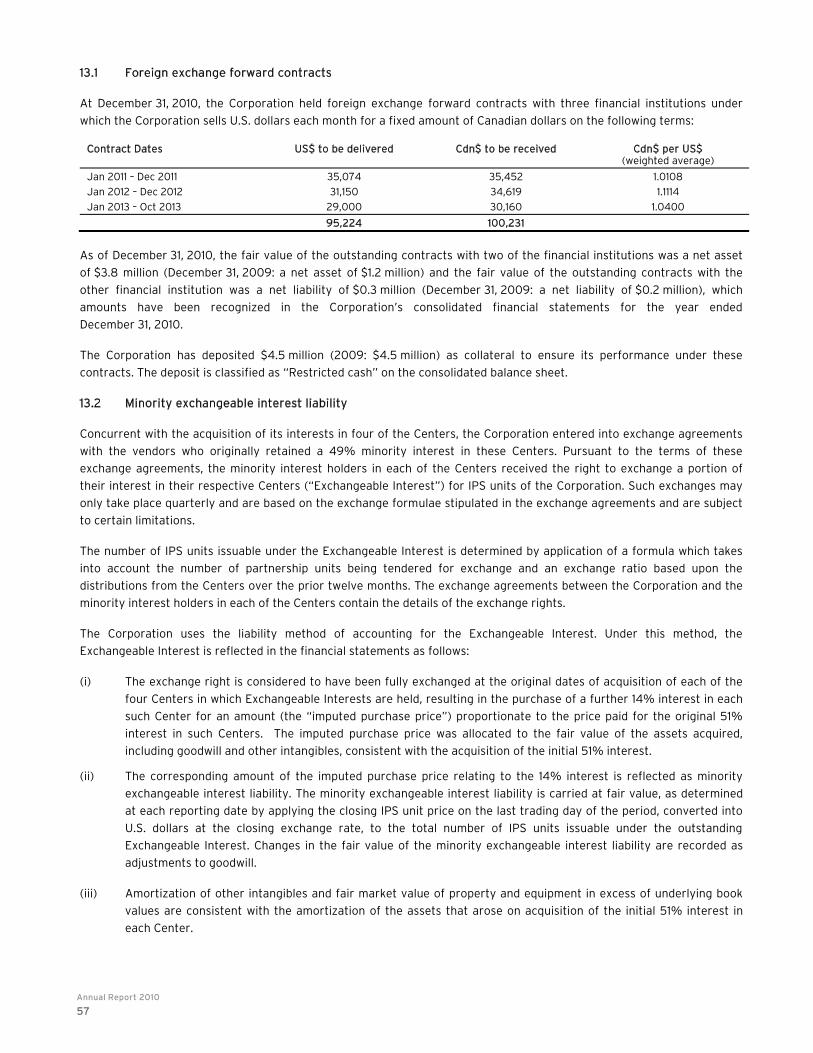
Annual Report 2010
57
13.1 Foreign exchange forward contracts
At December 31, 2010, the Corporation held foreign exchange forward contracts with three financial institutions under
which the Corporation sells U.S. dollars each month for a fixed amount of Canadian dollars on the following terms:
Contract Dates US$ to be delivered
Cdn$ to be received
Cdn$ per US$ (weighted average)
Jan 2011 – Dec 2011 35,074 35,452 1.0108
Jan 2012 – Dec 2012 31,150 34,619 1.1114
Jan 2013 – Oct 2013 29,000 30,160 1.0400
95,224 100,231
As of December 31, 2010, the fair value of the outstanding contracts with two of the financial institutions was a net asset
of $3.8 million (December 31, 2009: a net asset of $1.2 million) and the fair value of the outstanding contracts with the
other financial institution was a net liability of $0.3 million (December 31, 2009: a net liability of $0.2 million), which
amounts have been recognized in the Corporation’s consolidated financial statements for the year ended
December 31, 2010.
The Corporation has deposited $4.5 million (2009: $4.5 million) as collateral to ensure its performance under these
contracts. The deposit is classified as “Restricted cash” on the consolidated balance sheet.
13.2 Minority exchangeable interest liability
Concurrent with the acquisition of its interests in four of the Centers, the Corporation entered into exchange agreements
with the vendors who originally retained a 49% minority interest in these Centers. Pursuant to the terms of these
exchange agreements, the minority interest holders in each of the Centers received the right to exchange a portion of
their interest in their respective Centers (“Exchangeable Interest”) for IPS units of the Corporation. Such exchanges may
only take place quarterly and are based on the exchange formulae stipulated in the exchange agreements and are subject
to certain limitations.
The number of IPS units issuable under the Exchangeable Interest is determined by application of a formula which takes
into account the number of partnership units being tendered for exchange and an exchange ratio based upon the
distributions from the Centers over the prior twelve months. The exchange agreements between the Corporation and the
minority interest holders in each of the Centers contain the details of the exchange rights.
The Corporation uses the liability method of accounting for the Exchangeable Interest. Under this method, the
Exchangeable Interest is reflected in the financial statements as follows:
(i) The exchange right is considered to have been fully exchanged at the original dates of acquisition of each of the
four Centers in which Exchangeable Interests are held, resulting in the purchase of a further 14% interest in each
such Center for an amount (the “imputed purchase price”) proportionate to the price paid for the original 51%
interest in such Centers. The imputed purchase price was allocated to the fair value of the assets acquired,
including goodwill and other intangibles, consistent with the acquisition of the initial 51% interest.
(ii) The corresponding amount of the imputed purchase price relating to the 14% interest is reflected as minority
exchangeable interest liability. The minority exchangeable interest liability is carried at fair value, as determined
at each reporting date by applying the closing IPS unit price on the last trading day of the period, converted into
U.S. dollars at the closing exchange rate, to the total number of IPS units issuable under the outstanding
Exchangeable Interest. Changes in the fair value of the minority exchangeable interest liability are recorded as
adjustments to goodwill.
(iii) Amortization of other intangibles and fair market value of property and equipment in excess of underlying book
values are consistent with the amortization of the assets that arose on acquisition of the initial 51% interest in
each Center.

Medical Facilities Corporation
58
(iv) The distributions made by each Center, that relate to the ownership interest therein that is the subject of the
outstanding Exchangeable Interest, are treated as interest expense in the Corporation’s consolidated statement of
income and deficit. The minority interest in the results of operations is correspondingly reduced.
(v) The calculation of basic and diluted earnings (loss) per share involves certain modifications to the net income
(loss) as reported and the number of issued and outstanding IPS units as set out in note 12.3.
The number of IPS units to be potentially issued for each minority exchangeable interest liability and the fair value of the
minority exchangeable interest liability for the years ended December 31, 2010 and December 31, 2009 are as follows:
2010 2009
Number of IPS units to be potentially issued for minority exchangeable interest liability 5,464,739 5,919,197
Fair value of the minority exchangeable interest liability $ 59,010 $ 50,913
13.3 Fair values and classification of financial instruments
The Corporation obtains the fair value of foreign exchange forward contracts from the counterparties to such contracts.
The fair value of the Early Redemption Option related to the subordinated notes payable is determined using a derivative
valuation model that requires various assumptions, including the spread between the redemption strike price and market
yields, volatility of interest rates and the remaining time to maturity of the Early Redemption Option. The fair value of the
subordinated notes payable was determined using a discounted cash flow model. The fair value of the convertible secured
debentures was determined based on the closing trading price of the security on December 31, 2010. The fair values of
notes payable and term loans at the Centers’ level are not readily determinable. The fair values of all other financial
instruments of the Corporation, due to the short-term nature of these instruments, approximate their book values.
The following table presents the carrying value and classification of the Corporation’s financial instruments as of
December 31, 2010 and December 31, 2009:
2010
$ 2009
$
Financial assets
Held for trading (carried at fair value)
Cash and cash equivalents 31,593 28,963
Foreign exchange forward contracts 3,835 1,205
Subordinated notes payable early redemption option 28,539 18,201
Loans and receivable (carried at cost)
Accounts receivable 40,818 36,586
Investment in and loan receivable from an associate 404 -
Held to maturity (carried at amortized cost)
Restricted cash 4,483 4,483
Financial liabilities
Other liabilities (carried at cost)
Accounts payable and accrued liabilities 18,696 16,870
Accrued interest payable 2,262 2,164
Dividends payable 849 812
Held for trading (carried at fair value)
Foreign exchange forward contracts 284 150
Minority exchangeable interest liability 59,010 50,913
Held to maturity (carried at amortized cost)
Long-term debt 50,368 43,844
Convertible secured debentures 42,006 39,185
Subordinated notes payable 161,034 151,745
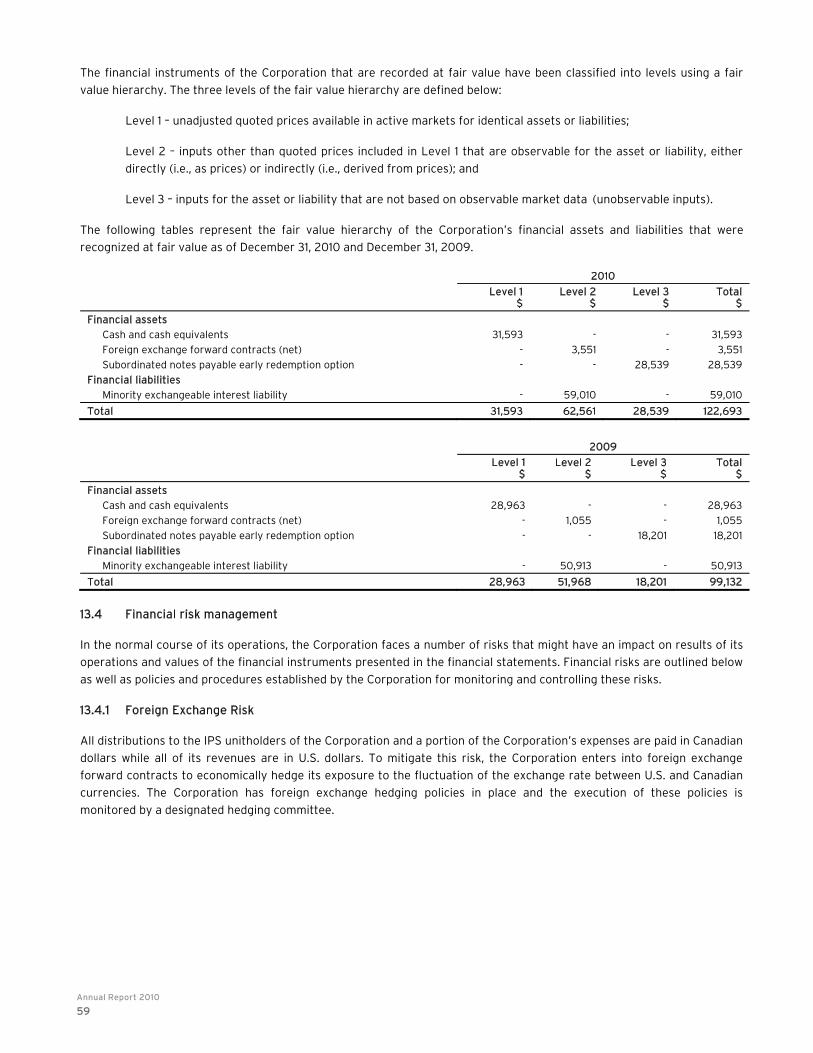
Annual Report 2010
59
The financial instruments of the Corporation that are recorded at fair value have been classified into levels using a fair
value hierarchy. The three levels of the fair value hierarchy are defined below:
Level 1 – unadjusted quoted prices available in active markets for identical assets or liabilities;
Level 2 – inputs other than quoted prices included in Level 1 that are observable for the asset or liability, either
directly (i.e., as prices) or indirectly (i.e., derived from prices); and
Level 3 – inputs for the asset or liability that are not based on observable market data (unobservable inputs).
The following tables represent the fair value hierarchy of the Corporation’s financial assets and liabilities that were
recognized at fair value as of December 31, 2010 and December 31, 2009.
2010
Level 1
$ Level 2
$ Level 3
$ Total
$
Financial assets
Cash and cash equivalents 31,593 - - 31,593
Foreign exchange forward contracts (net) - 3,551 - 3,551
Subordinated notes payable early redemption option - - 28,539 28,539
Financial liabilities
Minority exchangeable interest liability - 59,010 - 59,010
Total 31,593 62,561 28,539 122,693
2009
Level 1
$ Level 2
$ Level 3
$ Total
$
Financial assets
Cash and cash equivalents 28,963 - - 28,963
Foreign exchange forward contracts (net) - 1,055 - 1,055
Subordinated notes payable early redemption option - - 18,201 18,201
Financial liabilities
Minority exchangeable interest liability - 50,913 - 50,913
Total 28,963 51,968 18,201 99,132
13.4 Financial risk management
In the normal course of its operations, the Corporation faces a number of risks that might have an impact on results of its
operations and values of the financial instruments presented in the financial statements. Financial risks are outlined below
as well as policies and procedures established by the Corporation for monitoring and controlling these risks.
13.4.1 Foreign Exchange Risk
All distributions to the IPS unitholders of the Corporation and a portion of the Corporation’s expenses are paid in Canadian
dollars while all of its revenues are in U.S. dollars. To mitigate this risk, the Corporation enters into foreign exchange
forward contracts to economically hedge its exposure to the fluctuation of the exchange rate between U.S. and Canadian
currencies. The Corporation has foreign exchange hedging policies in place and the execution of these policies is
monitored by a designated hedging committee.
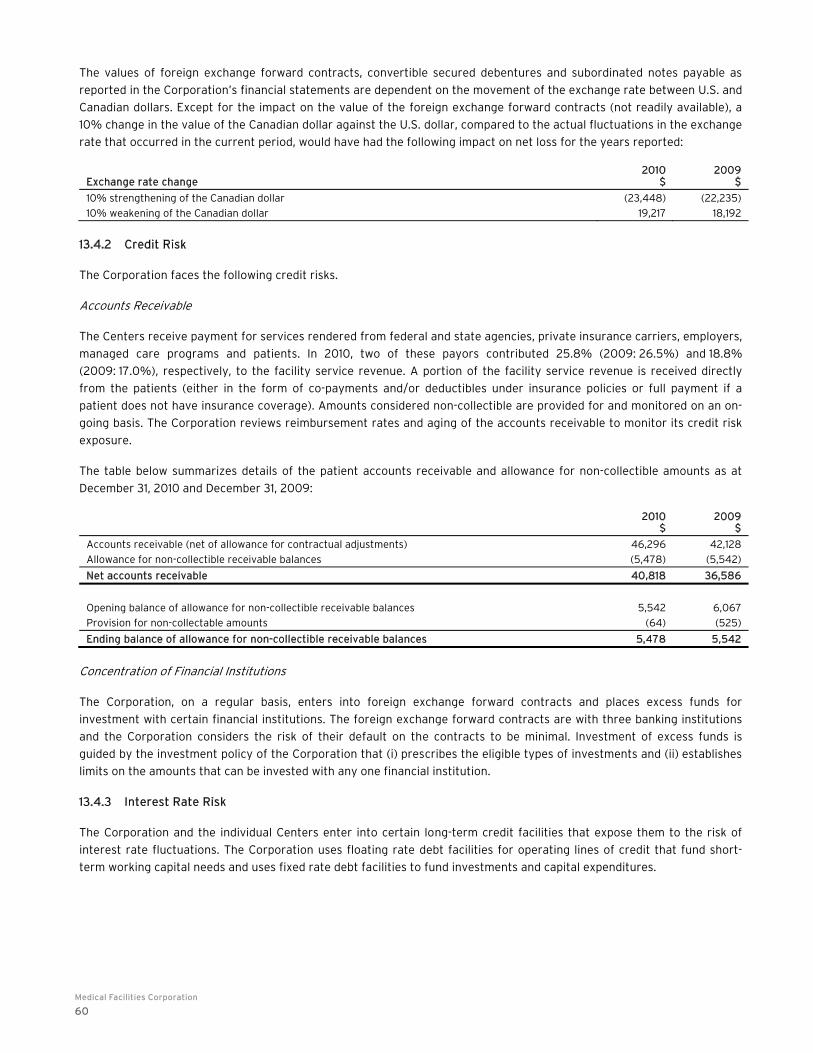
Medical Facilities Corporation
60
The values of foreign exchange forward contracts, convertible secured debentures and subordinated notes payable as
reported in the Corporation’s financial statements are dependent on the movement of the exchange rate between U.S. and
Canadian dollars. Except for the impact on the value of the foreign exchange forward contracts (not readily available), a
10% change in the value of the Canadian dollar against the U.S. dollar, compared to the actual fluctuations in the exchange
rate that occurred in the current period, would have had the following impact on net loss for the years reported:
Exchange rate change 2010
$ 2009
$
10% strengthening of the Canadian dollar (23,448) (22,235)
10% weakening of the Canadian dollar 19,217 18,192
13.4.2 Credit Risk
The Corporation faces the following credit risks.
Accounts Receivable
The Centers receive payment for services rendered from federal and state agencies, private insurance carriers, employers,
managed care programs and patients. In 2010, two of these payors contributed 25.8% (2009: 26.5%) and 18.8%
(2009: 17.0%), respectively, to the facility service revenue. A portion of the facility service revenue is received directly
from the patients (either in the form of co-payments and/or deductibles under insurance policies or full payment if a
patient does not have insurance coverage). Amounts considered non-collectible are provided for and monitored on an on-
going basis. The Corporation reviews reimbursement rates and aging of the accounts receivable to monitor its credit risk
exposure.
The table below summarizes details of the patient accounts receivable and allowance for non-collectible amounts as at
December 31, 2010 and December 31, 2009:
2010
$ 2009
$
Accounts receivable (net of allowance for contractual adjustments) 46,296 42,128
Allowance for non-collectible receivable balances (5,478) (5,542)
Net accounts receivable 40,818 36,586
Opening balance of allowance for non-collectible receivable balances 5,542 6,067
Provision for non-collectable amounts (64) (525)
Ending balance of allowance for non-collectible receivable balances 5,478 5,542
Concentration of Financial Institutions
The Corporation, on a regular basis, enters into foreign exchange forward contracts and places excess funds for
investment with certain financial institutions. The foreign exchange forward contracts are with three banking institutions
and the Corporation considers the risk of their default on the contracts to be minimal. Investment of excess funds is
guided by the investment policy of the Corporation that (i) prescribes the eligible types of investments and (ii) establishes
limits on the amounts that can be invested with any one financial institution.
13.4.3 Interest Rate Risk
The Corporation and the individual Centers enter into certain long-term credit facilities that expose them to the risk of
interest rate fluctuations. The Corporation uses floating rate debt facilities for operating lines of credit that fund short-
term working capital needs and uses fixed rate debt facilities to fund investments and capital expenditures.
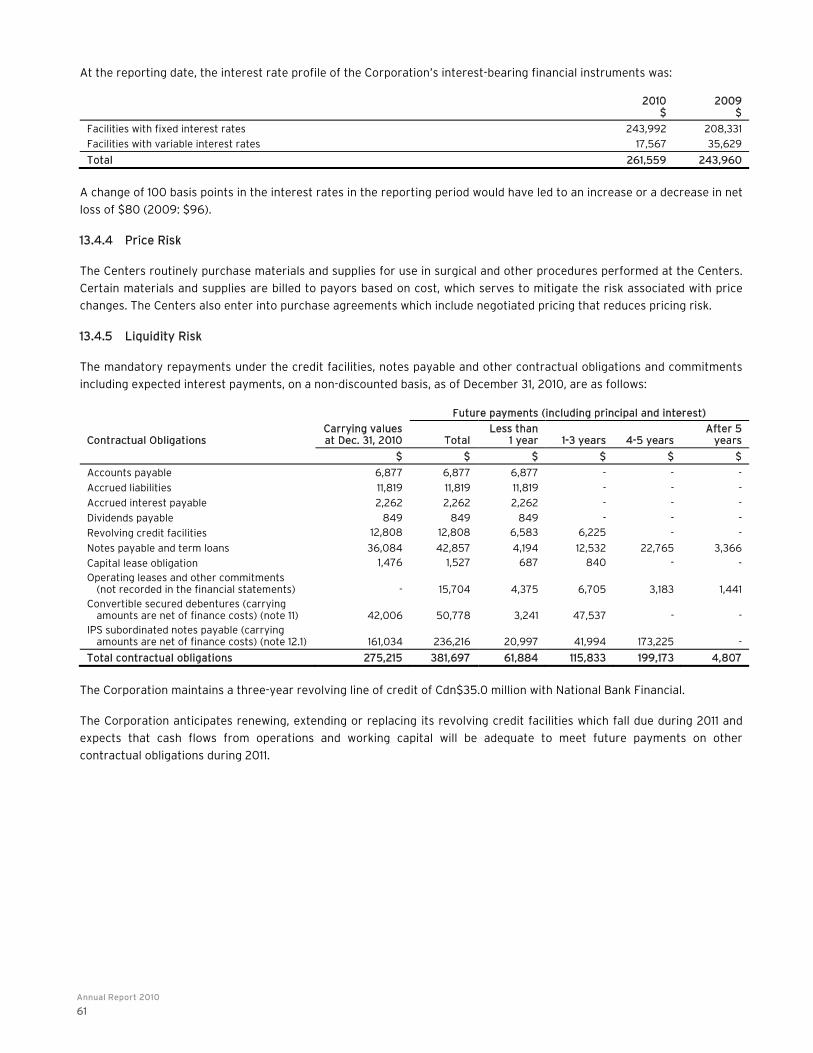
Annual Report 2010
61
At the reporting date, the interest rate profile of the Corporation’s interest-bearing financial instruments was:
2010
$ 2009
$
Facilities with fixed interest rates 243,992 208,331
Facilities with variable interest rates 17,567 35,629
Total 261,559 243,960
A change of 100 basis points in the interest rates in the reporting period would have led to an increase or a decrease in net
loss of $80 (2009: $96).
13.4.4 Price Risk
The Centers routinely purchase materials and supplies for use in surgical and other procedures performed at the Centers.
Certain materials and supplies are billed to payors based on cost, which serves to mitigate the risk associated with price
changes. The Centers also enter into purchase agreements which include negotiated pricing that reduces pricing risk.
13.4.5 Liquidity Risk
The mandatory repayments under the credit facilities, notes payable and other contractual obligations and commitments
including expected interest payments, on a non-discounted basis, as of December 31, 2010, are as follows:
Future payments (including principal and interest)
Contractual Obligations Carrying values at Dec. 31, 2010 Total
Less than 1 year 1-3 years 4-5 years
After 5 years
$ $ $ $ $ $
Accounts payable 6,877 6,877 6,877 - - -
Accrued liabilities 11,819 11,819 11,819 - - -
Accrued interest payable 2,262 2,262 2,262 - - -
Dividends payable 849 849 849 - - -
Revolving credit facilities 12,808 12,808 6,583 6,225 - -
Notes payable and term loans 36,084 42,857 4,194 12,532 22,765 3,366
Capital lease obligation 1,476 1,527 687 840 - - Operating leases and other commitments (not recorded in the financial statements) - 15,704 4,375 6,705 3,183 1,441 Convertible secured debentures (carrying amounts are net of finance costs) (note 11) 42,006 50,778 3,241 47,537 - - IPS subordinated notes payable (carrying amounts are net of finance costs) (note 12.1) 161,034 236,216 20,997 41,994 173,225 -
Total contractual obligations 275,215 381,697 61,884 115,833 199,173 4,807
The Corporation maintains a three-year revolving line of credit of Cdn$35.0 million with National Bank Financial.
The Corporation anticipates renewing, extending or replacing its revolving credit facilities which fall due during 2011 and
expects that cash flows from operations and working capital will be adequate to meet future payments on other
contractual obligations during 2011.

Medical Facilities Corporation
62
14. CAPITAL
The Corporation’s objective when managing capital is to:
(i) safeguard the Corporation's ability to continue as a going concern and make acquisitions;
(ii) ensure sufficient liquidity to fund current operations and its growth strategy; and
(iii) maximize the return to IPS unitholders.
The capital of the Corporation is defined to include the subordinated notes payable and common share components of the
IPS units, including those components that separated in December 2010 (note 12), convertible secured debentures (note 11)
issued to finance the acquisitions of the California Centers and other debt facilities at the corporate level.
The Corporation manages its liquidity and capital structure by monitoring its cash and cash equivalents, its current
indebtedness and future financing and funding needs.
In addition, the Corporation regularly monitors current and forecasted debt levels to ensure compliance with debt
covenants in place. As of the reporting date, the Corporation is in compliance with the covenants in place. The
Corporation’s long-term debt, convertible secured debentures and subordinated notes payable require the maintenance of
various financial ratios. Under the terms of the convertible secured debenture and subordinated notes payable indentures,
the Corporation must meet two pro forma financial ratios at the time of incurring new debt including the issuance of
additional subordinated notes payable and convertible secured debentures.
In order to maintain or adjust the capital structure, the Corporation may enter into or repay credit facilities, adjust the
amount of distributions paid to IPS unitholders, repurchase its publicly traded securities or issue new shares, IPS units or
convertible debt. During the twelve-month period ended December 31, 2010, the Corporation has returned capital to
shareholders through the repurchase and cancellation of 107,200 IPS units under normal course issuer bids (note 12.4).
15. EMPLOYEE FUTURE BENEFITS
Benefits programs at the Centers include a qualified 401(k) retirement plan which covers all employees who meet eligibility
requirements. Each participating Center makes matching contributions subject to certain limits. In 2010, contributions
made by the five Centers to such plans were $994 (in 2009: $983).
16. INCOME TAXES
The U.S. tax return for the Corporation is prepared on a consolidated basis and includes balances and amounts
attributable to both Canadian and U.S. entities. The Canadian income tax return for the Corporation is prepared on a
stand-alone basis and includes non-consolidated balances attributable to the Canadian entity only. Income taxes reported
in these consolidated financial statements are as follows:
2010
$ 2009
$
Provision for Income Taxes
U.S. income tax expense (recovery)
Current - (652)
Future 4,323 1,595
4,323 943
Canadian income tax expense
Current - -
Future - -
- -
Total income tax expense 4,323 943

Annual Report 2010
63
All Centers are required to withhold and deposit with the government the tax on the portion of their income allocable to
the Corporation (reduced by the annual amount of goodwill amortized for tax purposes and interest incurred at the
corporate level allocated to individual Centers) at a rate of 35%. Such withholdings are treated as instalments for the
income tax paid by the Corporation and are refunded by the government when the Corporation files its tax return. The
amount of the withholding tax deposited by the Centers is reduced by the estimated provision for the current income
taxes as follows:
2010
$ 2009
$
Income Tax
Withholding tax deposited 15,116 8,139
Provision for current income taxes - 652
Income tax receivable 15,116 8,791
The following table reconciles income taxes, calculated at the Canadian combined federal and provincial income tax rate
and the U.S. combined federal and state tax rate, to the income tax expense reported in the consolidated statement of
income and deficit:
2010 2009
$ % $ %
U.S. Income Taxes
Consolidated pre-tax net income 3,728 100.0 198 100.0
Expected tax expense at the combined U.S. federal and state rate 1,342 36.0 72 36.0
Non-deductible expenses 3 0.1 3 1.6
Other 2,978 79.9 868 436.8
Income tax expense 4,323 116.0 943 474.4
Canadian Income Taxes
Non-consolidated pre-tax income (loss) of Canadian entity (36,900) 100.0 (52,785) 100.0
Expected tax expense (recovery) at the combined Canadian federal and provincial rate (11,439) 31.0 (17,419) 33.0
Non-deductible foreign exchange gain 1,416 (3.8) 5,081 (9.6)
Change in valuation allowance 8,582 (23.3) 7,224 (13.7)
Difference between current and future enacted tax rate 1,549 (4.2) 5,042 (9.5)
Other (108) 0.3 72 (0.2)
Income tax expense - - -
As of December 31, 2010, the Corporation had the following net operating loss carry forwards for Canadian tax purposes
that are scheduled to expire in the following years:
$
2014 17,668
2015 21,077
2026 24,358
2027 24,717
2028 29,968
2029 28,527
2030 26,740
Net operating loss carry forwards 173,055
Losses related to the Canadian entity may only be used to offset the future income of the Canadian entity for Canadian
income tax purposes.
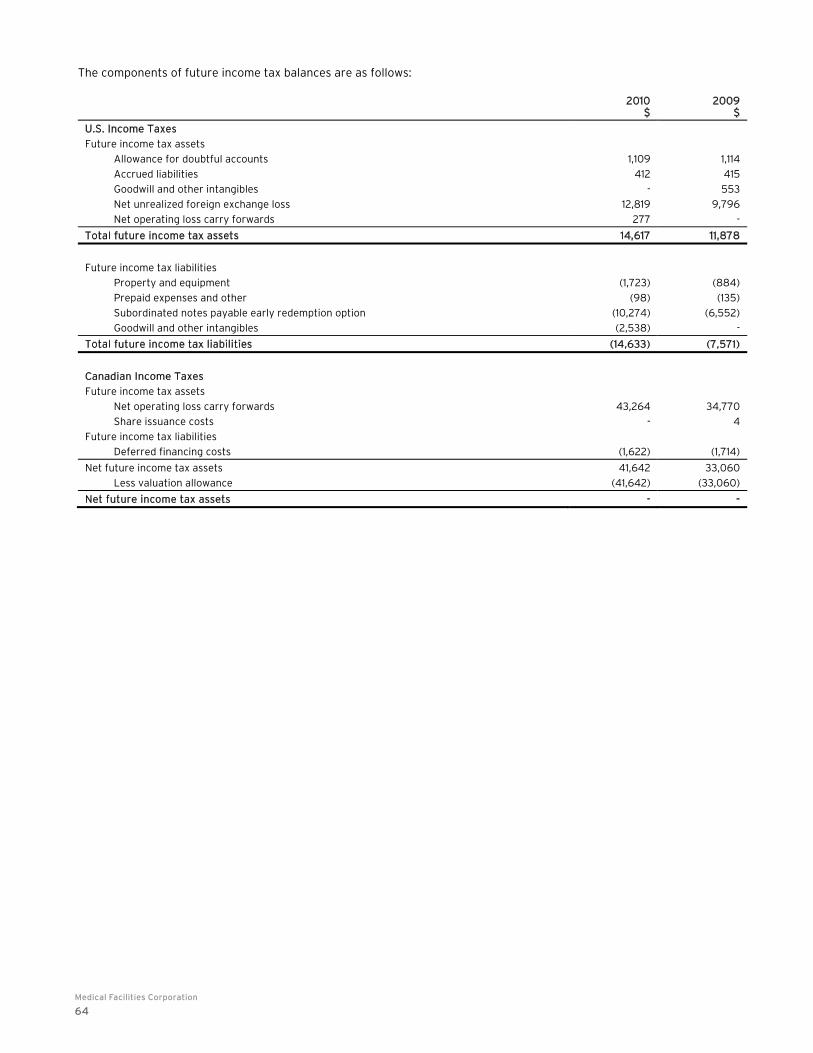
Medical Facilities Corporation
64
The components of future income tax balances are as follows:
2010
$ 2009
$
U.S. Income Taxes
Future income tax assets
Allowance for doubtful accounts 1,109 1,114
Accrued liabilities 412 415
Goodwill and other intangibles - 553
Net unrealized foreign exchange loss 12,819 9,796
Net operating loss carry forwards 277 -
Total future income tax assets 14,617 11,878
Future income tax liabilities
Property and equipment (1,723) (884)
Prepaid expenses and other (98) (135)
Subordinated notes payable early redemption option (10,274) (6,552)
Goodwill and other intangibles (2,538) -
Total future income tax liabilities (14,633) (7,571)
Canadian Income Taxes
Future income tax assets
Net operating loss carry forwards 43,264 34,770
Share issuance costs - 4
Future income tax liabilities
Deferred financing costs (1,622) (1,714)
Net future income tax assets 41,642 33,060
Less valuation allowance (41,642) (33,060)
Net future income tax assets - -
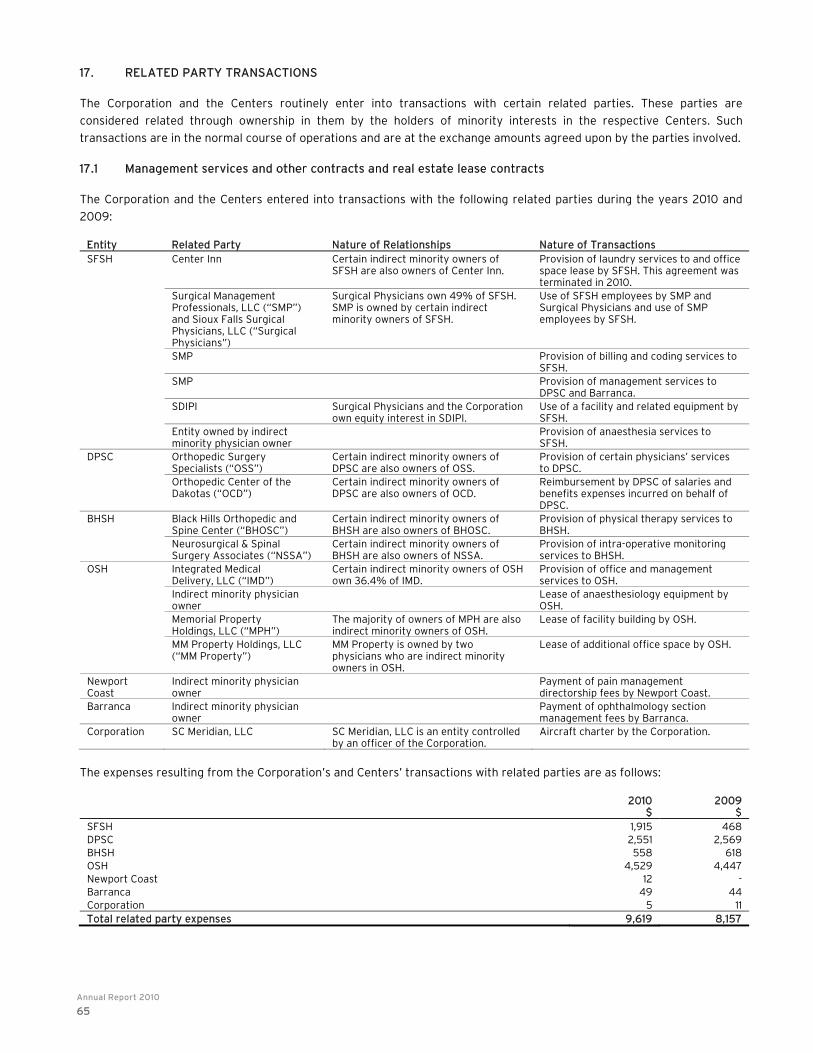
Annual Report 2010
65
17. RELATED PARTY TRANSACTIONS
The Corporation and the Centers routinely enter into transactions with certain related parties. These parties are
considered related through ownership in them by the holders of minority interests in the respective Centers. Such
transactions are in the normal course of operations and are at the exchange amounts agreed upon by the parties involved.
17.1 Management services and other contracts and real estate lease contracts
The Corporation and the Centers entered into transactions with the following related parties during the years 2010 and
2009:
Entity Related Party Nature of Relationships Nature of Transactions SFSH Center Inn Certain indirect minority owners of
SFSH are also owners of Center Inn. Provision of laundry services to and office space lease by SFSH. This agreement was terminated in 2010.
Surgical Management Professionals, LLC (“SMP”) and Sioux Falls Surgical Physicians, LLC (“Surgical Physicians”)
Surgical Physicians own 49% of SFSH. SMP is owned by certain indirect minority owners of SFSH.
Use of SFSH employees by SMP and Surgical Physicians and use of SMP employees by SFSH.
SMP Provision of billing and coding services to SFSH.
SMP Provision of management services to DPSC and Barranca.
SDIPI Surgical Physicians and the Corporation own equity interest in SDIPI.
Use of a facility and related equipment by SFSH.
Entity owned by indirect minority physician owner
Provision of anaesthesia services to SFSH.
DPSC Orthopedic Surgery Specialists (“OSS”)
Certain indirect minority owners of DPSC are also owners of OSS.
Provision of certain physicians’ services to DPSC.
Orthopedic Center of the Dakotas (“OCD”)
Certain indirect minority owners of DPSC are also owners of OCD.
Reimbursement by DPSC of salaries and benefits expenses incurred on behalf of DPSC.
BHSH Black Hills Orthopedic and Spine Center (“BHOSC”)
Certain indirect minority owners of BHSH are also owners of BHOSC.
Provision of physical therapy services to BHSH.
Neurosurgical & Spinal Surgery Associates (“NSSA”)
Certain indirect minority owners of BHSH are also owners of NSSA.
Provision of intra-operative monitoring services to BHSH.
OSH Integrated Medical Delivery, LLC (“IMD”)
Certain indirect minority owners of OSH own 36.4% of IMD.
Provision of office and management services to OSH.
Indirect minority physician owner
Lease of anaesthesiology equipment by OSH.
Memorial Property Holdings, LLC (“MPH”)
The majority of owners of MPH are also indirect minority owners of OSH.
Lease of facility building by OSH.
MM Property Holdings, LLC (“MM Property”)
MM Property is owned by two physicians who are indirect minority owners in OSH.
Lease of additional office space by OSH.
Newport Coast
Indirect minority physician owner
Payment of pain management directorship fees by Newport Coast.
Barranca Indirect minority physician owner
Payment of ophthalmology section management fees by Barranca.
Corporation SC Meridian, LLC SC Meridian, LLC is an entity controlled by an officer of the Corporation.
Aircraft charter by the Corporation.
The expenses resulting from the Corporation’s and Centers’ transactions with related parties are as follows:
2010
$ 2009
$ SFSH 1,915 468 DPSC 2,551 2,569 BHSH 558 618 OSH 4,529 4,447 Newport Coast 12 - Barranca 49 44 Corporation 5 11 Total related party expenses 9,619 8,157

Medical Facilities Corporation
66
The amounts payable to or receivable from the related parties are as follows:
2010
$ 2009
$
SFSH 1,383 49
DPSC (9) (9)
BHSH 51 25
OSH 218 198
Total payable to or (receivable from) related parties 1,643 263
17.2 Other transactions
Certain of the physicians, who indirectly own the minority interest in each of the Centers, routinely provide professional
services directly to patients utilizing the facilities of the Centers and reimburse the Centers for the space and staff utilized.
Also, certain of the physicians serve on the boards of management of the Centers and three such individuals perform the
duties of Medical Director at the respective Centers and are compensated in recognition of their contribution to the
Centers.
Included in the balance of “Prepaid expenses and other” is a note receivable from Oklahoma Physical Therapy (“OPT”) in
the amount of $148. Certain owners of OPT are also indirect minority owners of OSH.
18. COMMITMENTS AND CONTINGENCIES
18.1 Commitments
In the normal course of operations, the Centers lease certain equipment under non-cancellable long-term leases and enter
into various commitments with third parties. In addition, certain of the Centers lease their facility space from related
(note 0) and non-related parties. Minimum payments for these leases are detailed in “Liquidity risk” section in note 13.4.5.
18.2 Contingencies
In the normal course of business, the Centers are, from time to time, subject to allegations that may result in litigation.
Certain allegations may not be covered by the Centers’ commercial and liability insurance. The Centers evaluate such
allegations by conducting investigations to determine the validity of each potential claim. Based on the advice of the legal
counsel, management records an estimate of the amount of the ultimate expected loss for each of these matters. Events
could occur that would cause the estimate of the ultimate loss to differ materially from the amounts recorded.
19. LOSS (GAIN) ON FOREIGN CURRENCY
Loss (gain) on foreign currency included in the statement of income and deficit consists of the following:
2010
$ 2009
$
Unrealized loss (gain) on subordinated notes payable 9,010 21,789
Unrealized loss (gain) on convertible secured debentures 2,320 5,610
Unrealized loss (gain) on foreign exchange forward contracts (2,496) (14,549)
Unrealized loss (gain) on foreign currency 8,834 12,850
Realized loss (gain) on foreign exchange forward contracts which matured in the current period (1,293) 1,106
Translation loss (gain) on cash balances denominated in Cdn$ (316) (1,094)
Loss (gain) on foreign currency 7,225 12,862

BOARD OF DIReCTORS
Seymour Temkin (Chair)
Consultant
Frank Cerrone
Senior Vice-President
General Counsel & Secretary
Revera Inc.
Alan Dilworth
Corporate Director
Dr. Gil Faclier
Anaesthetist-in-Chief
Sunnybrook Health Sciences Center
Irving Gerstein
Member, Senate of Canada
Corporate Director
Dr. Donald Schellpfeffer
Chief Executive Officer
Medical Facilities Corporation
Dr. Larry Teuber
President
Medical Facilities Corporation
exeCuTIve OFFICeRS
Dr. Donald Schellpfeffer
Chief Executive Officer
Dr. Larry Teuber
President
Michael Salter
Chief Financial Officer
HeAD OFFICe
333 Bay Street, Suite 3400
Toronto, Ontario
Canada M5H 2S7
STOCk exCHANGe LISTING
The Toronto Stock Exchange
Units: DR.UN
Convertible Debentures: DR.DB
AuDITOR
KPMG LLP
333 Bay Street, Suite 4600
Toronto, Ontario
Canada M5H 2S5
TRANSFeR AGeNT AND ReGISTRAR
Computershare Trust Company of Canada
100 University Avenue
Toronto, Ontario
Canada M5J 2Y1
INveSTOR INFORMATION
Unitholders or other interested parties
seeking information about the Corporation
are invited to contact:
Salvador Diaz
TMX Equicom
1.800.385.5451 ext. 242
ANNuAL uNITHOLDeRS’ MeeTING
May 13, 2011 at 11:00 a.m. ET
The Design Exchange — Patty Watt Room
234 Bay Street
Toronto, Ontario
Canada M5K 1B2
Corporate Information

www.medicalfacilitiescorp.ca
1·877·402·7162


![A Study of CAP-1002 in Ambulatory and Non-Ambulatory ......A Study of CAP-1002 in Ambulatory and Non-Ambulatory Patients with Duchenne Muscular Dystrophy [HOPE-2]Updated Results from](https://static.documents.pub/doc/80x56/611adb8f213d9e39d9203755/a-study-of-cap-1002-in-ambulatory-and-non-ambulatory-a-study-of-cap-1002.jpg)


