2010-2014 Hornsby Shire Council Delivery Program Creating a living environment Photo credits: Firey by Andrew Vincent, See Mee by Margaret Patterson, Friends by Peg Wilson Adopted 30 June 2010
Transcript
2010-2014
Hornsby Shire CouncilDelivery ProgramCreating a living environment
Photo credits: Firey by Andrew Vincent, See Mee by Margaret Patterson, Friends by Peg Wilson
Adopted 30 June 2010
Hornsby Shire CouncilABN 20 706 996 972
Contact details
In person The Administration Centre 296 Pacific Highway, Hornsby NSW 2077
Customer service desks are open from 8.30am - 5.00pm business days
Projects to be funded by the proposed infrastructure levy ............................................... 13
Our Framework for a Sustainable Future ........................................................................ 14
Council operations ....................................................................................................... 16
SERVICE PROFILES
Ecology ...................................................................................................................... 18Environmental Sustainability and Health .......................................................................... 19Water Catchments ......................................................................................................... 22Bushland and Biodiversity ............................................................................................... 25Fire Control ................................................................................................................... 28Environment Customer Service and Administration .......................................................... 30
Economy ..................................................................................................................... 32Development and Town Planning Services ...................................................................... 33Property Development ................................................................................................... 36
Society and Culture ................................................................................................... 39Community Services ..................................................................................................... 40Aquatic and Recreation Centres .................................................................................... 43Library and Information Services ................................................................................... 47Nursery and PreSchools ................................................................................................ 50Community Relations .................................................................................................... 52Parks and Landscape ................................................................................................... 55
Human Habitat ............................................................................................................ 59Design and Construction................................................................................................. 60Assets ......................................................................................................................... 63Engineering Services .................................................................................................... 67Traffic and Road Safety ................................................................................................. 70Waste Management ..................................................................................................... 73Property Cleansing ....................................................................................................... 76Works Administration ................................................................................................... 78
OVERVIEW
4 HORNSBY SHIRE COUNCIL
DELIVERY PROGRAM 2010-2014
SERVICE PROFILES cont’d Page no.
Governance ................................................................................................................. 80Leadership - Office of the General Manager ................................................................... 81Corporate Strategy ....................................................................................................... 84Human Resources ........................................................................................................ 86Information Systems ..................................................................................................... 88Financial Services ......................................................................................................... 91Corporate Administration ............................................................................................... 94
FINANCIAL INFORMATION
Resourcing Information ................................................................................................ 98
Hornsby Council’s Delivery Program is closely aligned to the Hornsby Shire Community Plan developed by the communities of
Hornsby. The Delivery Program is the point where the community’s strategic goals in the Community Plan are systematically
translated into actions (DLG 2009). The Delivery Program, including annual Operational Plan, covers a four-year period and is
reviewed annually.
The Hornsby Delivery Program is the single point of reference for all activities undertaken by Council. All plans, projects, activities
and funding allocations are directly linked to the Delivery Program. Supporting the Delivery Program is the annual Operational
Plan. It spells out the details of the Program – the individual projects and activities that will be undertaken each year to achieve
the commitments made in the Delivery Program (DLG 2009). At Hornsby Council our Delivery Program includes and incorporates
the Annual Operational Plan.
Your councillors are committed to improving Hornsby’s ageing infrastructure and building new facilities to meet the changing
needs of the community, recognising that modern well functioning infrastructure has a profound effect on the wellbeing of the
Shire. In December 2009 Council determined to seek approval from the Minister for Local Government for a rate increase of 5.8%
(an increase of about $60 -$70 per year for the average household), to be known as an infrastructure levy, commencing in July
2010, for 20 years in order to fund significant infrastructure improvements.
The three major projects to be funded by the infrastructure levy are:
• The replacement of the Hornsby Aquatic Centre
• The replacement of the Hornsby pedestrian overbridge
• The development of recreational facilities in Old Mans Valley
Councillors also proposed that a total of $1.5 million be allocated to each ward for the first two years of the levy for local
infrastructure projects. The proposed projects to be funded were determined by Ward Councillors taking into account community
preference, sustainability principles and community benefit. A list of proposed projects is on page 12.
The Ministerial decision not to approve the infrastructure levy was announced on 2nd July 2010. This decision will seriously impact
on Council’s ability to provide the services and facilities expected by the community, and will hamper Council’s efforts to improve
the Shire’s ageing infrastructure.
Nick Berman Robert BallMAYOR GENERAL MANAGER
Executive Overview
OVE
RVI
EWSE
RVI
CE
PRO
FILE
SFI
NAN
CIAL
INFO
RM
ATIO
NLE
GIS
LATI
VE
REQ
UIR
EMEN
TS
1
2
3
4
7HORNSBY SHIRE COUNCIL
DELIVERY PROGRAM 2010-2014
Hornsby aquatic centre
Hornsby pedestrian overbridge
Old Mans Valley
Executive Overview
OVERVIEW
8 HORNSBY SHIRE COUNCIL
DELIVERY PROGRAM 2010-2014
Hornsby at a glance
Hornsby Shire is located 25 kms north of the Sydney CBD,
with the Hawkesbury River forming its northern boundary.
The Shire includes major centres such as Hornsby itself,
secondary centres such as Pennant Hills and Epping,
along with villages, islands, river communities and a large
rural district stretching from Dural to Wisemans Ferry.
The traditional custodians of the area are the Dharug and
Guringai peoples and many of the place names in the Shire
are derived from aboriginal words.
Hornsby Shire is known as The Bushland Shire. Of its
510 square kilometres, more than 65% is bushland. This
includes the 4,000 hectare Berowra Valley Regional Park
jointly managed by Hornsby Shire Council and the National
Parks and Wildlife Service. Major waterways include the
Hawkesbury River, Berowra Creek and Marramarra Creek.
Approximately 10% of the Shire is zoned and used for
urban development, 14% for rural purposes, 5% for open
space and the remainder is zoned environmental protection
or national park.
People and the Economy
The Australian Bureau of Statistics 2006 Census figures
(estimated population) show the population of Hornsby is
ageing. Nearly 25% of Hornsby residents were 55 years
or over and the median age (the age at which half the
population falls above and half below) has risen from 36
years in 2001 to 38 years in 2006.
Over 40,000 people work in the Shire, and of those workers
50% also live in the Shire. Ten per cent of workers travel
from the Central Coast to work in Hornsby, similarly another
10% of workers come from the Baulkham Hills area. Of
the 40,000 people working in the Shire over 6,000 are
employed in the Hornsby town centre, including Westfield.
According to the Census figures the most common
industries of employment for persons aged 15 years and
over usually resident in the Hornsby area are retail trade
(19.17%), health and community (15%), property and
business services (11.96%), education (11.93%), and
manufacturing (9.22%).
Shire (established 1906) 510 sq km Households Over 51,000
Population (2006 Census - estimated population)
157,387Households with internet connection
Over 30,000
Number of rateable properties (commercial and residential)
56,000Sealed roadsUnsealed roadsPaved footpaths
613 km36 km
413 km
Suburbs/localities 41 Council child care facilities 5
LibrariesParksPlaying fieldsPlaygrounds
5186
55135
Public wharvesFloating pontoonsBoat launching ramps
653
Hornsby at a glance
OVE
RVI
EWSE
RVI
CE
PRO
FILE
SFI
NAN
CIAL
INFO
RM
ATIO
NLE
GIS
LATI
VE
REQ
UIR
EMEN
TS
1
2
3
4
9HORNSBY SHIRE COUNCIL
DELIVERY PROGRAM 2010-2014
Hornsby at a glance
Hornsby Mall attracts approximately 16.3 million customers
per year to the centre, hence the Hornsby town centre is
recognised as the major retail and commercial centre in
the Shire.
Hornsby Shire residents have a high level of economic
advantage in comparison to most other areas of Sydney,
with 73.5% of residents either owning or purchasing their
own homes.
Lifestyle
Hornsby has a range of sporting, recreational and cultural
opportunities for its citizens and visitors. There are
around 174 parks in Hornsby plus 12 garden parks, 55
separate playing fields and over 135 playgrounds. Also
there is a modern indoor recreation centre called Brickpit
at Thornleigh and 3 public swimming pools at Hornsby,
Galston and Epping, as well as the pool at Cherrybrook
constructed on Council land leased to the Carlisle
organisation.
In addition there are 25 community centres in the Shire, 20
of which are operated by community committees on behalf
of Council, with Council directly operating the remainder.
This network of community centres is used by a wide cross
section of community groups to meet and pursue mutual
interests.
Hornsby Council has five libraries, located at Hornsby,
Epping, Pennant Hills, Galston and Berowra. The libraries
attract over 1.2 million visits per year and approximately
73,000 people are members of the libraries.
Hornsby Council operates five child care facilities across
the Shire. These facilities include Long Day Care Centres
(Nursery and Preschools) and an Early Childhood Education
Centre. The child care facilities are funded by the NSW
Department of Community Services, the NSW Department
of Education and Training, the Commonwealth Department
of Family and Community Services, fees from parents and
support from Council.
There are over 613 kms of sealed roads and 36 kms of
unsealed roads in the Shire and more than 410 kms of
paved footpaths. Council has 6 sealed public car parks,
a pedestrian overbridge, 2 minor road bridges and 11
major culverts. Council also maintains 6 public wharves,
5 floating pontoons, 3 boat launching ramps and a
loading dock. Hornsby has an extensive drainage system
comprising over 18,000 pits and 390 kms of pipelines.
Looking ahead
In looking to the future the focus for Hornsby Council will
remain on sustainability, community wellbeing and the
provision of quality infrastructure, services and facilities.
Hand in hand with community wellbeing is the provision
of good quality infrastructure and civil assets. Council
has committed to action to improve Hornsby’s ageing
infrastructure and build facilities to meet the changing
needs of the community. In December 2009 Council
determined that it would approach the Minister for Local
Government seeking approval for a rate increase of 5.8%
(an increase of about $60-$70 per year for the average
household), commencing in July 2010 for 20 years. More
information on projects to be funded if the infrastructure
levy is approved is on page 12.
Work will also continue on the Housing Strategy and
the North Subregional Strategy to meet the NSW State
Government targets of an additional 11,000 dwellings and
9,000 jobs within the Shire by 2031, while at the same
time protecting Hornsby’s rural lands, particularly those
areas of viable primary production.
The Housing Strategy identifies areas suitable for additional
housing within the context of respecting environmental and
infrastructure constraints. It does this by taking advantage
of existing settlement patterns and current investment in
transport and other infrastructure. In essence the Housing
Strategy provides the community and the development
industry with a clear framework for how the future housing
needs of Hornsby Shire will be accommodated over the
next decade.
OVERVIEW
10 HORNSBY SHIRE COUNCIL
DELIVERY PROGRAM 2010-2014
Councillors
B Ward CouncillorsB Ward consists of the following suburbs: Asquith*, Castle Hill,* Cherrybrook*, Dural*, Glenhaven*, Hornsby*, Normanhurst*, Pennant Hills*, Thornleigh*, Wahroonga*, Waitara*, Westleigh (*Ward boundaries pass through these suburbs, meaning they belong to more than one ward).
C Ward CouncillorsC Ward consists of the following suburbs: Beecroft, Carlingford, Cheltenham, Cherrybrook*, Eastwood, Epping, Normanhurst*, North Epping, Pennant Hills*, Thornleigh*, West Pennant Hills (*Ward boundaries pass through these suburbs, meaning they belong to more than one ward).
Cr Robert Browne, Cr Michael Hutchence, Cr Andrew Martin
Cr Andrew Martin 0466 008 376PO Box 37, Hornsby 1630email: [email protected]
CrCrCrCrCrCCrCrCrCCrCrCrrCrCrCrrC R R R R R RRR RR RRRRRRRR RRRRRRRRRRRRRRRRRRRRRRR boboboooooooobooobobobooboobboobbbboboooooooooobobbobobbbbbbobboboooobbobobobobobbobbbbbobobbbboooobobbobbbbbbbobbbboboobobbobbobbobbbbbbbobobbooooooboobbbbbbbbbbbbbboooooboobobbbbobbbbbbobbbooooooooooobobobbbbbboooooooooobobbbbobbbbbbbooooooooooobbbbbobobbbbboooooooooobbbbbbbobobboooooobbbbbbbbboooooooooobbbbbbbobbbboboooooobbbbbobbbbbooooooobbbbooooooooobobbobbbbbooooooobbbbobbbooooooooooobbbboooooooooobbbbbbooooooobbbobbbbboooooooobobbbboboooooobbbbbbooobbbbbbbooooooooobbbboooooooooobbbooooooooooobobbboooooooooobboooooooobbbbooooooooobbbooobbooobbboooobbooooooooooobererererererererererrereereereereererrerererrt t tt t t t ttt ttttt t ttt BrBrBrBBrBrBBBBBrBrBrBrBrBrBrBrBBrBrBrBBBBrBrBrBrBBBBrrBrBrBrBBrBrrrBrBrBBBrBBrBrrBBrrBrrrBrrrrrrBBrrrBrBrowowowowowowowowowowooowowowowowoowooowowowwwwowowowowowowowowowoowoowowoowowwoowoowowowwowooowowowwoowowoowwowooowowwwowowww ccccccccccccccccccccccccccccccccccccccccccccccccccccccccccccccccccccccccccccccccchhhhhhhhhhhhhhahahahahahahahhhhhhhhhhhhhhhhahahahahhhhhhhhhhhhhhahhhhhhhhhhahhhhhahhhhhhahhhhhhhahhhhahhhhhhhahhhhhhhhahhhhhhhahhhaahhhhhhhhhhhhhhhhhhhhhhhhhhhhhhhhhhhhaahhhhhhhh eleleleleleleelelellelelelelellelelelelelelleleleleleeleellelleeleleeeleeleellellelllele HHHH H H H HH HHHH H H HHHH HHH HHHHH H HHH HHH HHHHHHHHHHHHHHHHHHHHHHHHHHHHHHHHHHH HHHHHHHHHHHHHHHHHHutuututututututututututuututututututututtututututuutuutututututututututuuututututuutututuutuuuuttttututuuutuutuuututuuuutuuttuutuuuutuuu chchchchchchchcchchchchchchhchchhchchchcchchchchchchchchchchchchchhchcchchchchcchhchhccchchchchcchccchchchccchchheneeneneeneeneneneneneneneneneneneenenenenennneeneneeneeneneneneneneneneeneneneneeennnnenneeeeneenenneneewwwwwwwwwwwwwwwwwwwwwwwwwwwwwwwwwwwwwwwwwwwwwwwwwwwwwwwwwwwwwnennenenenenenenenenenenneneeneneneneeeenenennenenneneeeeeneneneneneneneneenenneneneneeeeneneneneneeneneeeneeneeneneeeeeneenneneneeeeneene, , ,,,,,, , ,, ,, ,,,,,,, CrCrCrCrCrCrCCCCrCCrCrCrCrCrCrCrCrCCrCrrCrCrCrCrCrCrCCCCrCCrCrCCrCCCCCrCCCrCCrCCrCCCrCCrCrCrCCCCCCCCCCCCC M M MMM M MMMM M M MMM MMM MMicicicicciciciciciccccci CrCrCrCrCrrCrCrCrrCrCrrCCrCrr A AA A A AAAA A AAAA AA AAAAAAAnndndndndndndndndndndndnddddndnddddndnnddddrrrrrrrerererererererererrererrereerrrerererereereeeereerreeeerrr w w www w w w ww w w w w w w w wwwwwwwwww w www w w wwwwwwwww MaMaMaMaMaMaMaMaMaMaMaMaMaMaMaMaMMMaMaMaMaMaMaMaMaMMaMaMaMaMaMaMaMaMaMaMaaaaMaaaMMaMaMaMMaMMMaaMaaaMM rtrtrtrtrtrtrtrtrtrtrtrtrtrtrtrtrtrtrtrtrtrttrtrtrtrrtttrtrtrtrtttrtrtrtttrtrttttrtttttrrttrtttininininiininininininininininininnininiininininininninninnininininninnnninnininnnninnniiininiinnniinnnnnnnnnnnnnnnnnnnnnnnnnnnnnnnnnnnnnnnnnnnnnnnnnnnnnnnncececececececccecccecececececeececececececececeececeeccceceeeecececeeccccecececcececccceceeceeccceeeec , , , ,, , , , , ,, , , CCCCCCCCCCCCCCCCCC
A Ward CouncillorsA Ward consists of the following suburbs: Arcadia, Asquith*, Berrilee, Berowra, Brooklyn, Canoelands, Castle Hill*, Cowan, Dangar Island, Dural*, Fiddletown, Forest Glen, Galston, Glenhaven*, Glenorie, Hornsby*, Hornsby Heights, Laughtondale, Maroota, Middle Dural, Mt Colah, Mt Kuring-gai, Singletons Mill, Wahroonga*, Waitara*, Wisemans Ferry (*Ward boundaries pass through these suburbs, meaning they belong to more than one ward).
ke Park, Castle Park, Castyground refurbiound refur
4Greenway Parreenway PCar park anCar parkPurchasPurch
ad14
Ch
- - hoolhool
ly20
1y 20
OVERVIEW
14 HORNSBY SHIRE COUNCIL
DELIVERY PROGRAM 2010-2014
Our Framework for a Sustainable Future
Our values are our standards and priorities. They guide what we do and the way in which we do it.
• We strive to meet the needs of our customers in a professional and ethical manner
• We provide courteous and efficient service
• We support Councillors in an impartial and professional manner
• We provide a safe and satisfying work environment
• We recognise effort and achievement
• We deal with our suppliers in a mutually beneficial manner
Hornsby Shire 2020: Our Framework for a Sustainable Future
To accommodate the community aspirations and support Council in working with community, business and other levels of
government, combining effort and resources to achieve shared sustainability goals and outcomes for the Shire and region Council
has developed a strategic planning framework called Hornsby Shire 2020: Our Framework for a Sustainable Future (‘Hornsby
Shire 2020’).
A key component of Hornsby Shire 2020 is the The Planning WebTM. The Planning WebTM encompasses key community values,
sustainability principles, our strategic intent and our aims for a sustainable Hornsby Shire. The aims relate to five key themes
based on the sustainability elements of Ecology, Economy, Society and Culture, Human Habitat and Governance. The key aims for
each of the five key themes are:
Create a sustainable Hornsby Shire
Ecolo gy - protect and enhance our natural environment
Economy - encourage a resilient local economy and sustainable resource use
Society and Culture - enhance our social and community wellbeing
Human Habitat - provide effective community infrastructure and services
Governance - guide towards a sustainable future
The Planning WebTM is Council’s strategic guide for informing its:
• Delivery Program, major strategies and programs
• decision-making and day to day action
• development assessment and reporting process
• focus on regional planning and development
• work with the community, other levels of government and stakeholders
• education, communication and learning for sustainability
OVE
RVI
EWSE
RVI
CE
PRO
FILE
SFI
NAN
CIAL
INFO
RM
ATIO
NLE
GIS
LATI
VE
REQ
UIR
EMEN
TS
1
2
3
4
15HORNSBY SHIRE COUNCIL
DELIVERY PROGRAM 2010-2014
The Planning Web and the Guiding Principles are from the Hornsby Shire 2020: Our Framework for a Sustainable Future
Our Framework for a Sustainable Future
OUR GUIDINGPRINCIPLES
To promote choices with benefits now and in the future To provide opportunities for communication, participation and social equity To support the wellbeing of our community and the health of our environment To identify and meet challenges and consider and manage risk To lead by example and support learning for sustainability
‘The Planning Web’™ P. Cuming 1996 Sustainable Futures Australia February 2009
The Planning WebTM creates the strategic framework for our planning, integrating our medium-term plans and strategies through
our operational plans, projects and services. This enables consistent and comprehensive review and reporting on how our day-
to-day actions are helping to achieve Council’s aims of a sustainable Hornsby Shire.
As well as helping to integrate Council’s actions, the Planning WebTM supports Council working with community, business and
other levels of government, combining effort and resources to achieve shared sustainability goals and outcomes for the Shire and
region. In this way partnerships, alliances and cooperative action can more effectively develop, support and implement strategies,
programs and projects.
This integration of planning and action is vital to tackle common challenges such as climate change and protect the valued
characteristics of our communities and lifestyles, and importantly the natural environment.
OVERVIEW
16 HORNSBY SHIRE COUNCIL
DELIVERY PROGRAM 2010-2014
Council operations
Council delivers many essential local services funded mainly through the collection of rates. By virtue of Council’s diversity and
the enormous spread of responsibilities, the Council touches everyone’s lives in some way on a frequent basis.
Council acknowledges and respects the important role it plays in the community and is careful to exercise responsibilities in a
prudent and empathetic way, recognising that it must deal with competing demands in an environment of constant change, high
expectations and limited resources.
All the services of Council, including business activities, are grouped in this Delivery Program and annual Operational Plan
according to the outcomes desired by the community and the Hornsby 2020 Planning Web.
The following pages provide details on each key service, including a brief service profile, key operational indicators, operational
expenditure and income for the coming four years, proposed service initiatives for four years and, where appropriate, capital works
proposed for the coming four years.
HORNSBY SHIRE COUNCIL
DELIVERY PROGRAM 2010-201417HORNSBY SHIRE COUNCIL
DELIVERY PROGRAM 2010-2014
SERVICE PROFILES
SERVICE PROFILES
18 HORNSBY SHIRE COUNCIL
DELIVERY PROGRAM 2010-2014
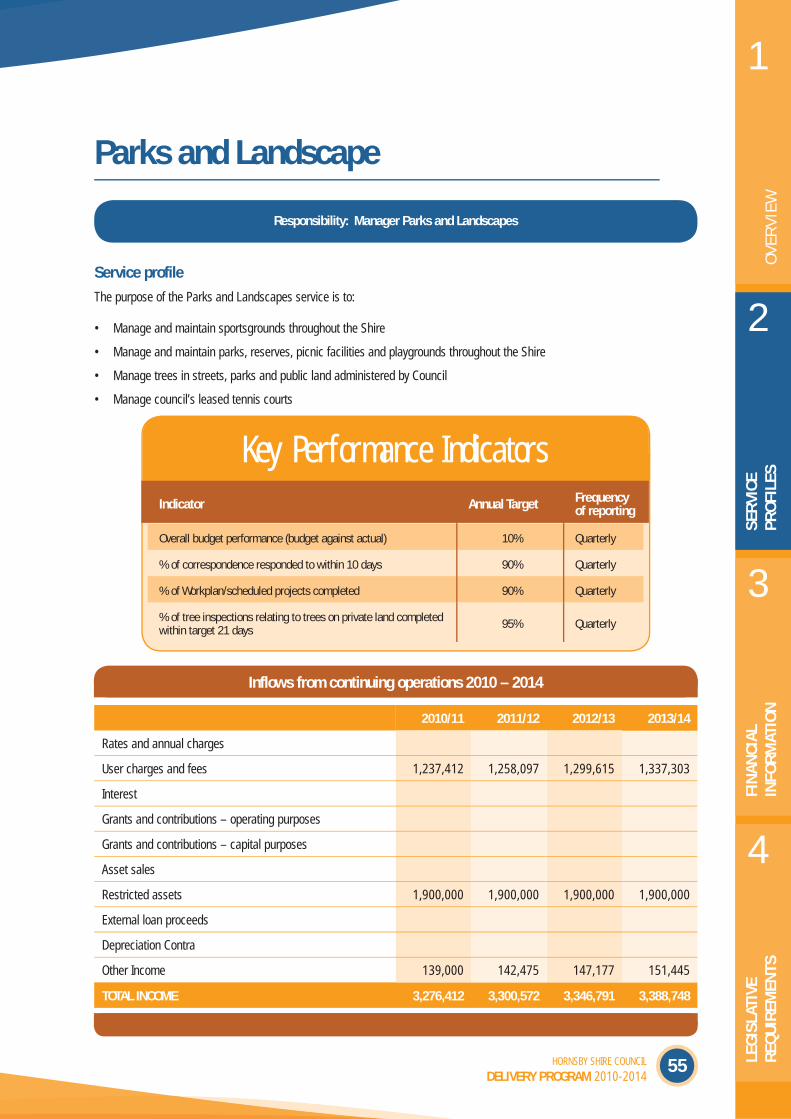
EcologyProtect and enhance our natural environment
With almost two thirds of the Shire consisting of native bushland, it is not surprising that the community appreciates the natural
beauty of the area and wants the natural environment protected and cared for.
Outcomes desired by the community
Goal 1 Protect and enhance biodiversity
We conserve native plant and animal communities, understanding their value and services
help to sustain our existence. We work to minimise threats posed to biodiversity, partnering
with the community and other agencies to maintain diversity and achieve positive conservation
outcomes.
Goal 2 Maintain healthy waterways and catchments
We protect the landscapes and health of our waterways and catchments, including the
Hawkesbury River, Berowra Creek and associated tributaries, applying a total water-cycle
management approach to maintain water quality in our creeks, wetlands and rivers.
Goal 3 Reduce our ecological footprint
We lead the community and work to reduce the impact of our ecological footprint, supporting
sustainable use of natural resources and reduction of waste, striving towards our emission
reduction targets for energy and water, and using renewable, non-polluting resources.
Services of Council that directly and primarily contribute to Ecology are:
• Environmental Sustainability and Health • Water Catchments • Fire Control
• Bushland and Biodiversity • Environment Administration
OVE
RVI
EWSE
RVI
CEPR
OFI
LES
FIN
ANCI
ALIN
FOR
MAT
ION
LEG
ISLA
TIVE
REQ
UIR
EMEN
TS
1
2
3
4
19HORNSBY SHIRE COUNCIL
DELIVERY PROGRAM 2010-2014
Environmental Sustainability and Health
Service profile
The Environmental Sustainability and Health Team is proactive in working in partnership with the community and Council to
foster the protection and improvement of health and the environment. The Environmental Sustainability and Health Team does
this through a holistic and progressive approach to education, compliance and innovative technical solutions, striving towards
sustainability. The principal activities of the team include:
• Protecting the environment and responding to environmental pollution and public health incidents
• Managing companion animals
• Inspecting food shops as per the Food Act 2003
• Undertaking environmental and health impact assessments of development applications
• Contributing to the management of public health and public cemeteries
• Providing support and direction to the policy and management issues of sustainability
• Implementing energy conservation programs
• Undertaking the Sustainable Business Program
Responsibility: Manager Environmental Sustainability and Health
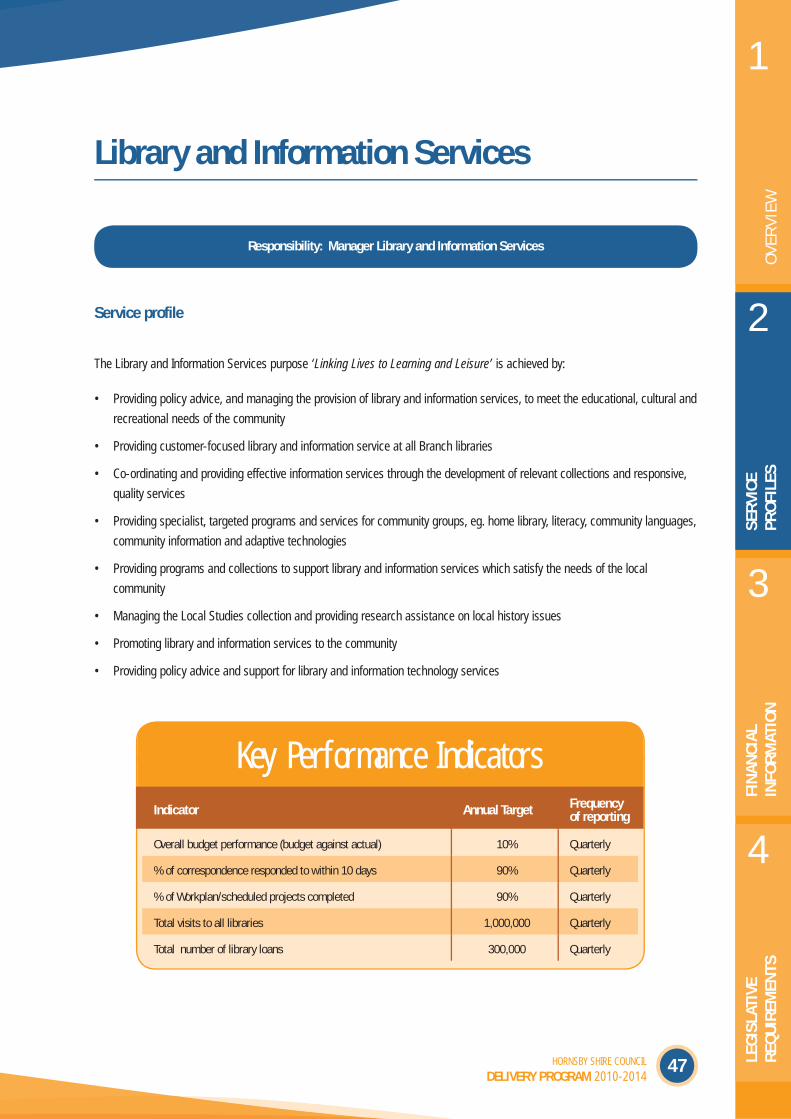
Key Performance IndicatorsIndicator Annual Target Frequency
of reporting
Overall budget performance (budget against actual) 10% Quarterly
% of correspondence responded to within 10 days 90% Quarterly
% of Workplan/scheduled projects completed 90% Quarterly
Number of community members participating in Council’s sustainability initiatives, target is 3,500 pa across Council - Branch target is 700 pa
700 Quarterly
% of identified dogs over six months that are lifetime registered against a target of 80% 80% Quarterly
% of high and medium risk food business inspections undertaken against target of 90% 90% Quarterly
% of Council’s greenhouse gas emissions abated - target of 30% reduction below 1995/96 emission levels by 2019/2020 <30% 1995/96 Annual
% of local trips (less than 5km) by local residents using sustainable transport options (walking, riding, public transport) - to be reported by Corporate Strategy Branch
>25% Biennial
SERVICE PROFILES
20 HORNSBY SHIRE COUNCIL
DELIVERY PROGRAM 2010-2014
Environmental Sustainability and Health
Inflows from continuing operations 2010 – 2014
2010/11 2011/12 2012/13 2013/14
Rates and annual charges
User charges and fees 385,000 394,625 407,648 419,469
Interest
Grants and contributions – operating purposes 149,480 153,217 158,274 162,863
Employee benefits and on costs 1,422,691 1,553,634 1,609,793 1,671,134
Borrowing expense
Materials and contracts 103,566 110,255 113,894 117,196
Depreciation and amortisation
Internal expenses 130,179 133,434 137,837 114,834
Capital investment
Other expenses 136,765 137,760 138,939 140,228
External loan principal repayments
TOTAL EXPENSES 1,793,201 1,935,083 2,000,463 2,073,393
Inflow/(Outflow) from continuing operations -1,446,167 -1,574,587 -1,621,753 -1,675,148
OVE
RVI
EWSE
RVI
CEPR
OFI
LES
FIN
ANCI
ALIN
FOR
MAT
ION
LEG
ISLA
TIVE
REQ
UIR
EMEN
TS
1
2
3
4
21HORNSBY SHIRE COUNCIL
DELIVERY PROGRAM 2010-2014
Environmental Sustainability and Health
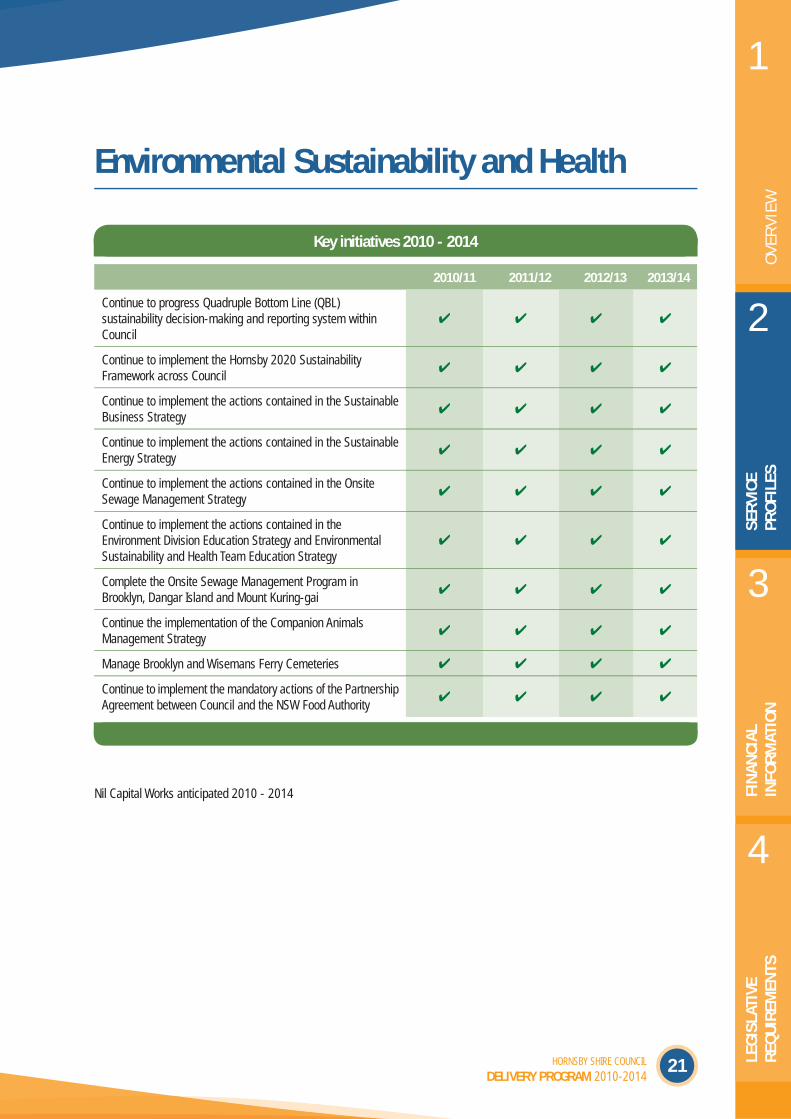
Key initiatives 2010 - 2014
2010/11 2011/12 2012/13 2013/14
Continue to progress Quadruple Bottom Line (QBL) sustainability decision-making and reporting system within Council
Continue to implement the Hornsby 2020 Sustainability Framework across Council
Continue to implement the actions contained in the Sustainable Business Strategy
Continue to implement the actions contained in the Sustainable Energy Strategy
Continue to implement the actions contained in the Onsite Sewage Management Strategy
Continue to implement the actions contained in the Environment Division Education Strategy and Environmental Sustainability and Health Team Education Strategy
Complete the Onsite Sewage Management Program in Brooklyn, Dangar Island and Mount Kuring-gai
Continue the implementation of the Companion Animals Management Strategy
Manage Brooklyn and Wisemans Ferry Cemeteries
Continue to implement the mandatory actions of the Partnership Agreement between Council and the NSW Food Authority
Nil Capital Works anticipated 2010 - 2014
SERVICE PROFILES
22 HORNSBY SHIRE COUNCIL
DELIVERY PROGRAM 2010-2014
Water Catchments
Responsibility: Manager Water Catchments
Service profile
To improve the quality of the waterways and catchments in Hornsby by:
• Providing support and direction to the policy and management issues of the water catchments program
• Monitoring and reporting environmental conditions including water quality for creeks and estuaries
• Constructing water quality remediation devices as per the Catchment Remediation Rate 10 Year Capital Works Program
(2008-2017)
• Implementing water conservation and reuse projects
• Undertaking the Estuary Management program
• Implementing the Total Water Cycle Management Strategy
Key Performance IndicatorsIndicator Annual Target Frequency
of reporting
Overall budget performance (budget against actual) 10% Quarterly
% of correspondence responded to within 10 days 90% Quarterly
% of Workplan/scheduled projects completed 90% Quarterly
Number of community members participating in Council’s sustainability initiatives, target is 3,500 pa across Council - Branch target is 800 pa
800 Quarterly
% of the Shire’s waterways monitored, and proportion found to be healthy 50% Annual
Total water consumption and per capita consumption - target 18% reduction against 1995/96 levels by 2011 <18% 1995/96 Annual
OVE
RVI
EWSE
RVI
CEPR
OFI
LES
FIN
ANCI
ALIN
FOR
MAT
ION
LEG
ISLA
TIVE
REQ
UIR
EMEN
TS
1
2
3
4
23HORNSBY SHIRE COUNCIL
DELIVERY PROGRAM 2010-2014
Water Catchments
Inflows from continuing operations 2010 – 2014
2010/11 2011/12 2012/13 2013/14
Rates and annual charges 2,725,602 2,804,644 2,888,784 2,984,114
User charges and fees
Interest
Grants and contributions – operating purposes
Grants and contributions – capital purposes 725,656 743,797 768,343 790,625
Asset sales
Restricted assets -64,596 -66,211 -68,395 -70,379
External loan proceeds
Depreciation Contra
Other Income
TOTAL INCOME 3,386,662 3,482,231 3,588,731 3,704,359
Outflows from continuing operations 2010 – 2014
2010/11 2011/12 2012/13 2013/14
Employee benefits and on costs 944,295 973,978 1,009,184 1,047,639
Borrowing expense
Materials and contracts 734,000 755,425 780,354 802,984
Depreciation and amortisation
Internal expenses 892,093 914,395 944,570 971,963
Capital investment 1,625,656 1,700,532 1,755,505 1,810,359
Other expenses 221,020 222,627 224,534 226,616
External loan principal repayments
TOTAL EXPENSES 4,417,064 4,566,958 4,714,148 4,859,561
Inflow/(Outflow) from continuing operations -1,030,402 -1,048,727 -1,125,417 -1,155,202
Grayson Road, North Epping Stage 1 - North side - Holland Street to Devon Street
Fagans Road, Arcadia - Upgrading 0.4km of remaining unsealed road
Old Northern Road, Dural - East side - Quarry Road to New Line Road
Capital Works 2010 - 2014- Projects subject to approval of a special rate variation to fund
2010/11 2011/12 2012/13 2013/14
2010/14 4-Year Rolling Footpath Improvement Programs - A Ward (subject to rate variation)
$38,000 $62,000
2010/14 4-Year Rolling Footpath Improvement Programs - C Ward (subject to rate variation)
$90,000 $96,000
2010/14 4-Year Rolling Stormwater Drainage Improvement Programs (Major Projects subject to rate variation)
$550,000 $600,000
Detailed Proposed Capital Works 2010/11
Infrastructure levy refused byy the Minister for LoMinister for Local f t cture levy refused byy the MMinist to rate variation)rate variation
$38,000 $62,000
2010/14 4-Year Rolling Footpath Improvement Programs - C2010/14 4-Year Rolling Footpath Improvement ProgramWard (subje Government on 2nnd July 2010Government o
vement Programs CPrograms C e variation)e variation)
90,000 $96,000
ling Stormwater Dra
OVE
RVI
EWSE
RVI
CEPR
OFI
LES
FIN
ANCI
ALIN
FOR
MAT
ION
LEG
ISLA
TIVE
REQ
UIR
EMEN
TS
1
2
3
4
67HORNSBY SHIRE COUNCIL
DELIVERY PROGRAM 2010-2014
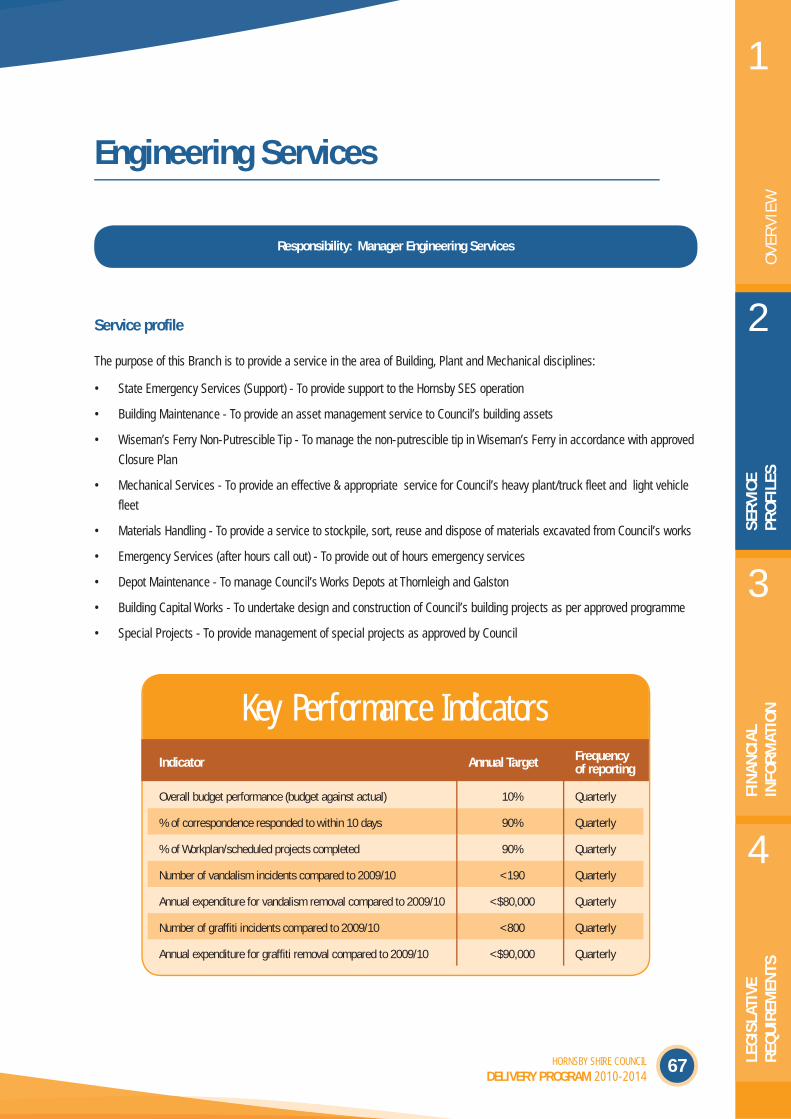
Responsibility: Manager Engineering Services
Engineering Services
Service profile
The purpose of this Branch is to provide a service in the area of Building, Plant and Mechanical disciplines:
• State Emergency Services (Support) - To provide support to the Hornsby SES operation
• Building Maintenance - To provide an asset management service to Council’s building assets
• Wiseman’s Ferry Non-Putrescible Tip - To manage the non-putrescible tip in Wiseman’s Ferry in accordance with approved
Closure Plan
• Mechanical Services - To provide an effective & appropriate service for Council’s heavy plant/truck fleet and light vehicle
fleet
• Materials Handling - To provide a service to stockpile, sort, reuse and dispose of materials excavated from Council’s works
• Emergency Services (after hours call out) - To provide out of hours emergency services
• Depot Maintenance - To manage Council’s Works Depots at Thornleigh and Galston
• Building Capital Works - To undertake design and construction of Council’s building projects as per approved programme
• Special Projects - To provide management of special projects as approved by Council
Key Performance IndicatorsIndicator Annual Target Frequency
of reporting
Overall budget performance (budget against actual) 10% Quarterly
% of correspondence responded to within 10 days 90% Quarterly
% of Workplan/scheduled projects completed 90% Quarterly
Number of vandalism incidents compared to 2009/10 <190 Quarterly
Annual expenditure for vandalism removal compared to 2009/10 <$80,000 Quarterly
Number of graffiti incidents compared to 2009/10 <800 Quarterly
Annual expenditure for graffiti removal compared to 2009/10 <$90,000 Quarterly
SERVICE PROFILES
68 HORNSBY SHIRE COUNCIL
DELIVERY PROGRAM 2010-2014
Engineering Services
Inflows from continuing operations 2010 – 2014
2010/11 2011/12 2012/13 2013/14
Rates and annual charges
User charges and fees 3,000 3,075 3,176 3,269
Interest
Grants and contributions – operating purposes
Grants and contributions – capital purposes
Asset sales 165,000 164,000 164,000 164,000
Restricted assets 129,000 129,000 129,000 129,000
External loan proceeds
Depreciation Contra
Other Income
TOTAL INCOME 297,000 296,075 296,176 296,268
Outflows from continuing operations 2010 – 2014
2010/11 2011/12 2012/13 2013/14
Employee benefits and on costs 2,289,169 2,393,134 2,479,637 2,574,124
Borrowing expense
Materials and contracts 1,532,550 1,677,503 1,675,644 1,724,237
Capital investment 1,165,000 1,218,659 1,258,054 1,297,364
Other expenses 195,666 195,085 196,755 198,580
External loan principal repayments
TOTAL EXPENSES 3,554,508 3,815,806 3,886,453 4,020,682
Inflow/(Outflow) from continuing operations -3,257,508 -3,519,731 -3,590,277 -3,724,414
OVE
RVI
EWSE
RVI
CEPR
OFI
LES
FIN
ANCI
ALIN
FOR
MAT
ION
LEG
ISLA
TIVE
REQ
UIR
EMEN
TS
1
2
3
4
HORNSBY SHIRE COUNCIL
DELIVERY PROGRAM 2010-2014
Engineering ServicesCapital Works 2010 - 2014
2010/11 2011/12 2012/13 2013/14
Operational Projects 21
Rehabilitation and monitoring of Arcadia Landfill $10,000 $10,000 $10,000 $10,000
Rehabilitation and monitoring of Thornleigh Landfill $20,000 $20,000 $20,000 $20,000
Security and Maintenance at Hornsby Quarry $50,000 $50,000 $50,000 $50,000
Capital Projects - Public Buildings
Provision of accessible toilets throughout Shire $130,000 $75,000 $75,000 $75,000
Administration Centre - upgrade Customer Service Facilities $50,000 $50,000 $50,000 $50,000
Provision of safe roof access various buildings $15,000 $15,000 $15,000 $15,000
Administration Centre - upgrade passenger lifts $37,000
Hawkins Hall - floor replacement $15,000
Epping Community Centre - floor replacement $60,000
Epping Creative Centre progressive upgrade $50,000 $50,000 $50,000
Roselea Community Centre progressive upgrade $30,000 $50,000 $50,000 $50,000
Administration Centre - lift operating system upgrade $250,000 $150,000
Galston Library - replacement of roofing system $25,000
Refurbishment of amenities buildings $100,000 $100,000 $100,000
Refurbishment of leisure and learning centres $75,000 $75,000
Refurbishment of child care centres $100,000
Capital Projects - Air conditioning
Air conditioning - annual duct cleaning $10,000 $20,000 $20,000 $20,000
Traffic Branch (Old Commonwealth Bank) Building - replacement of air conditioning unit
$30,000
Administration Centre - replace cooling tower $18,000
Administration Centre - adjustment of air conditioning in foyer $10,000
Pennant Hills Community Centre - installation of air conditioning unit
$100,000
Leisure and Learning Centres - installation of air conditioning units
$75,000
Administration Centre - replacement of airconditioning units servicing 2nd / 3rd levels
$150,000
Thornleigh Depot Administration Building - replacement of air conditioning units
$50,000
Plant Control
Major Plant purchase $700,000
69
SERVICE PROFILES
70 HORNSBY SHIRE COUNCIL
DELIVERY PROGRAM 2010-2014
Traffic and Road Safety
Responsibility: Manager Traffic and Road Safety
Service profile
The purpose of the Traffic and Road Safety service is to:
• To control all traffic, equitable car parking and road safety matters within Council’s responsibility
• To service customer inquiries and administration support to the Branch
• Improve existing traffic, road safety and car parking conditions
• Regulate effective and appropriate user activities on road network
Key Performance IndicatorsIndicator Annual Target Frequency
of reporting
Overall budget performance (budget against actual) 10% Quarterly
% of correspondence responded to within 10 days 90% Quarterly
% of Workplan/scheduled projects completed 90% Quarterly
Number of matters successfully defended as % of infringement notices issued <1% Quarterly
Number of new sustainable transport facilities (bike parking, shower/change rooms, shared paths, marked on-road bike paths)
>50 Annual
Number of footpath areas per annum modified/built as shared use paths (subject to RTA funding) 5 Annual
OVE
RVI
EWSE
RVI
CEPR
OFI
LES
FIN
ANCI
ALIN
FOR
MAT
ION
LEG
ISLA
TIVE
REQ
UIR
EMEN
TS
1
2
3
4
71HORNSBY SHIRE COUNCIL
DELIVERY PROGRAM 2010-2014
Traffic and Road Safety
Inflows from continuing operations 2010 – 2014
2010/11 2011/12 2012/13 2013/14
Rates and annual charges
User charges and fees 6,000 6,150 6,353 6,537
Interest
Grants and contributions – operating purposes 49,000 50,225 51,882 53,387
Grants and contributions – capital purposes
Asset sales
Restricted assets
External loan proceeds
Depreciation Contra
Other Income 1,555,000 1,593,875 1,646,473 1,694,221
TOTAL INCOME 1,610,000 1,650,250 1,704,708 1,754,145
Outflows from continuing operations 2010 – 2014
2010/11 2011/12 2012/13 2013/14
Employee benefits and on costs 1,367,773 1,470,075 1,523,213 1,581,255
Borrowing expense
Materials and contracts 23,300 23,883 24,671 25,386
Depreciation and amortisation
Internal expenses 207,665 212,854 219,881 226,258
Capital investment 262,000 274,067 282,927 291,764
Other expenses 421,810 424,495 428,130 432,101
External loan principal repayments
TOTAL EXPENSES 2,282,548 2,405,377 2,478,823 2,556,768
Inflow/(Outflow) from continuing operations -672,548 -755,127 -774,114 -802,623
SERVICE PROFILES
72 HORNSBY SHIRE COUNCIL
DELIVERY PROGRAM 2010-2014
Key initiatives 2010 - 2014
2010/11 2011/12 2012/13 2013/14
Hornsby Town Centre Car Parking Strategy
Hornsby Shire Car Parking Strategy
Epping LEP Traffic and Parking Study
Hornsby Quarry Access Study
Road Safety Education Projects
Annually review traffic, parking and road safety data across Shire
Modify/build footpaths in 5 areas as shared use paths(Note: Subject to external funding)
Recommend roads suitable for marking and use as on-road bicycle lanes
Capital Works 2010 - 2014
2010/11 2011/12 2012/13 2013/14
All significant Traffic and Road Safety capital projects are subject to annual crash and traffic data review and State/Federal matching funds (262k in budget)
$600,000 $600,000 $600,000 $600,000
For more detailed information on 2010/11 proposed capital works for minor traffic facilities see below:
The purpose of the Corporate Strategy Branch is to:
• Assist elected members and executive team to determine and set the strategic direction for the organisation
• Lead the Hornsby Shire Community Plan and Delivery Program process
• Undertake community engagement at the organisation wide level
• Undertake corporate reporting and provide an integrated corporate reporting function
• Provide strategic oversight of the customer services function of Council
Key Performance IndicatorsIndicator Annual Target Frequency
of reporting
Overall budget performance (budget against actual) 10% Quarterly
% of correspondence responded to within 10 days 90% Quarterly
% of Workplan/scheduled projects completed 90% Quarterly
All integrated planning and reporting requirements fulfilled as per the Division of Local Government guidelines 100% Annual
Number of community engagements undertaken and topics discussed >8 Annual
% of key initiatives in Delivery Program 2010-2014 achieving success, completed on time and within budget 90% Annual
Number of Council service requests more than 28 days overdue <10% Annual
% of all written correspondence including email completed or acknowledged within 14 days >90% Annual
Unemployment rates compared to December 2008 - target = less unemployment than 2008 (3.3%, 2,941 persons) <3.3% Annual
Gross regional product for Hornsby Shire and per capita value - target = improvement from 2010 ($5.9 billion in January 2010) >$5.9 billion Annual
Number of community members participating in Council’s sustainability initiatives >3,500 Annual
% of the population that live and work in the Shire >27% Biennial
% of people who volunteer locally - target = improvement on 2006 ABS Census statistics of 18.14% >18.14% Biennial
% of the community who feel safe walking in the Shire and using public transport during the day and night 75% Biennial
% of employed residents who travel to work using sustainable transport most days - target = improvement compared to 2006 Census data of 10,483 persons (18% of residents)
>18% Biennial
84
OVE
RVI
EWSE
RVI
CEPR
OFI
LES
FIN
ANCI
ALIN
FOR
MAT
ION
LEG
ISLA
TIVE
REQ
UIR
EMEN
TS
1
2
3
4
85HORNSBY SHIRE COUNCIL
DELIVERY PROGRAM 2010-2014
Corporate Strategy
Nil Inflows from continuing operations 2010 – 2014
Outflows from continuing operations 2010 – 2014
2010/11 2011/12 2012/13 2013/14
Employee benefits and on costs 306,652 316,292 327,725 340,213
Borrowing expense
Materials and contracts 2,000 2,050 2,118 2,179
Depreciation and amortisation
Internal expenses 99,665 102,157 105,528 108,588
Capital investment
Other expenses 152,080 153,186 154,498 155,931
External loan principal repayments
TOTAL EXPENSES 560,397 573,684 489,868 606,911
Inflow/(Outflow) from continuing operations -560,397 -573,684 -489,868 -606,911
Key initiatives 2010 - 2014
2010/11 2011/12 2012/13 2013/14
Integrated Planning Framework in place
Development of a KPI regime for Council
Biennial customer satisfaction research
Community engagement via social networking
Community telephone directory
Strategic customer service regime in place
Review of Corporate Strategy policies
Compliance plans for major risk enterprises
Review of Community Strategic Plan
Nil Capital Works anticipated 2010 - 2014
SERVICE PROFILES
86 HORNSBY SHIRE COUNCIL
DELIVERY PROGRAM 2010-2014
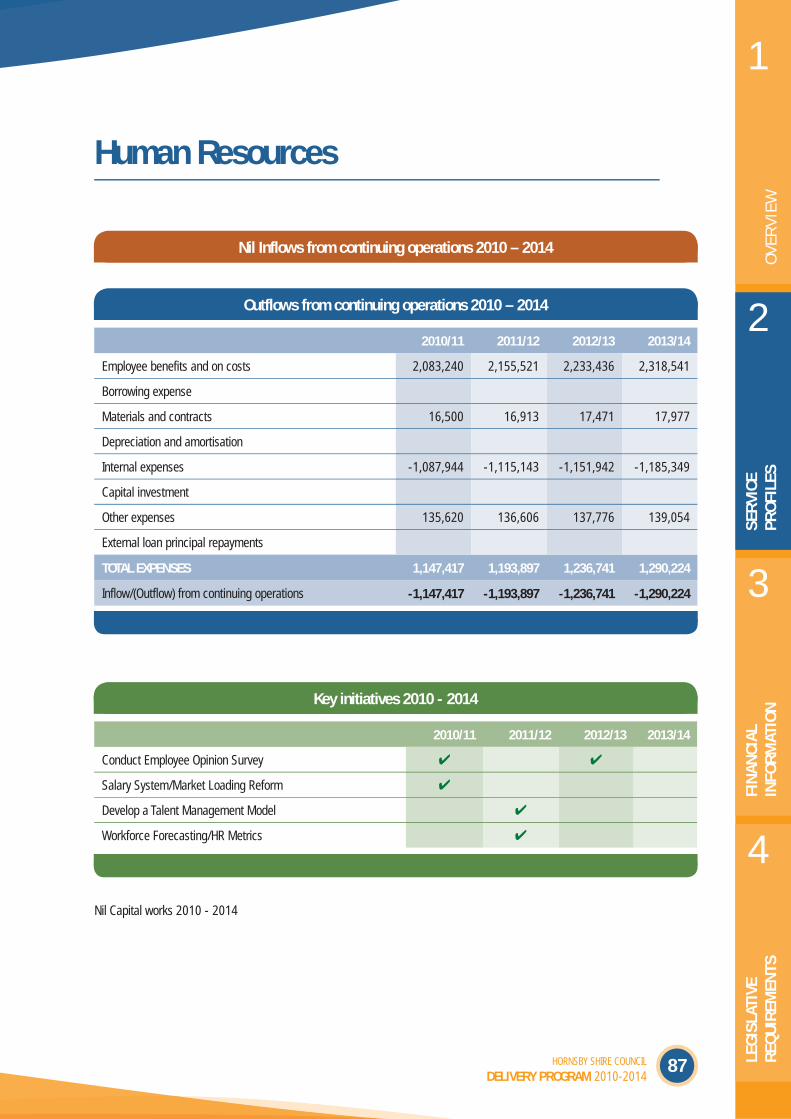
Human Resources
Responsibility: Manager Human Resources
Service profile
The Human Resources branch provides support and systems to maximise the value of people in the organisation. In addition
to the day to day provision of service the Branch also works to improve its systems, policies and practices in order to sustain
Council’s workforce needs into the future.
Services provided by the branch include:
• Occupational Health and Safety
• Payroll
• Learning and Development
• General Human Resource management
Key Performance IndicatorsIndicator Annual Target Frequency
of reporting
Overall budget performance (budget against actual) 10% Quarterly
% of correspondence responded to within 10 days 90% Quarterly
% of Workplan/scheduled projects completed 90% Quarterly
Staff turnover compared to target of 15% 15% Quarterly
Staff absenteeism compared to target of less than 3% <3% Quarterly
Number of workers’ compensation claims registered in the quarter <5 Quarterly
Average hours of scheduled training organised by the Learning & Development Team 150 hours Quarterly
OVE
RVI
EWSE
RVI
CEPR
OFI
LES
FIN
ANCI
ALIN
FOR
MAT
ION
LEG
ISLA
TIVE
REQ
UIR
EMEN
TS
1
2
3
4
87HORNSBY SHIRE COUNCIL
DELIVERY PROGRAM 2010-2014
Nil Inflows from continuing operations 2010 – 2014
Outflows from continuing operations 2010 – 2014
2010/11 2011/12 2012/13 2013/14
Employee benefits and on costs 2,083,240 2,155,521 2,233,436 2,318,541
Borrowing expense
Materials and contracts 16,500 16,913 17,471 17,977
Capital investment 2,639,000 2,760,550 2,849,790 2,938,836
Other expenses 2,652,490 2,667,238 2,690,080 2,715,029
External loan principal repayments
TOTAL EXPENSES 7,787,319 7,921,998 8,126,430 8,345,542
Inflow/(Outflow) from continuing operations -4,753,019 -4,863,034 -5,019,255 -5,194,604
Corporate Administration
SERVICE PROFILES
96 HORNSBY SHIRE COUNCIL
DELIVERY PROGRAM 2010-2014
Key initiatives 2010 - 2014
2010/11 2011/12 2012/13 2013/14
Implement new access to information legislation - Government Information Public Access (GIPA) Act - including staff training
Undertake review of Ward boundaries in lead up to 2012 Local Government Elections
Assist in conduct of Local Government Elections
Develop Enterprise Risk Management Plan
Review and implement changes in Fleet Management processes - eg. type of vehicle purchased, retention period, procedures for ongoing management of the fleet - to work towards an increasingly cost efficient and environmentally responsible fleet
Nil Capital Works planned for 2010 – 2014
Corporate Administration
97HORNSBY SHIRE COUNCIL
DELIVERY PROGRAM 2010-2014
FINANCIAL INFORMATION
FINANCIAL INFORMATION
98 HORNSBY SHIRE COUNCIL
DELIVERY PROGRAM 2010-2014
Resourcing Information
Council's budget for 2010/11 has been prepared after taking into account community demands for services, obligations to present
and future generations, statutory income constraints and expenditure commitments. With Hornsby Shire's high expectation of the
many different services to be provided, council's income is not able to realise all services and expectations. The budget therefore
represents council's best efforts to meet community priorities after recognising the above constraints.
Rates and Charges
This includes all ordinary rates, catchments remediation rate, Hornsby Quarry Loan Rate and the garbage availability charge.
User Fees and Charges
These include fees such as development applications and revenue from aquatic and recreation centres, nursery and pre-schools,
commercial waste services, park and oval hire, and property rentals.
Grants and Contributions
This includes developer contributions, Federal Government Grants and numerous smaller amounts from governments for services
including nursery and pre-schools, bushfire, children’s services, various community services, libraries, roads, various environmental
grants, street lighting and pensioner rate subsidy.
Asset Sales
This includes items such as land sales and sale of plant and equipment for replacement.
Other
This includes many items such as fines, recycling income, vehicle private use fees and income from road closures.