34
Real Estate Services Commercial Real Estate Outlook: Top ten issues in 2011 Generating momentum for recovery
| Date post: | 01-Apr-2015 |
| Category: |
Documents |
| Upload: | msheridan1972 |
| View: | 76 times |
| Download: | 1 times |

Real Estate Services
Commercial Real Estate Outlook: Top ten issues in 2011 Generating momentum for recovery

Commercial Real Estate Outlook: Generating momentum for recovery 1
Commercial real estate outlook: Generating momentum for recovery Following sharp declines and painful deleveraging in the wake of financial and economic turmoil, commercial real estate (CRE) is showing signs that the deterioration of industry transactions and fundamentals has begun to plateau, and that early stages of recovery may be imminent. Despite some encouraging activity, however, impediments such as looming debt maturities and high unemployment rates are causing uncertainty, dimming prospects of a robust, short-term rebound. This report, the twelfth in Deloitte’s series on critical issues impacting CRE, takes a closer look at market trends and developments, with a focus on the outlook for recovery.
The top ten issues for commercial real estate in 2011 are:
1. Current State of CRE: Prevailing uncertainty, as downturn defies expectations
2. Lender Lenience: Impact of “amend and extend”
3. Looming Debt: High maturities remain a challenge
4. Deal Flow: Distress fuels modest revival in transactions
5. Economy: Trajectory of economic fundamentals remains uncertain
6. CRE Fundamentals: Fundamentals moderating, but recovery may be slow
7. Real Estate Investment Trusts: REIT rebound continues
8. Capital Markets: Lending stabilizes; demand subdued
9. Regulation: Direct and indirect impact of regulation on CRE
10. Globalization: Positive signs for global CRE
I hope you find Deloitte’s Real Estate Outlook and our “Top Ten” List informative and insightful. I would appreciate your comments, questions and feedback and the opportunity for me or our partners, principals and directors of Deloitte Real Estate Services to discuss our report with you.
Bob O’Brien Vice Chairman and Partner U.S. Real Estate Services Leader Deloitte & Touche LLP +1 312 486 2717 [email protected]
Commercial Real Estate Outlook: Generating momentum for recovery 2
Issue one: Prevailing uncertainty as downturn defies expectations
Uncertainty is the most significant issue for commercial real estate in the post-recession environment, as market participants — owners and operators, lenders, investors, developers, and tenants — look for a signal that economic and industry fundamentals have hit bottom, and have begun a sustainable recovery. This signal has remained elusive, however, as the current cycle is behaving somewhat uncharacteristically, making it challenging for stakeholders to plan and develop forward-looking strategies.
Evidence of CRE’s continuing struggle can be found in the 3Q10 Real Estate Roundtable survey of industry sentiment, which found that just 20 percent of respondents expect conditions one year out to be “much better” than today. Indeed, one participant responded, “The only certain thing in the world at the moment is uncertainty. Until companies begin rehiring and the consumer regains confidence, we will remain stuck in the ditch.”i
Uncommon behavior
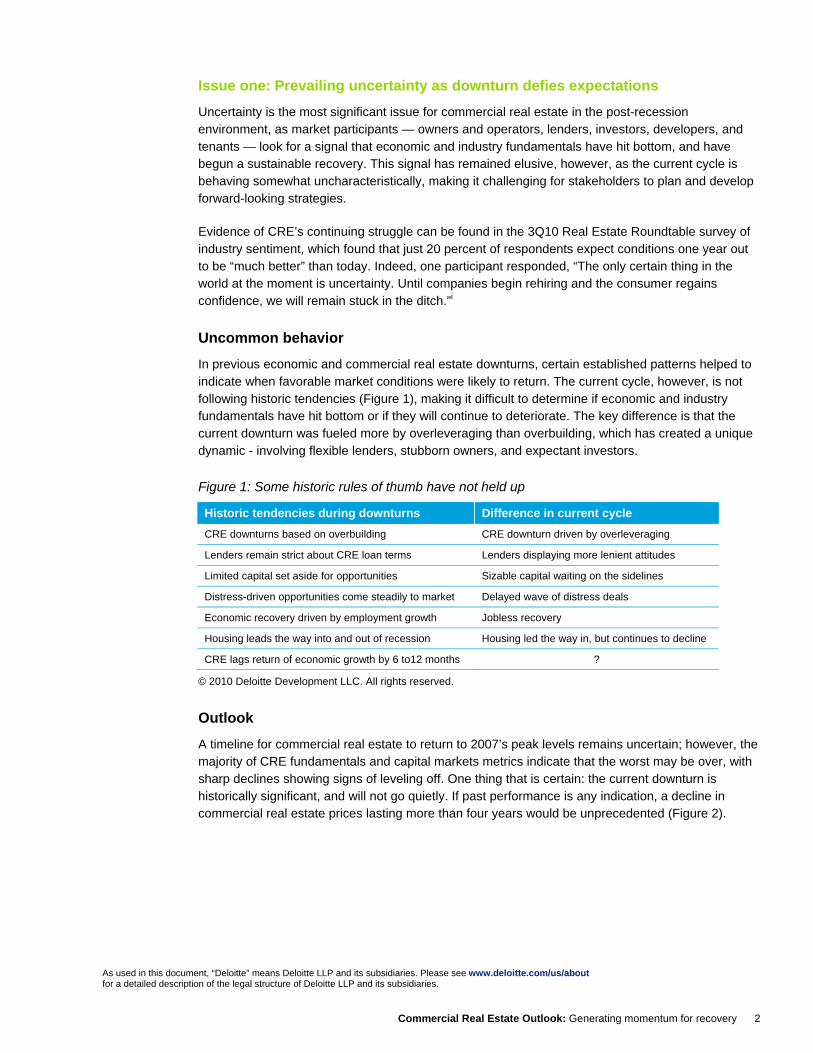
In previous economic and commercial real estate downturns, certain established patterns helped to indicate when favorable market conditions were likely to return. The current cycle, however, is not following historic tendencies (Figure 1), making it difficult to determine if economic and industry fundamentals have hit bottom or if they will continue to deteriorate. The key difference is that the current downturn was fueled more by overleveraging than overbuilding, which has created a unique dynamic - involving flexible lenders, stubborn owners, and expectant investors.
Figure 1: Some historic rules of thumb have not held up
Historic tendencies during downturns Difference in current cycle CRE downturns based on overbuilding CRE downturn driven by overleveraging
Lenders remain strict about CRE loan terms Lenders displaying more lenient attitudes
Limited capital set aside for opportunities Sizable capital waiting on the sidelines
Distress-driven opportunities come steadily to market Delayed wave of distress deals
Economic recovery driven by employment growth Jobless recovery
Housing leads the way into and out of recession Housing led the way in, but continues to decline
CRE lags return of economic growth by 6 to12 months ?
© 2010 Deloitte Development LLC. All rights reserved.
Outlook
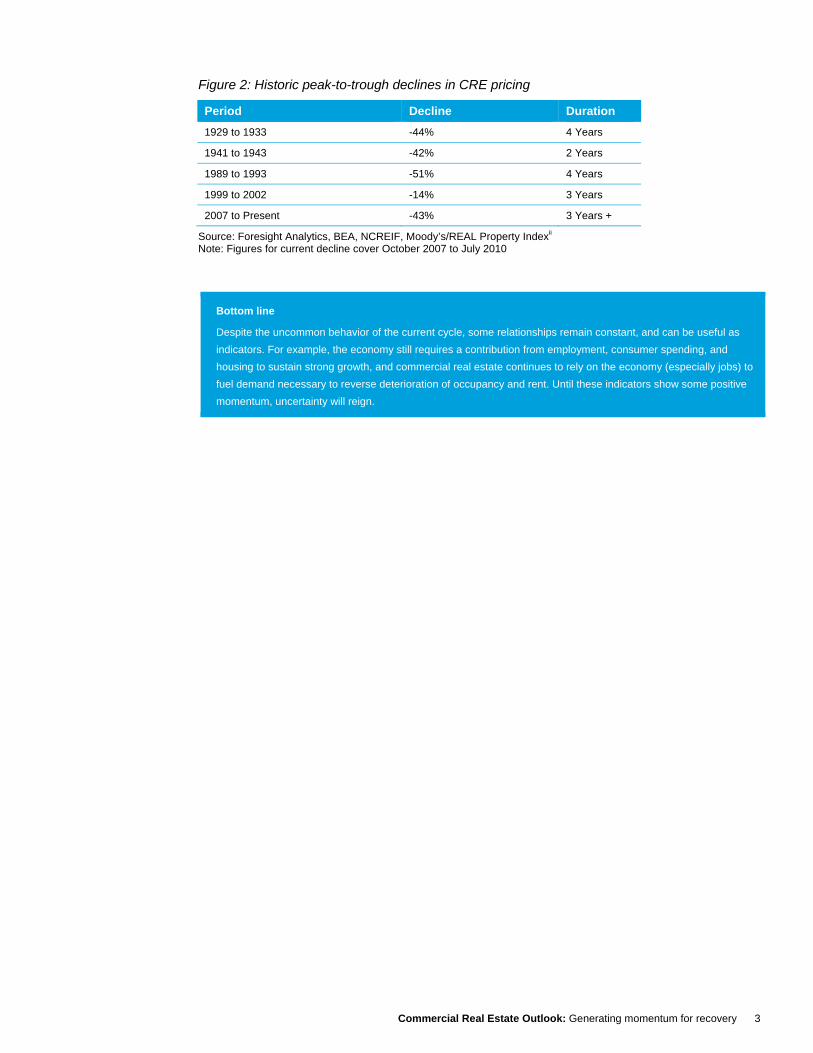
A timeline for commercial real estate to return to 2007’s peak levels remains uncertain; however, the majority of CRE fundamentals and capital markets metrics indicate that the worst may be over, with sharp declines showing signs of leveling off. One thing that is certain: the current downturn is historically significant, and will not go quietly. If past performance is any indication, a decline in commercial real estate prices lasting more than four years would be unprecedented (Figure 2).
As used in this document, “Deloitte” means Deloitte LLP and its subsidiaries. Please see www.deloitte.com/us/about for a detailed description of the legal structure of Deloitte LLP and its subsidiaries.
Commercial Real Estate Outlook: Generating momentum for recovery 3
Figure 2: Historic peak-to-trough declines in CRE pricing
Period Decline Duration 1929 to 1933 -44% 4 Years
1941 to 1943 -42% 2 Years
1989 to 1993 -51% 4 Years
1999 to 2002 -14% 3 Years
2007 to Present -43% 3 Years +
Source: Foresight Analytics, BEA, NCREIF, Moody’s/REAL Property Indexii Note: Figures for current decline cover October 2007 to July 2010
Bottom line
Despite the uncommon behavior of the current cycle, some relationships remain constant, and can be useful as indicators. For example, the economy still requires a contribution from employment, consumer spending, and housing to sustain strong growth, and commercial real estate continues to rely on the economy (especially jobs) to fuel demand necessary to reverse deterioration of occupancy and rent. Until these indicators show some positive momentum, uncertainty will reign.

Commercial Real Estate Outlook: Generating momentum for recovery 4
Issue two: Impact of “amend and extend”
One of the main reasons for the unique nature of this downturn is an unanticipated willingness by banks to see beyond signs that CRE loans have soured and to renegotiate. In past cycles, the combination of sharply declining property prices and the comparatively short duration of CRE loans (generally five years) has resulted in substantial write-offs for lenders and increased foreclosures for owners. However, this downturn has been characterized by a new willingness by banks to extend the terms of loans unlikely to return full value on principal and interest accrued. This strategy, nicknamed “amend and extend,”1 commonly involves permitting below-market interest rates and stretching out maturities for borrowers with troubled loans.
Positives and negatives
Loan extensions allow banks to preserve capital, to delay write-offs, and to avoid taking over properties that cannot be sold for a favorable price. Also, banks typically lack expertise in selling commercial real estate, and would rather not carry the property on their balance sheets. For owners, renegotiating loan terms allows them to continue payments and avoid the prospects of foreclosure or forced sales to opportunistic investors bidding as low as 10 cents on the dollar. The positives and negatives of loan extensions are detailed in Figure 3:
Figure 3: Positives and negatives of CRE loan extensions
Pros
• Extensions enable owners to retain properties, rather than accepting drastically low offers. • Extensions should help keep delinquencies and defaults in check until the economy recovers. • Banks can delay write-offs on CRE loans until favorable conditions return. • Classifying some troubled loans as “performing” minimizes the amount of reserves banks must set aside
for future losses.
Cons
• The protracted period of restructuring limits CRE returns. • Extensions put a floor under the market, making it difficult to know when the bottom has been reached. • Delaying the inevitable may cause a more severe downturn down the road. • Banks have been focusing on class “A” quality properties, and class “B” and “C” properties and those in
secondary and tertiary markets have fewer options.
Sources: Wall Street Journal, Economist Intelligence Unitiii
Role of regulators
One of the drivers of the recent atypical behavior by banks is guidance by regulators. In October 2009, the Federal Financial Institutions Examination Council (FFIEC), which includes the Federal Reserve, Federal Deposit Insurance Corporation (FDIC), and the Comptroller of Currency, responded to concerns about commercial property losses and debts coming due by issuing a policy statement suggesting that performing loans would not be declared troubled solely because of a decline in the value of underlying collateral.
1 Also referred to by the media as “extend and pretend,” and the even less optimistic “delay and pray.”
Commercial Real Estate Outlook: Generating momentum for recovery 5
While the FFIEC guidance was intended chiefly to improve consistency and flexibility in the treatment of CRE loans, the initial result was greater confusion in the market, with some lenders misinterpreting the guidance as a form of forbearance, and an incentive to restructure maturing loans.iv In response, the FFIEC in May 2010 held a conference call with 1,400 bank executives, explicitly stating that it did not intend for investors and bankers to interpret the guidance as a call to amend and extend existing loans.
Impact of guidance
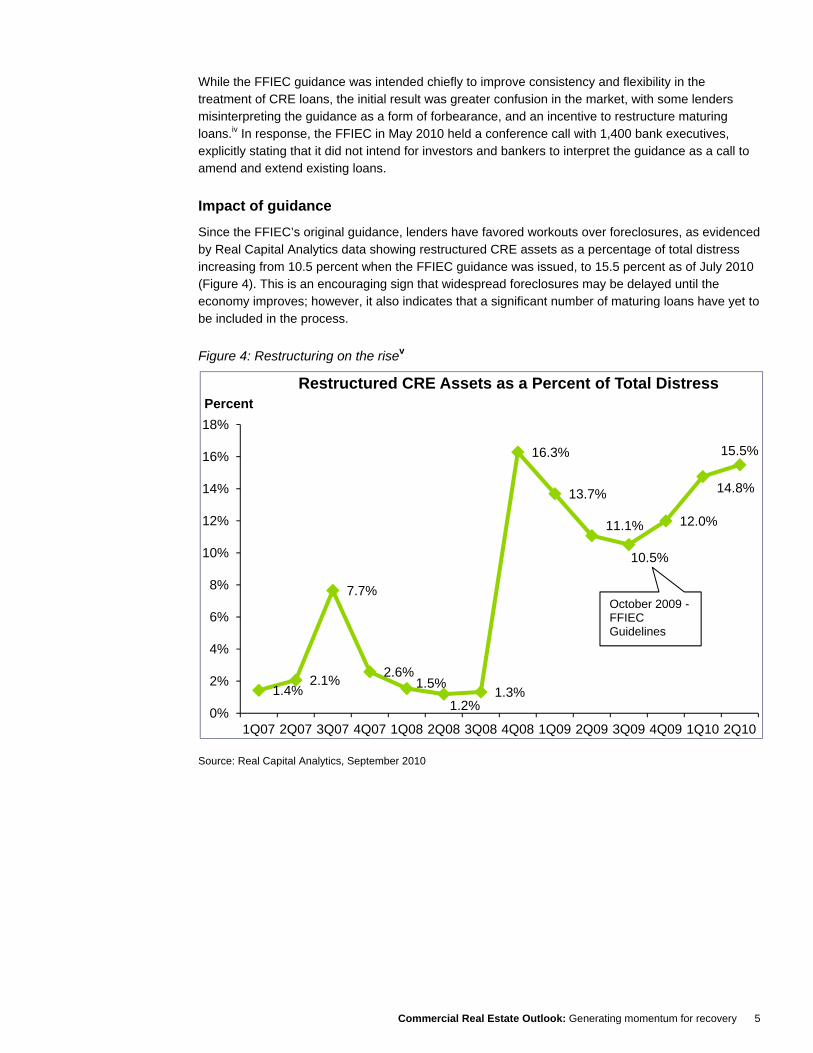
Since the FFIEC’s original guidance, lenders have favored workouts over foreclosures, as evidenced by Real Capital Analytics data showing restructured CRE assets as a percentage of total distress increasing from 10.5 percent when the FFIEC guidance was issued, to 15.5 percent as of July 2010 (Figure 4). This is an encouraging sign that widespread foreclosures may be delayed until the economy improves; however, it also indicates that a significant number of maturing loans have yet to be included in the process.
Figure 4: Restructuring on the risev
Source: Real Capital Analytics, September 2010
1.4%2.1%
7.7%
2.6%1.5%
1.2%1.3%
16.3%
13.7%
11.1%
10.5%
12.0%
14.8%
15.5%
0%
2%
4%
6%
8%
10%
12%
14%
16%
18%
1Q07 2Q07 3Q07 4Q07 1Q08 2Q08 3Q08 4Q08 1Q09 2Q09 3Q09 4Q09 1Q10 2Q10
PercentRestructured CRE Assets as a Percent of Total Distress
October 2009 -FFIECGuidelines

Commercial Real Estate Outlook: Generating momentum for recovery 6
Outlook: Damage could be contained
Adopting a loan extension strategy amounts to a bet by banks that the economy will rebound in time for demand for commercial space to resume. Even if the FFIEC’s clarification of its guidance results in a decline in “amend and extend,” other factors exist that could limit the damage and help lead the way to recovery. For example, in a September 2010 interview,vi the chief executive officer of CB Richard Ellis outlined two avenues that could act as a buffer to further declines. The first is private equity investment, which has increased in 2010, and the second is the Federal Reserve, which is in a strong position to inject liquidity into the market if it determines that the commercial property sector poses a threat to financial intermediation.
Bottom line
The alignment of lender behavior and the intentions of regulators could reduce the prevalence of loan extensions, but this is not necessarily a bad thing for the industry. While extending the terms of CRE loans enables owners to retain property and banks to preserve capital and delay write-offs, it also puts a false floor on the market, making it challenging to determine when a bottom has been reached — a critical milestone for recovery to begin, and for distressed opportunities to fully emerge.

Commercial Real Estate Outlook: Generating momentum for recovery 7
Issue three: High maturities remain a challenge
While lender lenience has helped to cushion commercial real estate from a more severe downturn, the high level of maturing debt remains a significant barrier to recovery. The core of the problem is that debt incurred at the top of the market is now coming due at a time when economic uncertainty and weak commercial real estate fundamentals are making it harder for borrowers to generate the income needed to make payments. In fact, according to the debt analysis company Trepp LLC, as much as 52 percent of current CRE loans maturing between 2010 and 2014 are considered “underwater,” indicating the amount of debt exceeds the market value of the property itself.vii
How big is the problem?
According to Foresight Analytics, an estimated $1.4 trillion in commercial real estate debt is set to come due between 2010 and 2014, a figure that could grow even larger once the impact of “amend and extend” is factored in. As most CRE loans are approximately five years in length, a majority of debt incurred during the market’s peak in 2007-2008 is set to mature in 2012-2013. The peak year for maturities is expected to be 2013, when $311.8 billion will come due; the amount decreases to $286.5 billion in 2014, and then subsides to less than $100 billion by 2020 (Figure 5).
Figure 5: CRE maturities set to peak in 2013
Source: Foresight Analytics, July 2010
Underlying factors: Moderating delinquencies and defaults
The uptick in restructuring and resolution is a positive sign, but a high level of CRE debt remains in distress, and the pace of defaults and delinquencies has yet to subside. In fact, the delinquency rate for commercial property loans held by banks climbed from 1.5 percent in 1Q07, to 7.0 percent in 1Q09, to 9.1 percent in 1Q10.viii Recently, however, the pace of delinquencies has shown signs of leveling off (Figure 6), remaining in the range of nine percent for the past few quarters.
$0.0
$50.0
$100.0
$150.0
$200.0
$250.0
$300.0
$350.0
2010 2011 2012 2013 2014 2015 2016 2017 2018 2019 2020
Banks CMBS Life CO's Other
CRE Debt Maturities by Lender Type ($Billions)

Commercial Real Estate Outlook: Generating momentum for recovery 8
Figure 6: Delinquencies remain elevated, but pace may be slowing
Source: Federal Reserve, August 2010
Additional underlying factors
• CMBS loan delinquencies: While the majority of outstanding commercial real estate maturities are from loans issued by banks, loan delinquencies from other lending sources indicate a similar trend of leveling off but not subsiding. For example, the research firm Trepp reports that 30+ day delinquencies on commercial mortgage-backed securities (CMBS) climbed rapidly from 4.36 percent in September 2009 to 7.61 percent in March of 2010, before leveling in the eight percent to nine percent range between June and August. Delinquencies topped nine percent in September, but the increase of 13 basis points from 8.92 percent in August to 9.05 percent in September was the second-smallest increase of the year.ix
• CRE loan defaults: Aided by loan extensions, CRE mortgage defaults have followed a similar trend as delinquencies, climbing rapidly to a high level between 2008 and 2010, but at a slower pace in recent quarters. Defaults spiked from a range of one percent in 2008 to four percent in 2010, but have since moderated, increasing by just nine basis points, from 4.19 percent in 1Q10 to 4.28 percent in 2Q10. This is consistent with the dollar volume of defaults, which increased by just $547 million on a quarter-over-quarter basis, from $45.6 billion in 1Q10 to $46.2 billion in 2Q10.
0%
1%
2%
3%
4%
5%
6%
7%
8%
9%
10%
2Q01 2Q02 2Q03 2Q04 2Q05 2Q06 2Q07 2Q08 2Q09 2Q10
PercentCRE Loan Delinquency and Charge-off Rates Across All Banks
Charge-off Rate Delinquency Rate
Moderating,but yet to subside

Commercial Real Estate Outlook: Generating momentum for recovery 9
• Strategic defaults: CRE defaults may be moderating, but there also have been more reports of strategic defaults, a trend primarily associated with the residential market which has migrated to the commercial property sector. Some of the nation’s largest property owners recently have chosen to return the keys (dubbed “jingle mail” by the media) for buildings valued below the amount of debt, and since commercial loans are nonrecourse, it is actually easier for commercial owners to walk away than it is for homeowners. While this may seem like an extreme step, it is often the result of a pragmatic business decision to exit profit-draining investments in order to divert funds to performing projects or shareholders.x
Barrier to recovery: “Haves” versus “have-nots”
Increased restructuring and moderating delinquency and default rates suggest progress, but maturities remain at a high level, and not all property owners holding troubled loans will qualify for extensions. Foresight Analytics reports that restructurings totaled $23 billion as of 1Q10, a fraction of the total $176 billion of troubled CRE loans held by banks. Lenders’ flexible attitude has so far been limited to class “A” quality assets; they have turned away from owners of properties at the “B” and “C” levels and in secondary and tertiary markets, especially those with rollover and lease-up exposure, above-market rents, and vacancy challenges.xi
Outlook
While no one expected the process of deleveraging that has followed the 2001-2007 credit boom to be quick and painless, there is hope that maturing CRE debt can still be reduced to a manageable level without a substantial increase in Real Estate Owned (REO) loans.2 There are basically two avenues for unwinding high levels of CRE debt, and neither is mutually exclusive: The first is classic loan reduction via default or repayment, and the second is robust economic growth, which would stimulate demand.xii Forecasters expect modest economic performance in the coming quarters, but Gross Domestic Product (GDP) growth has been positive since 2Q09, leading to an improvement in the ratio of CRE debt to GDP, which peaked at 26.3 percent in 1Q09, and declined to approximately 25 percent by 1Q10. While $3.55 trillion in total commercial mortgage debt remains, an improvement in the ratio of CRE debt to GDP can be interpreted as a move in the right direction.xiii
Bottom line
As they seek funding to make payments, owners of trophy properties have been able to obtain new financing from sovereign wealth funds (SWFs), insurers, private equity firms, and even some CMBS, while owners of lower-tier properties have had few options. For a timely and robust recovery to take place, it will be necessary for properties below class A to be included in the refinancing, restructuring, and resolution process.
2 REO or Real Estate Owned is another term for foreclosure, when the property is returned to the lender.

Commercial Real Estate Outlook: Generating momentum for recovery 10
Issue four: Transactions reviving modestly, driven by distress
With looming maturities and delinquency and default levels fueling uncertainty, transactions have emerged as a bright spot for commercial real estate. Deal flow remains significantly below the 2007 peak, but sizable deals have been reported recently, and there has been a year-over-year improvement in both the number and value of transactions. The gap between buyers’ capacity and sellers’ expectations remains, but lenders and special servicers have brought a significant amount of distressed property to market, and a high amount of capital has been raised by investors to target these opportunities. Distress is challenging for both owners and lenders; however, it can be a boon for buyers and has the side effect of driving more transactions — a key indicator for recovery.
Transaction trends
Commercial real estate transactions in the United States climbed rapidly from a total volume of less than $100 billion in 2001 to more than $500 billion in 2007 (Figure 7), driven by a surfeit of cheaply available leverage. As the financial crisis and economic downturn developed, however, transactions declined sharply, totaling just $54.6 billion and 3,743 deals in 2009, compared with $502.4 billion and 19,482 deals in 2007, according to Real Capital Analytics.xiv
Recent trends, however, indicate a modest rebound in transactions. In the first three quarters of 2010, deal volume improved by 88.1 percent year over year, to $66.1 billion, from $35.2 billion in the same period in 2009. Gains were higher for high-quality core assets, especially in the office segment, where sales volume nearly doubled to $20.8 billion in the first three quarters of 2010, from $11.4 billion in the same period of 2009. While this improvement is a positive development, it has yet to be sustained for long enough to confirm 2009 as the bottom for transactions in this cycle.[i]
Figure 7: Following sharp declines, transactions trending up
Note: YTD is for the period of January 1, 2010 to September 30, 2010 Source: Real Capital Analytics, October 2010
0
100
200
300
400
500
2001 2002 2003 2004 2005 2006 2007 2008 2009
$ Billion
U.S. CRE Transaction Volume by Property Type, 2001-2009
Apartment Hotel Industrial Office Retail
9.4
18.52.0
5.9
5.7
9.0
11.4
20.8
6.7
11.9
0
10
20
30
40
50
60
70
2009 YTD 2010 YTD
$ Billion
U.S. CRE Transaction Volume by Property Type
Apartment Hotel Industrial Office Retail
35.2
88.1%
66.1

Commercial Real Estate Outlook: Generating momentum for recovery 11
Composition of buyers
While private investors continue to account for the largest share of CRE transactions, the recent increase in activity has been driven by public investors (including REITs) and foreign investors, with both categories surpassing 2009 totals in the first half of 2010. A significant and growing share of transactions are coming from REITs, which spent the majority of 2009 on the sidelines, and used capital normally reserved for deals on deleveraging and building warchests for future opportunities. With banks remaining conservative about new issuance, public REITs have the advantage of being able to tap the stock exchange, and the expectation is that more of these funds will be used for transactions. In 2010, several public REITs raised billions through stock sales, and SNL Financial reports that secondary offerings by property REITs are the third-highest since 2000.xv
Distress as driver
After more than two years of declining prices and anticipated opportunities for buyers, distress3 has emerged as a key driver of CRE transactions. The amount of distressed commercial real estate, including properties considered troubled, returned to lender, restructured, and resolved, has climbed steadily from zero in 2007 to a cumulative total of more than $290 billion as of September 2010. While it remains uncertain how much of that distress will ultimately come to market, Real Capital Analytics estimates that buyers and sellers transacted approximately $11.0 billion in distressed commercial real estate sales between January and August 2010.xvi Distress-driven deals do not account for a majority of transactions, but they have been on the rise, from 2.7 percent in 2008 to 16.4 percent of total deals conducted in the first eight months of 2010 (Figure 8).xvii
Figure 8: Percentage of distress-driven transactions on the rise
Source: Real Capital Analytics, September 2010 / Note: YTD is as of 8/31/10
3 Distress is defined by RCA as properties that are considered troubled (in the process of default, foreclosure, bankruptcy, or special servicing), REO (Real Estate Owned, indicating the property has been returned to the owner), restructured, or resolved.
0.2
2.7
10.9
16.4
0%
2%
4%
6%
8%
10%
12%
14%
16%
18%
0
2
4
6
8
10
12
2007 2008 2009 2010 YTD
Distress Sales as percentage of
totalDistress Sales
($ Billion)
Distress-driven CRE Sales
Distress Distress as a % of Total Sales
Commercial Real Estate Outlook: Generating momentum for recovery 12
However, distress may be peaking
Potential CRE buyers and investors should note that recent figures suggest that distress may be close to peaking, as workout activity increases. Real Capital Analytics reports that in July 2010, new additions to the distressed property total slipped to $5.1 billion, the lowest level since October 2008, and less than half the monthly average for the past two years.xviii A report released by Delta Associates also forecasts that distress ultimately will plateau at approximately $200 billion, as opposed to the estimated $500 billion that some experts were anticipating.xix
Investors Favoring Trophy Properties Recent transaction growth has been bifurcated between distress and quality, as investors have raised a significant amount of capital to target opportunities, but remain risk-averse. As a result, competition has been high for quality ‘trophy’ properties, especially those with stable rent rolls in top-tier cities, with few deals involving lower tier properties in tertiary markets. For example, Real Capital Analytics reports that in 1H10, sales for core properties in major markets such as New York, Washington DC, San Francisco, Los Angeles, Chicago and Boston, totaled $13.6 billion, compared with just $4.2 billion for value-add properties in secondary and tertiary markets.
Outlook
Surprisingly, the most significant barrier to the resumption of robust deal flow is not the lack of available capital or leverage, but rather the expectation gap between buyers and sellers, often referred to as the “bid/ask spread.” Since the start of the downturn, many potential buyers have been waiting for prices to decline further, and buyers have been eager to work with lenders in order to avoid accepting “vulture” offers at a significant discount to perceived value. While a tipping point has yet to be reached, high maturities, delinquencies, and defaults suggest that more Real Estate Owned (REO) commercial property will continue to come to market in 2011. Notably, an estimated $200 billion of equity capital has already been raised to target distressed deals, according to CoStar.xx
Bottom line
Deal flow likely will continue to improve, but a gradual increase appears more probable than a rapid rebound. As commercial property defaults are brought to market by lenders, distress will continue to drive transactions, with REITs and foreign investors playing key roles as buyers. However, the long-awaited wave of distressed opportunities may not be as large as expected, decreasing the likelihood of a short-term return to peak transaction levels. For buyers, indications that distress may be peaking could signal that the time is right to work with troubled borrowers and lenders looking to get delinquent loans off of their books.

Commercial Real Estate Outlook: Generating momentum for recovery 13
Issue five: Trajectory of economic fundamentals remains uncertain
There is little doubt that a sustainable, near-term recovery for commercial real estate depends, in great measure, on a contribution from the economy. In response to current conditions, lenders are extending terms of commercial real estate loans, and owners are turning down “vulture” offers, both in hopes that the economy will improve in time to avoid a wave of foreclosures and fire sales. One milestone on the road to recovery has already been achieved, with the September 2010 announcement by the National Bureau of Economic Research (designated arbiter of recessionary periods) that the “Great Recession” officially ended in July 2009, after lasting a total of 18 months.xxi The announcement may seem somewhat hollow considering continued high unemployment, however, and provides no insight as to when strong growth might resume.
GDP growth: Tortoise or hare?
All eyes are on GDP growth (Figure 9), which has remained in positive territory for four consecutive quarters, starting in 3Q09, following four quarters in negative territory. The bottom of the downturn was reached in 4Q08, when growth was negative 6.8 percent; the most recent high was positive growth of 5.0 percent in 4Q09. Recently, however, the economy has lost momentum, remaining in positive territory, but shrinking from 5.0 percent in 4Q09 to 3.7 percent in 1Q10, with just 1.7 percent growth reported in 2Q10. While talk of another sustained period of negative growth was prevalent early in 2010, most economists now expect the economy to avoid a double-dip recession.xxii
Figure 9: Economy struggles to grow
Source: Bureau of Economic Analysis, Blue Chip Indicator, September 2010
Underlying factors: Business spending leads the way
The performance of key GDP components shows that, in recent quarters, business spending has accounted for the majority of growth, a role usually reserved for consumers. Both business and consumer spending are on a four-quarter run of positive contribution to GDP growth, but in 2Q10, business contributed 2.88 percent, compared to 1.54 percent for consumer spending. Long considered the backbone of the economy, consumers have remained conservative about spending, as a result of high unemployment and low confidence. The chief reason that overall growth of 1.7 percent in 2Q10 was not higher, however, is imports, which subtracted 4.58 percent, as struggling U.S. Firms imported less in order to reduce inventories.xxiii
0.9
3.22.3 2.9
(0.7)
0.6
(4.0)
(6.8)
(4.9)
(0.7)
1.6
5.0
3.7
1.7 1.82.3 2.5 2.8 3.0 3.2
(8%)
(6%)
(4%)
(2%)
0%
2%
4%
6% GDP Growth RateForecast
Commercial Real Estate Outlook: Generating momentum for recovery 14
Employment: A long way to go
In the first nine months of 2010, a total of 628,000 jobs were added to the economy, which sounds impressive until you consider it equals just 7.3 percent of the 8.5 million jobs lost since the recession began in 2007. xxiv Jobs are a critical indicator for commercial real estate, as evidenced by the rule of thumb that four jobs equals approximately 1,000 square feet of industry activity.xxv Recently, employment has been volatile, with one million jobs added in the first five months of 2010, peaking at 432,000 in May, before a subtraction of 175,000 jobs in June; 54,000 in July; 54,000 in August; and 95,000 in September. In addition, after reaching a high of 10.1 percent in October 2009, the unemployment rate has hovered in the range of 9.5 percent to 9.7 percent for the first nine months in 2010.xxvi Business owners remain cautious about hiring, and the majority of analysts expect unemployment to remain elevated in 2011, which would deprive commercial real estate of a much-needed boost to demand.
Homeless recovery
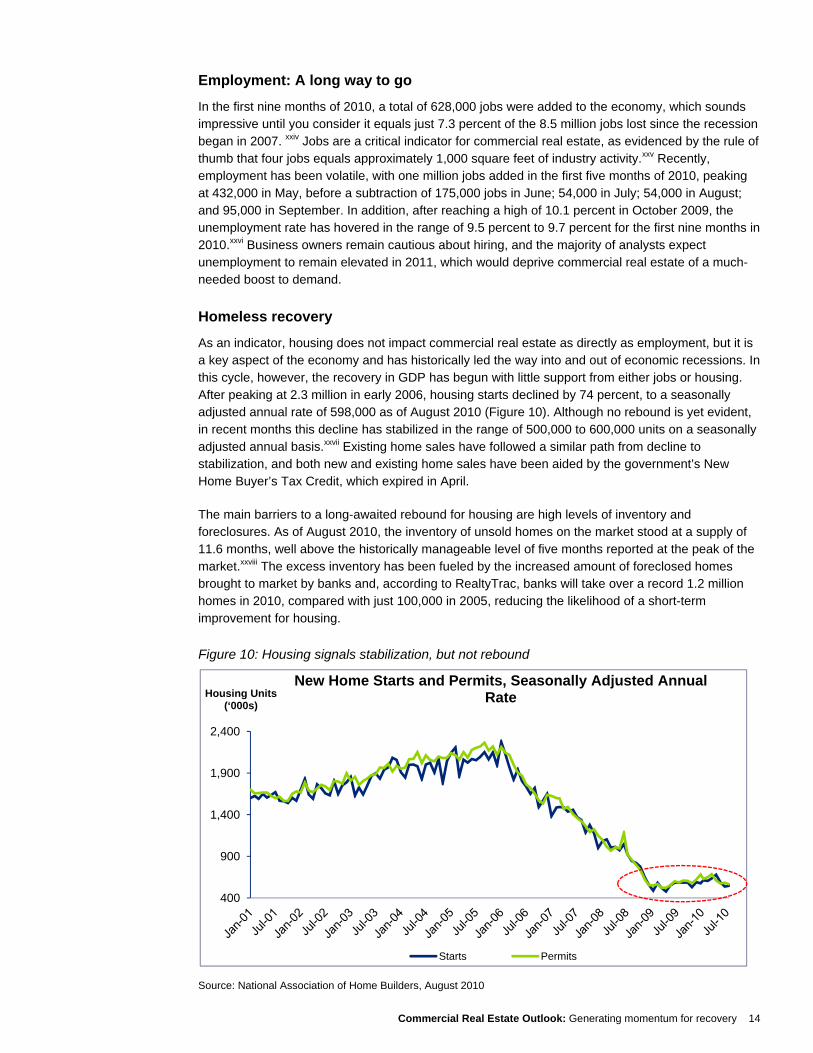
As an indicator, housing does not impact commercial real estate as directly as employment, but it is a key aspect of the economy and has historically led the way into and out of economic recessions. In this cycle, however, the recovery in GDP has begun with little support from either jobs or housing. After peaking at 2.3 million in early 2006, housing starts declined by 74 percent, to a seasonally adjusted annual rate of 598,000 as of August 2010 (Figure 10). Although no rebound is yet evident, in recent months this decline has stabilized in the range of 500,000 to 600,000 units on a seasonally adjusted annual basis.xxvii Existing home sales have followed a similar path from decline to stabilization, and both new and existing home sales have been aided by the government’s New Home Buyer’s Tax Credit, which expired in April.
The main barriers to a long-awaited rebound for housing are high levels of inventory and foreclosures. As of August 2010, the inventory of unsold homes on the market stood at a supply of 11.6 months, well above the historically manageable level of five months reported at the peak of the market.xxviii The excess inventory has been fueled by the increased amount of foreclosed homes brought to market by banks and, according to RealtyTrac, banks will take over a record 1.2 million homes in 2010, compared with just 100,000 in 2005, reducing the likelihood of a short-term improvement for housing.
Figure 10: Housing signals stabilization, but not rebound
Source: National Association of Home Builders, August 2010
400
900
1,400
1,900
2,400
Housing Units (‘000s)
New Home Starts and Permits, Seasonally Adjusted Annual Rate
Starts Permits

Commercial Real Estate Outlook: Generating momentum for recovery 15
Outlook
The economic forecast remains murky, with key indicators suggesting a best-case scenario of steady but weak growth (Figure 11). For GDP, most sources now predict that a second dip into recession will be avoided in the near term, and Blue Chip (a group of 50 economists) expects GDP to advance at a modest pace, reaching a relatively healthy 3.2 percent by 4Q11. The employment picture is not as positive, with experts predicting the unemployment rate will remain above 9.0 percent throughout 2011, with no clear timeline for a return to pre-recession levels in the range of four to five percent. For housing, declines may finally have reached a trough, but the National Association of Home Builders (NAHB) forecasts that starts will not return to a seasonally adjusted annual rate of one million until 2012, which would still be less than half of peak levels.
Figure 11: No clear path for short-term recovery
Economic Indicator Estimated Timing for Recovery Forecast Details
Gross Domestic Product (GDP) 4Q11
• Following weak growth of 1.7 percent in 2Q10, Blue Chip estimates that GDP growth will reach the 15-year historical average of 2.6 percent in 2Q11, and rise gradually to a relatively healthy 3.2 percent by 4Q11.
Unemployment Rate Beyond 2011
• The unemployment rate stood at 9.6 percent as of September 2010 and is expected to be above 9.0 percent during 2011.
• A September 2010 report by Bank of America predicts unemployment to peak at 10.1 percent in 2011.
• A survey by Bloomberg released in August also predicts that the unemployment rate will exceed 9.0 percent throughout 2011.
Housing Starts Partial Recovery by 2012
• After reaching a high of 2.3 million in early 2006, housing starts declined by 74 percent to a seasonally adjusted annual rate of 598,000, as of August 2010.
• While a return to the 2006 peak appears a long way off, the National Association of Homebuilders (NAHB) predicts starts to top one million again by 2012, with an estimated 1.2 million starts.
Inventory of Distressed Residential
Properties End of 2013
• According to Realty Trac, banks will likely foreclose 1.2 million homes in 2010.
• As of 2Q10, one in four home sales was of a foreclosed home, putting the market on track to work through residential distress in approximately three years.
Sources: Blue Chip, Bloomberg, BLS, NAHB, RealtyTrac, Reuters
Bottom line
Modest GDP growth, combined with subdued consumer spending, volatile employment, and weak performance of the housing sector, indicates a robust short -term recovery is unlikely. For commercial real estate market participants, the key will be to develop strategies based on more realistic expectations of a modest and gradual return to growth. The economy does not appear to be an imminent threat to the commercial real estate market, but it appears that it will not be a potent catalyst in the short term, either.

Commercial Real Estate Outlook: Generating momentum for recovery 16
Issue six: Fundamentals moderating, but recovery may be slow Absent a strong boost from the economy, the performance of commercial real estate fundamentals has remained weak for an extended period. However, while trends vary by property type, some key industry metrics indicate that sharp declines experienced during the height of the downturn are in the process of stabilizing. In particular, the apartment segment has demonstrated improvement, and industrial properties are poised to benefit from global economic recovery. Slowing deterioration of fundamentals such as occupancy, rent, and pricing is positive for the industry, but it remains uncertain whether the market has hit bottom or is just experiencing a temporary respite from further declines.
Vacancy increases peaking Commercial real estate vacancy rates have recently approached or surpassed levels reached in the previous major downturn of 1989-1993, but appear to be leveling off in 2010. According to CBRE estimates, the high points for vacancy in the current cycle are estimated to be 2Q09 for apartment, 3Q10 for retail and industrial, and 4Q10 for office. After peaking, vacancies are expected to decrease gradually (Figure 12), with apartments returning to pre-recession levels in 3Q10, followed by industrial in 2Q15. However, office and retail vacancies are not expected to return to pre-recession levels before 2016.xxix
Figure 12: Vacancy levels expected to improve gradually
Source: CBRE, September 2010xxx
Rent reductions bottoming
In order to retain tenants, commercial property owners and operators have been reducing rents and offering concessions for two years; however, elevated vacancies are expected to make further rent reductions necessary before a gradual improvement can begin (Figure 13). The reversal of rent growth has been most extreme in the office segment, which went negative in 4Q08 and fell by 10.5 percent in 1H09. The decrease has since slowed and positive growth resumed in 2Q10, but a return to pre-recession levels is not expected before 2016. The decline in rent for retail properties was not as severe, but while positive growth is expected to resume in 3Q11, a return to pre-recession levels is also not anticipated before 2016. Expectations for apartment and industrial are more favorable,
0
2
4
6
8
10
12
14
16
18
20
2Q89
2Q90
2Q91
2Q92
2Q93
2Q94
2Q95
2Q96
2Q97
2Q98
2Q99
2Q00
2Q01
2Q02
2Q03
2Q04
2Q05
2Q06
2Q07
2Q08
2Q09
2Q10
2Q11
2Q12
2Q13
2Q14
2Q15
2Q16
Office Industrial Retail Apartment
Office Vacancy Peaked at 19.1 percent in 2Q91
VacancyRate (Percent)
National Vacancy Rate by Property Forecast

Commercial Real Estate Outlook: Generating momentum for recovery 17
with a return to pre-recession levels for rent growth anticipated to occur in 3Q11 and 1Q12, respectively, according to CBRE estimates.
Figure 13: Rent poised for return to growth
Source: CBRE, September 2010xxxi
Property- type snapshots
• Office: Office fundamentals are on the mend, particularly in downtown areas, with visible signs of improvement in suburban areas. Completions continue to slow as lower demand and weak credit availability are limiting development activity. In fact, the office sector posted positive net absorption of seven million square feet in 3Q10. Further, despite historically high vacancy levels of 17.6 percent during 3Q10, effective rents were essentially flat compared to the previous quarter. That said, high unemployment levels will potentially result in tepid recovery of office demand.xxxii
• Retail: Retail space continues to face substantial demand-side challenges, namely a decline in retail sales following high unemployment, low consumer confidence levels, and reduced discretionary spending. Further, the leasing environment is pressured by increasing bankruptcies and portfolio restructuring by retailers. In fact, given landlords’ weak bargaining power, there has been a substantial flight to quality among retail tenants. As such, in 3Q10, vacancy remained flat at 13.2 percent and effective rents declined by 0.1 percent sequentially.xxxiii
• Apartment: The apartment sector is benefiting from favorable demand-supply dynamics. A modest increase in demand is being complemented by low supply, as tight underwriting standards continue to favor renting and impact home-buying decisions. In 3Q10, net absorption was 84,382 units, while vacancy levels declined to 5.7 percent and effective rents increased by 0.6 percent sequentially. However, a sustainable recovery in apartment demand remains dependant on a reduction in unemployment levels.
• Industrial: The industrial sector is experiencing a modest increase in leasing activity across many markets as manufacturers begin to replenish depleted inventory levels in line with demand. Vacancy levels declined 10 bps sequentially to 14.0 percent in 3Q10, although availability remained at record-high levels, pressuring rental growth. With manufacturers maintaining lean inventories in light of low consumer-spending levels, demand for industrial space likely will remain muted.xxxiv
(15%)
(10%)
(5%)
0%
5%
10%
15%
2001 2002 2003 2004 2005 2006 2007 2008 2009 2010 2011 2012 2013 2014
Rent Growth
Forecast
National Rent Growth by Property Type
Office Industrial Retail Multihousing

Commercial Real Estate Outlook: Generating momentum for recovery 18
• Hotels: Demand for lodging continues to recover, driven by improved business and leisure travel. Occupancy and revenue per available room (RevPAR) rose 8.8 percent and 18.9 percent on a quarter-over-quarter basis, respectively, in 2Q10. Notably, the recent RevPAR growth has come without a meaningful improvement in average daily rate (ADR), as hotels continue to offer competitive rates to increase occupancy. However, limited new supply and higher occupancy levels likely will lead to a rise in ADR in the next few quarters.xxxv
Have values reached bottom?
Since peaking in October 2007, commercial real estate prices have declined by 43.2 percent as of July 2010, and appear to be struggling to generate momentum. The sharp decline in pricing appears to have hit bottom in October 2009 (Figure 14), but price trends have been volatile since and have yet to signal that a recovery has begun. The increase in distressed properties coming to market has fueled transactions, but has not provided a similar boost to pricing, due to the deep discounts associated with those deals. For example, CoStar reports that discounts for distressed property sales compared to nondistressed sales have averaged 40 percent for apartment properties, 20 percent for industrial and office, and 17 percent for retail between 3Q07 and 3Q10.xxxvi
Figure 14: Prices remain low, but decline is moderating
December 2000 = Base 1 Source: Moody’s/Real, RCA, September 2010. Data is through the end of July 2010xxxvii
Outlook
In the uncertain market environment, commercial real estate fundamentals are sending mixed signals: there are early signs of improvement in transactions, positive returns, and indications that declines in pricing, occupancy, and rent growth are moderating in advance of a rebound. However, prospects for a majority of indicators appear consistent with expectations for the broader economy — low and slow growth. For example, the worst appears to be over for occupancy, but apartment and industrial properties are likely more than two years from a return to where they were before the
1.92
1.09
0.9
1
1.1
1.2
1.3
1.4
1.5
1.6
1.7
1.8
1.9
2
Jan-
01A
pr-0
1Ju
l-01
Oct
-01
Jan-
02A
pr-0
2Ju
l-02
Oct
-02
Jan-
03A
pr-0
3Ju
l-03
Oct
-03
Jan-
04A
pr-0
4Ju
l-04
Oct
-04
Jan-
05A
pr-0
5Ju
l-05
Oct
-05
Jan-
06A
pr-0
6Ju
l-06
Oct
-06
Jan-
07A
pr-0
7Ju
l-07
Oct
-07
Jan-
08A
pr-0
8Ju
l-08
Oct
-08
Jan-
09A
pr-0
9Ju
l-09
Oct
-09
Jan-
10A
pr-1
0Ju
l-10
43.2 percent decline from 10/07 peak
Moody’s/Real Commercial Property Price IndexIndex

Commercial Real Estate Outlook: Generating momentum for recovery 19
downturn. For office and retail, vacancy is expected to exceed pre-downturn levels for even longer, according to CBRE estimates (Figure 15).
Figure 15: Gradual rebound for commercial space demand
Property Type
Pre-Recession Vacancy Rate — 3Q07 Market Peak (%)
Peak in Current Cycle (%)
Expectation for Return to Pre-Recession Level
Apartment 4.37 2Q09 (7.43) 3Q13
Industrial 9.40 3Q10 (14.2) 2Q15
Retail 8.80 3Q10 (13.2) After 2016
Office 12.50 4Q10 (17.0) After 2016
Source: CBRE, October 2010xxxviii
Bottom line
Commercial real estate has traditionally lagged economic recoveries, and must now contend with looming maturities, a high level of available commercial space, and modest contribution from the economy. With fundamentals for some property types forecasted to take more than five years to return to where they were before the downturn, the industry be entering an era of reduced expectations. For some owners and operators, this could suggest the time is right to take a “back- to- basics” approach by focusing on property operations, such as leasing, expense control, capital investment, and property management as a way of adding value until healthy conditions resume.
Commercial Real Estate Outlook: Generating momentum for recovery 20
Issue seven: REIT rebound continues
Commercial real estate fundamentals may be in the early stages of a slow recovery, but another key element of the market — Real Estate Investment Trusts (REITs) — has already demonstrated a strong rebound. The main difference in recovery speed is that property fundamentals such as vacancy, rent, and values are closely linked to the sluggish economy, while REITs are driven by investor perception of performance relative to competing asset classes such as stocks and bonds. Return on investment for REITs has outperformed the competition recently, and firms are taking advantage of the spotlight by raising funds, which could eventually lead to increased acquisition activity for the segment.
Robust returns
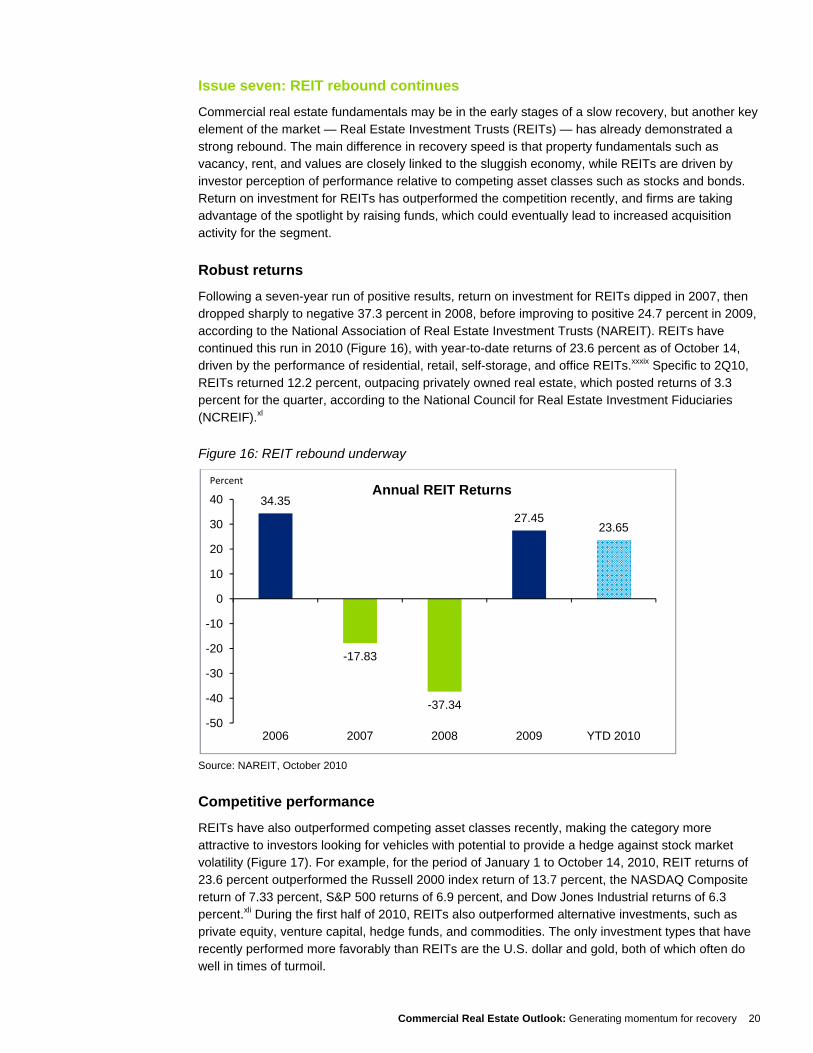
Following a seven-year run of positive results, return on investment for REITs dipped in 2007, then dropped sharply to negative 37.3 percent in 2008, before improving to positive 24.7 percent in 2009, according to the National Association of Real Estate Investment Trusts (NAREIT). REITs have continued this run in 2010 (Figure 16), with year-to-date returns of 23.6 percent as of October 14, driven by the performance of residential, retail, self-storage, and office REITs.xxxix Specific to 2Q10, REITs returned 12.2 percent, outpacing privately owned real estate, which posted returns of 3.3 percent for the quarter, according to the National Council for Real Estate Investment Fiduciaries (NCREIF).xl
Figure 16: REIT rebound underway
Source: NAREIT, October 2010
Competitive performance
REITs have also outperformed competing asset classes recently, making the category more attractive to investors looking for vehicles with potential to provide a hedge against stock market volatility (Figure 17). For example, for the period of January 1 to October 14, 2010, REIT returns of 23.6 percent outperformed the Russell 2000 index return of 13.7 percent, the NASDAQ Composite return of 7.33 percent, S&P 500 returns of 6.9 percent, and Dow Jones Industrial returns of 6.3 percent.xli During the first half of 2010, REITs also outperformed alternative investments, such as private equity, venture capital, hedge funds, and commodities. The only investment types that have recently performed more favorably than REITs are the U.S. dollar and gold, both of which often do well in times of turmoil.
34.35
-17.83
-37.34
27.4523.65
-50
-40
-30
-20
-10
0
10
20
30
40
2006 2007 2008 2009 YTD 2010
Annual REIT ReturnsPercent

Commercial Real Estate Outlook: Generating momentum for recovery 21
Figure 17: REITs outperforming competition
Asset Class 2007 2008 2009 2010 YTD*
Public REIT (NAREIT All REIT Index)
(17.83) (37.34) 27.45 23.65
Russell 2000 (1.57) (33.79) 27.17 13.77
NASDAQ 9.81 (40.54) 43.89 7.33
Private Real Estate (NCREIF Property Index) 15.85 (6.46) (16.85) 3.3**
S&P 500 5.49 (37.00) 23.46 6.93
DJIA 6.43 (33.84) 18.82 6.39
*Note: YTD is as of 10/14/2010, ** Note: As of 2Q10 Source: Bloomberg, October 2010
REITs raising funds
The recent REIT rally has been driven, in part, by investors’ realization that REITs took on far less debt than private real estate investors during the peak-to-trough period of 2007 to 2009, and sold at the top of the market, while private equity investors continued to buy. Conversely, when the market plummeted, REITs began to acquire properties from highly leveraged investors at deeply discounted prices.xlii In 1H09, REITs accounted for 3.9 percent of commercial real estate transactions, compared with 13.8 percent in 1H10.xliii
One advantage for the segment is its ability to tap the stock market, and REITs have been responding to investor interest by raising capital via equity offerings and unsecured debt. In 2009, REITs raised $34.6 billion via secondary equity and unsecured debt, nearly double the $17.9 billion raised in 2008. In 2010, REITs are on track to surpass the 2009 total, with $32.5 billion raised in the first three quarters of the year (Figure 18).xliv In 2009, REITs used this capital to strengthen balance sheets by paying down debt ahead of schedule and to cover dividends. Recently, however, a greater share has been used to fund acquisitions. In 2010, REIT property purchases could reach $16 billion, compared with $4 billion in 2009, according to an estimate by KeyBanc Capital Markets.xlv

Commercial Real Estate Outlook: Generating momentum for recovery 22
Figure 18: REIT fund-raising on the rise
Note: YTD is as of 9/30/10 Source: NAREIT, October 2010
Outlook
There is no way to predict whether REIT returns will continue to outpace the stock market, but REITs retain key qualities that suggest they will remain attractive to investors as the economy recovers. In addition to providing dividends to investors, REITs include hard assets, and as such traditionally have been perceived as safe havens during economic downturns and a potential hedge against inflation. As recent results indicate, REITs also frequently have a low correlation to conventional assets, such as stocks and bonds. In addition, REITs offer the advantage of professional management, and provide portfolio diversification.xlvi Over the longer term, demand may also be driven by increased popularity of the REIT structure on a global scale, which provides more opportunities for investors. REITs recently have been introduced in Belgium, Hong Kong, Japan, Netherlands, and Singapore, with China, Algeria, Egypt, Indonesia, and Nigeria also considering REIT-type structures.
Bottom line
REITs have been a top performer among investment types recently, but remain subject to the vagaries of the market, and there is no guarantee that the recent level of return on investment will continue. However, REITs remain attractive to investors, based on qualities such as flexibility and liquidity, and are currently perceived as favorably positioned for the post-recession environment. Going forward, the expectation is that REITs will use funds raised via equity offerings to take advantage of distress-driven acquisition opportunities.
2.6 1.6
19.415.6
6.7 15.4
0
5
10
15
20
25
30
35
2009 YTD 2010 YTD
$ Billion
IPO Secondary Equity Secondary Debt
Fund-raising by Public REITsYTD 2009 vs. TYD 2010
32.528.6

Commercial Real Estate Outlook: Generating momentum for recovery 23
Issue eight: Capital markets — lending stabilizes; demand subdued
As commercial real estate struggles to deleverage, key lending sources have demonstrated flexibility in the treatment of existing debt, but have remained somewhat strict in terms of new loan origination. Commercial mortgage originations by banks and life insurance companies remain significantly below peak-market levels, and new issuance from alternative sources such as CMBS remains minimal. New lending is expected to remain subdued in the near term; however, stabilization is evident and alternative sources such as CMBS are showing signs of renewal.
Fewer banks tightening underwriting
Banks responded to the financial crisis by rapidly tightening underwriting on commercial loans, but evidence suggests that approval standards have begun to ease. The most recent Federal Reserve survey of senior loan officers at banks found that just 13 percent of banks are continuing to tighten lending standards, extending the trend of a steady reduction from a high of 87 percent in 4Q08 (Figure 19). The majority of senior loan officers surveyed cited a lower degree of economic uncertainty as the main reason for the change.xlvii
Figure 19: Underwriting standards unwinding
Source: Federal Reserve, July 2010
New issuance remains subdued
Standards may be easing, but new commercial mortgage originations remain low despite favorable interest rates, as subdued property sales, depressed property values, and the amount of troubled loans already on balance sheets have kept borrowing to a minimum. The decrease in lending appears to have stabilized, however, and the Mortgage Banking Association reports that in 2Q10, commercial and multifamily mortgage originations were one percent higher than 2Q09, and 35 percent higher than 1Q10 (Figure 20).xlviii Higher originations for office and industrial properties drove the increase. In addition, life insurance companies have outpaced commercial banks in terms of new
42 43 45 46
3126
22
1418
14
0
(6)(11)
(9)
(18)(24)
(22)
(13)
(5)
2 2
11
36
2630
25
50
80 79 8187
79
66
46
3427
13
(40%)
(20%)
0%
20%
40%
60%
80%
100%
2Q01
4Q01
2Q02
4Q02
2Q03
4Q03
2Q04
4Q04
2Q05
4Q05
2Q06
4Q06
2Q07
4Q07
2Q08
4Q08
2Q09
4Q09
2Q10
Percent Percentage of Banks Tightening Lending Standards on Commercial Loans

Commercial Real Estate Outlook: Generating momentum for recovery 24
lending growth as they actively pursue new business in major markets, increasing scope to include nearly all price ranges and property types.
Figure 20: Lending below peak, but stabilizing
Source: Mortgage Bankers Association, July 2010xlix
Signs of life for securitized lending?
In 2008, commercial mortgage-backed securities (CMBS) accounted for 25.6 percent of commercial mortgage loans; however, due to the central role these and similar securities played in the financial crisis, issuance dropped to nearly zero in 2009. Rumors of the demise of CMBS may have been premature, though, as a total of $4.8 billion of private-label CMBS transactions was issued in the first three quarters of 2010, with the 4Q10 pipeline indicating that CMBS will total $14 billion for the yearl. The current level of CMBS issuance is a sizable increase from the $729.0 million offered in 2009, but remains far off the market’s 2007 peak of $230.5 billion. Going forward, the expectation is that more favorable market conditions for both lenders and borrowers will help boost CMBS issuance in the near term, although the level will remain below the 2007 peak over the longer term.li
New sources go back to basics
Securitized loans issued in 2009 and 2010 have been dubbed CMBS 2.0, and are characterized by simpler structures that involve greater subordination levels, fewer classes and loans, and thicker tranches, all designed to reduce the level of due diligence required to execute.lii Additional funding sources are also emerging, including covered bonds, which consist of securities issued by banks and backed by a “cover pool” of mortgage or public-sector loans. This vehicle is one of the oldest forms of capital in the European bond market, and could provide a new funding mechanism as the industry attempts to rebound. Another simple and direct throwback that is being utilized is seller financing, which involves the seller making a secured loan to the buyer to finance a portion of a property’s purchase price.
0
100
200
300
400
500
600
700
1Q05 4Q05 3Q06 2Q07 1Q08 4Q08 3Q09 2Q10
IndexCommercial/multifamily Mortgage Bankers Originations
Index
CMBS Commercial Banks Life Insurance Co.s Fannie Mae / Freddie Mac

Commercial Real Estate Outlook: Generating momentum for recovery 25
Outlook
Prevailing trends suggest that lending by commercial banks, life insurance companies, and Fannie Mae and Freddie Mac will remain stable but below peak levels for the next few years, as underwriting standards ease and maturities are gradually resolved. Subdued levels of new origination will be somewhat offset by alternative sources, and Standard & Poor’s estimates that lower risk-free interest rates and tighter spreads will result in CMBS issuance of between $35 and $45 billion in 2011.liii
Bottom line
The stabilization of bank lending and the renewal of CMBS are critical developments for the industry, but the modest level of issuance will do little to help the majority of commercial real estate lenders obtain financing, and issuance is expected to be focused primarily on high-quality, stabilized assets. Deleveraging continues, and despite the potential emergence of alternatives such as covered bonds and seller financing, new commercial mortgage origination is expected to remain subdued until the high level of maturities is reduced to a more sustainable level.

Commercial Real Estate Outlook: Generating momentum for recovery 26
Issue nine: Regulations directly and indirectly impact CRE
In 2008 and 2009, government intervention in the form of stimulus programs, including the Troubled Asset Relief Program (TARP) and the Term Asset- Backed Loan Facility (TALF), indirectly impacted commercial real estate by injecting liquidity into the financial system and helping prevent the financial crisis from intensifying further. Stimulus programs also impacted CRE more directly, as when TALF was extended in August 2009 to include CMBS. In 2010 and 2011, newly introduced financial and health care regulations should also impact commercial real estate both directly and indirectly, perhaps leading to increased demand for commercial space, as well as decreased access to capital.
Health care reform’s impact
The newly enacted Patient Protection and Affordable Care Act (commonly known as PPACA, or Health Care Reform) is expected to have a mixed impact on commercial real estate. On the positive side, the increased insurance universe as a result of PPACA is expected to lead to demand of 60 million square feet of medical space between 2010 and 2019, according to National Real Estate Investor. In particular, the number of retail clinics is expected to increase by 10 to 15 percent between 2010 and 2012, and by 30 percent between 2013 and 2014. Certain aspects of the regulation could also indirectly limit commercial real estate growth, especially if increased operating costs cause companies with 50 or more employees to cut back on expansion plans.liv
Financial reform’s impact
Recently enacted financial regulations are expected to continue the trend of increasingly limited access to leverage for commercial real estate deals. The Dodd-Frank Wall Street Reform and Consumer Protection Act, which was signed into law in July 2010, includes provisions which tighten capital and compliance requirements for banks, which could potentially lead to a reduction in real estate lending and investment. More directly, the legislation requires CMBS issuers to provide greater disclosure and to retain a 5.0 stake in the securitized asset, which could create a more restrictive environment for issuers and credit rating agencies.lv
Proposed lease accounting standards
The Financial Accounting Standards Board (FASB) and the International Accounting Standards Board (IASB) have jointly proposed new lease accounting standards that would require firms to recognize all lease liabilities and assets on their corporate balance sheets. The proposed guidelines are expected to be finalized and effective starting in 2013, and are intended to create greater transparency and consistency in lease accounting procedures. The proposed changes could cause tenants to look for shorter-term leases, but this is not necessarily a negative, as margins for owners are often higher for shorter leases.lvi
Outlook
In addition to health care and financial reform, the U.S. government has proposed other new regulations that could have an influence on industry performance (Figure 21). For example, proposed reforms to the Foreign Investment in Real Property Tax Act (FIRPTA) would raise the level of foreign ownership allowed in public REITs from 5.0 percent to 10.0 percent, potentially leading to increased foreign investment.lvii Also, the Commercial Real Estate Finance Council (CREFC) has proposed the introduction of “covered bonds,” which could provide an alternative source of capital for investors.lviii In addition, the government has proposed increasing taxes on carried interest from 15.0 percent to 35.0 percent, which could discourage risk-taking and reduce incentives for fund managers and investors.lix

Commercial Real Estate Outlook: Generating momentum for recovery 27
Figure 21: Impact of regulation on Commercial Real Estate
Sources: Deloitte, Golston & Storrs, FASB, IASB, Rosen Consulting, CREFC, ICSC
Bottom line
While the actions taken by the government have been quick and aggressive, they have yet to demonstrably stem the tide of job losses or to get credit flowing freely again. Recently enacted health care legislation will likely provide a boost to commercial real estate demand, but financial regulations could make it more challenging for commercial real estate firms to access leverage in both the near and longer terms. Credit is the life blood of commercial real estate, and stakeholders may need to make adjustments based on the assumption that the rules have changed, and that the era of cheaply available debt enjoyed at the peak of the market is gone forever.
The Healthcare Act
Financial Regulations
Proposed New Lease Accounting
Standards
Negative Impact • Limited business expansion
Positive Impact• Higher demand for overall medical space, especially
retail clinics
• Increased role for retail clinics
Negative Impact
• Dodd–Frank Act: Restricted investments and creditlending in real estate
• Carried Interest Regulation: Restricted real estateinvestment by hedge funds; Constrained partnershipstructures
Positive Impact
• Foreign Investment in Real Property Tax Act(FIRPTA): Improved foreign capital flows andstabilized asset values
• Proposed Introduction of Covered Bonds: Improvedreal estate lending and investment
FASB and IASB proposed new guidelines in accounting to push leaseliabilities on to corporate balance sheets.
Negative Impact • Tenants may prefer short-term leases in order to showlower lease liabilities in their balance sheets.
Positive Impact • However, shorter leases commonly include higher rent,which could offset the impact.
Regulation Implications Direct Impact
Indirect Impact

Commercial Real Estate Outlook: Generating momentum for recovery 28
Issue ten: Positive signs for global CRE
Global commercial real estate has shown signs of improvement, following a pause in the industry’s globalization as a result of the financial and economic downturn that originated in the United States. In non-U.S. markets, investment trends began to demonstrate a return to growth in the first half of 2010, but a rebound to robust, pre-crisis levels is challenged by some of the same lending and distress-related issues that have been prevalent in the United States. As the global market begins to recover, the Asia Pacific region is expected to be a catalyst for growth, both as a destination and a source of investment into the U.S. market.
Signs of modest growth
Global commercial real estate investment reached a peak of $1.22 trillion in 2007, before decelerating rapidly to $402 billion in 2009 (Figure 22), as economic and financial turmoil spread outside of the United States. In the first three quarters of 2010, however, global CRE sales volume increased by 39.3 percent on a year-over-year basis, to $334.8 billion, which is well below the 2007 peak but on track to outpace 2009 results, according to Real Capital Analytics data.lx One significant trend that emerged during the downturn is that while the Americas and EMEA regions remained on a downward path, volume in the Asia Pacific region began to rebound in 2009; it emerged as the leading region for investment, despite tighter lending policies and continuing economic uncertainty.
Figure 22: Global CRE volume improving year over year
Source: Real Capital Analytics
Common challenges outside of the United States
Similar to developments affecting the United States, delinquencies and defaults on commercial property loans have risen worldwide, and banks have chosen to extend the terms of troubled loans instead of recognizing losses, producing a delay in distressed transactions. While the United States leads the way with an estimated $290 billion in distressed commercial real estate, Europe is not far behind, with an estimated $207 billion in distress as of 3Q10. In the Asia Pacific region, China’s level of distress is difficult to determine due to a lack of transparency, but approximately $170 billion in commercial real estate debt in Japan is expected to come due in the next few years. On a global
548
157
56 66
406
225
11989
268
161
227179
0
100
200
300
400
500
600
2007 2008 2009 2010 YTD*
Americas EMEA Asia-Pacific
CRE Transaction Volume by Region, 2007-YTD 2010$ Billion
Global CRE sales volume increased 39.3 percent to $334.8 billion in the first three quarters of 2010, compared to the same period in 2009.

Commercial Real Estate Outlook: Generating momentum for recovery 29
scale, banks are slowly unwinding troubled loans and investors are impatiently awaiting the emergence of opportunities arising from distress.lxi
Foreign investors finding value in U.S. market
As a result of the downturn, foreign investors curtailed investment in the U.S.CRE market in 2008 and 2009; however, there are signs that investors have once again begun to favor U.S. opportunities. While U.S. transaction volume remains at a low level, the percentage of deals by foreign investors increased from 8.0 percent of all deals in 2008, to 11.3 percent as of mid-2010, with the majority of transactions involving quality office and apartment properties, followed by retail and industrial.lxii This trend is expected to continue: in the most recent survey by the Association of Foreign Investors in Real Estate (AFIRE), 51 percent of respondents identified the United States as providing the best opportunity for capital appreciation.lxiii
Changing buyer composition
The downturn also generated a change in the composition of U.S. property buyers, as some traditional sources—investors from Australia and Germany, for example—reduced allocations due to trouble in their home markets (Figure 23). Investors from Australia have a long track record of cross-border investment, and accounted for 39.0 percent of foreign investment into the U.S. commercial property market in 2007. However, institutional investors in Australia became risk-averse as the global economic downturn developed, leading to a sharp decrease in allocations. Conversely, Canadian investment has increased as of 1H10, contributing nearly $1.4 billion (or 47.0 percent) of total foreign investments compared with 19.0 percent in 2007, as investors crossed borders to take advantage of the emergence of distressed opportunities in the United States.
Figure 23: Some key sources of foreign investment have retreated
YTD represents until May 31, 2010. Data excludes casinos and development sites. Rest of Asia-Pacific includes Pakistan, Philippines, Taiwan, India, Sri Lanka, Singapore, China, South Korea, Malaysia, and Guam. Rest of Americas includes Bahamas, Bermuda, Chile, Mexico, Panama, Puerto Rico, Venezuela, and Brazil. Rest of Europe includes Spain, Ireland, Netherlands, Switzerland, Italy, France, Norway, Sweden, Albania, Denmark, Greece, Poland, Cyprus, Luxembourg, Slovenia, Belgium, and Portugal. Source: RCA July 2010
39%
7%
3%
4%9%
19%
19%
Australia Israel Rest of Asia-Pacif ic Germany United Kingdom Rest of EMEA Canada Rest of Americas
0.4%
14%
6%
5%
7%
17%
47%
4%
3%1%
11%
28%
18%
25%
12%
2%
2009 — $4.2 billion 2010 YTD — $3.0 billion2007 — $37.4 billion
Foreign Investment in U.S. CRE by Region

Commercial Real Estate Outlook: Generating momentum for recovery 30
Outlook
The growth of commercial real estate investment has been curtailed globally, as cross-border investors became increasingly risk-averse during the downturn. However, the U.S. market has started to become more attractive to foreign investors, based on its low prices and the expectation that looming maturities will result in an increase in distressed assets coming to market. This dynamic has resulted in pent-up demand, as investors have raised funds to target deals that have yet to materialize. According to DTZ Research, an estimated $281 billion has already been raised to target direct real estate globally in 2011, with the amount of new capital targeting the United States increasing by 54 percent over the first three quarter of 2010, climbing close to $100 billion.4
Bottom line
Foreign acquisitions are a key component to recovery for United States CRE. As the U.S. economy stabilizes and distress-driven opportunities emerge, foreign investment in U.S. property should generate gradual momentum, supported by investors’ favorable assessment of risk vs. reward, and the high level of capital already being raised globally. The U.S. market will benefit from pent-up demand from foreign investors seeking to diversify, but competition will be intense for the limited number of high -quality properties available. Over the longer term, the U.S. market will also face increased competition for investment from foreign sources, as GDP growth in emerging markets is expected to be higher, driving investors to increase focus on opportunities in those countries.
4 “Capital Shifts to Attractive Markets,” DTZ Research, October 13, 2010

Commercial Real Estate Outlook: Generating momentum for recovery 31
Contacts
Bob O’Brien Partner and Vice Chairman U.S. Real Estate Services Leader Deloitte & Touche LLP +1 312 486 2717 [email protected]
Guy Langford Partner Distressed Debt & Asset Leader Deloitte & Touche LLP +1 212 436 3020 [email protected]
Jim Berry Partner Real Estate Services Deloitte & Touche LLP +1 214 840 7360 [email protected]
Ken Meyer Principal Real Estate Services Deloitte Consulting LLP +1 973 602 5237 [email protected]
Matt Kimmel Principal Real Estate Services Deloitte FAS LLP +1 312 486 3327 [email protected]
Larry Varellas National Tax Managing Partner Real Estate Services Deloitte Tax LLP +1 415 783 6637 [email protected]

Endnotes
i Real Estate Roundtable, October 2010 ii Foresight Analytics, BEA, NCREIF, Moody’s/REAL Property Index iii “The Big Read: To Fix Sour Property Deals, Lenders ‘Extend and Pretend’ — Restructured Loans for Commercial Real Estate Stand at Many Times Levels Common in Recent Years,” Wall Street Journal, July 9, 2010, and “USA Risk: Alert — Commercial Property Woes are Likely to Resume,” Economist Intelligence Unit — Risk Briefing, September 7, 2010 iv “The Big Read: To Fix Sour Property Deals, Lenders ‘Extend and Pretend’ — Restructured Loans for Commercial Real Estate Stand at Many Times Levels Common in Recent Years,” Wall Street Journal, July 9, 2010 v “Troubled Asset Radar,” Real Capital Analytics, September, 2010 vi “CB Richard Ellis Forecasts Incremental Rebound for Commercial Real Estate,” Los Angeles Times, September 13, 2010 vii “Commercial Real Estate Borrowers Join the Ranks of Strategic Defaulters,” Atlantic.com, August 26, 2010 viii “The Big Read, To Fix Sour Property Deals, Lenders ‘Extend and Pretend’ — Restructured Loans for Commercial Real Estate Stand at Many Times Levels Common in Recent Years,” Wall Street Journal, July 9, 2010 ix “Monthly Delinquency Report,” TreppWire, October, 2010 x “Commercial Real Estate Borrowers Join the Ranks of Strategic Defaulters,” Atlantic.com, August 26, 2010 xi “State of the Commercial Real Estate Lending Markets,” MIAC Analytics, July 7, 2010 xii “CB Richard Ellis Forecasts Incremental Rebound for Commercial Real Estate,” Los Angeles Times, September 13, xiii “CB Richard Ellis Forecasts Incremental Rebound for Commercial Real Estate,” Los Angeles Times, September 13, 2010 xiv RCA transaction database, Real Capital Analytics, September, 2010 [i] RCA transaction database, Real Capital Analytics, September, 2010 xv “In 2010, REITs Hit Stock Market Cash Machine Before Heading to CRE Marketplace,” Bloomberg, September 24, 2010 xvi “Eight Takeaways on the Current State of Distress Opportunities,” CoStar Group, August 25, 2010 xvii “Moody’s/REAL Index Drops as Distress Sales Share Rises,” Real Capital Analytics, August 26, 2010 xviii “Additions to Trouble Fall to Lowest Level Since October ’08,” RCA U.S. Capital Trends, September, 9, 2010 xix “GlobeSt.com: Distress Expected to Plateau at $200B,” GlobeSt.com, August 26,2010 xx “Eight Takeaways on the Current State of Distress Opportunities,” CoStar Group, August 25, 2010 xxi “Recession Officially Ended in June 2009,” CNNMoney.com, September 20, 2010 xxii Blue Chip, September 10, 2010 xxiii “Gross Domestic Product: Second Quarter 2010 (Third Estimate),” Bureau of Economic Analysis, September 30, 2010 xxiv “U.S. Unemployment May Rise Toward 10 Percent on ‘Feeble’ Growth,” Bloomberg, September 7, 2010 xxv “Commercial Real Estate Industry is Following a Trend of Slow Recovery,” The Hour, September 22, 2010 xxvi Bureau of Labor Statistics, October 2010 xxvii National Association of Home Builders, October 2010 xxviii National Association of Realtors (NAR), October 2010 xxix “Fall 2010 Outlook,” CB Richard Ellis — Econometric Advisors (CBRE-EA), September 2010 xxx “Fall 2010 Outlook,” CB Richard Ellis — Econometric Advisors (CBRE-EA), September 2010 xxxi “Fall 2010 Outlook,” CB Richard Ellis — Econometric Advisors (CBRE-EA), September 2010 xxxii “CBRE Office Flash Report,” CBRE, October 2010 xxxiii “CBRE Retail Flash Report,” CBRE, October 2010 xxxiv “CBRE Industrial Flash Report,” CBRE, October 2010 xxxv “STR’s Second Quarter Review for the Hotel Industry,” STR, July 22, 2020 xxxvi “Moody’s/REAL Commercial Property Price Index,” MIT Center for Real Estate, September 27, 2010 xxxvii “Moody’s/REAL Property Price Index,” MIT Center for Real Estate, September 27, 2010 xxxviii “Fall 2010 Outlook,” CB Richard Ellis — Econometric Advisors (CBRE-EA), September 2010 xxxix “FTSE NAREIT U.S. Real Estate Index,” National Association of Real Estate Investment Trusts, October 14, 2010 xl “NCREIF Property Index Returns — 2Q10,” National Council for Real Estate Investment Fiduciaries, October 2010 xli “FTSE NAREIT U.S. Real Estate Index,” National Association of Real Estate Investment Trusts, October 14, 2010 xliii “Smaller Gains From REIT Funds,” Investor’s Business Daily, August 13, 2010 xliv “RCA Property Database,” Real Capital Analytics, October 2010 xlv “FTSE NAREIT U.S. Real Estate Index,” National Association of Real Estate Investment Trusts, October 14, 2010 xlvi “U.S. REITs Use Stock Sales to Grow After Paying Debt,” Bloomberg, September 24, 2010 xlvii “REIT: Another Four-Letter Word or a Golden Opportunity?,” The Miami Herald, September 12, 2010

xlviii “Senior Loan Officer Opinion Survey on Bank Lending Practices,” Federal Reserve, July 2010 xlix “Riding the Edge of Success,” Real Estate Research Corporation (RERC), Summer 2010 l Commercial Mortgage Alert, October 2010 li “Commercial/Multifamily Mortgage Bankers Origination Index,” Mortgage Bankers Association (MBA), July 2010 lii “Year on Track for $11 Billion of CMBS Issuance; Next Year Could See $35 Billion,” Commercial Real Estate Direct, October 1, 2010 liii “CMBS 2.0-Back to the Basics,” Citigroup Global Markets, September 24, 2010 liv “Year on Track for $11 Billion of CMBS Issuance; Next Year Could See $35 Billion,” Commercial Real Estate Direct, October 1, 2010 lv “Can Healthcare Rescue Real Estate?,” Deloitte Center for Health Solutions, 2010 lvi “Implications of Financial Reforms for Commercial Real Estate,” Goulston and Storrs, July 2010 lvii Financial Accounting Standards Board (FASB) and International Accounting Standards Board (IASB), 2010 lviii “FIRPTA Reform: Key to Reviving Commercial Real Estate,” Rosen Consulting Group, March 2010 lix “CRE Finance Council Urges Support for U.S. Covered Bond Market,” CRE Finance Council, July 2010 lx “The Carried Interest Tax Increase and its Impact on Real Estate Partnerships,” ICSC Webinar, July 2010 lxi “U.S. Capital Trends, Real Capital Analytics, August 12, 2010 lxii “Distress is a Global Phenomenon With Few Solutions,” Retail Traffic, October 14, 2010 lxiii “Foreign Investors Pledge Allegiance to U.S. Real Estate,” Association of Foreign Investors in Real Estate, January 18, 2010
Copyright © 2010 Deloitte Development LLC. All rights reserved. Member of Deloitte Touche Tohmatsu Limited


