37
CORPORATE STRATEGY PRESENTATION JANUARY 2017

DELPHI ENERGY CORP.
CORPORATE STRATEGY PRESENTATION
JANUARY 2017
FORWARD-LOOKING STATEMENTS AND IMPORTANT NOTES
2
The presentation contains forward-looking statements and forward-looking information within the meaning of applicable Canadian securities laws. These statements relate to future events or the Company’s future performance and are based upon the Company’s internal assumptions and expectations. All statements other than statements of present or historical fact are forward-looking statements. Forward-looking statements are often, but not always, identified by the use of any of the words “expect”, “anticipate”, “continue”, “estimate”, “may”, “will”, “should”, “believe”, "intends”, “forecast”, “plans”, “guidance”, “budget” and similar expressions. More particularly and without limitation, this presentation contains forward-looking statements and information relating to petroleum and natural gas production estimates and weighting, projected crude oil and natural gas prices, future exchange rates, expectations as to royalty rates, expectations as to transportation and operating costs, expectations as to general and administrative costs and interest expense, expectations as to capital expenditures and net debt, planned capital spending, future liquidity and Delphi’s ability to fund ongoing capital requirements through operating cash flows and its credit facilities, supply and demand fundamentals for oil and gas commodities, timing and success of development and exploitation activities, cash availability for the financing of capital expenditures, access to third-party infrastructure, treatment under governmental regulatory regimes and tax laws and future environmental regulations. Furthermore, statements relating to “reserves” are deemed to be forward-looking statements as they involve the implied assessment, based on certain estimates and assumptions that the reserves described can be profitable in the future. The forward-looking statements and information contained in this presentation are based on certain key expectations and assumptions made by Delphi. The following are certain material assumptions on which the forward-looking statements and information contained in this presentation are based: the stability of the global and national economic environment, the stability of and commercial acceptability of tax, royalty and regulatory regimes applicable to Delphi, exploitation and development activities being consistent with management’s expectations, production levels of Delphi being consistent with management’s expectations, the absence of significant project delays, the stability of oil and gas prices, the absence of significant fluctuations in foreign exchange rates and interest rates, the stability of costs of oil and gas development and production in Western Canada, including operating costs, the timing and size of development plans and capital expenditures, availability of third party infrastructure for transportation, processing or marketing of oil and natural gas volumes, prices and availability of oilfield services and equipment being consistent with management’s expectations, the availability of, and competition for, among other things, pipeline capacity, skilled personnel and drilling and related services and equipment, results of development and exploitation activities that are consistent with management’s expectations, weather affecting Delphi’s ability to develop and produce as expected, contracted parties providing goods and services on the agreed timeframes, Delphi’s ability to manage environmental risks and hazards and the cost of complying with environmental regulations, the accuracy of operating cost estimates, the accurate estimation of oil and gas reserves, future exploitation, development and production results and Delphi’s ability to market oil and natural gas successfully to current and new customers. Additionally, estimates as to expected average annual production rates assume that no unexpected outages occur in the infrastructure that the Company relies on to produce its wells, that existing wells continue to meet production expectations and any future wells scheduled to come on in the coming year meet timing and production expectations. Commodity prices used in the determination of forecast revenues are based upon general economic conditions, commodity supply and demand forecasts and publicly available price forecasts. The Company continually monitors its forecast assumptions to ensure the stakeholders are informed of material variances from previously communicated expectations. Financial outlook information contained in this presentation about prospective results of operations, financial position or cash flows is based on assumptions about future events, including economic conditions and proposed courses of action, based on management’s assessment of the relevant information currently available. Readers are cautioned that such financial outlook information contained in this presentation should not be used for purposes other than for which it is disclosed. Although the Company believes that the expectations reflected in such forward-looking statements and information are reasonable, it can give no assurance that such expectations will prove to be correct and such forward-looking statements should not be unduly relied upon. Since forward-looking statements and information address future events and conditions, by their very nature they involve inherent known and unknown risks and uncertainties. Delphi’s actual results, performance or achievements could differ materially from those expressed in, or implied by, these forward-looking statements and, accordingly, no assurance can be given that any of the events anticipated by the forward-looking statements will transpire or occur, or if any of them do so, what benefits Delphi will derive therefrom. Should one or more of these risks or uncertainties materialize, or should assumptions underlying forward-looking statements prove incorrect, actual results may vary materially from those currently anticipated due to a number of factors and risks. These include, but are not limited to, the risks associated with the oil and gas industry in general such as operational risks in development, exploration and production, delays or changes in plans with respect to exploration or development projects or capital expenditures, the uncertainty of estimates and projections relating to production rates, costs and expenses, commodity price and exchange rate fluctuations, marketing and transportation, environmental risks, competition from others for scarce resources, the ability to access sufficient capital from internal and external sources, changes in governmental regulation of the oil and gas industry and changes in tax, royalty and environmental legislation. Additional information on these and other factors that could affect the Company’s operations or financial results are included in the Company’s most recent Annual Information Form and other reports on file with the applicable securities regulatory authorities and may be accessed through the SEDAR website (www.sedar.com). Readers are cautioned that the foregoing list of factors is not exhaustive. Furthermore, the forward-looking statements contained in this presentation are made as of the date of this presentation for the purpose of providing the readers with the Company’s expectations for the coming year. The forward-looking statements and information may not be appropriate for other purposes. Delphi undertakes no obligation to update publicly or revise any forward-looking statements or information, whether as a result of new information, future events or otherwise, unless so required by applicable securities laws. The forward-looking statements contained in this presentation are expressly qualified in their entirety by this cautionary statement.
The following criteria reflects Montney economic modeling assumptions herein the presentation; 1. Strip pricing for 5 years then escalated at 2%/yr thereafter. 2017 prices: Henry Hub $3.18/mmbtu US, $4.20/mmbtu CDN; WTI $55.30/bbl USD; C5 $70.91/bbl CDN. 2018 Prices: Henry Hub $3.00/mmbtu US, $3.94/mmbtu CDN; WTI $56.07/bbl USD; C5 $70.70/bbl CDN. 2. Type Well stabilized field condensate beyond month six is 46 bbl/mmcf sales; Rich Type Well stabilized field condensate production beyond month one is 116 bbl/mmcf. 3. C3: Propane, C4: Butane, C5: Pentane. Gas plant recovered natural gas liquids estimated at 40 bbl/mmcf sales. 4. Type Well reserves and production performance are internal management estimates and were prepared by a qualified reserves evaluator in accordance with the COGE Handbook. Delphi's 18 horizontal toe up Montney wells at East Bigstone with at least 30 stage fracs were time normalized, averaged and used to determine a proved plus probable reserve estimate. 5. Rich Type Well Shale gas reserve assumptions are based on year end 2015 GLJ proved plus probable ultimate recoverable assignment of 3.9 bcf for the 102/15-21-60-23W5 well which is the western most horizontal montney well brought on production at east Bigstone by Delphi as of December 31, 2015. 102/15-21 has a life to date field condensate to gas ratio (CGR) of 90 bbl/mmcf sales since coming on production in February 2014, an initial recoverable proved plus probable reserve CGR assignment of 85 bbl/mmcf sales (total ultimate recoverable P+P reserves of 1.1 mmboe) and a current CGR (November 2016) of 81 bbl/mmcf sales. Reserve estimates include estimated gas plant recovered natural gas liquids of 40 bbl/mmcf sales. 6. Reserve and production estimates are used for illustrative purposes and internal corporate planning and may not reflect the actual performance of future wells. Economics are half cycle and include target capital to drill, complete, equip and tie-in. No costs for land, central facilities, field gathering infrastructure, corporate costs, etc. are included.
January 2017
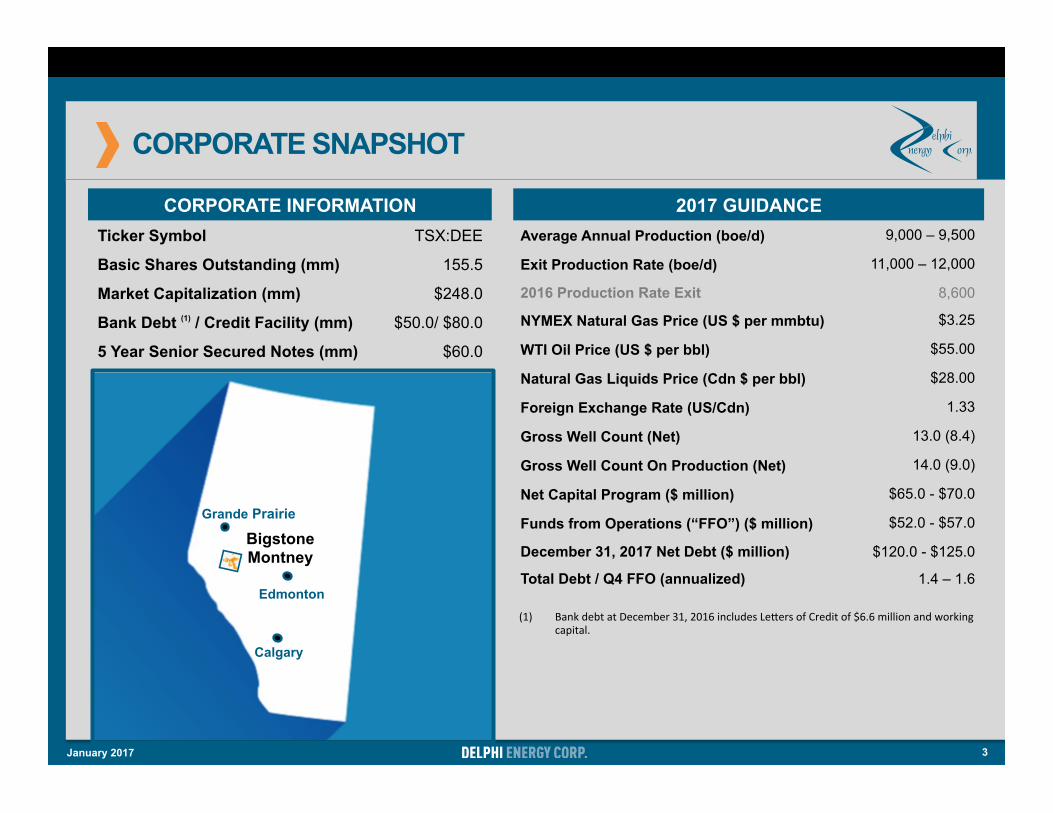
CORPORATE SNAPSHOT
2017 GUIDANCE Average Annual Production (boe/d) 9,000 – 9,500
Exit Production Rate (boe/d) 11,000 – 12,000
2016 Production Rate Exit 8,600
NYMEX Natural Gas Price (US $ per mmbtu) $3.25
WTI Oil Price (US $ per bbl) $55.00
Natural Gas Liquids Price (Cdn $ per bbl) $28.00
Foreign Exchange Rate (US/Cdn) 1.33
Gross Well Count (Net) 13.0 (8.4)
Gross Well Count On Production (Net) 14.0 (9.0)
Net Capital Program ($ million) $65.0 - $70.0
Funds from Operations (“FFO”) ($ million) $52.0 - $57.0
December 31, 2017 Net Debt ($ million) $120.0 - $125.0
Total Debt / Q4 FFO (annualized) 1.4 – 1.6
(1) BankdebtatDecember31,2016includesLe;ersofCreditof$6.6millionandworkingcapital.
Grande Prairie
Bigstone Montney
Edmonton
Calgary
January 2017 3
CORPORATE INFORMATION Ticker Symbol TSX:DEE
Basic Shares Outstanding (mm) 155.5
Market Capitalization (mm) $248.0
Bank Debt (1) / Credit Facility (mm) $50.0/ $80.0
5 Year Senior Secured Notes (mm) $60.0
KEY VALUE HIGHLIGHTS
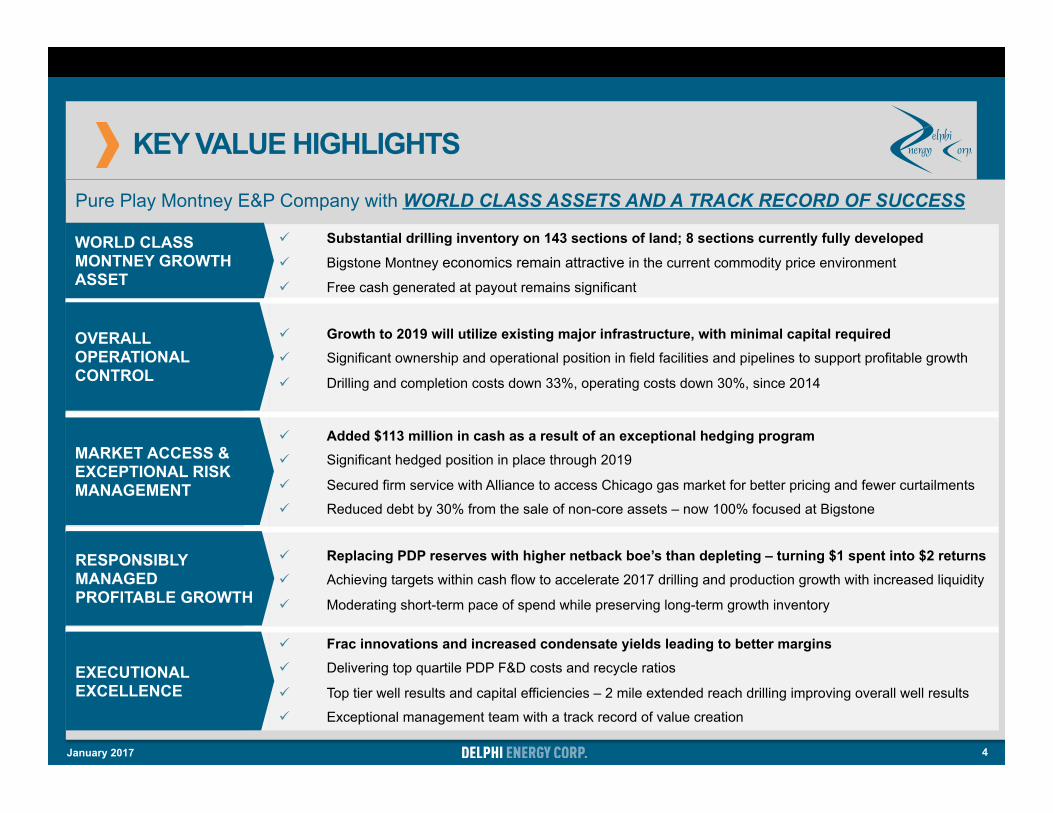
Pure Play Montney E&P Company with WORLD CLASS ASSETS AND A TRACK RECORD OF SUCCESS
ü Substantial drilling inventory on 143 sections of land; 8 sections currently fully developed
ü Bigstone Montney economics remain attractive in the current commodity price environment
ü Free cash generated at payout remains significant
ü Growth to 2019 will utilize existing major infrastructure, with minimal capital required ü Significant ownership and operational position in field facilities and pipelines to support profitable growth
ü Drilling and completion costs down 33%, operating costs down 30%, since 2014
ü Added $113 million in cash as a result of an exceptional hedging program ü Significant hedged position in place through 2019
ü Secured firm service with Alliance to access Chicago gas market for better pricing and fewer curtailments
ü Reduced debt by 30% from the sale of non-core assets – now 100% focused at Bigstone
ü Replacing PDP reserves with higher netback boe’s than depleting – turning $1 spent into $2 returns ü Achieving targets within cash flow to accelerate 2017 drilling and production growth with increased liquidity
ü Moderating short-term pace of spend while preserving long-term growth inventory
ü Frac innovations and increased condensate yields leading to better margins ü Delivering top quartile PDP F&D costs and recycle ratios
ü Top tier well results and capital efficiencies – 2 mile extended reach drilling improving overall well results
ü Exceptional management team with a track record of value creation
WORLD CLASS MONTNEY GROWTH ASSET
OVERALL OPERATIONAL CONTROL
MARKET ACCESS & EXCEPTIONAL RISK MANAGEMENT
RESPONSIBLY MANAGED PROFITABLE GROWTH
EXECUTIONAL EXCELLENCE
4 January 2017
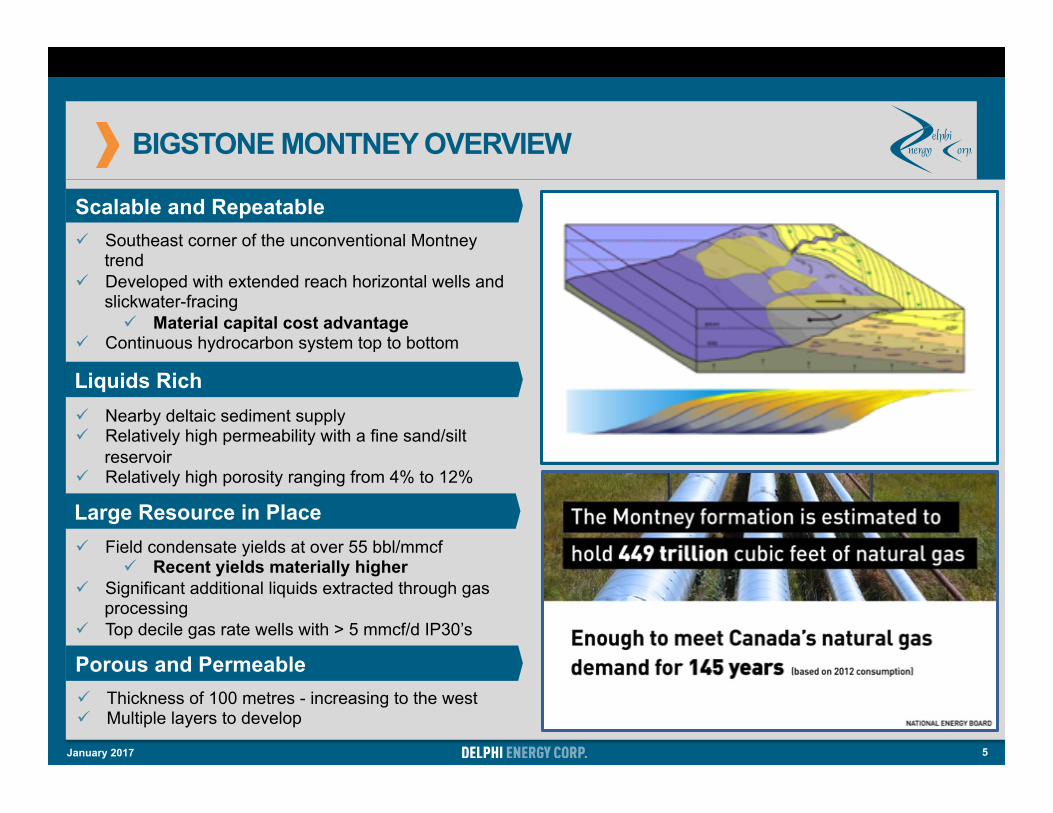
BIGSTONE MONTNEY OVERVIEW
5
Scalable and Repeatable
Liquids Rich
Large Resource in Place
ü Southeast corner of the unconventional Montney trend
ü Developed with extended reach horizontal wells and slickwater-fracing
ü Material capital cost advantage ü Continuous hydrocarbon system top to bottom
ü Nearby deltaic sediment supply ü Relatively high permeability with a fine sand/silt
reservoir ü Relatively high porosity ranging from 4% to 12%
ü Field condensate yields at over 55 bbl/mmcf ü Recent yields materially higher
ü Significant additional liquids extracted through gas processing
ü Top decile gas rate wells with > 5 mmcf/d IP30’s
ü Thickness of 100 metres - increasing to the west ü Multiple layers to develop
Porous and Permeable
January 2017
$50 MILLION PARTNER TRANSACTION OVERVIEW
6
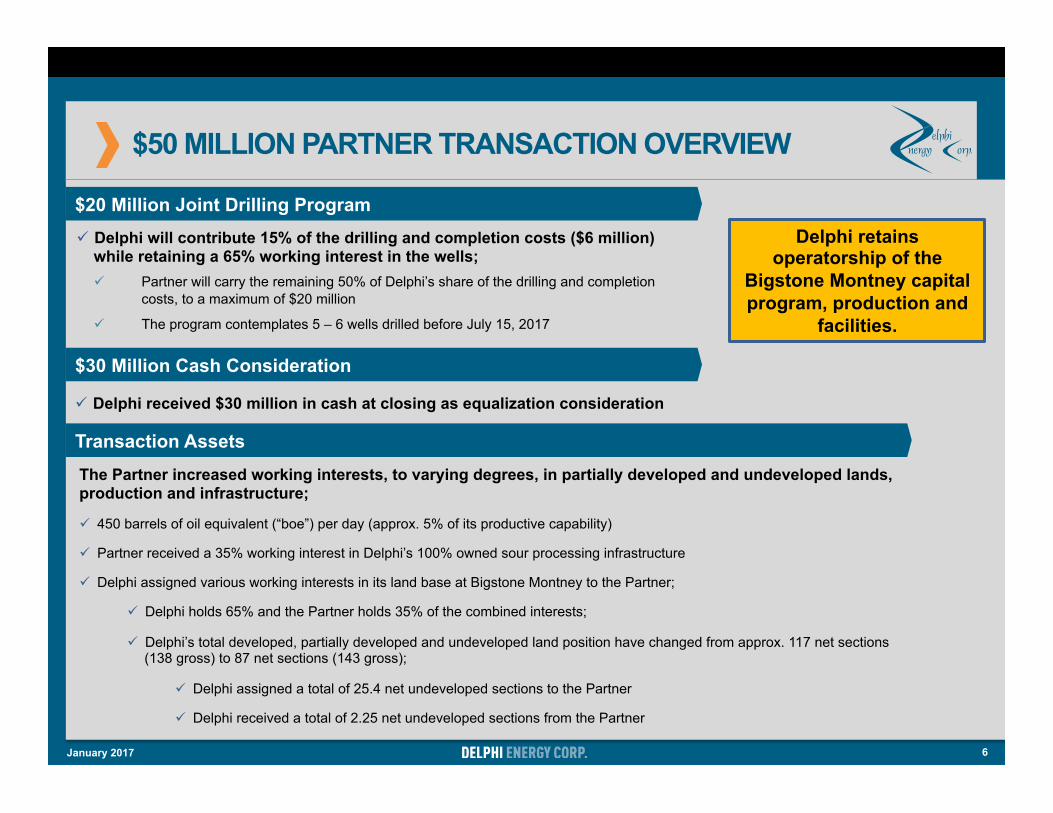
$20 Million Joint Drilling Program Delphi retains
operatorship of the Bigstone Montney capital program, production and
facilities.
$30 Million Cash Consideration
ü Delphi will contribute 15% of the drilling and completion costs ($6 million) while retaining a 65% working interest in the wells; ü Partner will carry the remaining 50% of Delphi’s share of the drilling and completion
costs, to a maximum of $20 million
ü The program contemplates 5 – 6 wells drilled before July 15, 2017
ü Delphi received $30 million in cash at closing as equalization consideration
Transaction Assets The Partner increased working interests, to varying degrees, in partially developed and undeveloped lands, production and infrastructure; ü 450 barrels of oil equivalent (“boe”) per day (approx. 5% of its productive capability) ü Partner received a 35% working interest in Delphi’s 100% owned sour processing infrastructure ü Delphi assigned various working interests in its land base at Bigstone Montney to the Partner;
ü Delphi holds 65% and the Partner holds 35% of the combined interests;
ü Delphi’s total developed, partially developed and undeveloped land position have changed from approx. 117 net sections (138 gross) to 87 net sections (143 gross);
ü Delphi assigned a total of 25.4 net undeveloped sections to the Partner
ü Delphi received a total of 2.25 net undeveloped sections from the Partner
January 2017
7
0
50
100
150
200
2008 2009 2010 2011 2012 2013 2014 2015
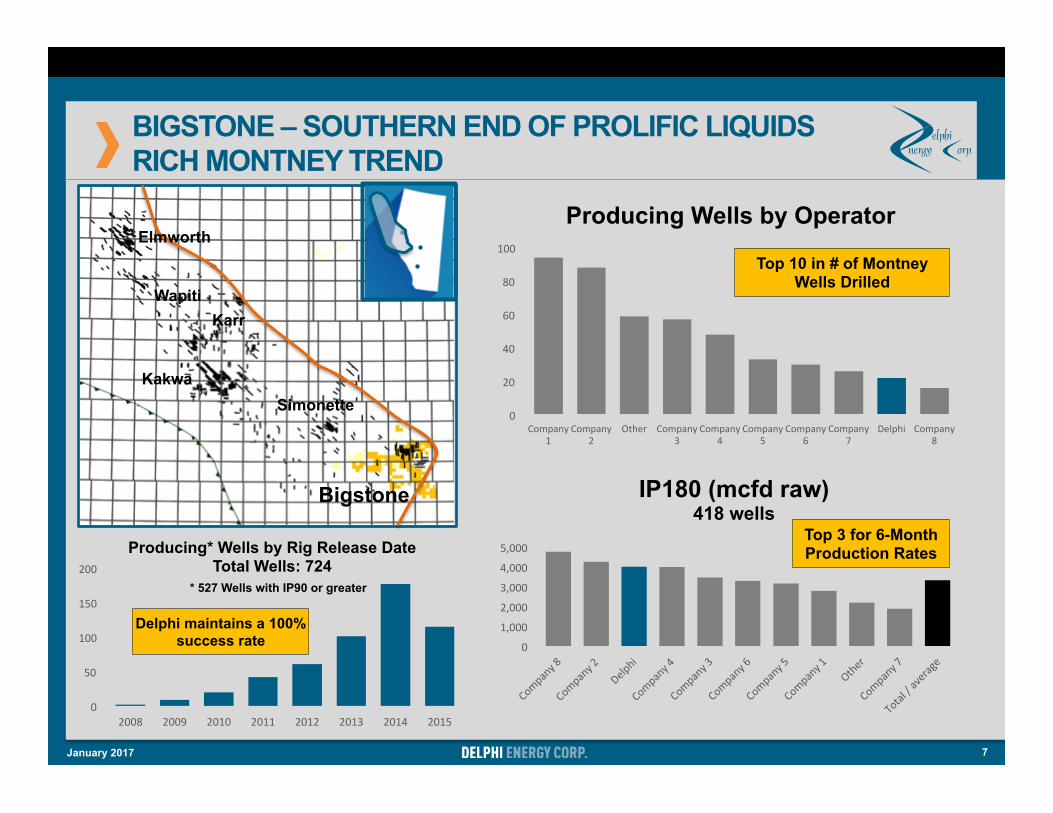
Producing* Wells by Rig Release Date Total Wells: 724
Delphi maintains a 100% success rate
0
20
40
60
80
100
Company1
Company2
Other Company3
Company4
Company5
Company6
Company7
Delphi Company8
Producing Wells by Operator
0
1,000
2,000
3,000
4,000
5,000
IP180 (mcfd raw) 418 wells
Bigstone
Karr Wapiti
Kakwa Simonette
BIGSTONE – SOUTHERN END OF PROLIFIC LIQUIDS RICH MONTNEY TREND
Top 3 for 6-Month Production Rates
Top 10 in # of Montney Wells Drilled
* 527 Wells with IP90 or greater
Elmworth
January 2017
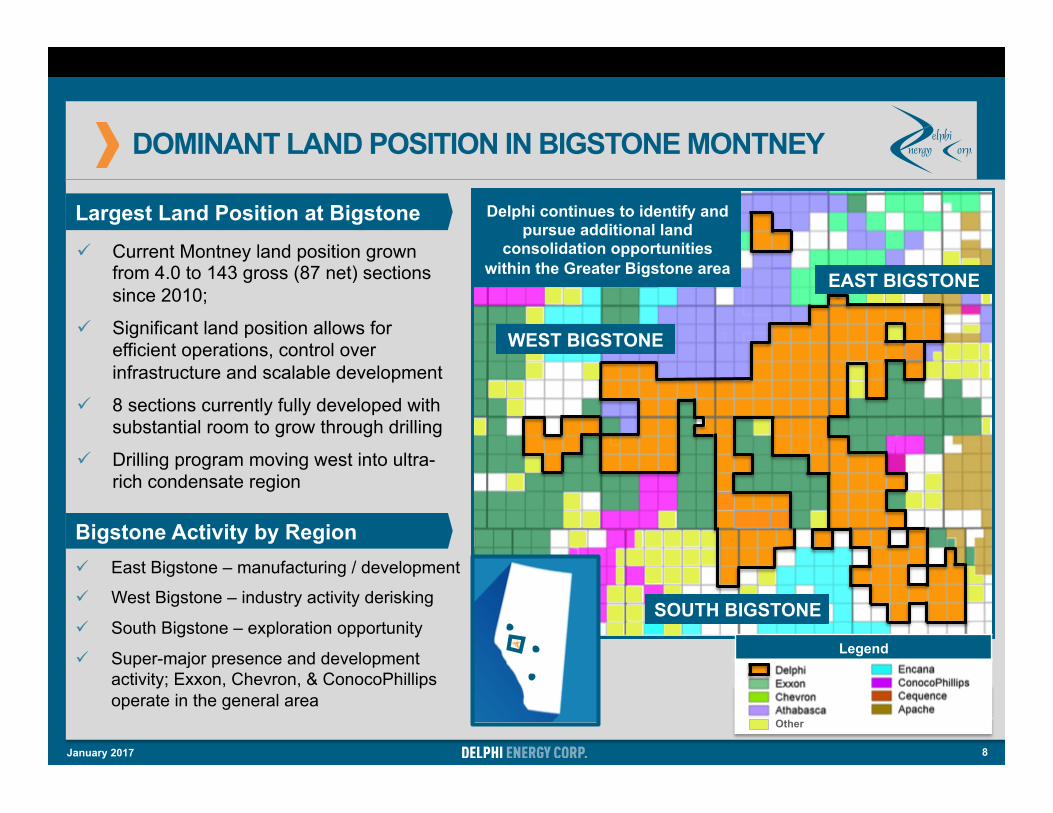
DOMINANT LAND POSITION IN BIGSTONE MONTNEY
Legend
Delphi continues to identify and pursue additional land
consolidation opportunities within the Greater Bigstone area
Largest Land Position at Bigstone
Bigstone Activity by Region ü East Bigstone – manufacturing / development
ü West Bigstone – industry activity derisking
ü South Bigstone – exploration opportunity
ü Super-major presence and development activity; Exxon, Chevron, & ConocoPhillips operate in the general area
ü Current Montney land position grown from 4.0 to 143 gross (87 net) sections since 2010;
ü Significant land position allows for efficient operations, control over infrastructure and scalable development
ü 8 sections currently fully developed with substantial room to grow through drilling
ü Drilling program moving west into ultra-rich condensate region
8
WEST BIGSTONE
SOUTH BIGSTONE
Other
EAST BIGSTONE
January 2017
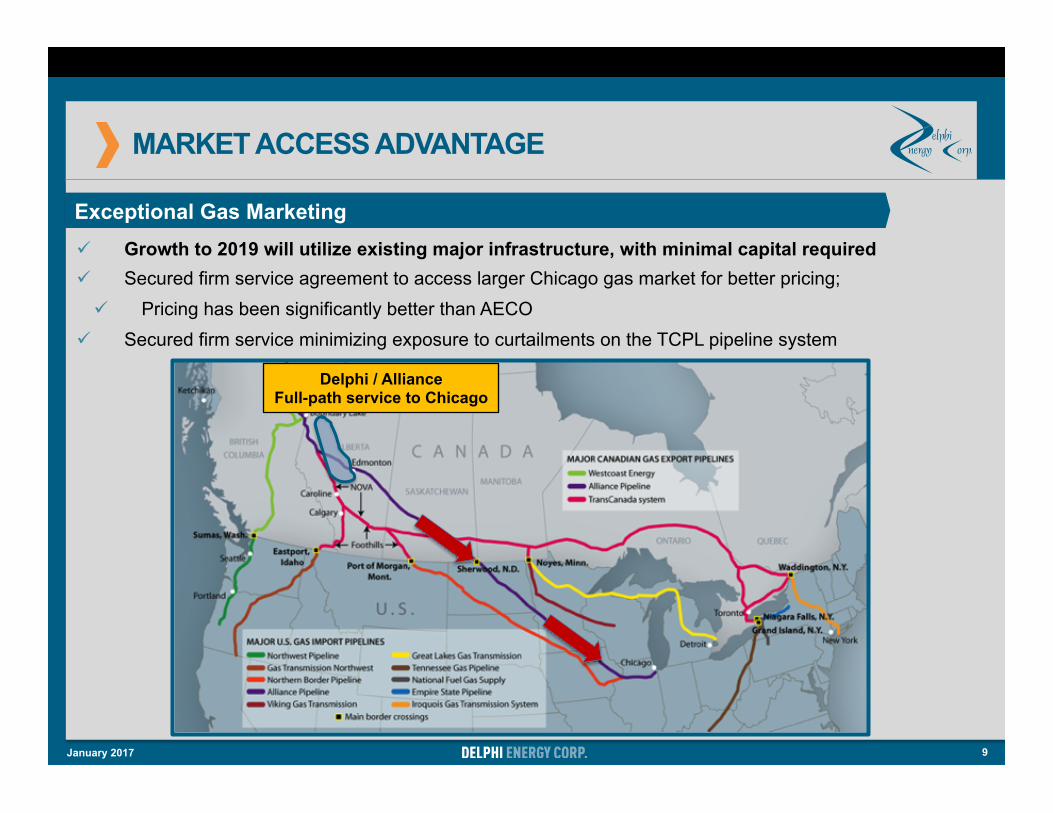
MARKET ACCESS ADVANTAGE
9
Exceptional Gas Marketing ü Growth to 2019 will utilize existing major infrastructure, with minimal capital required ü Secured firm service agreement to access larger Chicago gas market for better pricing; ü Pricing has been significantly better than AECO
ü Secured firm service minimizing exposure to curtailments on the TCPL pipeline system
Delphi / Alliance Full-path service to Chicago
January 2017
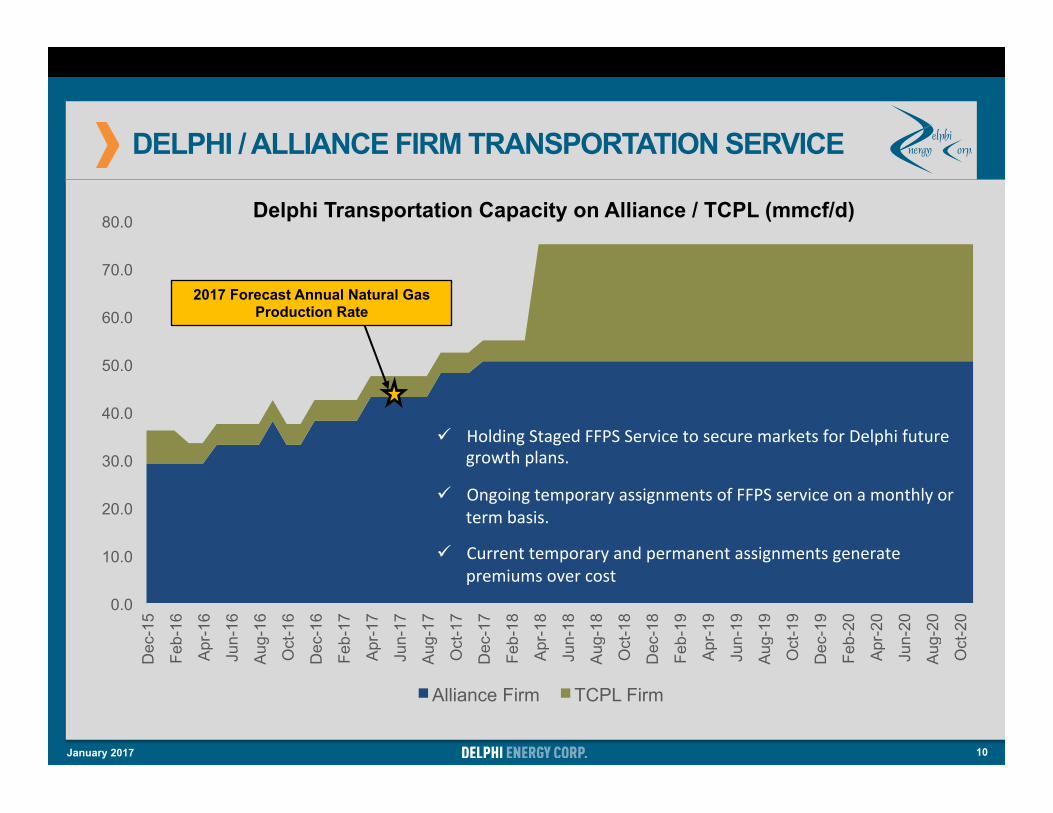
DELPHI / ALLIANCE FIRM TRANSPORTATION SERVICE
10 January 2017
0.0
10.0
20.0
30.0
40.0
50.0
60.0
70.0
80.0
Dec
-15
Feb-
16
Apr
-16
Jun-
16
Aug
-16
Oct
-16
Dec
-16
Feb-
17
Apr
-17
Jun-
17
Aug
-17
Oct
-17
Dec
-17
Feb-
18
Apr
-18
Jun-
18
Aug
-18
Oct
-18
Dec
-18
Feb-
19
Apr
-19
Jun-
19
Aug
-19
Oct
-19
Dec
-19
Feb-
20
Apr
-20
Jun-
20
Aug
-20
Oct
-20
Delphi Transportation Capacity on Alliance / TCPL (mmcf/d)
Alliance Firm TCPL Firm
2017 Forecast Annual Natural Gas Production Rate
ü HoldingStagedFFPSServicetosecuremarketsforDelphifuturegrowthplans.
ü OngoingtemporaryassignmentsofFFPSserviceonamonthlyortermbasis.
ü Currenttemporaryandpermanentassignmentsgeneratepremiumsovercost
CONSISTENT AND PROVEN RISK MANAGEMENT PROGRAM
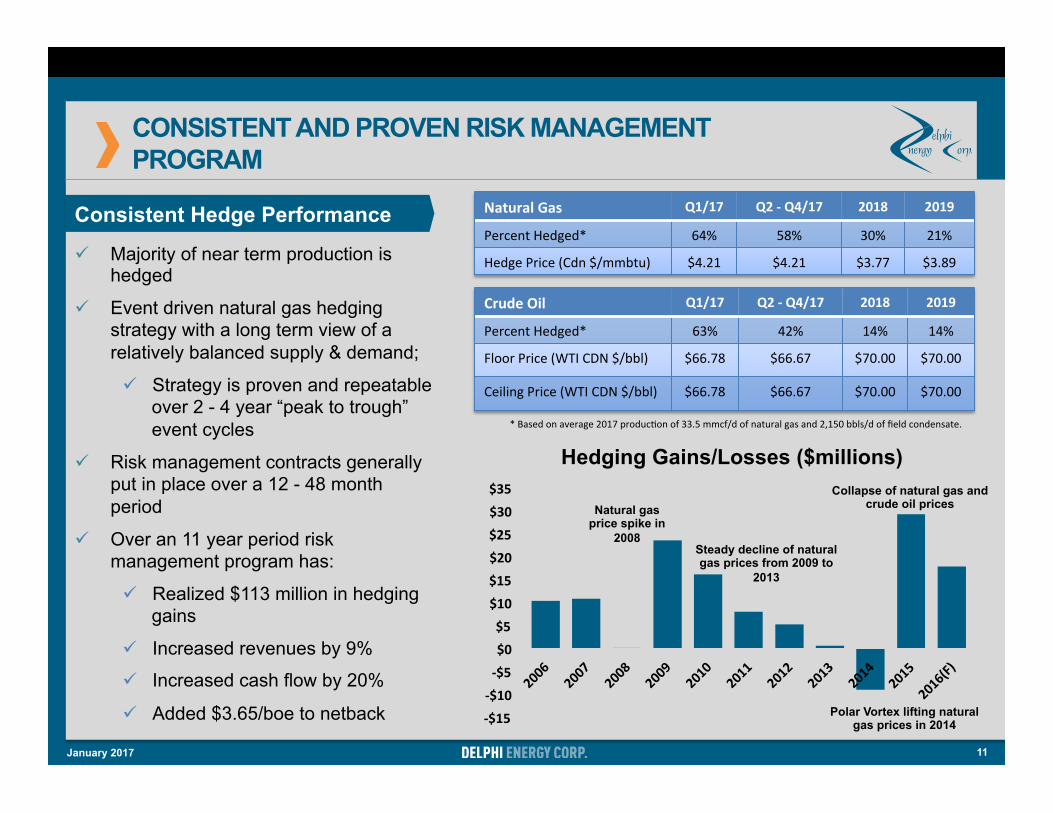
ü Majority of near term production is hedged
ü Event driven natural gas hedging strategy with a long term view of a relatively balanced supply & demand;
ü Strategy is proven and repeatable over 2 - 4 year “peak to trough” event cycles
ü Risk management contracts generally put in place over a 12 - 48 month period
ü Over an 11 year period risk management program has:
ü Realized $113 million in hedging gains
ü Increased revenues by 9%
ü Increased cash flow by 20%
ü Added $3.65/boe to netback -$15-$10-$5$0$5$10$15$20$25$30$35
Hedging Gains/Losses ($millions)
Polar Vortex lifting natural gas prices in 2014
Natural gas price spike in
2008 Steady decline of natural gas prices from 2009 to
2013
Collapse of natural gas and crude oil prices
Consistent Hedge Performance NaturalGas Q1/17 Q2-Q4/17 2018 2019
PercentHedged* 64% 58% 30% 21%
HedgePrice(Cdn$/mmbtu) $4.21 $4.21 $3.77 $3.89
CrudeOil Q1/17 Q2-Q4/17 2018 2019
PercentHedged* 63% 42% 14% 14%
FloorPrice(WTICDN$/bbl) $66.78 $66.67 $70.00 $70.00
CeilingPrice(WTICDN$/bbl) $66.78 $66.67 $70.00 $70.00
11
*Basedonaverage2017producXonof33.5mmcf/dofnaturalgasand2,150bbls/doffieldcondensate.
January 2017
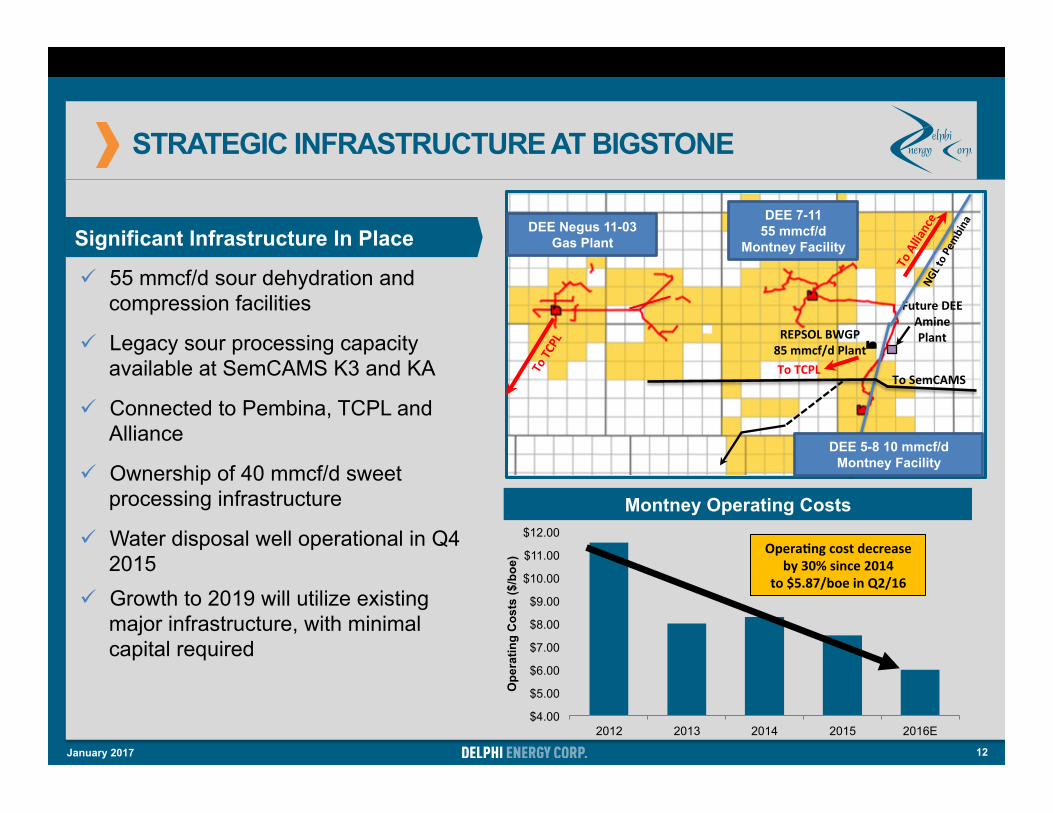
STRATEGIC INFRASTRUCTURE AT BIGSTONE
Significant Infrastructure In Place
ü 55 mmcf/d sour dehydration and compression facilities
ü Legacy sour processing capacity available at SemCAMS K3 and KA
ü Connected to Pembina, TCPL and Alliance
ü Ownership of 40 mmcf/d sweet processing infrastructure
ü Water disposal well operational in Q4 2015
ü Growth to 2019 will utilize existing major infrastructure, with minimal capital required
$4.00
$5.00
$6.00
$7.00
$8.00
$9.00
$10.00
$11.00
$12.00
2012 2013 2014 2015 2016E
Ope
ratin
g C
osts
($/b
oe)
Montney Operating Costs
Opera=ngcostdecreaseby30%since2014
to$5.87/boeinQ2/16
12
DEE 7-11 55 mmcf/d
Montney Facility
ToSemCAMSToTCPL
FutureDEEAminePlantREPSOLBWGP
85mmcf/dPlant
DEE Negus 11-03 Gas Plant
DEE 5-8 10 mmcf/d Montney Facility
January 2017
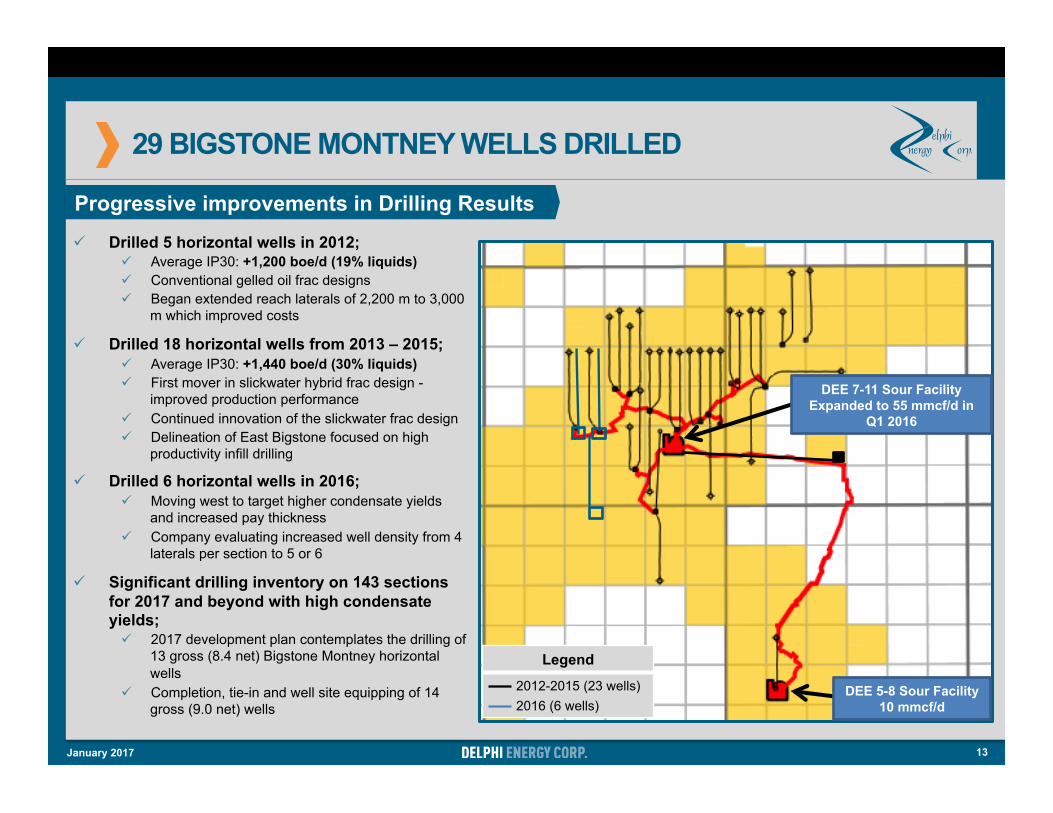
29 BIGSTONE MONTNEY WELLS DRILLED
13
ü Drilled 5 horizontal wells in 2012; ü Average IP30: +1,200 boe/d (19% liquids) ü Conventional gelled oil frac designs ü Began extended reach laterals of 2,200 m to 3,000
m which improved costs
ü Drilled 18 horizontal wells from 2013 – 2015; ü Average IP30: +1,440 boe/d (30% liquids) ü First mover in slickwater hybrid frac design -
improved production performance ü Continued innovation of the slickwater frac design ü Delineation of East Bigstone focused on high
productivity infill drilling
ü Drilled 6 horizontal wells in 2016; ü Moving west to target higher condensate yields
and increased pay thickness ü Company evaluating increased well density from 4
laterals per section to 5 or 6
ü Significant drilling inventory on 143 sections for 2017 and beyond with high condensate yields; ü 2017 development plan contemplates the drilling of
13 gross (8.4 net) Bigstone Montney horizontal wells
ü Completion, tie-in and well site equipping of 14 gross (9.0 net) wells
Progressive improvements in Drilling Results
Legend 2012-2015 (23 wells) 2016 (6 wells)
DEE 7-11 Sour Facility Expanded to 55 mmcf/d in
Q1 2016
DEE 5-8 Sour Facility 10 mmcf/d
January 2017
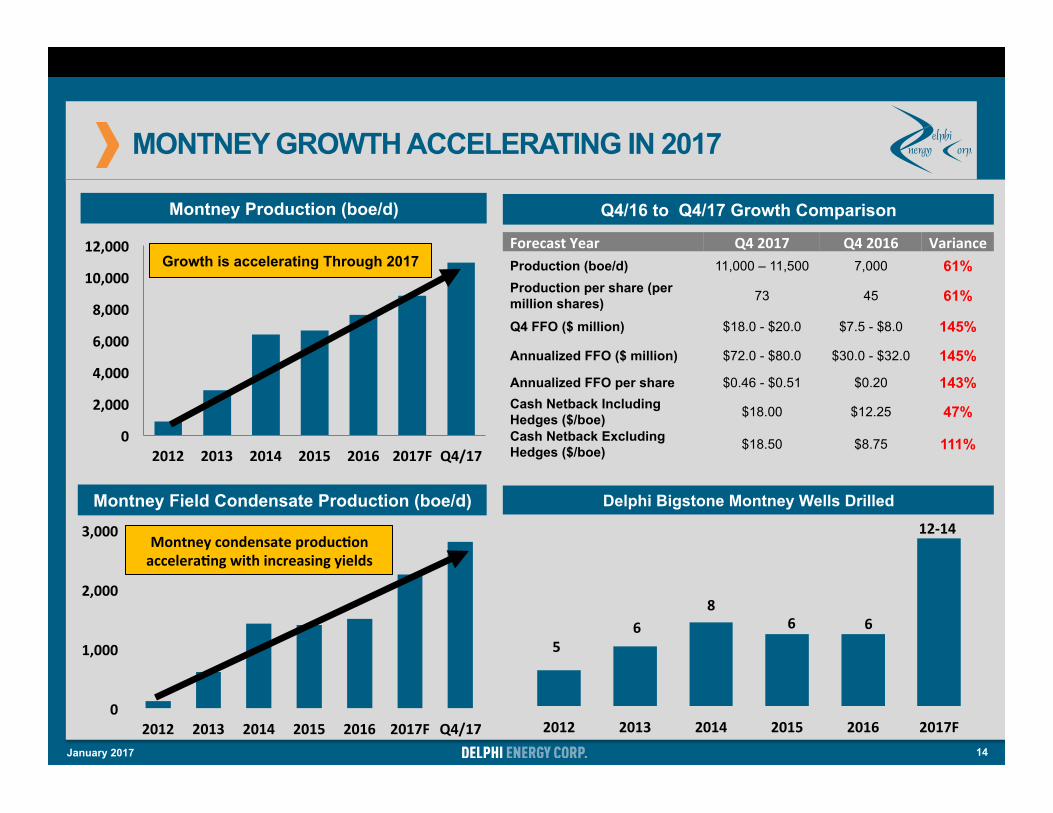
2012 2013 2014 2015 2016 2017F
68
65
6
Delphi Bigstone Montney Wells Drilled 12-14
MONTNEY GROWTH ACCELERATING IN 2017
Montney Production (boe/d)
0
2,000
4,000
6,000
8,000
10,000
12,000
2012 2013 2014 2015 2016 2017F Q4/17
Growth is accelerating Through 2017
0
1,000
2,000
3,000
2012 2013 2014 2015 2016 2017F Q4/17
Montneycondensateproduc=onaccelera=ngwithincreasingyields
Montney Field Condensate Production (boe/d)
14 January 2017
Q4/16 to Q4/17 Growth Comparison
ForecastYear Q42017 Q42016 VarianceProduction (boe/d) 11,000 – 11,500 7,000 61% Production per share (per million shares) 73 45 61%
Q4 FFO ($ million) $18.0 - $20.0 $7.5 - $8.0 145%
Annualized FFO ($ million) $72.0 - $80.0 $30.0 - $32.0 145%
Annualized FFO per share $0.46 - $0.51 $0.20 143% Cash Netback Including Hedges ($/boe) $18.00 $12.25 47% Cash Netback Excluding Hedges ($/boe) $18.50 $8.75 111%
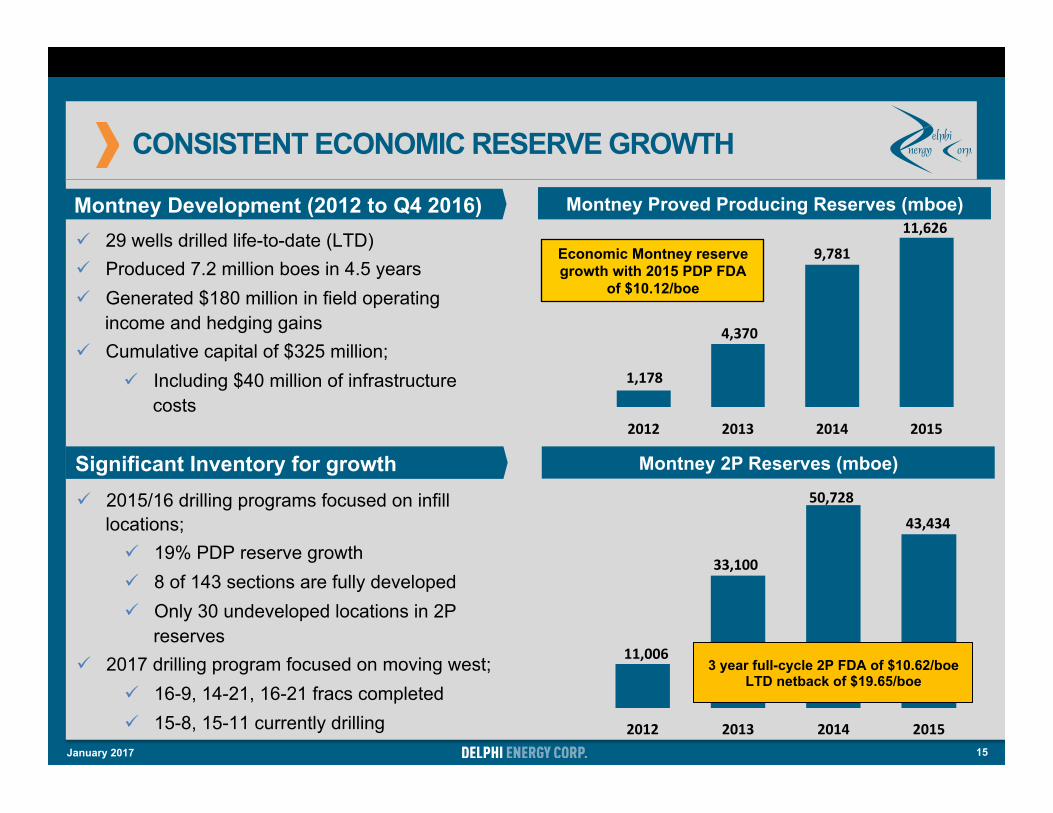
CONSISTENT ECONOMIC RESERVE GROWTH
15
2012 2013 2014 2015
43,434
50,728
33,100
11,0063 year full-cycle 2P FDA of $10.62/boe
LTD netback of $19.65/boe
2012 2013 2014 2015
11,626
9,781
4,370
1,178
Economic Montney reserve growth with 2015 PDP FDA
of $10.12/boe
Montney Proved Producing Reserves (mboe)
Montney 2P Reserves (mboe)
ü 29 wells drilled life-to-date (LTD) ü Produced 7.2 million boes in 4.5 years ü Generated $180 million in field operating
income and hedging gains ü Cumulative capital of $325 million;
ü Including $40 million of infrastructure costs
Significant Inventory for growth
Montney Development (2012 to Q4 2016)
ü 2015/16 drilling programs focused on infill locations; ü 19% PDP reserve growth ü 8 of 143 sections are fully developed ü Only 30 undeveloped locations in 2P
reserves ü 2017 drilling program focused on moving west;
ü 16-9, 14-21, 16-21 fracs completed ü 15-8, 15-11 currently drilling
January 2017
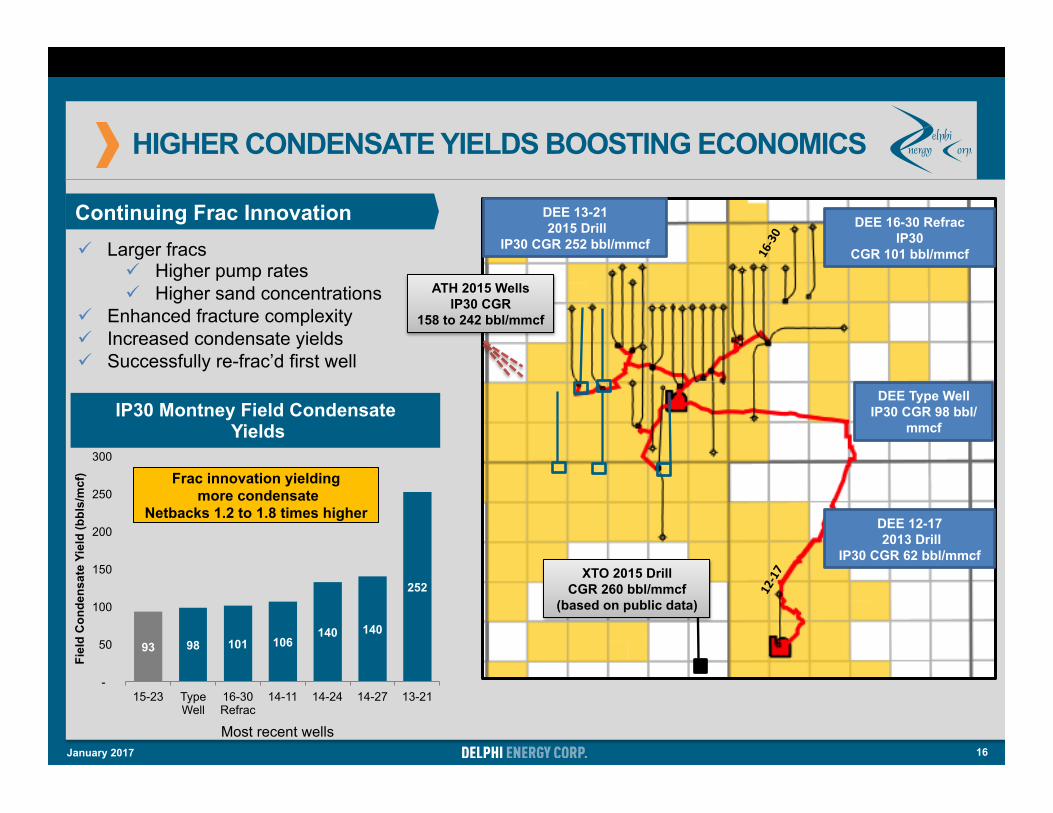
HIGHER CONDENSATE YIELDS BOOSTING ECONOMICS
ü Larger fracs ü Higher pump rates ü Higher sand concentrations
ü Enhanced fracture complexity ü Increased condensate yields ü Successfully re-frac’d first well
Continuing Frac Innovation
16
93 98 101 106 140 140
252
-
50
100
150
200
250
300
15-23 Type Well
16-30 Refrac
14-11 14-24 14-27 13-21
Fiel
d C
onde
nsat
e Yi
eld
(bbl
s/m
cf)
IP30 Montney Field Condensate Yields
Frac innovation yielding more condensate
Netbacks 1.2 to 1.8 times higher DEE 12-17 2013 Drill
IP30 CGR 62 bbl/mmcf XTO 2015 Drill
CGR 260 bbl/mmcf (based on public data)
DEE Type Well IP30 CGR 98 bbl/
mmcf
DEE 13-21 2015 Drill
IP30 CGR 252 bbl/mmcf
ATH 2015 Wells IP30 CGR
158 to 242 bbl/mmcf
DEE 16-30 Refrac IP30
CGR 101 bbl/mmcf
Most recent wells January 2017
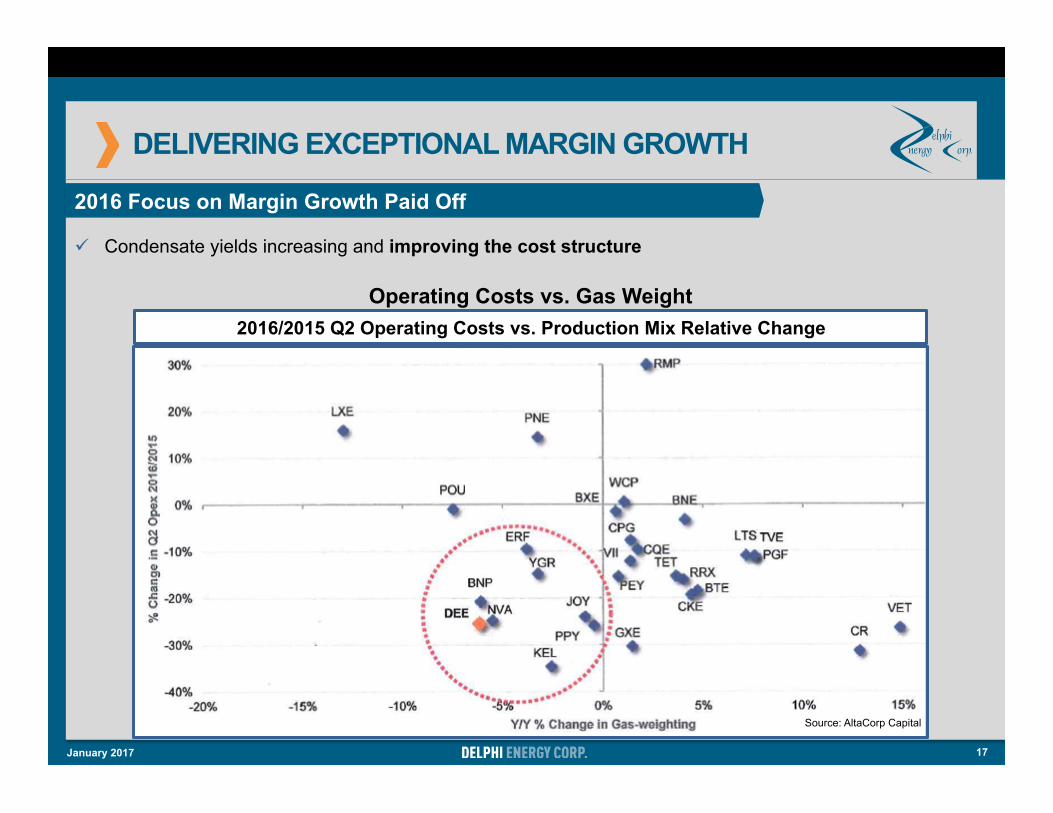
DELIVERING EXCEPTIONAL MARGIN GROWTH
17
ü Condensate yields increasing and improving the cost structure
Source: AltaCorp Capital
2016 Focus on Margin Growth Paid Off
Operating Costs vs. Gas Weight 2016/2015 Q2 Operating Costs vs. Production Mix Relative Change
January 2017
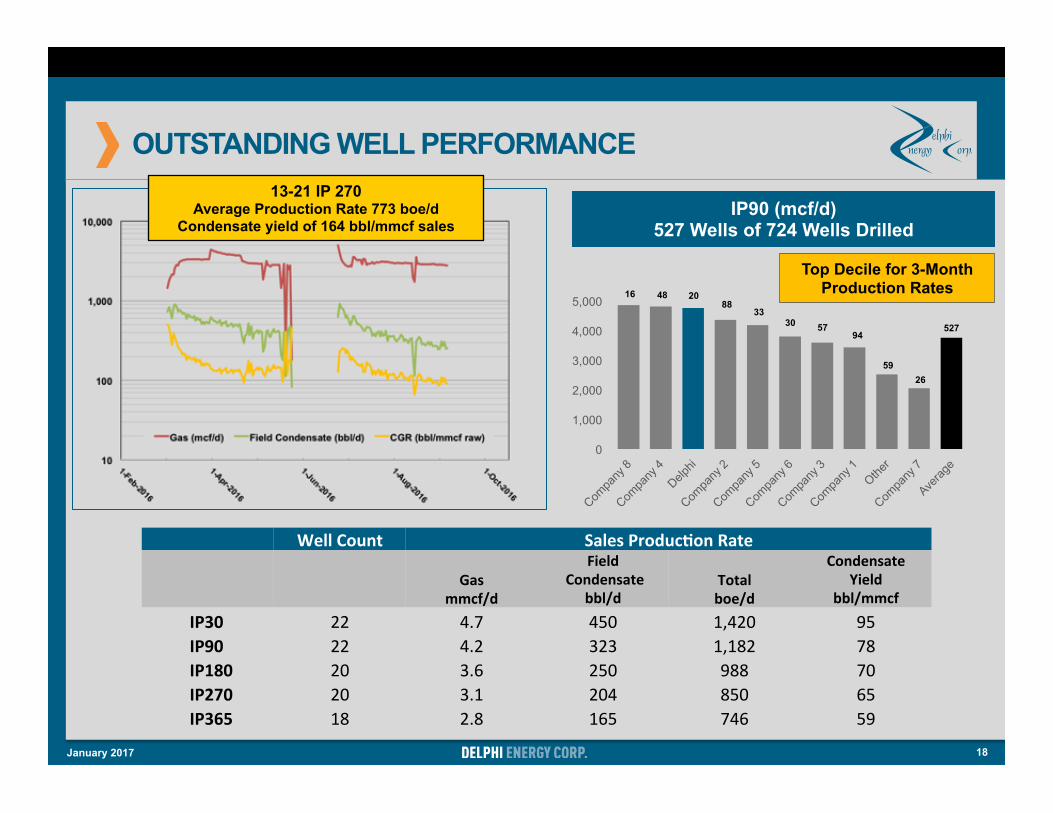
OUTSTANDING WELL PERFORMANCE
18
WellCount SalesProduc=onRate
Gasmmcf/d
FieldCondensate
bbl/d Totalboe/d
CondensateYield
bbl/mmcf IP30 22 4.7 450 1,420 95IP90 22 4.2 323 1,182 78IP180 20 3.6 250 988 70IP270 20 3.1 204 850 65IP365 18 2.8 165 746 59
13-21 IP 270 Average Production Rate 773 boe/d
Condensate yield of 164 bbl/mmcf sales
0
1,000
2,000
3,000
4,000
5,000 88 48 16
33
20
94
59 26
527 30 57
Top Decile for 3-Month Production Rates
IP90 (mcf/d) 527 Wells of 724 Wells Drilled
January 2017
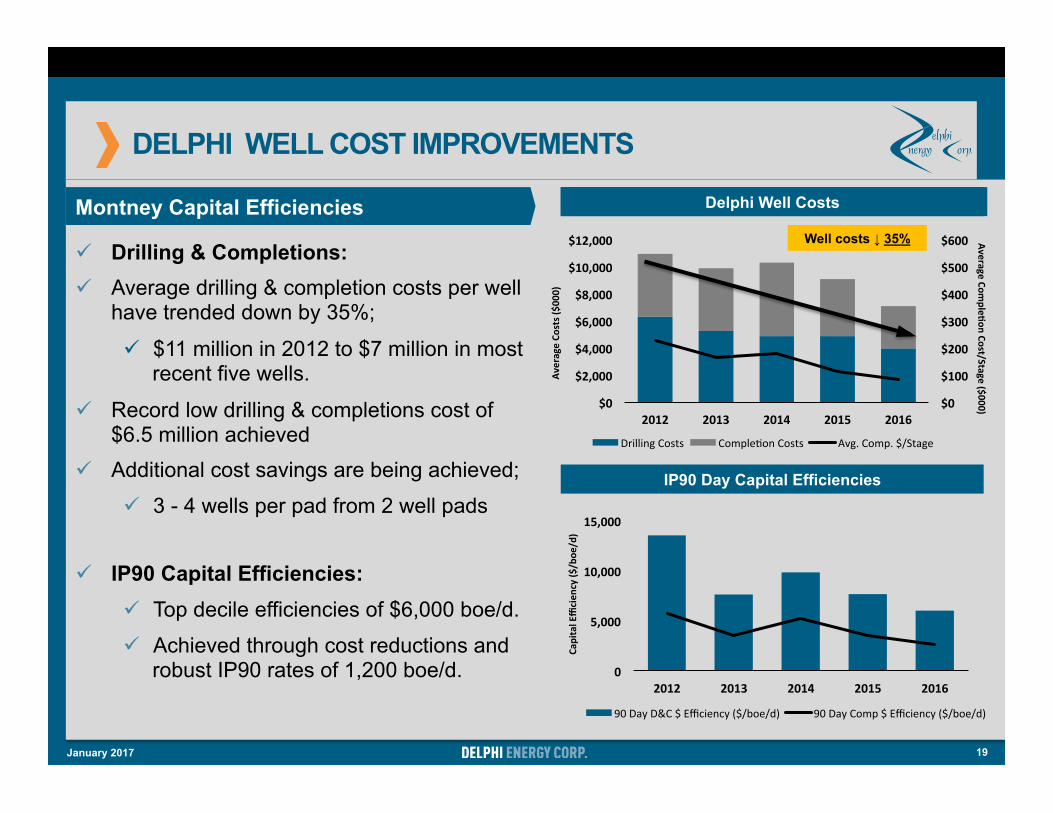
DELPHI WELL COST IMPROVEMENTS
19
Delphi Well Costs Delphi Well Costs
IP90 Day Capital Efficiencies
Montney Capital Efficiencies
0
5,000
10,000
15,000
2012 2013 2014 2015 2016
90DayD&C$Efficiency($/boe/d) 90DayComp$Efficiency($/boe/d)
CapitalEfficien
cy($
/boe
/d)
$0
$100
$200
$300
$400
$500
$600
$0
$2,000
$4,000
$6,000
$8,000
$10,000
$12,000
2012 2013 2014 2015 2016
DrillingCosts CompleXonCosts Avg.Comp.$/Stage
AverageCo
sts($000)
AverageComple=onCost/Stage($000)
Well costs ↓ 35% ü Drilling & Completions: ü Average drilling & completion costs per well
have trended down by 35%;
ü $11 million in 2012 to $7 million in most recent five wells.
ü Record low drilling & completions cost of $6.5 million achieved
ü Additional cost savings are being achieved;
ü 3 - 4 wells per pad from 2 well pads
ü IP90 Capital Efficiencies: ü Top decile efficiencies of $6,000 boe/d.
ü Achieved through cost reductions and robust IP90 rates of 1,200 boe/d.
January 2017
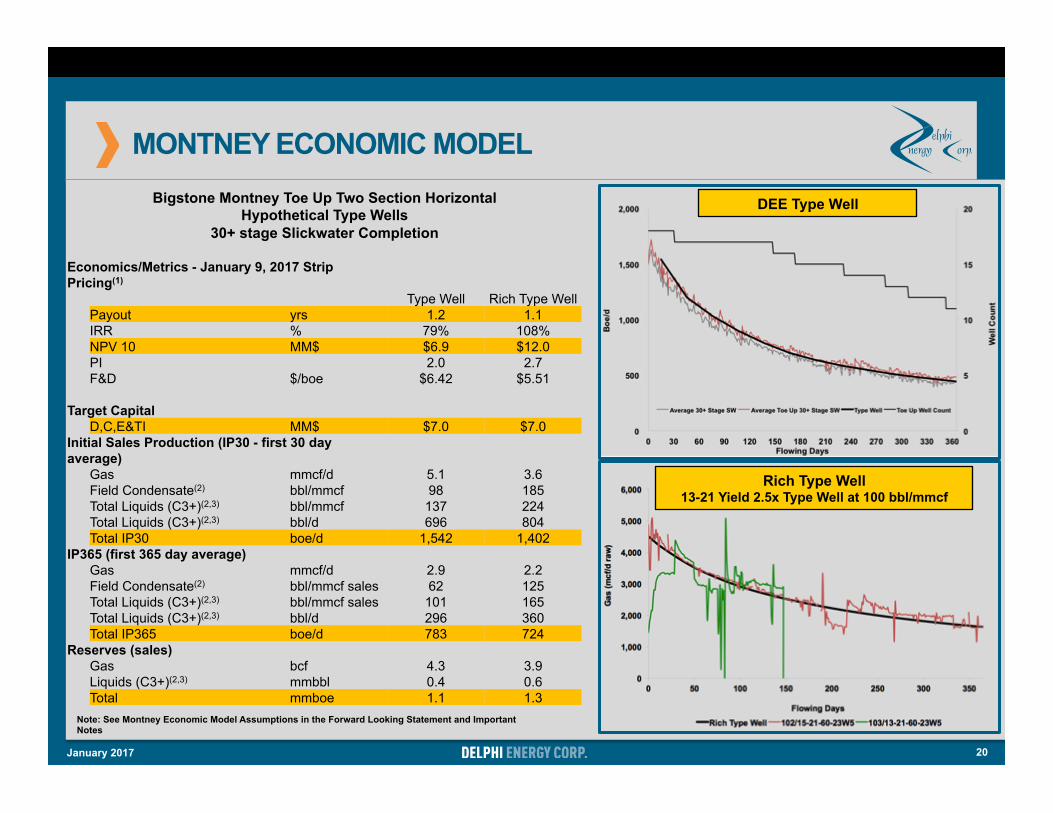
MONTNEY ECONOMIC MODEL
20
Rich Type Well 13-21 Yield 2.5x Type Well at 100 bbl/mmcf
Note: See Montney Economic Model Assumptions in the Forward Looking Statement and Important Notes
DEE Type Well
January 2017
Bigstone Montney Toe Up Two Section Horizontal Hypothetical Type Wells
30+ stage Slickwater Completion
Economics/Metrics - January 9, 2017 Strip Pricing(1)
Type Well Rich Type Well Payout yrs 1.2 1.1 IRR % 79% 108% NPV 10 MM$ $6.9 $12.0 PI 2.0 2.7 F&D $/boe $6.42 $5.51
Target Capital D,C,E&TI MM$ $7.0 $7.0
Initial Sales Production (IP30 - first 30 day average)
Gas mmcf/d 5.1 3.6 Field Condensate(2) bbl/mmcf 98 185 Total Liquids (C3+)(2,3) bbl/mmcf 137 224 Total Liquids (C3+)(2,3) bbl/d 696 804 Total IP30 boe/d 1,542 1,402
IP365 (first 365 day average) Gas mmcf/d 2.9 2.2 Field Condensate(2) bbl/mmcf sales 62 125 Total Liquids (C3+)(2,3) bbl/mmcf sales 101 165 Total Liquids (C3+)(2,3) bbl/d 296 360 Total IP365 boe/d 783 724
Reserves (sales) Gas bcf 4.3 3.9 Liquids (C3+)(2,3) mmbbl 0.4 0.6 Total mmboe 1.1 1.3
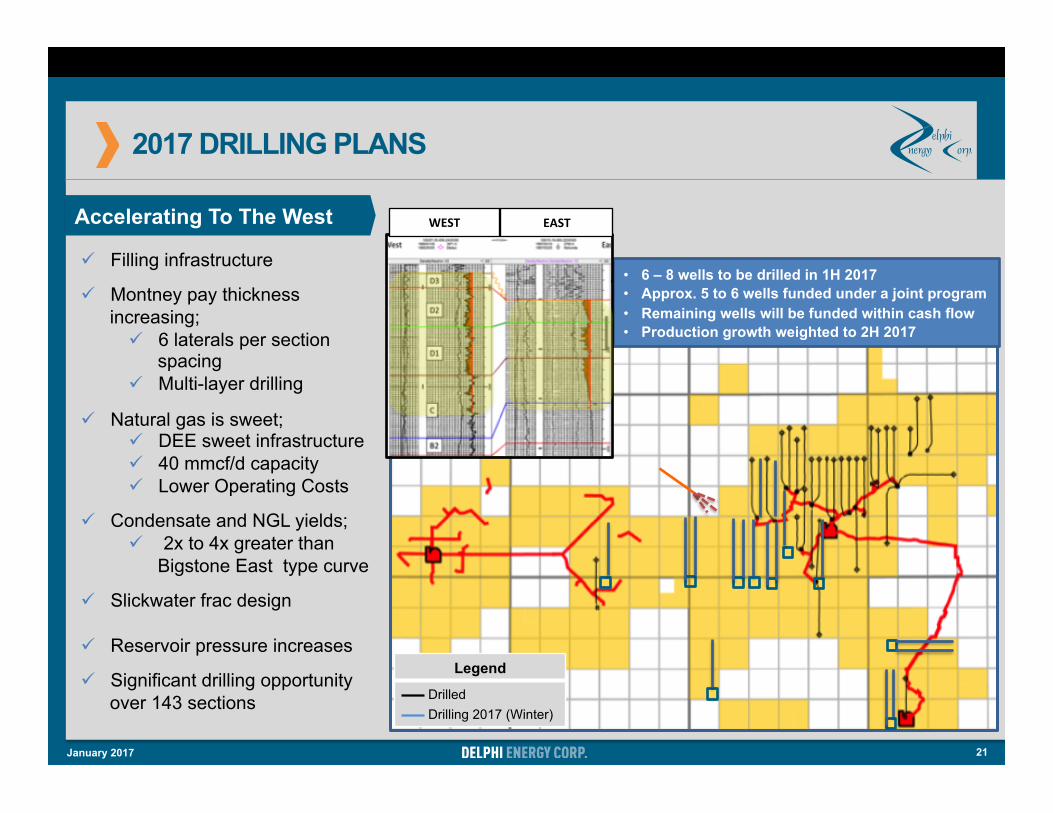
2017 DRILLING PLANS
ü Filling infrastructure
ü Montney pay thickness increasing; ü 6 laterals per section
spacing ü Multi-layer drilling
ü Natural gas is sweet; ü DEE sweet infrastructure ü 40 mmcf/d capacity ü Lower Operating Costs
ü Condensate and NGL yields; ü 2x to 4x greater than
Bigstone East type curve
ü Slickwater frac design ü Reservoir pressure increases
ü Significant drilling opportunity over 143 sections
Accelerating To The West
Legend Drilled Drilling 2017 (Winter)
21 January 2017
• 6 – 8 wells to be drilled in 1H 2017 • Approx. 5 to 6 wells funded under a joint program • Remaining wells will be funded within cash flow • Production growth weighted to 2H 2017
WEST EAST
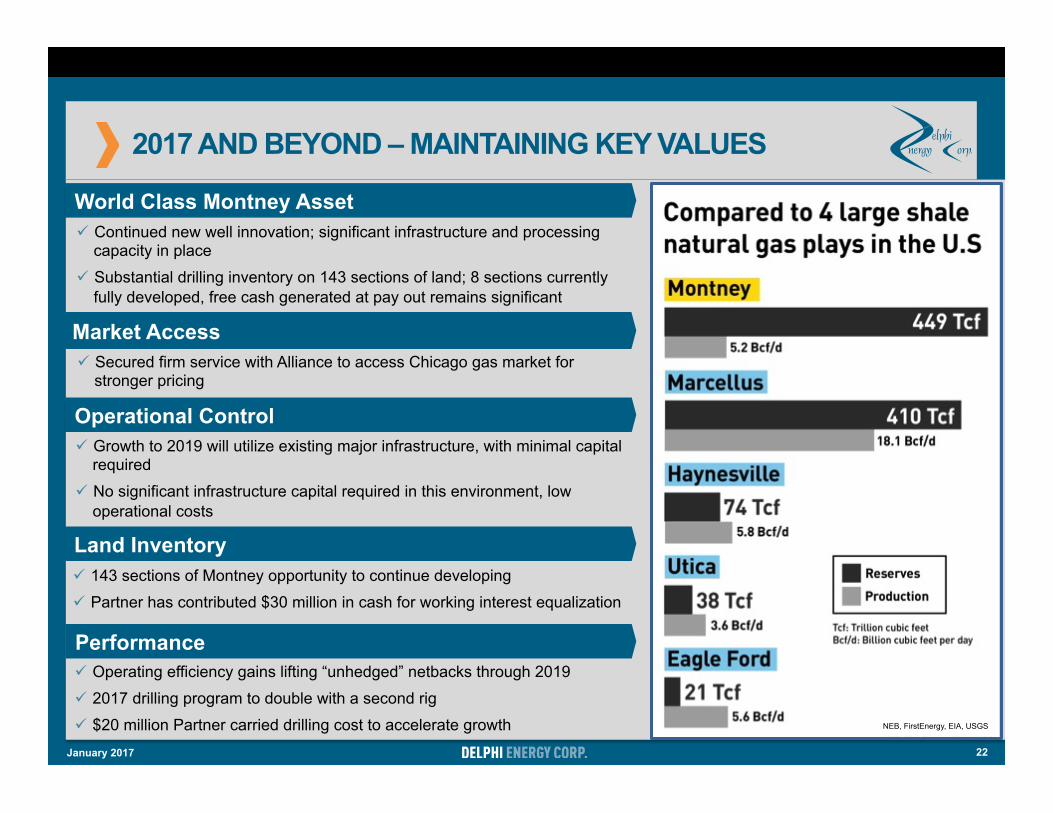
2017 AND BEYOND – MAINTAINING KEY VALUES
22
ü Continued new well innovation; significant infrastructure and processing capacity in place
ü Substantial drilling inventory on 143 sections of land; 8 sections currently fully developed, free cash generated at pay out remains significant
World Class Montney Asset
Operational Control
Land Inventory
Market Access
Performance
ü Growth to 2019 will utilize existing major infrastructure, with minimal capital required
ü No significant infrastructure capital required in this environment, low operational costs
ü Operating efficiency gains lifting “unhedged” netbacks through 2019
ü 2017 drilling program to double with a second rig
ü $20 million Partner carried drilling cost to accelerate growth
ü 143 sections of Montney opportunity to continue developing
ü Partner has contributed $30 million in cash for working interest equalization
ü Secured firm service with Alliance to access Chicago gas market for stronger pricing
NEB, FirstEnergy, EIA, USGS
January 2017
APPENDIX
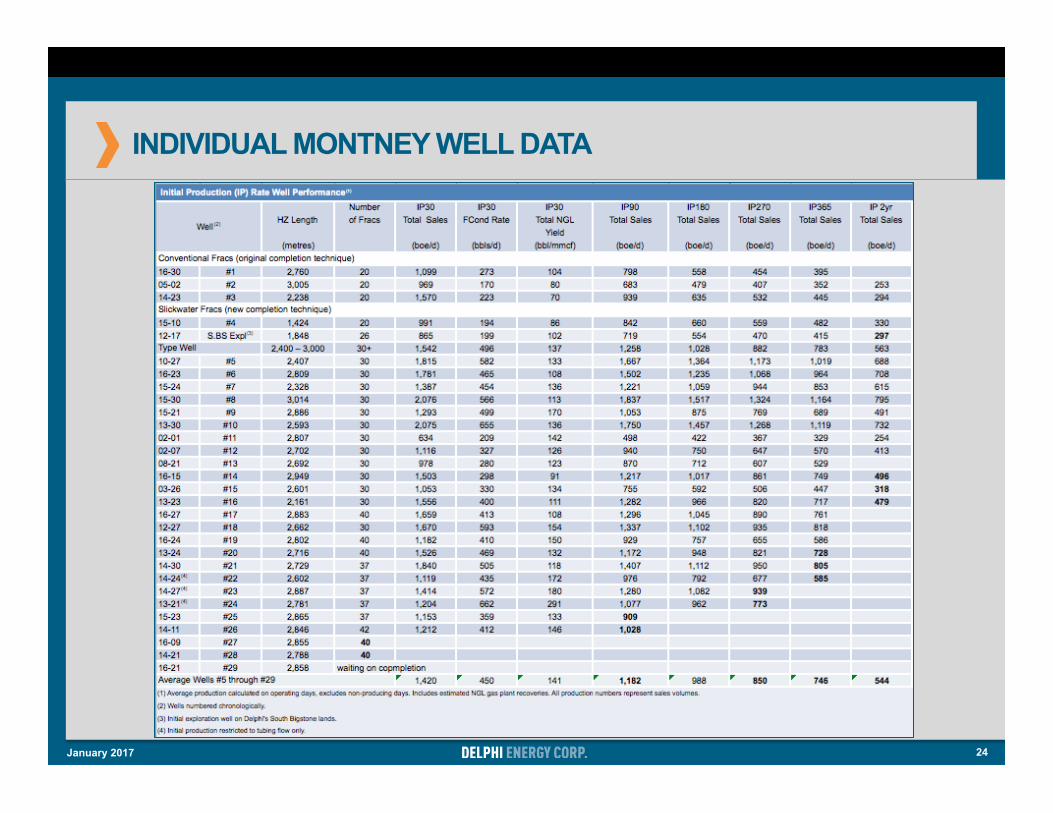
INDIVIDUAL MONTNEY WELL DATA
24 January 2017
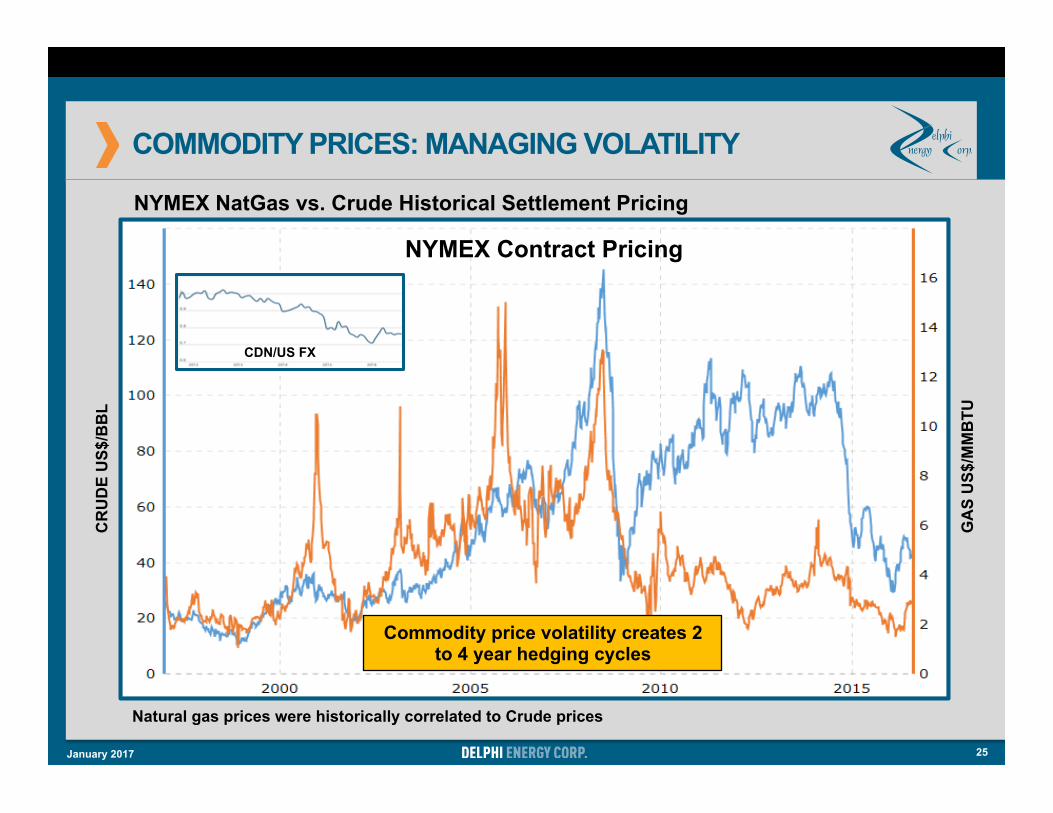
COMMODITY PRICES: MANAGING VOLATILITY
25
Volatility creates hedging
opportunities
CDN/US FX
NYMEX Contract Pricing
GA
S U
S$/M
MB
TU
CR
UD
E U
S$/B
BL
Natural gas prices were historically correlated to Crude prices
NYMEX NatGas vs. Crude Historical Settlement Pricing
Commodity price volatility creates 2 to 4 year hedging cycles
January 2017
HEDGES PROTECTING CASH FLOW
26
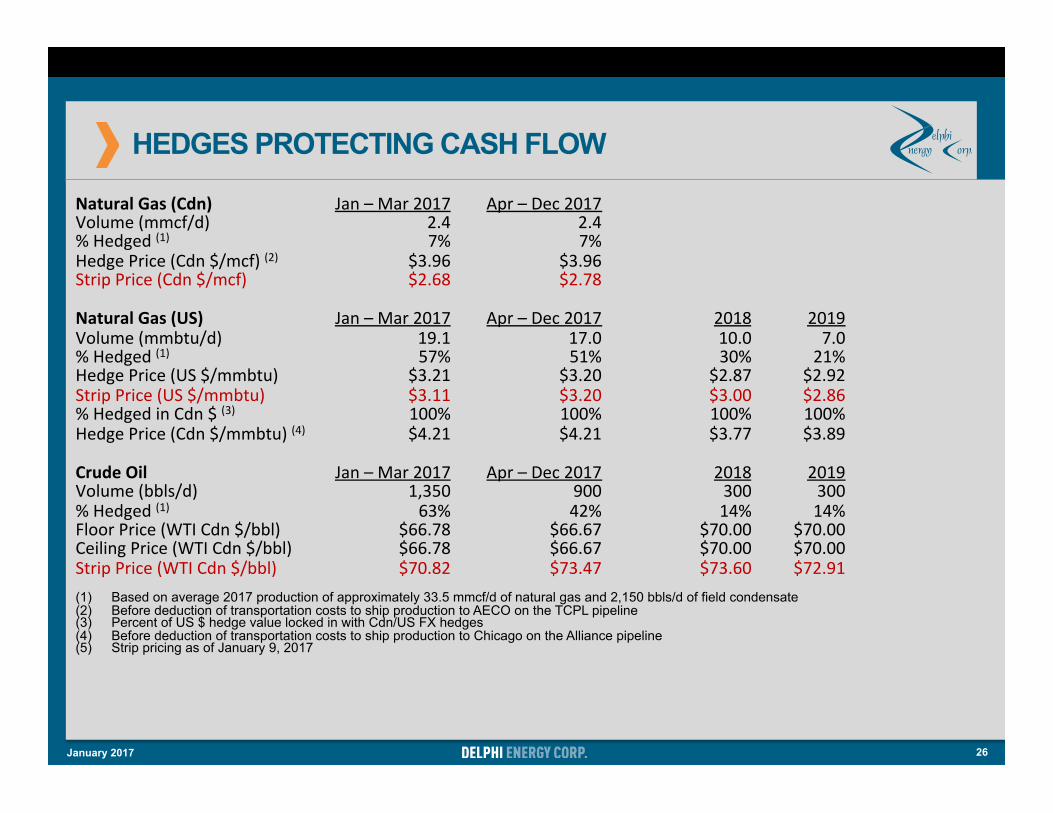
NaturalGas(Cdn) Jan–Mar2017 Apr–Dec2017Volume(mmcf/d) 2.4 2.4%Hedged(1) 7% 7%HedgePrice(Cdn$/mcf)(2) $3.96 $3.96StripPrice(Cdn$/mcf) $2.68 $2.78NaturalGas(US) Jan–Mar2017 Apr–Dec2017 2018 2019Volume(mmbtu/d) 19.1 17.0 10.0 7.0%Hedged(1) 57% 51% 30% 21%HedgePrice(US$/mmbtu) $3.21 $3.20 $2.87 $2.92StripPrice(US$/mmbtu) $3.11 $3.20 $3.00 $2.86%HedgedinCdn$(3) 100% 100% 100% 100%HedgePrice(Cdn$/mmbtu)(4) $4.21 $4.21 $3.77 $3.89CrudeOil Jan–Mar2017 Apr–Dec2017 2018 2019Volume(bbls/d) 1,350 900 300 300%Hedged(1) 63% 42% 14% 14%FloorPrice(WTICdn$/bbl) $66.78 $66.67 $70.00 $70.00CeilingPrice(WTICdn$/bbl) $66.78 $66.67 $70.00 $70.00StripPrice(WTICdn$/bbl) $70.82 $73.47 $73.60 $72.91(1) Based on average 2017 production of approximately 33.5 mmcf/d of natural gas and 2,150 bbls/d of field condensate (2) Before deduction of transportation costs to ship production to AECO on the TCPL pipeline (3) Percent of US $ hedge value locked in with Cdn/US FX hedges (4) Before deduction of transportation costs to ship production to Chicago on the Alliance pipeline (5) Strip pricing as of January 9, 2017
January 2017
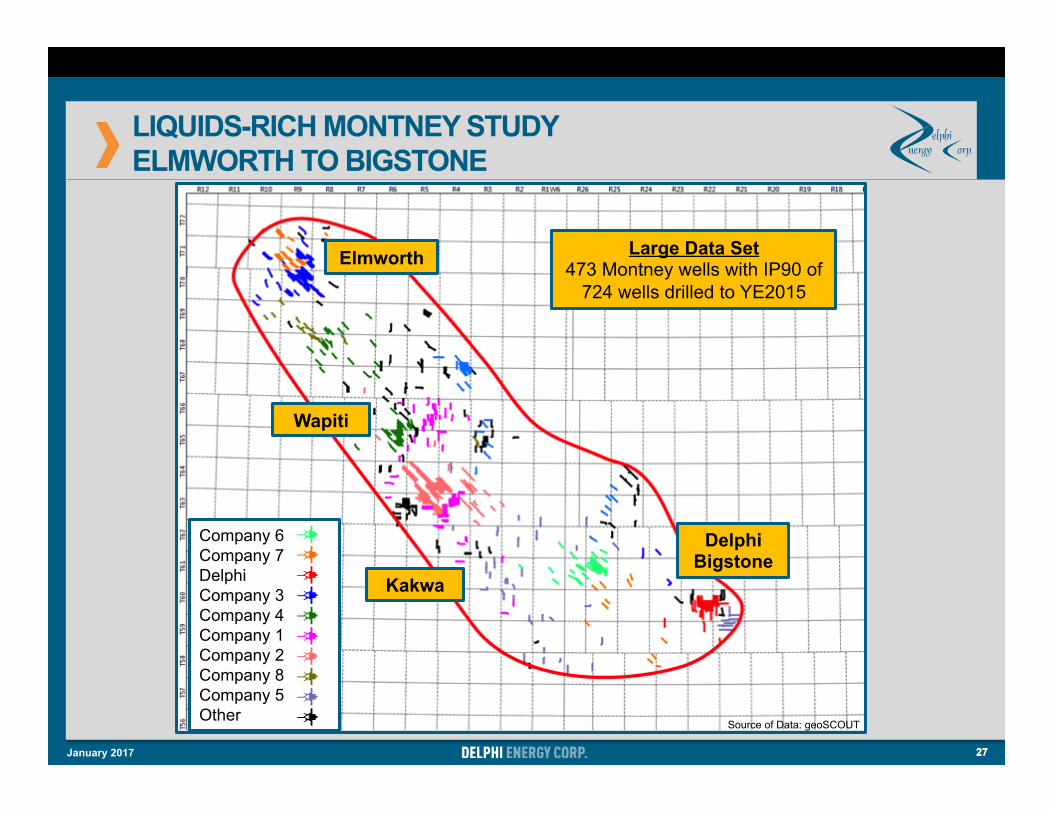
LIQUIDS-RICH MONTNEY STUDY ELMWORTH TO BIGSTONE
27
Elmworth
Wapiti
Kakwa
Delphi Bigstone
Large Data Set 473 Montney wells with IP90 of
724 wells drilled to YE2015
Source of Data: geoSCOUT
27
Company 6 Company 7 Delphi Company 3 Company 4 Company 1 Company 2 Company 8 Company 5 Other
January 2017
28
020406080100120140160180200
2008 2009 2010 2011 2012 2013 2014 2015
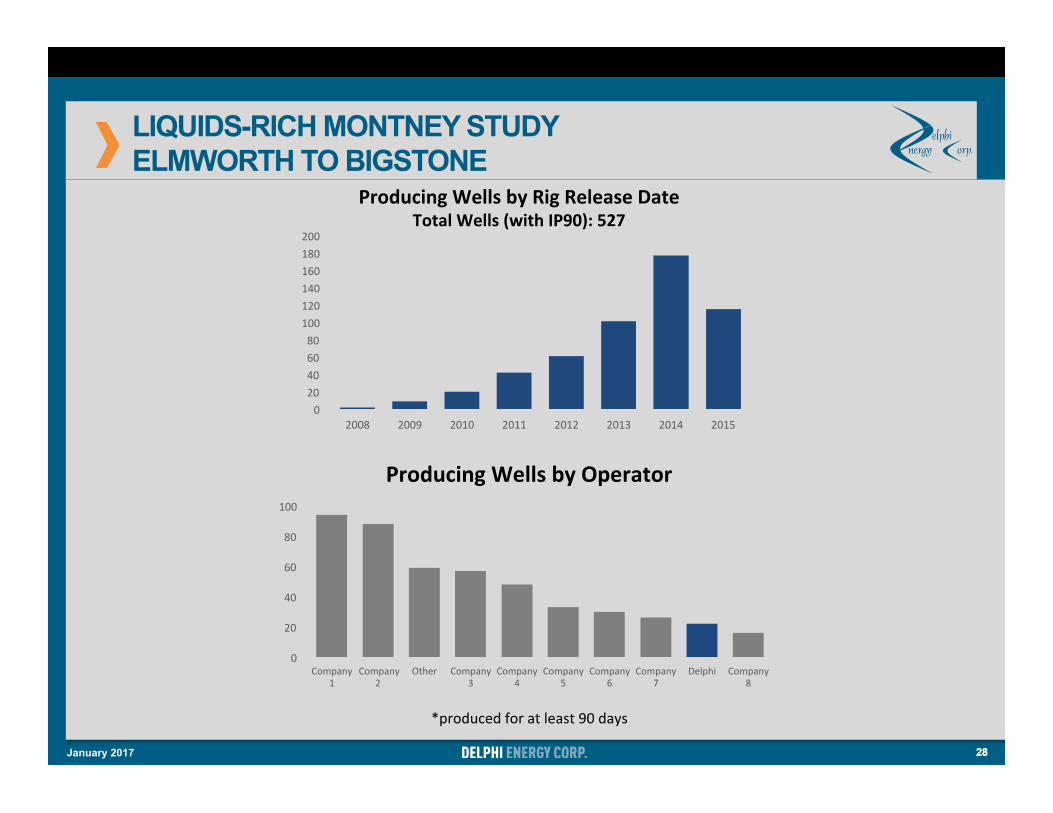
ProducingWellsbyRigReleaseDateTotalWells(withIP90):527
*producedforatleast90days
0
20
40
60
80
100
Company1
Company2
Other Company3
Company4
Company5
Company6
Company7
Delphi Company8
ProducingWellsbyOperator
28
LIQUIDS-RICH MONTNEY STUDY ELMWORTH TO BIGSTONE
January 2017
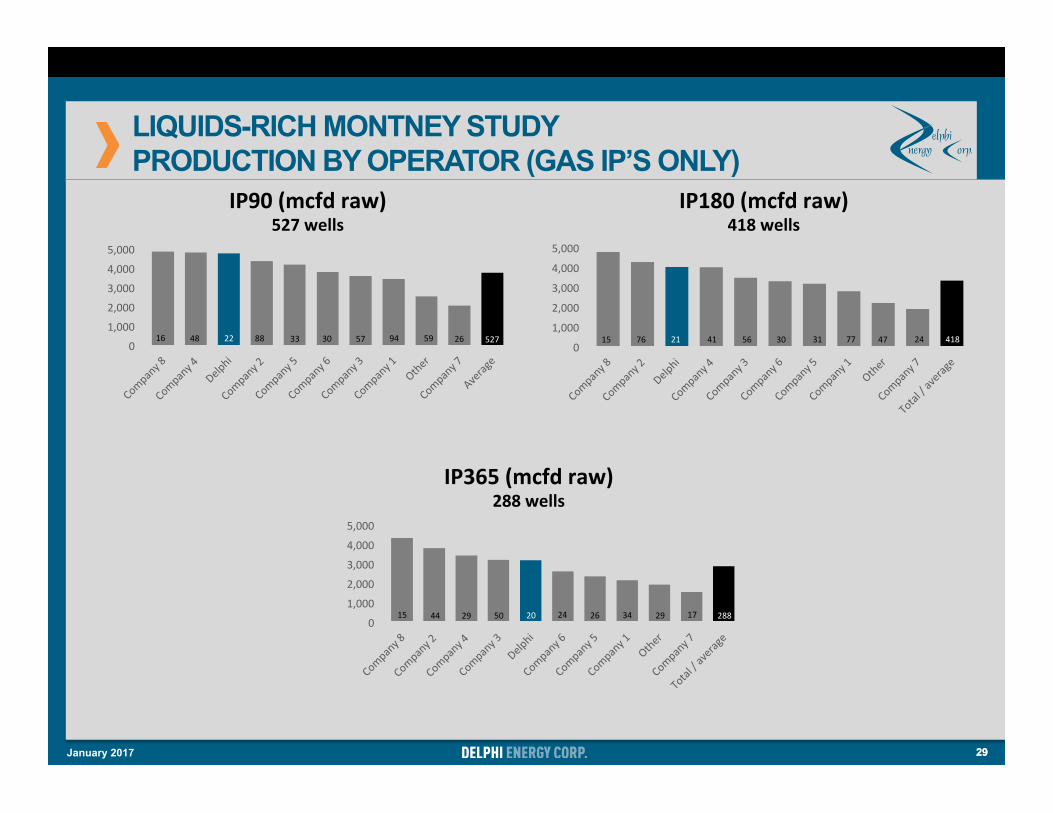
LIQUIDS-RICH MONTNEY STUDY PRODUCTION BY OPERATOR (GAS IP’S ONLY)
29
0
1,000
2,000
3,000
4,000
5,000
IP90(mcfdraw)527wells
884816 3322 94 59 26 52730 570
1,000
2,000
3,000
4,000
5,000
IP180(mcfdraw)418wells
0
1,000
2,000
3,000
4,000
5,000
IP365(mcfdraw)288wells
21 4115 5676 77 47 24 41830 31
15 2050 2444 29 34 29 17 28826
29 January 2017
0
500
1,000
1,500
2,000
2,500
3,000
AverageHorizontalLength(m)
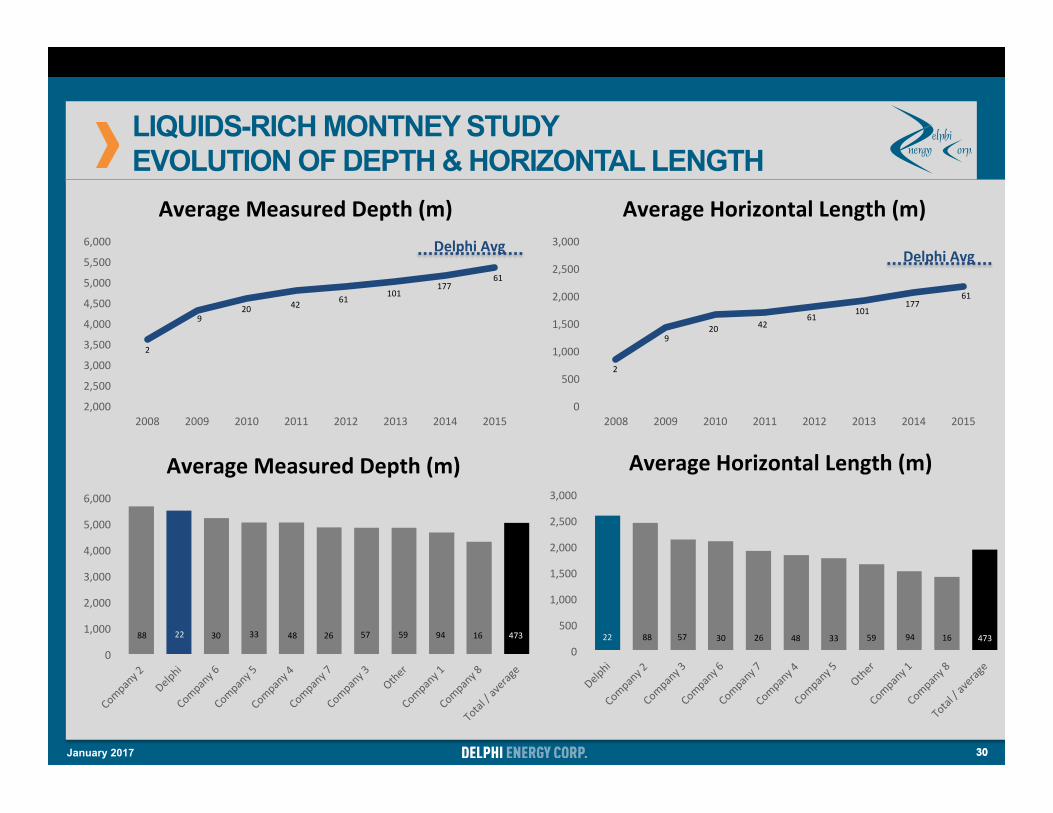
LIQUIDS-RICH MONTNEY STUDY EVOLUTION OF DEPTH & HORIZONTAL LENGTH
30
2,000
2,500
3,000
3,500
4,000
4,500
5,000
5,500
6,000
2008 2009 2010 2011 2012 2013 2014 2015
AverageMeasuredDepth(m)
920 42 61
0
500
1,000
1,500
2,000
2,500
3,000
2008 2009 2010 2011 2012 2013 2014 2015
AverageHorizontalLength(m)DelphiAvg
DelphiAvg
0
1,000
2,000
3,000
4,000
5,000
6,000
AverageMeasuredDepth(m)
2
101177
61
101177
61
61
920 42
2
88 22 30 33 48 26 57 59 94 16 473 8822 30 33482657 59 94 16 473
30 January 2017
0
5
10
15
20
25
30
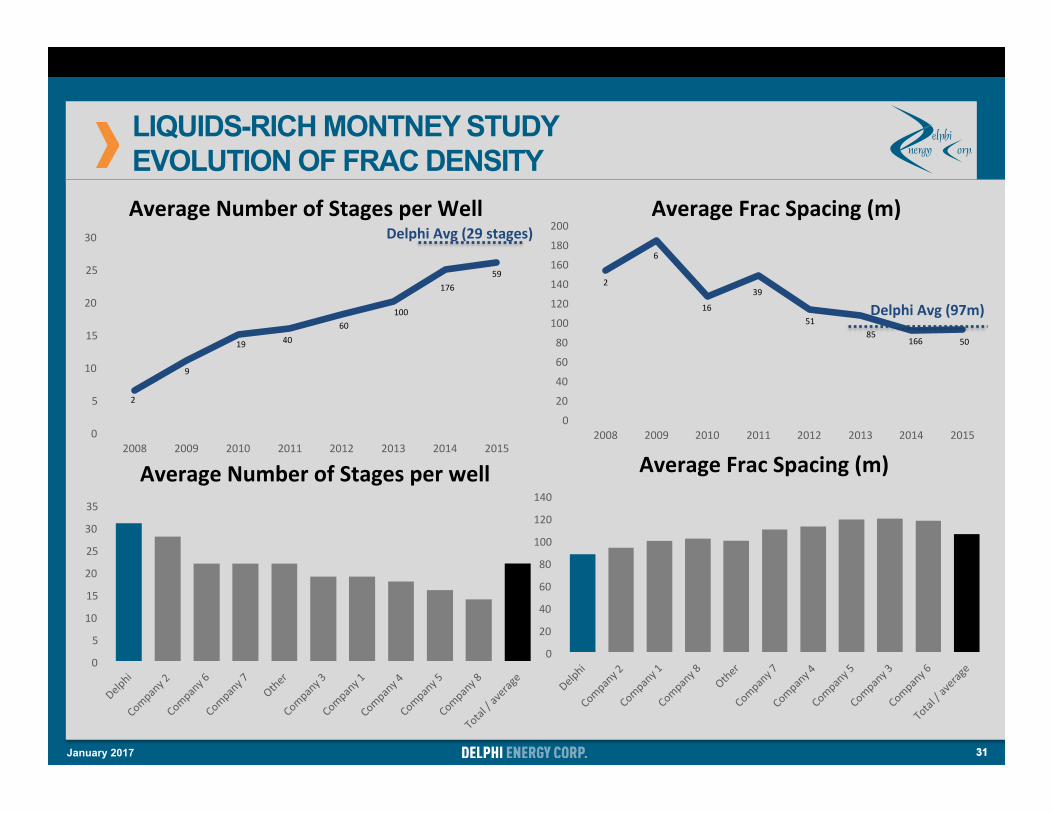
2008 2009 2010 2011 2012 2013 2014 2015
AverageNumberofStagesperWell
LIQUIDS-RICH MONTNEY STUDY EVOLUTION OF FRAC DENSITY
31
0
20
40
60
80
100
120
140
160
180
200
2008 2009 2010 2011 2012 2013 2014 2015
AverageFracSpacing(m)
DelphiAvg(97m)
2
9
19 4060
100
17659
2
6
16
39
51
166 5085
DelphiAvg(29stages)
31
0
5
10
15
20
25
30
35
AverageNumberofStagesperwell
0
20
40
60
80
100
120
140
AverageFracSpacing(m)
January 2017
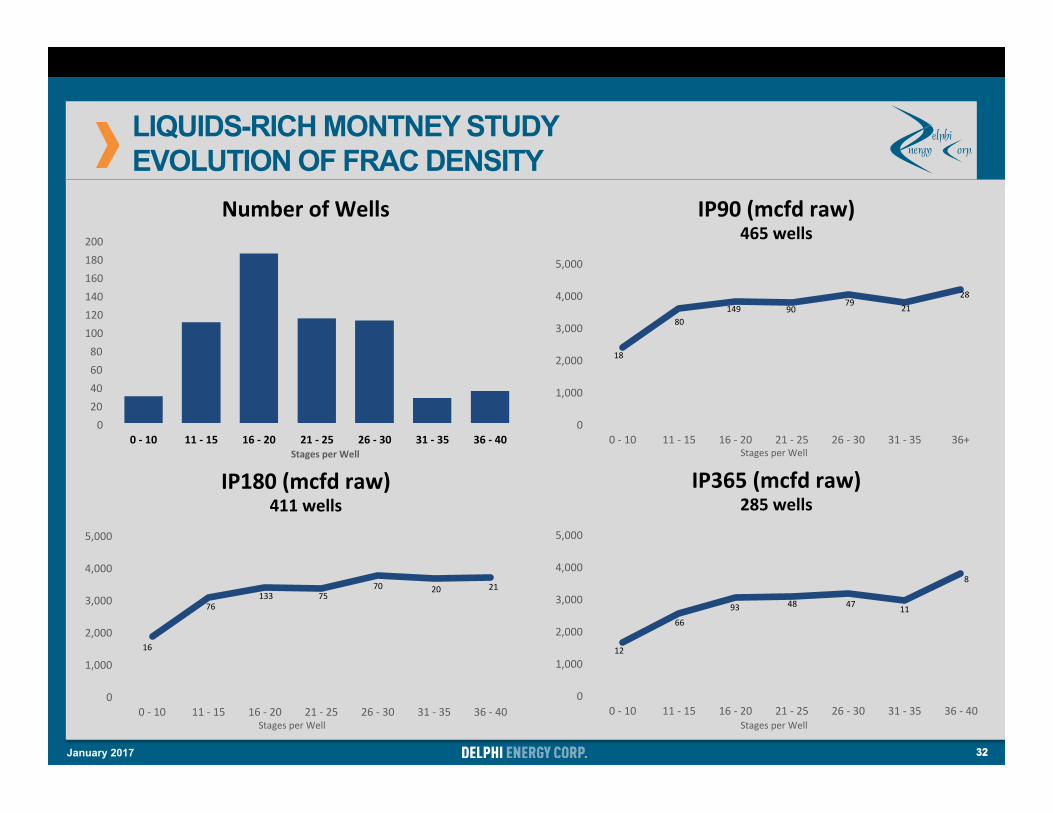
32
020406080100120140160180200
0-10 11-15 16-20 21-25 26-30 31-35 36-40
NumberofWells
0
1,000
2,000
3,000
4,000
5,000
0-10 11-15 16-20 21-25 26-30 31-35 36+
IP90(mcfdraw)465wells
0
1,000
2,000
3,000
4,000
5,000
0-10 11-15 16-20 21-25 26-30 31-35 36-40
IP180(mcfdraw)411wells
0
1,000
2,000
3,000
4,000
5,000
0-10 11-15 16-20 21-25 26-30 31-35 36-40
IP365(mcfdraw)285wells
StagesperWellStagesperWell
StagesperWell StagesperWell
18
80149 90
79 2128
16
76133 75
70 20 21
12
66
93 48 47 11
8
32
LIQUIDS-RICH MONTNEY STUDY EVOLUTION OF FRAC DENSITY
January 2017
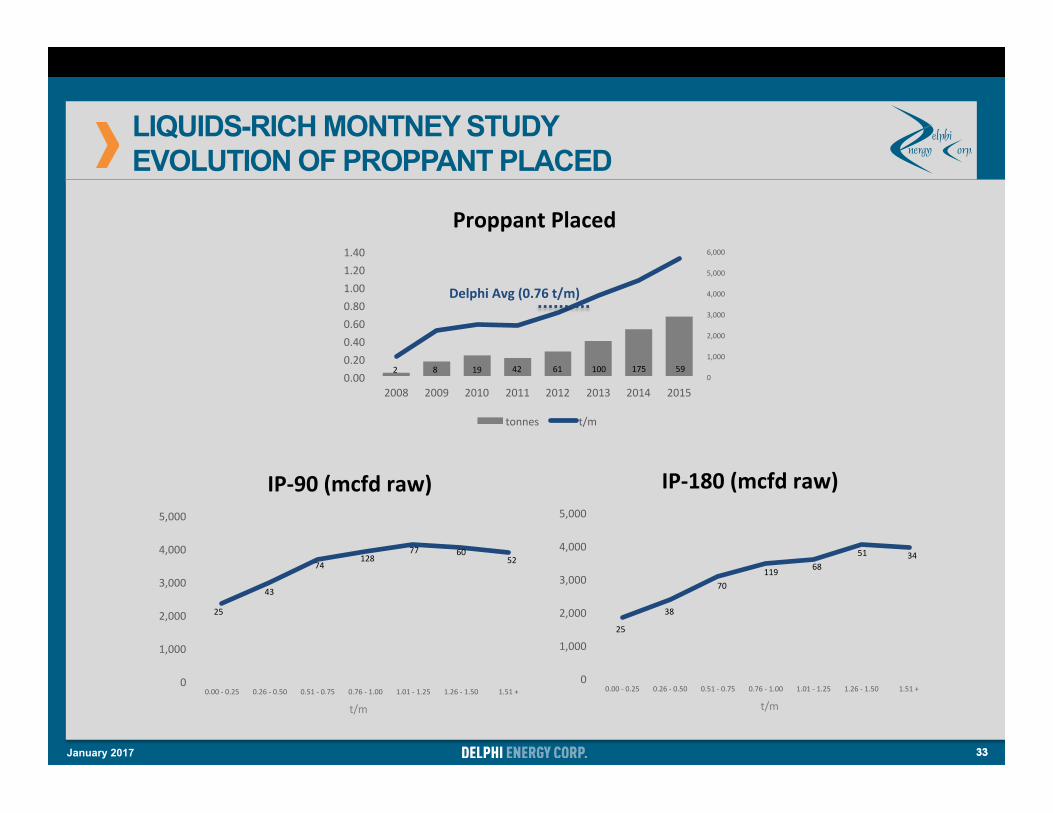
LIQUIDS-RICH MONTNEY STUDY EVOLUTION OF PROPPANT PLACED
33
0
1,000
2,000
3,000
4,000
5,000
6,000
0.000.200.400.600.801.001.201.40
2008 2009 2010 2011 2012 2013 2014 2015
ProppantPlaced
tonnes t/m
0
1,000
2,000
3,000
4,000
5,000
0.00-0.25 0.26-0.50 0.51-0.75 0.76-1.00 1.01-1.25 1.26-1.50 1.51+
IP-90(mcfdraw)
t/m
0
1,000
2,000
3,000
4,000
5,000
0.00-0.25 0.26-0.50 0.51-0.75 0.76-1.00 1.01-1.25 1.26-1.50 1.51+
IP-180(mcfdraw)
t/m
25
43
74128
77 6052
25
38
11970
6851 34
2 8 19 42 61 100 175 59
DelphiAvg(0.76t/m)
33 January 2017
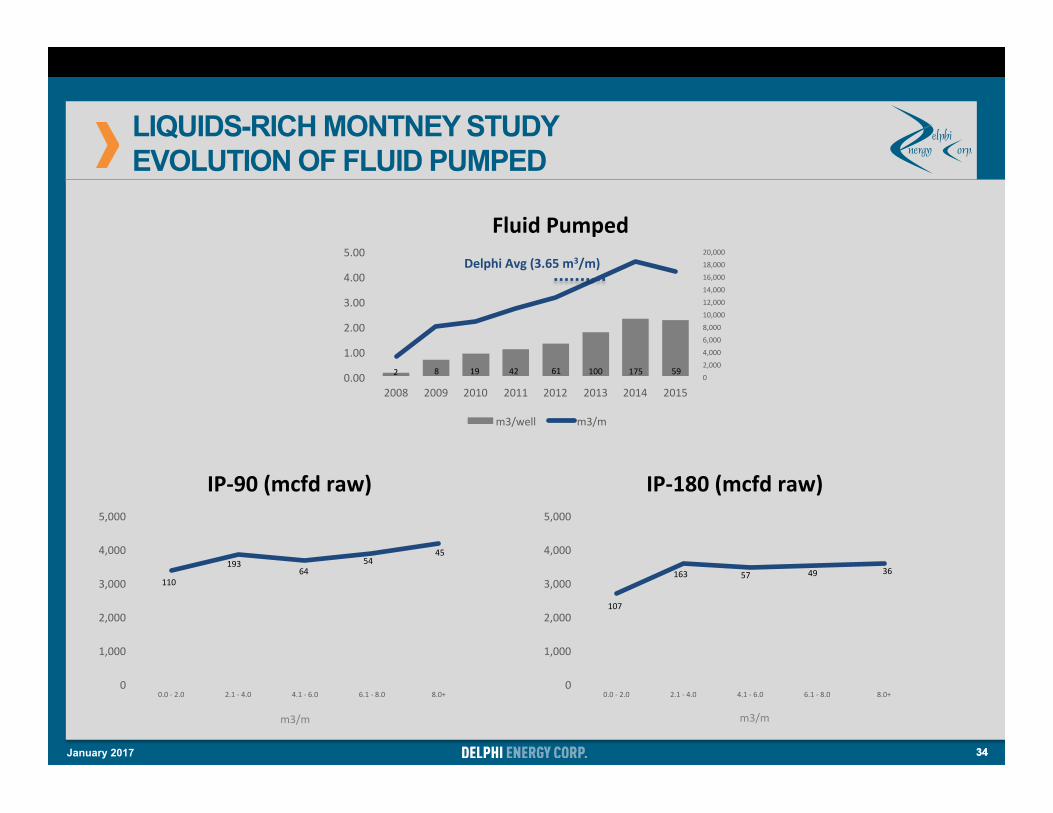
LIQUIDS-RICH MONTNEY STUDY EVOLUTION OF FLUID PUMPED
34
02,0004,0006,0008,00010,00012,00014,00016,00018,00020,000
0.00
1.00
2.00
3.00
4.00
5.00
2008 2009 2010 2011 2012 2013 2014 2015
FluidPumped
m3/well m3/m
0
1,000
2,000
3,000
4,000
5,000
0.0-2.0 2.1-4.0 4.1-6.0 6.1-8.0 8.0+
IP-90(mcfdraw)
0
1,000
2,000
3,000
4,000
5,000
0.0-2.0 2.1-4.0 4.1-6.0 6.1-8.0 8.0+
IP-180(mcfdraw)
m3/m m3/m
110
19364
5445
107
163 57 49 36
2 8 19 42 61 100 175 59
DelphiAvg(3.65m3/m)
34 January 2017
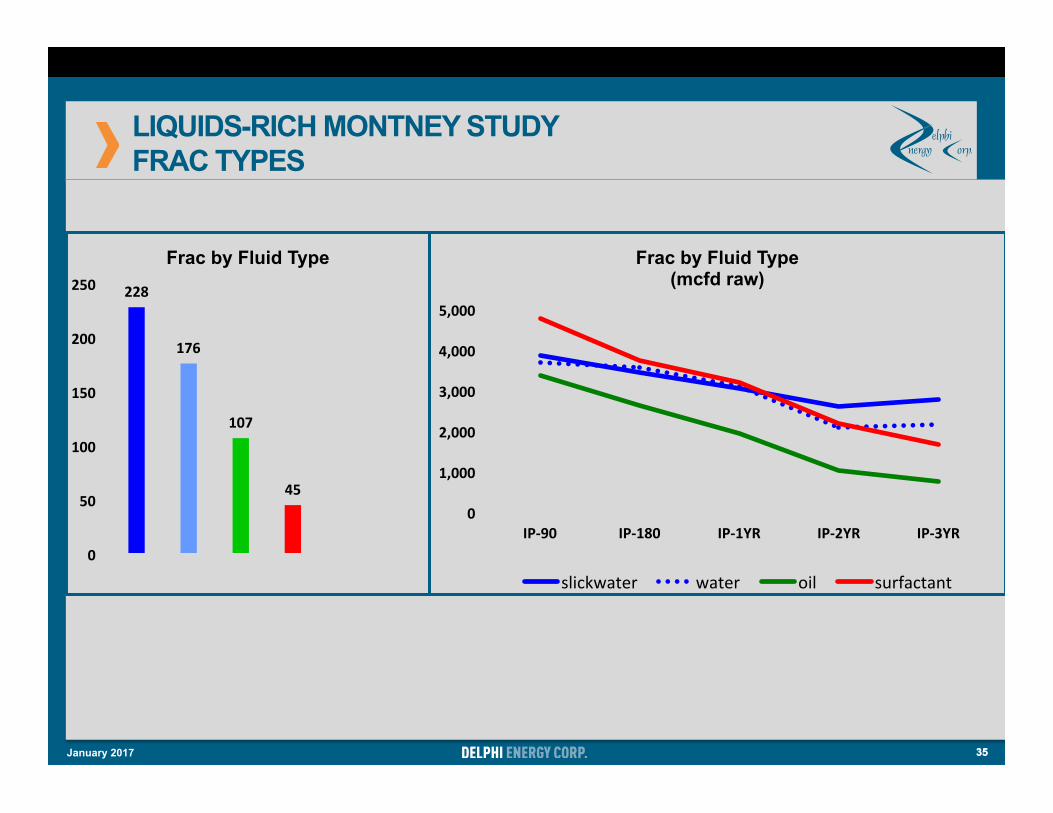
LIQUIDS-RICH MONTNEY STUDY FRAC TYPES
35
228
176
107
45
0
50
100
150
200
250
Frac by Fluid Type
35
0
1,000
2,000
3,000
4,000
5,000
IP-90 IP-180 IP-1YR IP-2YR IP-3YR
Frac by Fluid Type (mcfd raw)
slickwater water oil surfactant
January 2017
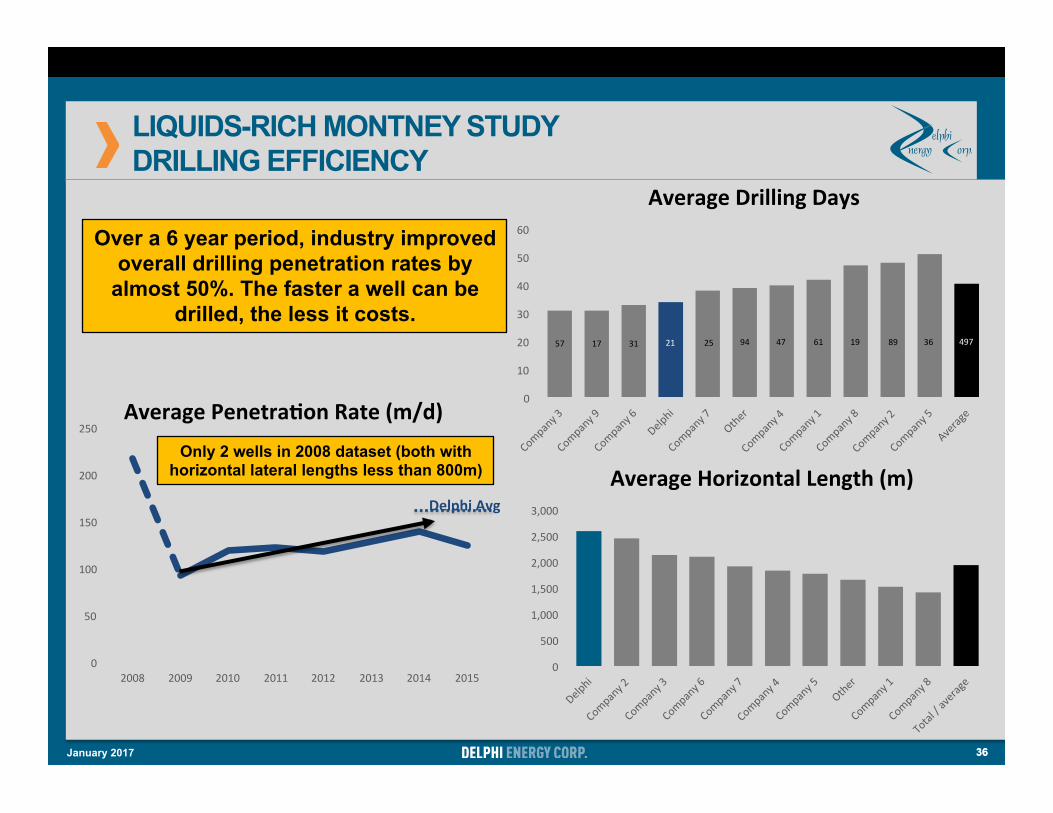
36
0
10
20
30
40
50
60
AverageDrillingDays
57 17 31 21 25 94 47 61 19 89 36 497
36
LIQUIDS-RICH MONTNEY STUDY DRILLING EFFICIENCY
0
500
1,000
1,500
2,000
2,500
3,000
AverageHorizontalLength(m)
0
50
100
150
200
250
2008 2009 2010 2011 2012 2013 2014 2015
AveragePenetra=onRate(m/d)
DelphiAvg
Only 2 wells in 2008 dataset (both with horizontal lateral lengths less than 800m)
Over a 6 year period, industry improved overall drilling penetration rates by
almost 50%. The faster a well can be drilled, the less it costs.
January 2017
300, 500 – 4th Avenue SW Calgary, Alberta T2P 2V6 P (403) 265-6171 F (403) 265-6207 [email protected] www.delphienergy.ca


