Energy Research and Development Division FINAL REPORT DEMAND RESPONSE RESEARCH CENTER Final Report NOVEMBER 15, 2015 CEC-500-2015-XXX Prepared for: California Energy Commission Prepared by: Lawrence Berkeley National Laboratory LBNL-1005753
Transcript
En e rgy Rese arc h an d Deve lopmen t Divi s i onFINAL REPOR T
DEMAND RESPONSE RESEARCH CENTER
Final Report
NOVE MBER 15, 2015
CE C-500-2015-XXX
Prepared for: California Energy Commission
Prepared by: Lawrence Berkeley National Laboratory
LBNL-1005753
Prepared by: Primary Author(s): Mary Ann Piette Sila Kiliccote Girish Ghatikar Aimee McKane Nance Matson Janie Page Jason MacDonald Arian Aghajanzadeh Doug Black Rongxin Yin Lawrence Berkeley National Laboratory Demand Response Center 1 Cyclotron Road Berkeley, CA 94720
Contract Number: 500-2015-XXX
Prepared for:
California Energy Commission
David Hungerford Contract Manager
Virginia Lew Office Manager Energy Efficiency Research Office
Laurie ten Hope Deputy Director ENERGY RESEARCH AND DEVELOPMENT DIVISION
Robert P. Oglesby Executive Director
DISCLAIMER This report was prepared as the result of work sponsored by the California Energy Commission. It does not necessarily represent the views of the Energy Commission, its employees or the State of California. The Energy Commission, the State of California, its employees, contractors and subcontractors make no warrant, express or implied, and assume no legal liability for the information in this report; nor does any party represent that the uses of this information will not infringe upon privately owned rights. This report has not been approved or disapproved by the California Energy Commission nor has the California Energy Commission passed upon the accuracy or adequacy of the information in this report.
i
LBNL DISCLAIMER
This document was prepared as an account of work sponsored by the United States Government. While this document is believed to contain correct information, neither the United States Government nor any agency thereof, nor The Regents of the University of California, nor any of their employees, makes any warranty, express or implied, or assumes any legal responsibility for the accuracy, completeness, or usefulness of any information, apparatus, product, or process disclosed, or represents that its use would not infringe privately owned rights. Reference herein to any specific commercial product, process, or service by its trade name, trademark, manufacturer, or otherwise, does not necessarily constitute or imply its endorsement, recommendation, or favoring by the United States Government or any agency thereof, or The Regents of the University of California. The views and opinions of authors expressed herein do not necessarily state or reflect those of the United States Government or any agency thereof or The Regents of the University of California.
ii
ACKNOWLEGEMENTS The work described in this report was coordinated by the Demand Response Research Center and funded by the California Energy Commission (Energy Commission), Public Interest Energy Research (PIER) Program, under Work for Others Contract No. 500-03-026, and by the U.S. Department of Energy under Contract No. DE-AC02-05CH11231.
The authors would like to thank the California Energy Commission PIER Staff (Laurie ten Hope, Mike Gravely, David Hungerford, Chris Scruton, Anish Gautam, Connie Sichon, Mike Lozano, Jamie Patterson, Kristy Chew, Steve Ghadari, Ivan Rhyne and Pedro Gomez) for their support, management and participation in the of the Demand Response Research Contract, Ron Hofmann for his encouragement, support and technical guidance, Roger Levy for his participation in the management and outreach activities of the Center, and the countless LBNL and subcontractor researchers who contributed to expanding the boundaries of the Center’s research activities.
We would like to thank the following DRRC contractors for their contribution to the Demand Response Research Center activities:
Global Energy Associates Enernoc) Southern Contracting Company
Global Energy Partners Stellar
Graybar Summit Blue
Herter Energy Research Services UC Berkeley, Calif. Institute for Energy and Environment
iii
Heschong Mahone Group UC Berkeley, Center for the Built Environment
Infotility UC Berkeley, Department of Mechanical Engineering
IRIS UC Davis, California Lighting Technology Center
Itron Utility Integrated Solutions (UISOL)
KEMA Vacom Technologies
KSEngineers Water and Energy Consulting
Levy Associates
We would like to thank the following LBNL researchers and staff for their commitment and dedication to the Demand Response Research Center’s work:
Nathan Addy Al Hodgson David Parker
Bunmi Adesola Greg Homan Rajiv Parmar
Arian Aghajanzadeh Tianzhen Hong Kristen Parrish
Paula Ashley Nicole Hopper Corinthia Peoples
Barbara Atkinson Toshifumi Hotchi Mary Ann Piette
Galen Barbose Jack Howells Marisa Price
Michael Berger Lily Hu Phil Price
Ranjit Bharvirkar Kimberly Huppert Anthony Radspieler
Douglas Black Cooper Stergis Jamieson David Riess
Arran Blattel Sondra Jarvis Alexandra Rockoff
Norm Bourassa Emre Kara Cody Rose
Rich Brown Sila Kiliccote Francis Rubinstein
Abel Buickerood Joyce Kim Andrew Satchwell
Peter Cappers Callie Koch Samveg Saxena
Terry Chan Kristina LaCommare Oren Schetrit
Iris Cheung Judy Lai Peter Schwartz
Katie Coughlin Joanne Lambert Osman Sezgen
iv
Stephen Czarnecki Steven Lanzisera Jordan Shackelford
Douglas Davenport Alex Lekov Michael Sohn
Nicholas DeForest Nancy Lewis Katherine Song
Rick Diamond Becky Li Jacob Southworth
Dennis Dibartolomeo Anna Liao Michael Spears
June Dudley Zhenhua Liu Michael Stadler
Laurel Dunn John Loffield Doug Sullivan
Eve Edelson Michael Lorek Hae Yeon Sung
Abby Isabel Enscoe David Lorenzetti Peter Therkelsen
Anita Estner Anthony Ma Lisa Thompson
David Faulkner Jason MacDonald Michael Ting
Wei Feng Chris Marnay Julia Turner
Livio Fenga Eric Masanet Iain Walker
Concalo Ferriera Cardoso Salman Mashayekh David Watson
William Fisk Johanna Mathieu Andrew Weber
Christian Fitting Nance Matson Joy Wen-shin Wei
Kimberly Fujita Aimee McKane Michael Wiley
Daniel Fuller Chuck McParland Emily Wood
Alex Hinsin Fung Alan Meier Spencer Woodworth
Christina Galitsky Mark Mensch Craig Wray
James Galvin Andrew D Mills Xinyi Wu
Venkata (Vish) Ganti Maya Minamihara John Wunderlich
Rish Ghatikar Andrew Mingst Peng Xu
Chuck Goldman Naoya Motegi Mehri Yazdanian
Sasank Goli Scott G Murtishaw Rongxin Yin
Jessica Granderson Danielle M Neils Alexandra Zannos
Philip Haves Bruce Nordman Rongpeng Zhang
v
Bon Hernandez Daniel Olsen Rongyuan Zhang
Karen Herter Janie Page Lei Zhou
Rob Hitchcock Xiufeng Pang
vi
PREFACE The California Energy Commission Energy Research and Development Division supports public interest energy research and development that will help improve the quality of life in California by bringing environmentally safe, affordable, and reliable energy services and products to the marketplace.
The Energy Research and Development Division conducts public interest research, development, and demonstration (RD&D) projects to benefit California.
The Energy Research and Development Division strives to conduct the most promising public interest energy research by partnering with RD&D entities, including individuals, businesses, utilities, and public or private research institutions.
Energy Research and Development Division funding efforts are focused on the following RD&D program areas:
• Buildings End-Use Energy Efficiency
• Energy Innovations Small Grants
• Energy-Related Environmental Research
• Energy Systems Integration
• Environmentally Preferred Advanced Generation
• Industrial/Agricultural/Water End-Use Energy Efficiency
• Renewable Energy Technologies
• Transportation
Demand Response Research Center is the final report for a series of research projects conducted between 2003 and 2015 by researchers at the Lawrence Berkeley National Laboratory in cooperation with many other individuals and organizations. The information from this project contributes to Energy Research and Development Division’s Buildings End-Use Energy Efficiency, Energy Systems Integration, and Industrial/Agriculture/Water End-Use Energy Efficiency Programs.
For more information about the Energy Research and Development Division, please visit the Energy Commission’s website at www.energy.ca.gov/research/ or contact the Energy Commission at 916-327-1551.
In response to electric supply problems stemming from the failure of the restructured California electricity market in the late 1990s, the California Energy Commission sponsored the founding of the Demand Response Research Center at Lawrence Berkeley National Laboratory. Its purpose was to develop ways to reduce electricity demand in response to price, monetary incentives, or utility directives so as to maintain reliable electric service or avoid high electricity prices. From its inception in 2003, until 2015, the period covered by this report, researchers at the Center developed ways to automate demand response. They developed a communication protocol known as OpenADR to enable transmission of demand response signals between suppliers and users of electricity. OpenADR has since become a US national standard, in use in over 1300 facilities and in 10 countries around the world. Researchers at the Center developed methods for energy users to vary electric loads in response to OpenADR signals by automatically controlling air conditioning, lighting, and process loads in buildings, industrial facilities, and agricultural operations. By 2013, working with utilities, they had enabled over 250 megawatts of load shed capability. They developed free public-access software tools to allow implementers to quickly estimate the potential for facilities to shed loads, and secure software to allow consumers to access near real-time data from smart meters. They contributed to national and international efforts to create standards for a ‘smart grid’ that is resilient and can accommodate new demands such as intermittent distributed renewable energy sources and electric vehicle battery charging. They helped form an industry organization known as the OpenADR Alliance that in 2015 has over 130 members, including all major facility and industrial control companies. Finally, they created a record of these efforts in the dozens of research papers that are referenced and linked in this report.
Keywords: demand response, DR, OpenADR, DRRC, load shedding, thermal energy storage, renewable energy integration, smart grid, precooling, DRQAT, peak load shaving, electric vehicle charging
Please use the following citation for this report:
Piette, Mary Ann; Second author; Third author. (Lawrence Berkeley National Laboratory) 2015. Demand Response Research Center. California Energy Commission. Publication number: CEC-500-2015-XXX.
viii
TABLE OF CONTENTS LBNL DISCLAIMER ............................................................................................................................... i
ACKNOWLEGEMENTS ..................................................................................................................... ii
PREFACE ............................................................................................................................................... vi
ABSTRACT ............................................................................................................................................. vii
TABLE OF CONTENTS ................................................................................................................... viii
Task RR - REDS Phase III (WA2-8.4,9.1,9.4-1) .............................................................................. B1
Appendix C – Anytime DR and DR Potential Studies Report Abstracts ................................... C1
Anytime DR and DR Potentials Studies .......................................................................................... C1
Task IR - OpenADR Integration with Renewables, Smart Grid and Energy Storage Systems (WA1-8.3-1) ...................................................................................................................................... C1
Task MG - Microgrid- Santa Rita (WA2-9.4-2) ........................................................................... E17
Task SL - Small Loads (WA3-8.4) ................................................................................................. E17
Appendix F – AutoDR in California Building Energy Efficiency Standards Report Abstracts .................................................................................................................................................................... F1
Task 4.8 - Title 24 Commercial DR ................................................................................................. F1
Task C.5 - OpenADR New Construction ...................................................................................... F1
Task NC - T24 & New Construction (WA3-9.3-NC) ................................................................... F2
Appendix G – Active and Passive Storage Report Abstracts .......................................................... F1
Water ..................................................................................................................................................... H4
Task 4.E - DR - Water TOU Tariffs ............................................................................................... H4
Data Centers....................................................................................................................................... H11
Task J.5 - Demand Response in Data Centers ........................................................................... H11
Task IE - IAW DR End-Use Analysis and Field Studies (WA1-10.1) ..................................... H11
Task IE - IAW DR End-Use Analysis and Field Studies (WA1-10.1) ..................................... H12
Task IE - IAW DR End-Use Analysis and Field Studies (WA1-10.1) ..................................... H17
1
EXECUTIVE SUMMARY Background Electrical energy is an “on demand” commodity, so the supply must always match the demand. Historically, when demand overran available supply, rolling brownouts or worse, blackouts, were the result. Demand response, in which customer electric demand is reduced temporarily, can provide a strategy to mitigate blackouts as well as to help manage price spikes and improve overall grid reliability.
In California, the United States, and abroad, many utilities, governments, electric independent systems operators and others have been pursuing demand response (DR) to manage the growing demand for electricity and peak capacity of the electric systems. DR has been defined as “…action taken to reduce electricity demand in response to price, monetary incentives, or utility directives so as to maintain reliable electric service or avoid high electricity prices1”
Before the establishment of the Demand Response Research Center in 2003, most DR was implemented manually, except where loads such as air conditioning could be directly controlled. A phone call or fax from the utility to selected large commercial or industrial customers signaled a need for demand reduction, and those facilities capable of making reductions did so, largely by adjusting their systems by hand. Development by the Demand Response Research Center at Lawrence Berkeley Lab has significantly changed that situation.
Purpose and Objectives The Demand Response Research Center (DRRC) was developed to help improve the performance and cost effectiveness of demand response. Since its inception, the DRRC has been looking for ways to enhance DR’s effectiveness, largely through improved communications between connected supply and demand on the grid and through better understanding of how buildings and other energy-consuming structures respond to operational changes arising from reductions in electric energy use. These efforts include:
• Finding new and better ways to automate DR so that it becomes more reliable and cost-effective over the long term.
• Exploring the limits of automation to better understand how quickly DR can be deployed to meet short-term power needs.
• Making connections between DR and energy efficiency so that these historically separate efforts can become more synergistic.
• Developing a common, standardized “language” to communicate DR price and signals reliably between the energy service providers and customers and support the national Smart Grid interoperability standards vision.
1 U.S. Federal Energy Regulatory Commission (FERC), 2007 Assessment of Demand Response and Advanced Metering, Staff Report, available: http://www.ferc.gov/legal/staff-reports/09-07-demand-response.pdf
2
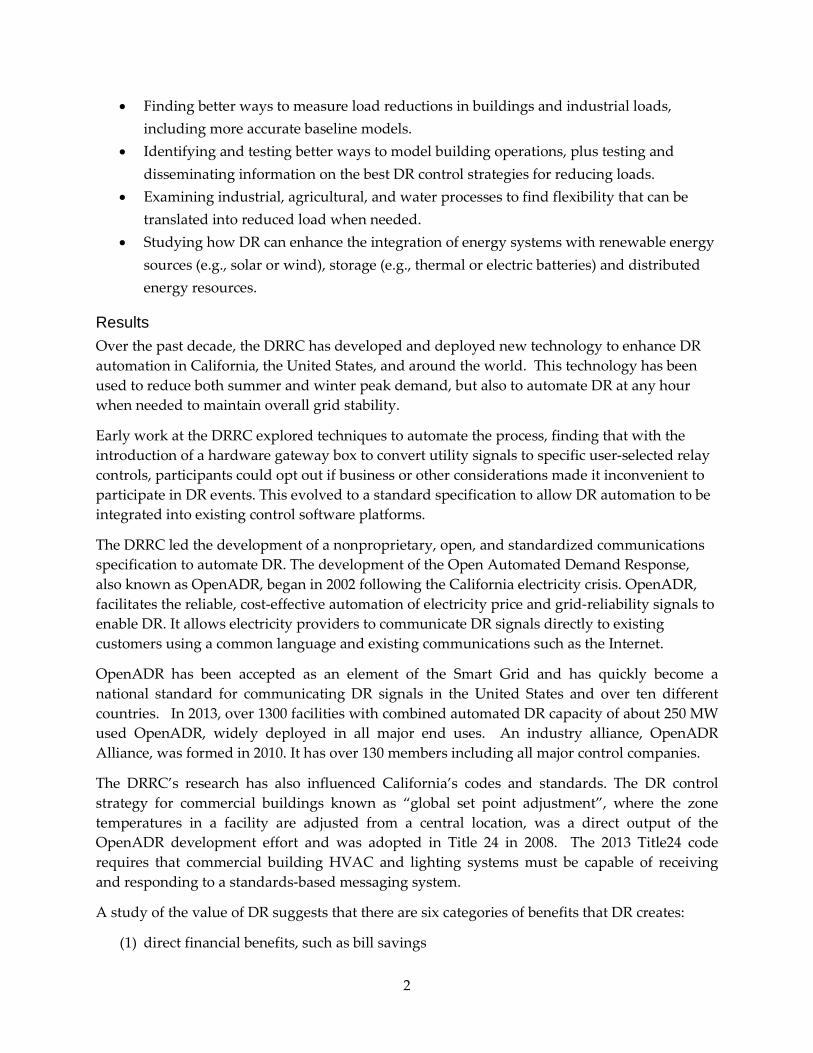
• Finding better ways to measure load reductions in buildings and industrial loads, including more accurate baseline models.
• Identifying and testing better ways to model building operations, plus testing and disseminating information on the best DR control strategies for reducing loads.
• Examining industrial, agricultural, and water processes to find flexibility that can be translated into reduced load when needed.
• Studying how DR can enhance the integration of energy systems with renewable energy sources (e.g., solar or wind), storage (e.g., thermal or electric batteries) and distributed energy resources.
Results Over the past decade, the DRRC has developed and deployed new technology to enhance DR automation in California, the United States, and around the world. This technology has been used to reduce both summer and winter peak demand, but also to automate DR at any hour when needed to maintain overall grid stability.
Early work at the DRRC explored techniques to automate the process, finding that with the introduction of a hardware gateway box to convert utility signals to specific user-selected relay controls, participants could opt out if business or other considerations made it inconvenient to participate in DR events. This evolved to a standard specification to allow DR automation to be integrated into existing control software platforms.
The DRRC led the development of a nonproprietary, open, and standardized communications specification to automate DR. The development of the Open Automated Demand Response, also known as OpenADR, began in 2002 following the California electricity crisis. OpenADR, facilitates the reliable, cost-effective automation of electricity price and grid-reliability signals to enable DR. It allows electricity providers to communicate DR signals directly to existing customers using a common language and existing communications such as the Internet.
OpenADR has been accepted as an element of the Smart Grid and has quickly become a national standard for communicating DR signals in the United States and over ten different countries. In 2013, over 1300 facilities with combined automated DR capacity of about 250 MW used OpenADR, widely deployed in all major end uses. An industry alliance, OpenADR Alliance, was formed in 2010. It has over 130 members including all major control companies.
The DRRC’s research has also influenced California’s codes and standards. The DR control strategy for commercial buildings known as “global set point adjustment”, where the zone temperatures in a facility are adjusted from a central location, was a direct output of the OpenADR development effort and was adopted in Title 24 in 2008. The 2013 Title24 code requires that commercial building HVAC and lighting systems must be capable of receiving and responding to a standards-based messaging system.
A study of the value of DR suggests that there are six categories of benefits that DR creates:
(1) direct financial benefits, such as bill savings
3
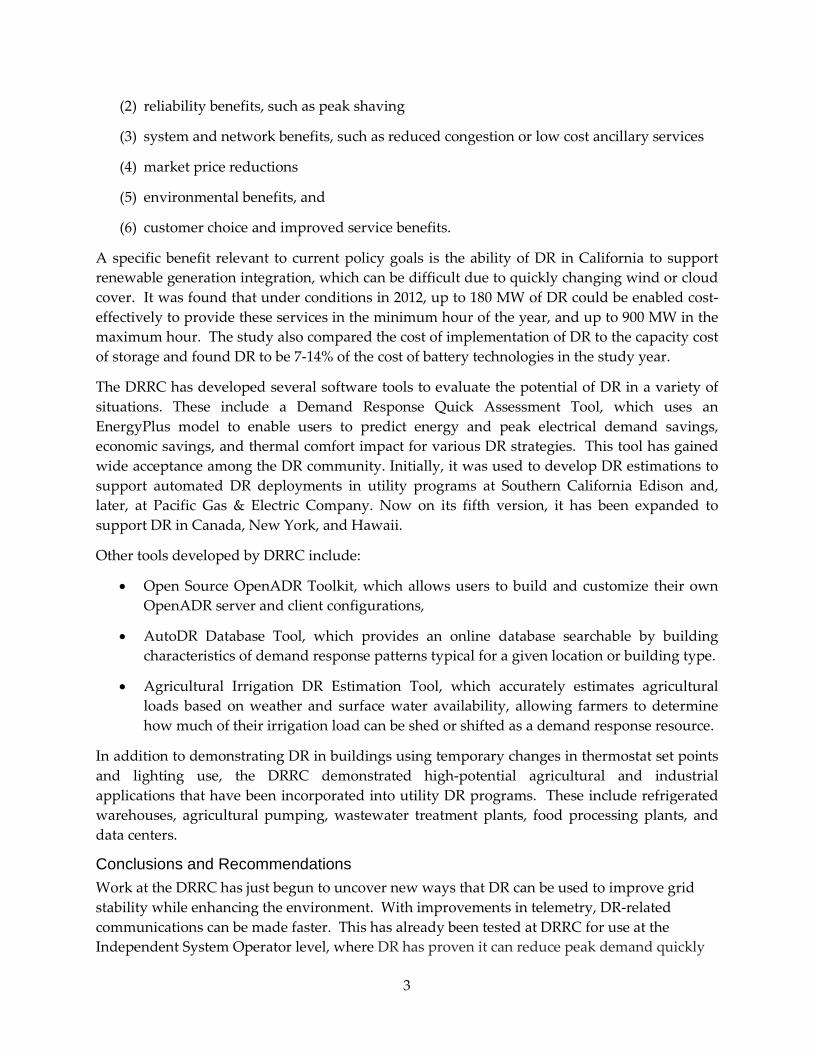
(2) reliability benefits, such as peak shaving
(3) system and network benefits, such as reduced congestion or low cost ancillary services
(4) market price reductions
(5) environmental benefits, and
(6) customer choice and improved service benefits.
A specific benefit relevant to current policy goals is the ability of DR in California to support renewable generation integration, which can be difficult due to quickly changing wind or cloud cover. It was found that under conditions in 2012, up to 180 MW of DR could be enabled cost-effectively to provide these services in the minimum hour of the year, and up to 900 MW in the maximum hour. The study also compared the cost of implementation of DR to the capacity cost of storage and found DR to be 7-14% of the cost of battery technologies in the study year.
The DRRC has developed several software tools to evaluate the potential of DR in a variety of situations. These include a Demand Response Quick Assessment Tool, which uses an EnergyPlus model to enable users to predict energy and peak electrical demand savings, economic savings, and thermal comfort impact for various DR strategies. This tool has gained wide acceptance among the DR community. Initially, it was used to develop DR estimations to support automated DR deployments in utility programs at Southern California Edison and, later, at Pacific Gas & Electric Company. Now on its fifth version, it has been expanded to support DR in Canada, New York, and Hawaii.
Other tools developed by DRRC include:
• Open Source OpenADR Toolkit, which allows users to build and customize their own OpenADR server and client configurations,
• AutoDR Database Tool, which provides an online database searchable by building characteristics of demand response patterns typical for a given location or building type.
• Agricultural Irrigation DR Estimation Tool, which accurately estimates agricultural loads based on weather and surface water availability, allowing farmers to determine how much of their irrigation load can be shed or shifted as a demand response resource.
In addition to demonstrating DR in buildings using temporary changes in thermostat set points and lighting use, the DRRC demonstrated high-potential agricultural and industrial applications that have been incorporated into utility DR programs. These include refrigerated warehouses, agricultural pumping, wastewater treatment plants, food processing plants, and data centers.
Conclusions and Recommendations Work at the DRRC has just begun to uncover new ways that DR can be used to improve grid stability while enhancing the environment. With improvements in telemetry, DR-related communications can be made faster. This has already been tested at DRRC for use at the Independent System Operator level, where DR has proven it can reduce peak demand quickly
4
and reliably. The reduction of short-term peak loads when DR events are called, typically on the order of 50 to 100 hours per year, reduces the need to build new peak generation plants. The DRRC believes fast DR also holds great promise for mitigating the instabilities inherent in renewable-energy sources such as solar and wind, where brief changes in sunlight or barometric pressure could otherwise translate to substantial power reductions.
Two-way grid communications also means that the marketplace itself is on the verge of transformation. DRRC’s research has already begun to explore what this may mean in the future, with studies of grid-scale batteries coordinated using DR and transactive networks, in which DR communications identify the grid signals by which building operations can be cooperatively modified to maintain occupant comfort while reducing energy use at peak times.
Our vision is to help create optimized, grid-aware, continuous energy management in buildings and other grid-connected elements with real-time interactions of loads and distributed energy resources that build on the capabilities developed over the past decade at DRRC. While traditional DR has concentrated on reducing peak loads in buildings, we envision a future where the load will be more dynamic, changing spatially and temporally, thereby requiring more dynamic participation of flexible resources using tools developed by DRRC.
5
CHAPTER 1: Introduction The purpose of this report is to highlight and document the research activities of the Demand Response Research Center from 2004 to 2015. The report is structured in such a way that the reader can quickly review each research area and then access the appendices to locate reports corresponding to each research area. All reports are available at drrc.lbl.gov as well as through direct links from the appendices.
About the Demand Response Research Center The Demand Response Research Center (or DRRC) is led by Lawrence Berkeley National Laboratory (LBNL). LBNL hosts the DRRC, guides DRRC development, and provides technical, operational and planning leadership. The DRRC director solicits stakeholder input and adopts research topics accordingly. Demand Response (DR) consists of changes in electric usage by end-use customers from their normal consumption patterns in response to changes in the price of electricity over time, or to incentive payments designed to induce lower electricity use at times of high wholesale market prices or when system reliability is jeopardized.
Work at the DRRC has uncovered new ways that DR can be used to improve grid stability while enhancing the environment. With improvements in telemetry, DR-related communications can be made faster. This has already been tested at DRRC for use at the Independent System Operator (ISO) level, where DR has proven it can reduce peak demand quickly and reliably. So-called ‘peaker plants’ are among the dirtiest sources of electric power, and are often located near already disadvantaged communities. The reduction of short-term peak loads when DR events are called (typically on the order of 50 to 100 hours per year) defers the need to build new peak generation plants. The DRRC believes fast DR also holds great promise for mitigating the instabilities inherent in renewable-energy sources such as solar and wind, where brief changes in sunlight or barometric pressure could otherwise translate to substantial power reductions.
Two-way grid communications also means that the marketplace itself is on the verge of transformation. DRRC’s research has already begun to explore what this may mean in the future, with studies of grid-scale batteries coordinated using DR and transactive networks, in which DR communications identify the grid signals by which building operations can be cooperatively modified to maintain occupant comfort while reducing energy use at peak times.
Our vision has been to help create optimized, grid-aware, continuous energy management in buildings and other grid-connected elements with real-time interactions of loads and distributed energy resources that build on the capabilities developed over the past decade at DRRC. While traditional DR has concentrated on reducing peak loads in buildings, we envision a future where the load will be more dynamic, changing spatially and temporally, thereby requiring more dynamic participation of flexible resources using tools developed by DRRC.
6
Objectives And Scope The main objective of the Center is to develop, prioritize, conduct, and disseminate multi-institutional research that develops broad knowledge to facilitate DR. The Center's research agenda is crosscutting, practical, and relevant, with a goal of fostering an understanding of the complex factors that influence "what works." The Center research agenda covers three major DR research categories:
• Energy Systems Integration, Communications, and Grid Integration • Residential and Commercial Buildings • Industrial, Agricultural and Water
Methods The Center focuses on the following activities:
• Multi-institutional partnerships • Connections with stakeholders • Long-term attention to DR • Research, development, demonstrations, and technology transfer
Stakeholders and Market Connections A major element of the Center is the strong market connection developed for each and every project. A concerted effort is made to involve a variety of stakeholders in Center planning and on research teams. The Center's stakeholders include: industry trade associations, researchers, building owners, engineers, and operators, and building equipment manufacturers. In addition to the broad-based involvement of stakeholders as described above, market connection strategies includes:
• An extensive website • Research reviews and evaluation summaries • Project brochures and papers summarizing research results for multiple audiences • Educational material for utility, building associations, and related organizations
Demand Response Demonstration at LBNL At the Lawrence Berkeley National Laboratory (Berkeley Lab) Guest House, visitors who have business with Berkeley Lab can get a comfortable night’s sleep—while experiencing a living example of some of the laboratory’s scientific research. The Guest House features the Demand to Grid (D2G) Lab, where appliances are controlled using DR signals and Web-based energy-visualization tools to provide information to guests on energy choices available during DR events. For example, a heat pump water heater (on extended loan from General Electric) in the Guest House’s laundry area is part of the demonstration. It has two modes of heating—resistive heating (where a heating coil heats the water) for everyday operation, and a heat exchanger
7
used during a DR event. The heater uses 4,500 watts of electricity during standard electric mode, powering down to 550 watts using the heat exchanger during DR events.
The Guest House also features an electric vehicle charger by Coulomb Technologies, which will switch to a reduced charging rate during a DR event. Before and during the DR event, a message is displayed on the charger’s screen to let consumers know what is happening and if they have to take any action. Additional Guest House appliances that can communicate and switch to low-power operations in response to DR signals include a staff refrigerator, a washer and dryer available for guest use (also on loan from GE), programmable communicating thermostats, smart plugs, and dimmable LED lighting fixtures.
8
CHAPTER 2: Integrated Energy Technologies and Systems For DR to become ubiquitous there must be clear communication between energy-supply providers and customer loads. The DRRC led the development of a nonproprietary, open standardized communications specification to automate DR. Open Automated Demand Response, or OpenADR, facilitates the reliable, cost-effective automation of electricity price and grid-reliability signals to enable DR. It allows electricity providers to communicate DR signals directly to existing customers using a common language and existing communications such as the Internet. OpenADR, now a national standard and on its way in becoming an international standard, reduces technology costs and allows companies across the United States, and likely globally, to embed the common communication system in their control software at minimal cost—letting consumers use less-expensive power, which provides benefits to consumers, utilities, system operators, and the society.
OpenADR and the OpenADR Alliance The development of the Open Automated Demand Response, also known as OpenADR,, began in 2002 following the California electricity crisis. In California, the United States, and abroad, many utilities, governments, electric independent systems operators and others have been pursuing demand response to manage the growing demand for electricity and peak capacity of the electric systems. Demand response (DR) has been defined as “…action taken to reduce electricity demand in response to price, monetary incentives, or utility directives so as to maintain reliable electric service or avoid high electricity prices2."OpenADR is one element of the Smart Grid information and communications technologies being developed to improve matching between electric supply and demand.
2 U.S. Federal Energy Regulatory Commission (FERC), 2007 Assessment of Demand Response and Advanced Metering, Staff Report, available: http://www.ferc.gov/legal/staff-reports/09-07-demand-response.pdf
9
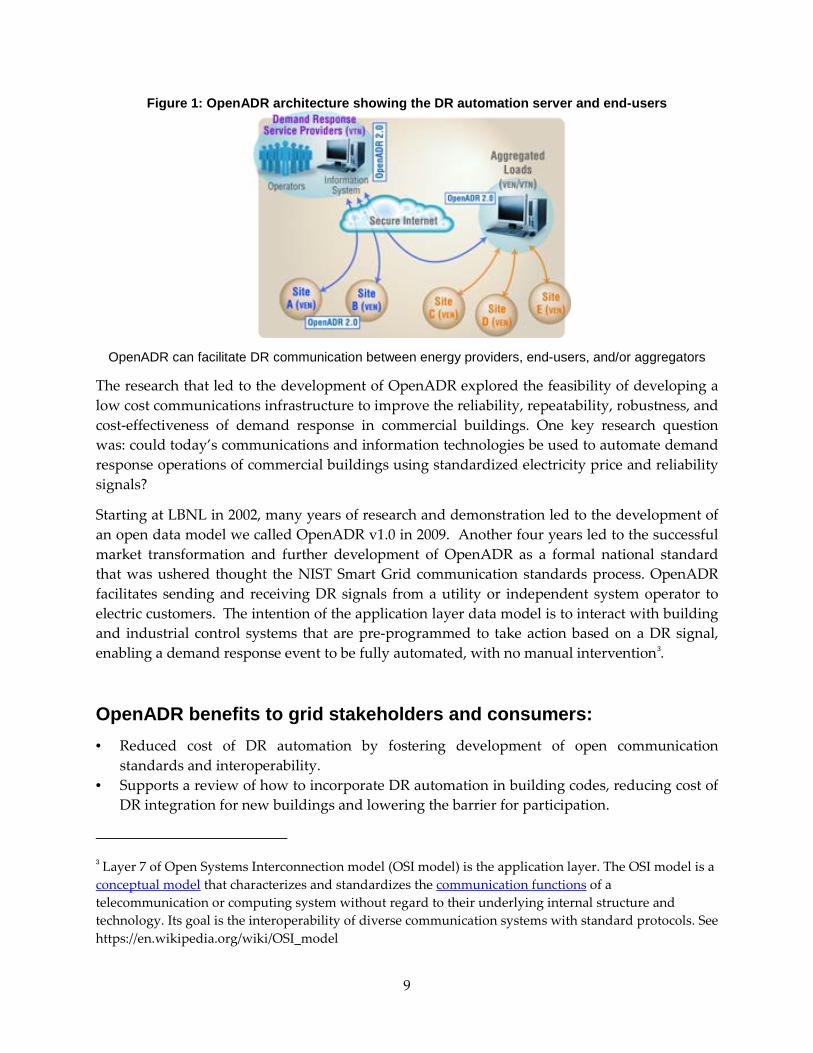
Figure 1: OpenADR architecture showing the DR automation server and end-users
OpenADR can facilitate DR communication between energy providers, end-users, and/or aggregators
The research that led to the development of OpenADR explored the feasibility of developing a low cost communications infrastructure to improve the reliability, repeatability, robustness, and cost-effectiveness of demand response in commercial buildings. One key research question was: could today’s communications and information technologies be used to automate demand response operations of commercial buildings using standardized electricity price and reliability signals?
Starting at LBNL in 2002, many years of research and demonstration led to the development of an open data model we called OpenADR v1.0 in 2009. Another four years led to the successful market transformation and further development of OpenADR as a formal national standard that was ushered thought the NIST Smart Grid communication standards process. OpenADR facilitates sending and receiving DR signals from a utility or independent system operator to electric customers. The intention of the application layer data model is to interact with building and industrial control systems that are pre-programmed to take action based on a DR signal, enabling a demand response event to be fully automated, with no manual intervention3.
OpenADR benefits to grid stakeholders and consumers: • Reduced cost of DR automation by fostering development of open communication
standards and interoperability. • Supports a review of how to incorporate DR automation in building codes, reducing cost of
DR integration for new buildings and lowering the barrier for participation.
3 Layer 7 of Open Systems Interconnection model (OSI model) is the application layer. The OSI model is a conceptual model that characterizes and standardizes the communication functions of a telecommunication or computing system without regard to their underlying internal structure and technology. Its goal is the interoperability of diverse communication systems with standard protocols. See https://en.wikipedia.org/wiki/OSI_model
• Improved ability of end-use loads with automated controls to participate in DR programs. • Enhanced persistence and speed of DR allowing it to be used in a broad set of grid services. • Capability to enable DR to be integrated in utility and customer operation systems.
In 2006, California Public Utilities Commission Assigned Commissioner’s Ruling mandated that all the investor-owned utilities (IOU) in California provide automated DR programs using OpenADR. Since 2007, California IOUs have successfully deployed OpenADR in their AutoDR programs. Currently, OpenADR is one of the most successful smart grid communications standard, used in all major end uses and most widely deployed. In 2013, over 1300 facilities with combined automated DR capacity of about 250 MW used OpenADR. Use of the standard is projected to grow at a robust compound annual growth rate of over 92% between 2012 and 2018, at which point it will be part of automated demand response (AutoDR) programs in over 79,500 building sites globally4. An industry alliance, OpenADR Alliance, was formed in 2010. It has over 130 members including all major control companies. OpenADR is used in over ten states and ten countries around the world.
The DRRC’s OpenADR research has had many impacts on California’s codes and standards. The DR control strategy for commercial buildings known as “global set point adjustment”, where the zone temperatures in a facility are adjusted from a central location, was a direct output of the OpenADR development effort and was adopted in Title 24 in 2008. The 2013 Title24 code requires that commercial building HVAC and lighting systems must be capable of receiving and responding to a standards-based messaging system.
OpenADR, and the automated DR it supports, was originally developed to facilitate price response and day-of DR programs. The use of OpenADR with incentive-based programs led to the expansion of research in studying customer electric baselines and load forecasts. The automation facilitates a variety of timescales of interactions with the electricity grid and various markets.
In 2009 the DRRC began evaluating how to use loads to mitigate intermittency of renewables on the electricity grid. The DRRC has demonstrated that the automation is a significant element of fast response expected in the wholesale markets. Around the same time, the DRRC also started demonstrating the concepts, DR strategies, automation, and OpenADR integration outside California. The first tests were conducted in Seattle with Bonneville Power Administration and Seattle City Light and demonstrated that buildings peaking in both summer and winter can use the same infrastructure and complementary strategies. Similar capabilities were also demonstrated in New York City with funding from New York State Energy Research and Development Authority.
With the mandatory AutoDR requirements in the 2013 California Title 24 Building Standards, which became effective in 2014, open standards are key requirements in enabling native 4http://www.navigantresearch.com/research/openadr
capabilities of HVAC systems, lighting controls, etc. This is the key step in the deployments of “AutoDR-ready” controls with minimal to no local customization to participate in utility/ISO programs. In the recent developments the IOUs have also been requiring controls vendor and third-party service providers to support integration with OpenADR signals, thus moving toward ubiquitous deployments and integration of energy systems to provide DR services.
Over the last decade, the DRRC led and participated in numerous outreach and training sessions with all the investor-owned utilities in California. These sessions were designed for customers, vendors and utility account representatives with the goal of educating the public on how DR programs work and how they can participate in an automated fashion.
Related Publications (See Appendix A for abstracts):
E. Koch and M. A. Piette 2009 Direct versus Facility Centric Load Control for Automated Demand Response
LBNL-2905E
S. Kiliccote, M. A. Piette, G. Ghatikar, E. Koch, D. Hennage, J. Hernandez, A. K. Chiu, O. Sezgen and J. Goodin
2009 Open Automated Demand Response Communications in Demand Response for Wholesale Ancillary Services
LBNL-2945E
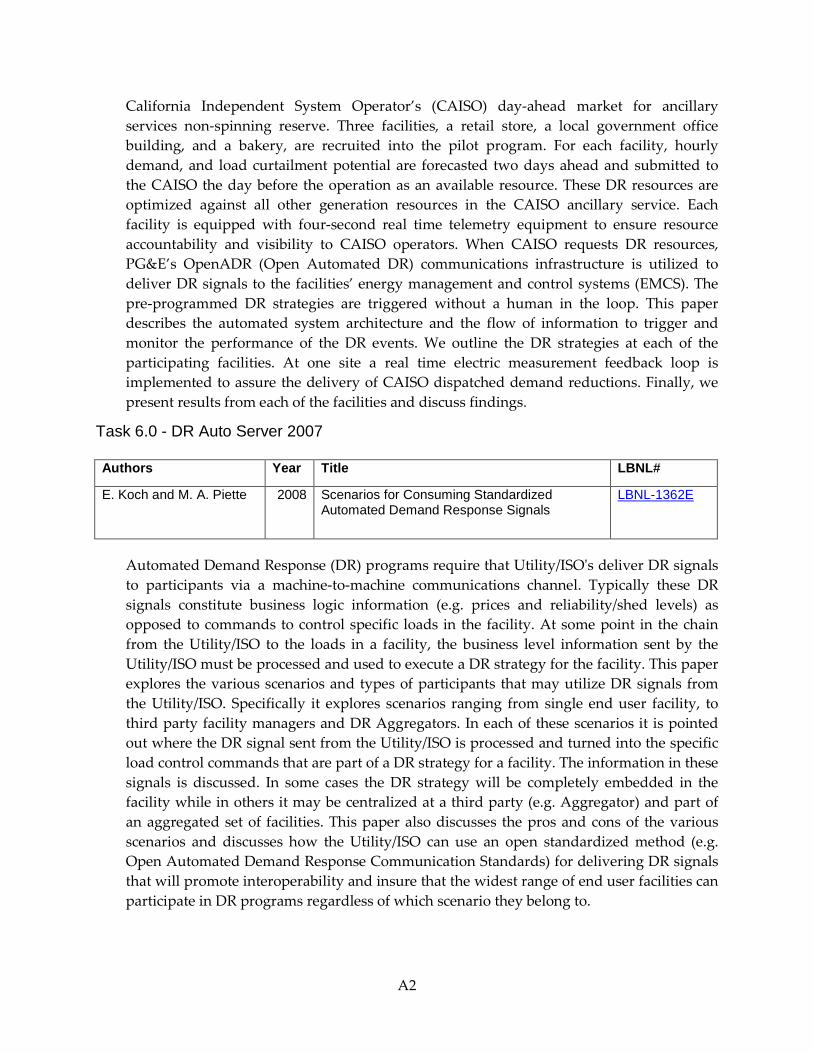
E. Koch and M. A. Piette 2008 Scenarios for Consuming Standardized Automated Demand Response Signals
LBNL-1362E
M. A. Piette, G. Ghatikar, S. Kiliccote, D. S. Watson, E. Koch and D. Hennage
2009 Design and Operation of an Open, Interoperable Automated Demand Response Infrastructure for Commercial Buildings
LBNL-2340E
K. Herter, J. Rasin and T. Perry
2009 Development and Demonstration of the Open Automated Demand Response Standard for the Residential Sector
LBNL-6531E
C. McParland 2011 OpenADR Open Source Toolkit: Developing Open Source Software for the Smart Grid
LBNL-5064E
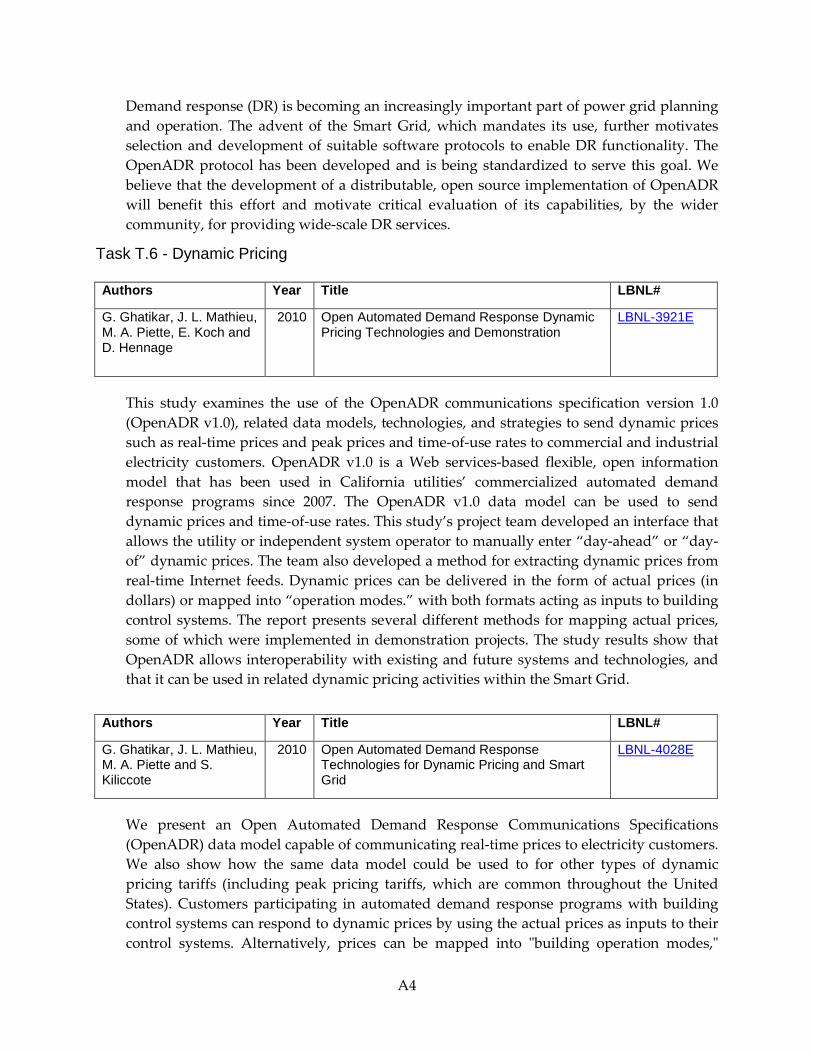
G. Ghatikar, J. L. Mathieu, M. A. Piette, E. Koch and D. Hennage
2010 Open Automated Demand Response Dynamic Pricing Technologies and Demonstration
LBNL-3921E
G. Ghatikar, J. L. Mathieu, M. A. Piette and S. Kiliccote
2010 Open Automated Demand Response Technologies for Dynamic Pricing and Smart Grid
LBNL-4028E
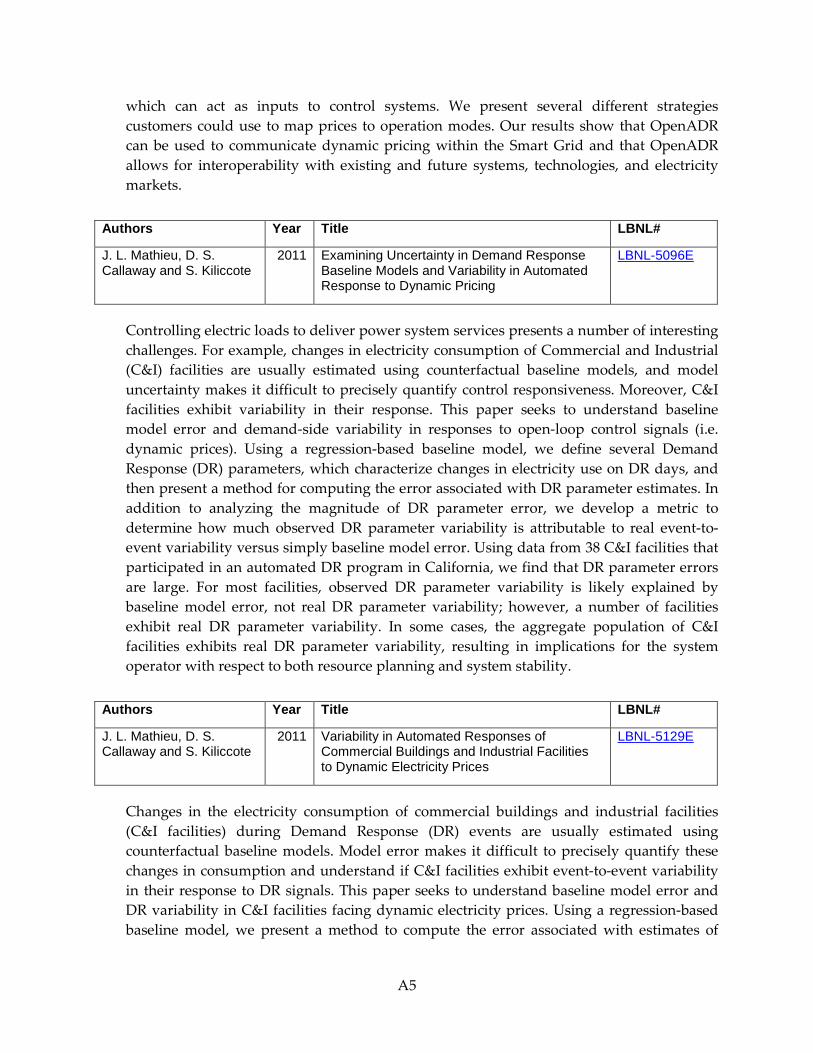
J. L. Mathieu, D. S. Callaway and S. Kiliccote
2011 Examining Uncertainty in Demand Response Baseline Models and Variability in Automated Response to Dynamic Pricing
LBNL-5096E
J. L. Mathieu, D. S. Callaway and S. Kiliccote
2011 Variability in Automated Responses of Commercial Buildings and Industrial Facilities to Dynamic Electricity Prices
Open Smart Energy Gateway With the widespread deployment of electronic interval meters, commonly known as smart meters, came the promise of access to real time data on electric energy consumption. This includes an opportunity for consumers to gain access to their near real-time energy consumption data directly from their installed smart meter. However, concerns about widespread consumer access to a network on which utility revenue data was available created security concerns. DRRC researchers designed a mechanism, the open smart energy gateway (OpenSEG), for securely capturing real time energy and power data in real time for consumer use.
OpenSEG is an open source data management platform designed to enable better data management of smart meter data. It is designed to work with Zigbee Smart Energy Profile 1.x (SEP 1.x) to provide consumers with access to the most recent 48 hours of consumption data. Data is stored locally in a circular cache that can be readily accessed by the consumer. Included with OpenSEG is an application program interface by which users can write code to acquire data from OpenSEG for further post processing or display on commonly owned display devices (e.g. smart phones or computers). A sample data display application is included with each release of the initial software product. This system can be used for homes, multi-family buildings or small commercial buildings in California. In additions, the architecture provides a secondary benefit by providing a clearly defined boundary for equipment and data ownership.
Key results and conclusions:
• OpenSEG provides real time secure access to consumption data for consumers and provide the single point of contact between consumer owned devices and the utility network. This secure link ensures that consumer owned devices get timely usage data while the network from which the data is sourced is not compromised.
• OpenSEG type systems have been developed by a private company (Rainforest Automation) using the OpenSEG specifications to develop a marketable product (EAGLEtm)
• Parties interested in near real time data can acquire it directly via OpenSEG. • Home Area Network designations of devices that can join their network have effectively
been pared back, reducing additional work by the utilities to qualify devices • Consumers can make real time changes to electric energy consumption and directly see the
results of their efforts. • Consumers can also work directly with third parties to identify innovative ways to use real
time data to enhance their stewardship of energy resources.
14
Related Publications (See Appendix B for abstracts):
J. Searle and C. McParland 2012 HAN Attack Surface and the Open Smart Energy Gateway Project
LBNL-6013E
J. Page, C. McParland, M.A. Piette and S. Czarnecki
2015 Design of an Open Smart Energy Gateway for Smart Meter Data Management
Anytime DR and DR Potential Studies During the prior decade DR research and development in California concentrated on reducing electrical peaks and flattening the loads for the top 50 to 100 hours of peak demand per year. In early 2010, the adoption and deployment of renewable portfolio standards in 29 U.S. states made it clear that flexible demand-side resources are needed year-round—that is, “any time”—to address four major challenges related to renewable-generation penetration in California:
1) over-generation during low-load hours
2) steep and unpredictable ramps
3) forecast errors associated with renewable generation
4) intra-hour variability of renewable resources
Deploying “any time” DR requires a framework for characterizing the attributes services DR resources can provide to the electricity grid. These attributes include: response frequency (how often a resource can respond to a load-curtailment signal), response duration (how long a resource can remain curtailed), response time (how long it takes a resource to respond to a curtailment signal), energy pre- or re-charge (whether and when energy storage must be charged to enable a resource to respond), the cost of enabling a resource to respond (e.g., investment and set-up costs such as equipment purchase and installation, shed strategy development, programming and commissioning), and load magnitude (how much load is available to be curtailed in a given DR resource).
In 2012 the DRRC completed a study to estimate the potential of any time DR and to help evaluate how DR might be similar to services provided by grid scale batteries. The DRRC then partnered with other national laboratories to quantify the value of DR in 2020. The DRRC developed a methodology and underlying software infrastructure to develop DR availability profiles. With Lawrence Livermore National Laboratory, the DRRC explored the value of DR in California in the year 2020 by providing the 8784 hourly availability from 13 end uses in California. With National Renewable Energy Laboratory and Oakridge National Laboratory, the DRRC extended the methodology developed in California to quantify the value of DR in 2020 in the entire Western Interconnect. Finally, the CPUC asked the DRRC to quantify hourly DR availability in the regions affected by the San Onofre Nuclear Generation Station shut down.
16
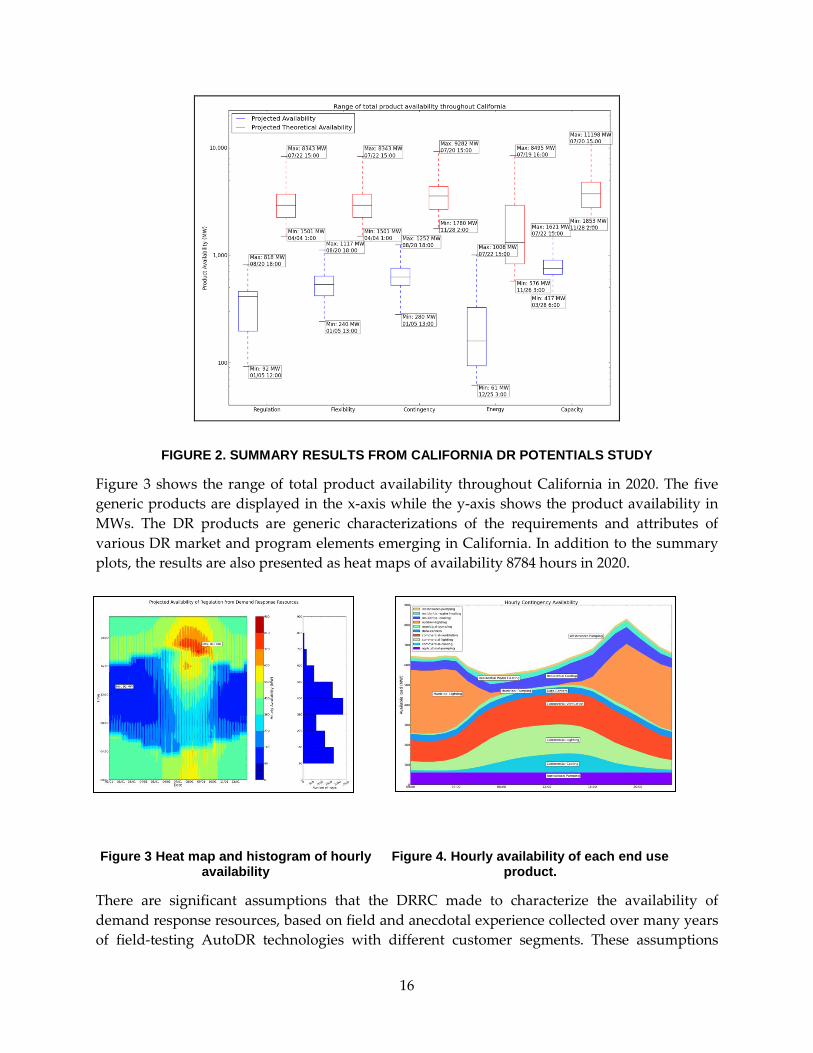
FIGURE 2. SUMMARY RESULTS FROM CALIFORNIA DR POTENTIALS STUDY
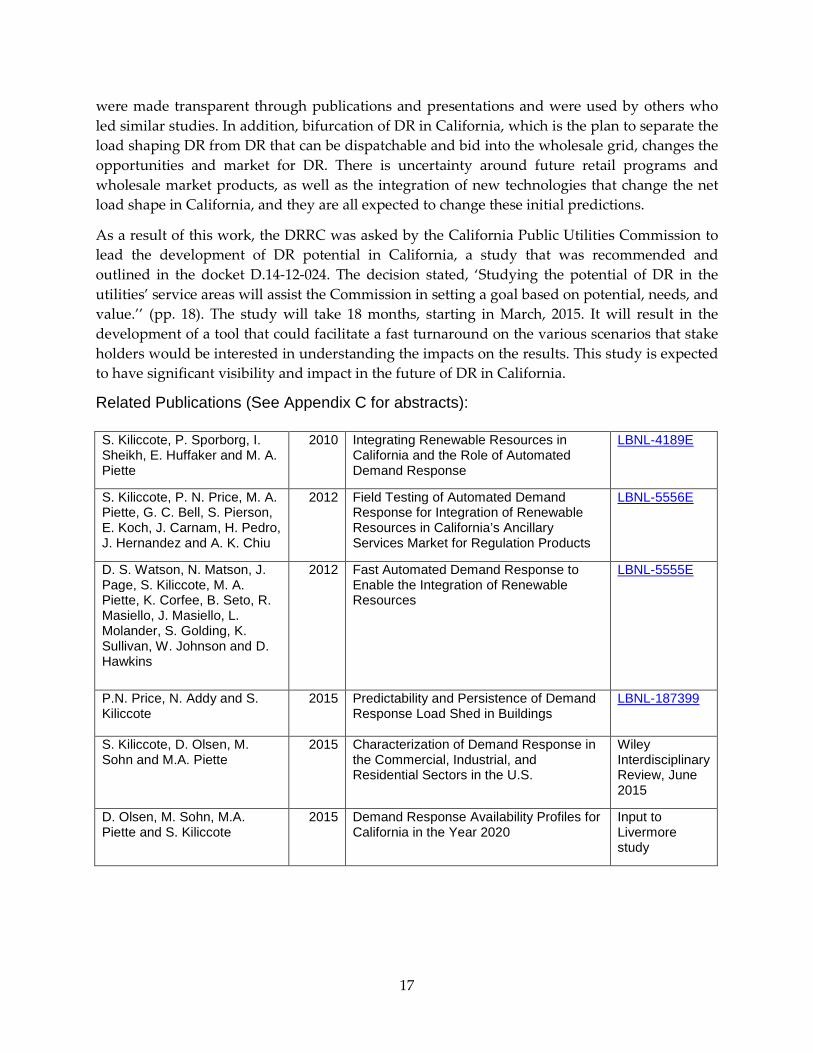
Figure 3 shows the range of total product availability throughout California in 2020. The five generic products are displayed in the x-axis while the y-axis shows the product availability in MWs. The DR products are generic characterizations of the requirements and attributes of various DR market and program elements emerging in California. In addition to the summary plots, the results are also presented as heat maps of availability 8784 hours in 2020.
Figure 3 Heat map and histogram of hourly availability
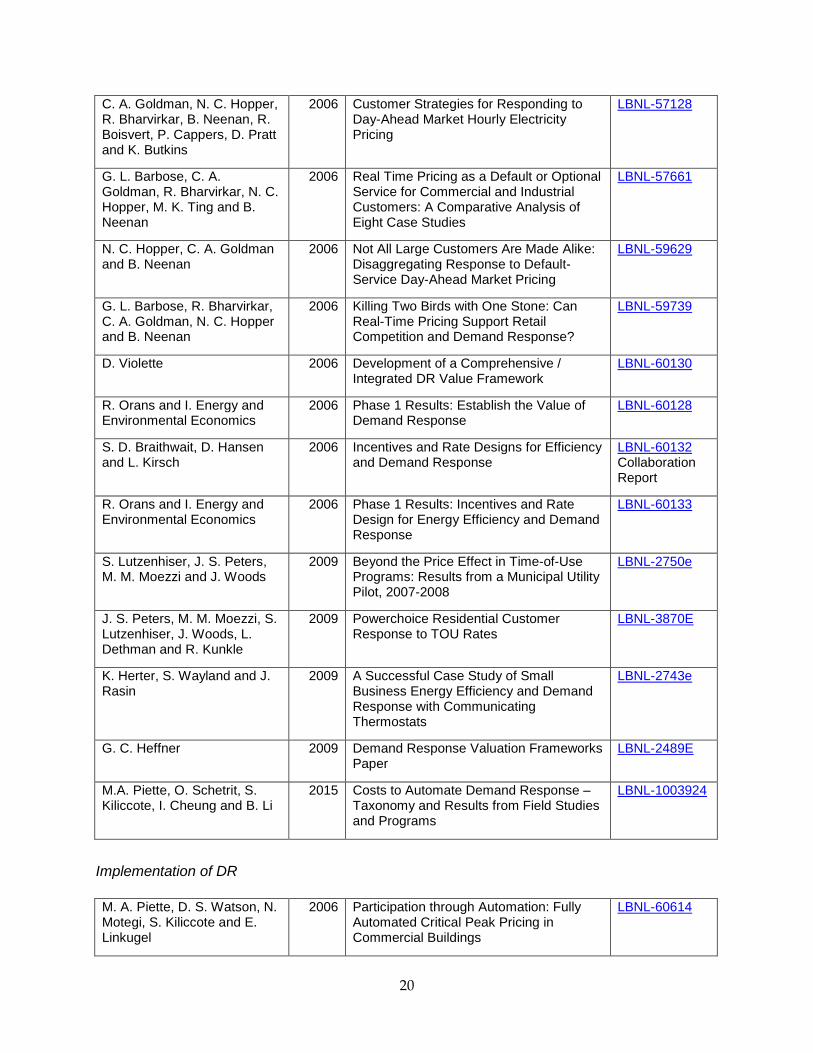
Figure 4. Hourly availability of each end use product.
There are significant assumptions that the DRRC made to characterize the availability of demand response resources, based on field and anecdotal experience collected over many years of field-testing AutoDR technologies with different customer segments. These assumptions
17
were made transparent through publications and presentations and were used by others who led similar studies. In addition, bifurcation of DR in California, which is the plan to separate the load shaping DR from DR that can be dispatchable and bid into the wholesale grid, changes the opportunities and market for DR. There is uncertainty around future retail programs and wholesale market products, as well as the integration of new technologies that change the net load shape in California, and they are all expected to change these initial predictions.
As a result of this work, the DRRC was asked by the California Public Utilities Commission to lead the development of DR potential in California, a study that was recommended and outlined in the docket D.14-12-024. The decision stated, ‘Studying the potential of DR in the utilities’ service areas will assist the Commission in setting a goal based on potential, needs, and value.’’ (pp. 18). The study will take 18 months, starting in March, 2015. It will result in the development of a tool that could facilitate a fast turnaround on the various scenarios that stake holders would be interested in understanding the impacts on the results. This study is expected to have significant visibility and impact in the future of DR in California.
Related Publications (See Appendix C for abstracts):
S. Kiliccote, P. Sporborg, I. Sheikh, E. Huffaker and M. A. Piette
2010 Integrating Renewable Resources in California and the Role of Automated Demand Response
LBNL-4189E
S. Kiliccote, P. N. Price, M. A. Piette, G. C. Bell, S. Pierson, E. Koch, J. Carnam, H. Pedro, J. Hernandez and A. K. Chiu
2012 Field Testing of Automated Demand Response for Integration of Renewable Resources in California’s Ancillary Services Market for Regulation Products
LBNL-5556E
D. S. Watson, N. Matson, J. Page, S. Kiliccote, M. A. Piette, K. Corfee, B. Seto, R. Masiello, J. Masiello, L. Molander, S. Golding, K. Sullivan, W. Johnson and D. Hawkins
2012 Fast Automated Demand Response to Enable the Integration of Renewable Resources
LBNL-5555E
P.N. Price, N. Addy and S. Kiliccote
2015 Predictability and Persistence of Demand Response Load Shed in Buildings
LBNL-187399
S. Kiliccote, D. Olsen, M. Sohn and M.A. Piette
2015 Characterization of Demand Response in the Commercial, Industrial, and Residential Sectors in the U.S.
Wiley Interdisciplinary Review, June 2015
D. Olsen, M. Sohn, M.A. Piette and S. Kiliccote
2015 Demand Response Availability Profiles for California in the Year 2020
DR Value and Programs, Implementation of DR Over the course of the DRRC’s history, we have contributed significantly in identifying the evolving set of values that demand response provides ratepayers, program participants and the electricity system. Our work has evaluated demand response valuation frameworks, identified new value that DR could provide, quantified revenue potential where possible, evaluated utility DR programs, and directly recruited DR resources for pilots and for capacity resource constrained areas. Beyond solely identifying and capturing the values of DR through research, the DRRC has also engaged in the standard setting process to help significantly reduce the incremental cost of enabling load to be a DR resource in the future. All of these activities have helped define the value of DR and associated programs and led to further implementation of DR in CA.
In order to understand the value of DR, we must understand the value of DR to various stakeholders. These stakeholders include commodity providers, system and market operators, transmission and distribution companies, energy consumers, regulators, policy makers, and society as a whole. To unlock the value of DR for any one group, we need to simultaneously create value for all others. For example, market operators may see considerable efficiency gains by engaging DR in their markets, but that will not happen without enough value for the end-user, the commodity providers, and with proactive rulings supported by regulators and policy makers. It is important to consider each prospective when analyzing the achievable values that DR can provide.
The DRRC’s work evaluating demand response valuation frameworks found that the majority of them failed to capture a large fraction of the potential value of DR.. The study found that DR valuation assessments tended to focus on capacity, and a narrow view of the value to a utility, which results in a lack of proper valuation of DR. The work suggests that there are six categories of benefits that DR creates:
1. direct financial benefits, such as bill savings
2. reliability benefits, such as peak shaving
3. system and network benefits, such as reduced congestion or low cost ancillary services
4. market price reductions
5. environmental benefits
6. customer choice and improved service benefits.
All of these need to be accounted for, as well as to whom the benefit is allocated, in order to adequately assess the overall value and benefits associated with DR deployment and properly identify incentives to achieve it.
One specific benefit that was examined in detail is the ability of DR in California to support renewable generation integration. A study examining DR potential for fast load following reserve for renewable integration was conducted. This study focused on the ability of DR to
19
provide services year round at any time during the day. It was found that under conditions in 2012, up to 180 MW of DR could be enabled cost-effectively to provide these services in the minimum hour of the year, and up to 900 MW in the maximum hour. The study also compared the cost of enablement of DR to the capacity cost of storage and found DR to be 7-14% of the cost of battery technologies in the study year. This study highlighted an important result that DR could provide significant renewable energy integration services at a fraction of the cost of battery storage technologies.
The DRRC has also played a role in quantifying both the potential resource size of DR to provide multiple grid services in California, as well as the incentives available in the wholesale market for some services to extract. Demand response resource capacity for California and the rest of the Western Electricity Coordinating Council (WECC) was calculated to develop full year time series of DR availability that can be integrated into production cost models to support system planning as well as quantify the impacts of DR on the wholesale market. Hourly estimates were developed for energy, emergency capacity, and ancillary services provisioned by demand response, and when co-optimized in the test electricity model, where 113 MW of DR resources were able to save the system $7.9 million over the base case without DR, which was near the range of value that might be expected from the cost of carrying capacity of a combustion turbine. Other DRRC studies have analyzed the value of ancillary services from historical data, considered to be one of the high valued DR services, to evaluate whether the incentives were adequate. The WECC study found that while the value of providing ancillary services to wholesale markets was greater than traditional DR programs, the markets appeared thin and the large costs of entering the markets and the stringent participation rules may prevent demand response service providers from entering such markets. Further, the WECC research suggested the importance of capturing additional value from other programs to make the investments more viable.
Related Publications (See Appendix D for abstracts):
DR Value and Programs
C. A. Goldman, N. C. Hopper, O. Sezgen, M. M. Moezzi, R. Bharvirkar, B. Neenan, R. Boisvert, P. Cappers and D. Pratt
2004 Customer Response to Day-ahead Wholesale Market Electricity Prices: Case Study of RTP Program Experience in New York
LBNL-54761
C. A. Goldman, N. C. Hopper, O. Sezgen, M. M. Moezzi, R. Bharvirkar, B. Neenan, D. Pratt, P. Cappers and R. Boisvert
2004 Does Real-Time Pricing Deliver Demand Response? A Case Study of Niagara Mohawk's Large Customer RTP Tariff
LBNL-54974
M. M. Moezzi, C. A. Goldman, O. Sezgen, R. Bharvirkar and N. C. Hopper
2004 Real Time Pricing and the Real Live Firm LBNL-54978
CHAPTER 3: Buildings DR Strategies and Tools The Demand Response Research Center (DRRC) provided extensive research and expertise in finding better ways for buildings and industrial loads to respond to grid conditions and to measure load reductions, including more accurate baseline models. The DRRC also researched statewide policy initiatives and provided guidance and direction on future policy considerations in California. These research efforts resulted in the development of guides and tools needed to better understand energy use patterns within buildings and form a foundation from which intelligent load management strategies can be employed. These tools include:
Building owners can save energy and money by participating in DR programs. The DRRC’s work to identify, evaluate, and document a variety of possible end-use load-control strategies to modify electric load shapes in commercial and residential buildings is widely used throughout the country. Initial DRRC work concentrated on developing cooling control strategies for peak load reduction in commercial buildings on hot summer afternoons. More recently, DRRC research has grown to include new customer segments, with more flexible loads to explore DR options with varying response times and durations that can be dynamically controlled any time of day. The DRRC’s research on residential energy use explored how the introduction of advanced meters can support DR when needed through dynamic pricing pilots and home automation capable of responding according to different control signals.
The DRRC’s Demand Response Quick Assessment Tool (DRQAT) has gained wide acceptance among the DR community. It uses an EnergyPlus model to enable users to predict energy and peak electrical demand savings, economic savings, and thermal comfort impact for various DR strategies. Initially, DRQAT was used to develop DR estimations to support automated DR deployments in utility programs at Southern California Edison and, later, at Pacific Gas & Electric Company. Now on its fifth version, it has been expanded to support DR in Canada, New York, and Hawaii. Recently, the DRRC developed a thermal-energy storage system model to evaluate the effect of DR control strategies in buildings with thermal storage systems. The Federal Energy Regulatory Commission’s National Action Plan recognizes DRQAT as a tool that customers, states, utilities, and DR providers can use to identify DR strategies. DRQAT-RW (discussed in the Industrial, Agricultural and Water [IAW] section of the DRRC benefits assessment) is an extension of DRQAT into the refrigerated warehouses sector.
23
Increasingly, buildings are supplementing their traditional electric supply with behind-the-meter distributed-energy resources such as rooftop solar photovoltaic systems. These can lead to intermittent strains on the grid from short-term over-generation, and load forecast errors that can cause steep ramping demands in standby generation. The DRRC is examining how short-term changes in building operations with DR can mitigate the inherent intra-hour variability in those resources before they cause grid-scale problems. The DRRC is also exploring ways to use OpenADR to coordinate building loads with local distribution systems to help solve some of the capacity and reliability issues. The Open Source OpenADR Toolkit allows users to build and customize their OpenADR server and client configurations. The AutoDR Database Tool (ADRD), developed by DRRC, provides an online database, searchable by building characteristics, of demand response patterns typical for a given location or building type, and analysis tools that can be used to characterize the building load in terms of overall variability by hour and weather sensitivity, as well as analysis of any curtailment efforts made during a called demand response event. The Agricultural Irrigation DR Estimation Tool (discussed in the IAW section of the DRRC benefits assessment) accurately estimates agricultural loads based on weather and surface water availability, allowing farmers to determine how much of their irrigation load can be shed or shifted as a demand response resource.
Demand response can play a role in transitioning electric markets as well. The recent unexpected shutdown of San Onofre Nuclear Generating Station at the same time as the expected retirement of once-through cooling generation units created grid capacity issues in Southern California that are expected to increase when extended hot weather events returns to the region. The DRRC is studying how DR can mitigate the capacity issues without requiring extensive construction of replacement generation.
When DR analysis is conducted for a large number of buildings, decision makers need reliable tools to help coordinate and prioritize their investments. The DRRC worked actively with:
• Various U.S. Navy facilities, where the DRRC analyzed the performance of more than 20 buildings enabled with two-stage DR strategies, and built on this experience to develop and apply prioritization methodologies to more than 200 buildings to help the Navy select the next 50 high-priority sites;
• Santa Rita Jail, in Dublin, CA, where the DRRC extended the previously developed Distributed Energy Resources Customer Adoption Model (DER-CAM) to incorporate DR decisions and various utility tariffs. This enabled the site to effectively coordinate among various distributed assets while capturing additional value from DR participation and finding a more cost-effective tariff; and
• The California Lighting Technology Center (CLTC), to facilitate the adoption of automated DR by lighting-controls companies and expand the use of OpenADR to reduce the cost of DR enablement.
The analysis of statewide policy initiatives along with assessment tools for building energy management strategies provides valuable input to policymakers, regulators, business owners, energy management companies, and ratepayers in California.
24
Related Publications (See Appendix E for abstracts):
N. Motegi, M. A. Piette, D. S. Watson and O. Sezgen
2004 Measurement and Evaluation Techniques for Automated Demand Response Demonstration
LBNL-55086
D. S. Watson, M. A. Piette, O. Sezgen and N. Motegi
2004 Machine to Machine (M2M) Technology in Demand Responsive Commercial Buildings
LBNL-55087
C. Shockman, M. A. Piette and L. t. Hope
2004 Market Transformation Lessons Learned from an Automated Demand Response Test in Summer and Fall of 2003
LBNL-55110
M. A. Piette, O. Sezgen, D. S. Watson, N. Motegi, C. Shockman and L. t. Hope
2005 Development and Evaluation of Fully Automated Demand Response in Large Facilities
LBNL-55085
M. A. Piette, D. S. Watson, N. Motegi and N. Bourassa
2005 Automated Demand Response and Commissioning
LBNL-57384
M. A. Piette, D. S. Watson, N. Motegi and N. Bourassa
2005 Findings from the 2004 Fully Automated Demand Response Tests in Large Facilities
LBNL-58178
S. Kiliccote and M. A. Piette 2005 Advanced Control Technologies and Strategies Linking Demand Response and Energy Efficiency
LBNL-58179
S. Kiliccote, M. A. Piette and D. Hansen
2006 Advanced Controls and Communications for Demand Response and Energy Efficiency in Commercial Buildings
LBNL-59337
M. A. Piette, D. S. Watson, N. Motegi, S. Kiliccote and P. Xu
2006 Automated Critical Peak Pricing Field Tests: Program Description and Results
LBNL-59351
T. Hotchi, A. T. Hodgson and W. J. Fisk
2006 Indoor Air Quality Impacts of a Peak Load Shedding Strategy for a Large Retail Building
LBNL-59293
M. A. Piette, D. S. Watson, N. Motegi, S. Kiliccote and E. Linkugel
2006 Automated Demand Response Strategies and Commissioning Commercial Building Controls
LBNL-61013
F. M. Rubinstein and S. Kiliccote
2007 Demand Responsive Lighting: A Scoping Study
LBNL-62226
F. M. Rubinstein, D. Bolotov, M. S. Levi, K. Powell and P. Schwartz
2008 The Advantage of Highly Controlled Lighting for Offices and Commercial Buildings
LBNL-2514E
I. S. Walker and A. K. Meier 2008 Residential Thermostats: Comfort Controls in California Homes
2010 Using Dimmable Lighting for Regulation Capacity and Non-Spinning Reserves in the Ancillary Services Market. A Feasibility Study
LBNL-4190E
C. C. Federspiel 2007 Wireless Demand Response Controls for HVAC Systems
LBNL-2512E
C.-K. Woo and K. Herter 2006 Residential demand response evaluation scoping study
LBNL-61090
B. Nordman 2008 Networks in Buildings: Which Path Forward?
LBNL-2511E
C. McParland 2008 Home Network Technologies and Automating Demand Response
LBNL-3093E
C. McParland 2009 The Evolution of the Internet Community and the "Yet-to-evolve" Smart Grid Community: Parallels and Lessons-to-be-learned
LBNL-2904E
K. Herter and S. Wayland 2008 Technology Evaluation of Programmable Communicating Thermostats with Radio Broadcast Data System Communications
LBNL-6530E
K. Herter, S. Wayland and J. Rasin
2009 Small Business Demand Response with Communicating Thermostats: SMUD's Summer Solutions Research Pilot
LBNL-2742E
P. N. Price 2010 Methods for Analyzing Electric Load Shape and its Variability
LBNL-3713E
J. L. Mathieu, P. N. Price, S. Kiliccote and M. A. Piette
2011 Quantifying Changes in Building Electricity Use, with Application to Demand Response
LBNL-4944E
P. N. Price, J. L. Mathieu, S. Kiliccote and M. A. Piette
2011 Using Whole-Building Electric Load Data in Continuous or Retro-Commissioning
LBNL-5057E
R. Yin, S. Kiliccote, and M. A. Piette
2014 Linking measurements and models in commercial buildings: A case study for model calibration and demand response strategy evaluation
LBNL-7006E
J. Thiemann, N. DeForest, M. Stadler, J. Lai, W. Feng, K. LaCommare, J. Huang and C. Marnay
2013 Identification of Demand Response Potential for Microgrids Using the Distributed Energy Resources Customer Adaption Model: A Case Study of the Alameda County Santa Rita Jail of 2011
LBNL-1005114
S. Lanzisera, A. Weber, A. Liao, O. Schetrit, S. Kiliccote and M.A. Piette
2015 Field Testing of Telemetry for Demand Response Control of Small Loads
Automated DR in California Building Energy Efficiency Standards Since 2003, the Demand Response Research Center (DRRC) has been involved in development of open, interoperable, and secure automation and communication technologies that deliver automated demand response (AutoDR) grid services. With AutoDR, the receipt of an external signal initiates pre-programed DR strategies in a facility. An early success was Open Automated Demand Response (OpenADR) which is now a national standard and is achieving international adoption. Subsequent DRRC projects expanded OpenADR into new markets through technology, procedures, protocols and strategies to monitor and communicate real time conditions and demand response signals. This has facilitated broader customer participation new sectors such as small commercial buildings that respond to actual grid conditions. Some California utilities are now using OpenADR in residential buildings with communicating thermostats.
Subsequently, the DRRC has provided California policy initiatives and guidance assistance, specifically the development of guidelines for Automated Demand Response (AutoDR) implementation into the Non-residential California Building Energy Efficiency Standards (Title 24). Demand response related requirements first appeared in the 2008 Title 24, with language describing rudimentary electric lighting load shed capabilities through manual lighting control interventions. During the 2013 T24 development cycle, DRRC work helped to expand code language with specific AutoDR requirements for electric lighting (space and sign lighting) and HVAC space cooling temperature end-uses. The 2013 Title 24 went into effect on July 1, 2014 and the intent of the new language was to require true automation, without any human intervention, providing load sheds completely within building control response to external DR communication signals.
The new Title 2013 T24 requirements have mandatory requirements for DR automation. Table 1 summarizes these requirements. TABLE 1: 2013 CA. BUILDING ENERGY EFFICIENCY STANDARDS - AUTODR REQUIREMENTS
End Use System Building Design trigger AutoDR Load Shed Equipment Needed Acceptance Test
Lighting Controls
Building area ≥ 10,000 square feet; Habitable spaces w. LDP > 0.5 W/sf
Reduce lighting load ≥ 15%
AutoDR ready lighting control system OR EMCS
Construction Inspection & Functional Testing
Electronic Messaging Center (lighted signage)
Lighting load > 15kW Reduce lighting load ≥ 30%
AutoDR ready lighting control system OR EMCS
None
HVAC System (w/ Zone level DDC) Non-critical zones
Remote 4°F zone temp. cooling control & reset
Central HVAC controller OR AutoDR ready EMCS
Construction Inspection & Functional Testing
HVAC System (no DDC control)
Non-temperature sensitive processes
Remote 4°F zone temp. cooling control & reset
Demand responsive setback thermostat (also called ]OCST) OR AutoDR ready EMCS
None
27
The DRRC worked with the CEC to support development of AutoDR guidelines, standards and acceptance testing for new construction in order to accelerate the uptake of building automation and grid responsiveness through the California Title 24 building code.
The objectives of this work were to:
• Work with key stakeholders such as government agencies, code development consultants and electric utility program managers to identify and document broader adoption issues.
• Develop and propose AutoDR standards (OpenADR) T24 guidance language for HVAC and lighting end-use control for new construction.
• Outline compliance requirements of “standards-based messaging protocol” for AutoDR integration with building controls.
• Identify mechanisms where vendors and other stakeholders can provide AutoDR compliance to and acceptance testing of 2013 code language.
The DRRC conducted an extensive review of the existing AutoDR 2013 T24 code language and identified the conceptual gaps and language clarifications that are potentially a hindrance to market adoption and code compliance. With the review results in hand, the DRRC conducted a Stakeholder Workshop on November 6, 2014, with representation from all the required groups. The workshop attendees worked through the identified code language areas and identified many key deficiencies and market obstacles hindering AutoDR deployment in California. DRRC staff conducted a post workshop survey, receiving the following results from the survey questions.
• Which area(s) require improvements for better adoption of AutoDR in 2013 Title 24? o Top answer: “Providing tools for building designers and code-check officials to
check compliance” • What are ideal deployment channel(s) for AutoDR in 2013 Title 24?
o Top answer: “Utilities (new construction and major retrofits)” • Which key initiative(s) would you support to encourage mass adoption of AutoDR in
California Title 24? o Top answer: “Well-established process to design and build AutoDR code-
compliant buildings”
The project team explored the California Utility Savings By Design program (http://www.savingsbydesign.com) and identified the excellent “Design Guidelines: Automated Demand Response” document distributed by Energy Design Resources (http://energydesignresources.com). A final Webinar with the stakeholders was conducted in February 2015. In addition, we outlined future work to overcome barriers to AutoDR in Title 24. The generalized recommendations stemming from this work were:
• Revise AutoDR standards and acceptance test requirements language for better clarity in concepts and technical consistency
• Provide accessible and understandable education and training programs, and intuitive tools for code-compliance checking
• Leverage utilities, city departments, and public commissions to build effective communicate and education resources of existing and new AutoDR-related information to customers and building design communities
• Provide clear and consistent feedback channels from the AutoDR market to improve program design and the building code language
Since the 2016 Title 24 rulemaking process is already underway, on February 9, 2015, a comprehensive list of recommended changes to the AutoDR Title 24 sections was delivered to California Energy Commission Building Energy Efficiency Standards staff. In the near future, additional work will be needed, in partnership with the Savings By Design program and Utilities, to augment and supplement existing AutoDR design resources, which includes training materials, user guides, DRQAT Design Guidelines and cost estimating tools. Such resources will support ratepayers and AutoDR design and deployment activities as well as build a list of new construction and retrofit case studies. There is still a need for review of the 2016 and the 2019 Title 24 draft code concepts to identify opportunities for improvements to the code language.
The following key benefits to California were derived from this study:
• The review of AutoDR guidelines and requirements will aid the utilities and state regulatory agencies to develop tools that help the 2013 Title 24 (and future code cycles) to be more effective at improving new construction and retrofit construction towards state policy goals..
• Improved clarity in AutoDR guidance language and compliance Acceptance Tests will facilitate a better understanding of AutoDR requirements, encouraging interoperable technology developments and enabling buildings to be capable of providing grid services.
• Identify cost-effective methods for DR automation and customer participation in DR programs.
Related Publications (See Appendix F for abstracts):
D. S. Watson 2005 Proposal for 2008 Title 24 Global Temperature Adjustment (GTA)
S. Kiliccote, M. A. Piette, J. D. Fine, O. Schetrit, J. H. Dudley and H. Langford
2012 LEED Demand Response Credit: A Plan for Research towards Implementation
LBNL-6014E
G. Ghatikar, E. Sung and M.A. Piette
2015 Diffusion of Automated Grid Transactions Through Energy Efficiency Codes LBNL-6995E
Active and Passive Storage The use of thermal mass in HVAC control in buildings can reduce temperature fluctuations by absorbing and releasing heat at a rate in step with a building’s daily heating and cooling cycle. Building mass can help to flatten the thermal energy flows over the daily ambient temperature fluctuations. As batteries store energy chemically, buildings store heat (or retain coolness) in their thermal mass. Use of thermal mass allows buildings to act as energy storage devices. In addition, when used well, the use of thermal mass has enormous potential to increase the effectiveness of building systems for load shifting and peak energy demand reduction both in winter as well in summer.
Over the past decade, the DRRC conducted a number of simulation, laboratory, and field studies to demonstrate the potential for using building thermal mass for load shifting and peak energy demand reduction in buildings in different climates. The research evaluated various passive and active ways of using thermal mass storage in buildings. For new construction, architects and engineers work towards to an integrated and innovative design solution of thermal mass to reduce the use of the building heating, ventilation, and air-conditioning (HVAC) system. For existing buildings, a variety ways of passive and active use of thermal mass enable customers to reduce the peak energy and demand cost while maintaining an acceptable level of comfort.
Night-purge is a passive control strategy used to cool down a thermal mass during night hours and reduce the start-up power demand of the building HVAC system. The concept is to bring cool or cold outside air into the building and flush out warm air inside during the nighttime and cool down the thermal mass for the next day. Thermal mass is ideally located within the building and obscured from higher angle summer sunlight for preventing over-heating of the structure. Successful night-purge requires large areas of exposed internal thermal mass with minimal obstructions on the surface, such as floors with carpets and coverings, walls with cupboards and panels, or ceilings with acoustic tiles and drop-panels. Night-purge may not be suitable for a building in a humid climate or locations with high humidity at night. It can bring more moisture into the building and the cooling system would need to remove the additional latent cooling load than usual. For a building without operable windows, night-purge can be achieved with the assistance of a mechanical ventilation system to remove the heat energy.
The effect of thermal mass on comfort and HVAC control can be significant when the outside air temperatures cycle above and below indoor air temperatures within a daily 24-hour period. As a result, strategies using thermal mass are usually limited by the climate. There are several active control strategies of using thermal mass for precooling or preheating. At night, the building can start the ventilation system at midnight or early morning hours of the day. Since the outside temperature during the nighttime is lower than that of the daytime, the HVAC system runs at a higher efficiency. As a result, the building thermal mass can store cooling energy and release it to the space when the building is getting warmer during the day.
To precooling thermal mass, the thermostat is set down to below the normal operating setpoint until the building thermal mass is cooled in preparation for the following temperature setpoint
30
increase during the peak hours. Its effect depends on building thermal mass, weather, building HVAC system operation, and other factors. During the precooling periods, supply air temperature (SAT) of the HVAC system can be reduced along with lower zone temperature thermostat setpoints for precooling the building in a short period. Precooling has been tested in medium- and heavy-mass buildings and demonstrated its effects for reducing peak demand and maintaining thermal comfort in comparison with zone temperature reset without precooling. The test results show that night and early-morning precooling have noticeable effects on the second day cooling load in a heavy-mass building. For light-mass buildings, it had limited effects on afternoon electrical demand, especially on relatively cool days. The purpose of precooling is to increase the potential of peak demand reduction and improve comfort during the on-peak temperature reset period. Precooling can increase peak demand reduction without increasing the energy use on a DR event day in a heavy-mass building or in cool weather condition (see publications from Xu, Yin, and others below).
Using a building’s HVAC system to precool the building’s thermal mass has been shown to be an effective method for shifting demand from critical demand periods (e.g. afternoon on hot days) to morning periods. Between 15 and 30 percent of the whole building power can be reduced through the active control of building mass storage, depending on the climate and diurnal swing. The comfort survey results indicate that occupant comfort was generally maintained during the morning precooling and the afternoon temperature reset tests. The DRRC evaluated 11 commercial buildings in Southern California to evaluate optimal precooling. We found a range of 7 to 46 percent of the whole building power was reduced during the test events.
The DRRC participated in a US Department of Energy funded study led by UC Berkeley and also including Siemens Research Center 5 . This study, known as Distributed Intelligence Automated Demand Response, evaluated strategies to control thermostat setpoints, supply air temperature setpoints, minimum airflow rates and other HVAC parameters. One of the project goals was to increase the value of thermal mass storage for achieving a 30% peak load reduction. This was complicated by the absorption chiller in the building, but the modeling work that the target is feasible in many buildings.
In addition to the research of thermal mass storage in buildings, recently DRRC also studied the use of thermal energy storage for demand response. The study assessed the potential value of thermal energy storage (TES) and demand response (DR) to electricity systems and demand-side customers, and evaluated the impact of TES on different time scales of demand response programs and the technical potential and market value of using TES in California’s electricity markets. Beyond the value of TES for permanent load shifting, partial TES can provide additional value for demand response by changing the operation of TES charging and discharging. The DRRC added the TES module and related controls into the software tool – DRQAT (Demand Response Quick Assessment Tool) for analyzing the impact of operation
5 see http://citris-uc.org/energy/project/distributed-intelligence-automated-demand-response-diadr-project-sutardja-dai-hall-2/
31
controls of TES on the energy and demand savings. Recently, the DRRC has been working actively with industrial partners to evaluate the technical potential and value of TES in California:
• TES on campus – the DRRC evaluated a case study of reduced TES performance due to lacking of sufficient education and training of TES operation following a change of facility management.
• TES in a large office building – the DRRC evaluated the impact of different electricity tariffs on the energy and demand cost savings with TES operations.
The DRRC conducted a series of building energy simulations, laboratory experiments and field studies of passive and active use of thermal mass in buildings. Realizing that better software tools were needed to predict the ability of buildings to implement thermal storage and other load shed strategies, they developed the Demand Response Quick Assessment Tool (DRQAT). This free software tool provides a valuable resource for architects, engineers, building owners, policy makers, building code makers and energy management companies in California to easily model the electric load shape changes from various DR strategies. These strategies include DR control concepts for various lighting controls and HVAC systems.
Related Publications (See Appendix G for abstracts):
Authors Year Title LBNL#
P. Xu, P. Haves, M. A. Piette and J. E. Braun
2004 Peak Demand Reduction from Pre-Cooling with Zone Temperature Reset in an Office Building
LBNL-55800
I. Flexo Hiner & Partners 2004 Summary Report of Pre-Cooling and SCE Energy$mart ThermostSM Focus Groups
LBNL-62556
K.-h. Lee and J. E. Braun 2004 Development and Application of an Inverse Building Model for Demand Response in Small Commercial Buildings
SimBuild 2004, IBPSA-USA National Conference
ibpsa-usa-simbuild.pdf
P. Xu 2006 Evaluation of Demand Shifting Strategies with Thermal Mass in Two Large Commercial Buildings
LBNL-2907E
P. Xu, P. Haves, M. A. Piette and L. Zagreus
2006 Demand Shifting With Thermal Mass in Large Commercial Buildings: Field Tests, Simulations and Audits
LBNL-58815
P. Xu and L. Zagreus 2009 Demand Shifting with Thermal Mass in Light and Heavy Mass Commercial Buildings
CHAPTER 4: Industrial, Agriculture and Water The objective of this research was to increase the knowledge of what, where, for how long, and under what conditions industrial facilities will shed or shift load in response to an automated signal. In 2006, California industries were already participating extensively in manual demand response (DR) programs (1857 MW for reliability and 1044 MW for “day ahead” notification programs). However, they were not participating in automated DR (Auto-DR). The goal of using Auto-DR in industry is to provide a more “hardened” response to Auto-DR signals based on price or reliability. Challenges for industrial Auto-DR include: the variation in loads and processes across and within sectors, resource-dependent loading patterns that are driven by outside factors such as customer orders or time-critical processing (e.g., irrigation scheduling, tomato canning), the perceived lack of control inherent in the term “Auto-DR”, and aversion to risk, especially due to unplanned impacts on production.
After conducting analyses of energy consumption and demand profiles of California industries to identify a short list of ones with the greatest potential for Auto-DR, the team consulted with a technical advisory group of industry experts to vet preliminary findings. The team then conducted in-depth analyses of the selected industrial subsectors, namely: Refrigerated Warehouses, Waste Water Treatment, Agricultural Irrigation Pumping, and Data Centers. In addition, an Industrial Controls Survey was conducted to determine whether there is a relationship between controls capability (current and planned) and interest in Auto-DR participation. An initial study conducted on the Cement industry also identified DR opportunities, but further research was not conducted due to the limited number of CA facilities.
The five key benefits of this work were:
1. Auto-DR opportunity validation: The team determined that there is a wide range of substantial opportunities for Auto-DR in selected industries through load shedding/shifting. This finding was supported by case studies and field tests, examples of which include:
a. The team’s initial research led to some early success in identifying subsectors, such as industrial gases, that were particularly well suited to Auto-DR due to their controls and manufacturing processes. Three industrial gas facilities enrolled in Auto-DR during this period, representing most of the subsector, with a total shift capability of nearly 25 MW. Through collaboration with the utilities’ technical assistance providers (e.g., Global Energy Partners), the total industrial Auto-DR participation rose to nearly 40MW by the end of 2008.
b. A controls system upgrade in 2008 enabled Auto-DR at one industrial food processing site. Auto-DR tests at the refrigerated warehouse yielded better than expected results with no product loss or production delay. Auto-DR resulted in a 36% load shed at the facility, reducing 1,600 kW of baseline load by 580 kW, which was greater than the expected 162 kW.
34
c. Several wastewater treatment facilities documented the implementation of load management and energy efficiency measures. For example, a wastewater treatment facility in San Diego County reduced average demand by 540 kW or 30% of total demand by implementing Auto-DR.
d. A verification study was carried out on actual farm DR applications using the Agricultural Irrigation Demand Response Estimation Tool (AIDRET). Results produced by AIDRET were in close agreement (within 7%) with the DR recommendations by a third party auditor.
e. Throughout this research, the team engaged with industry experts. Building a relationship with industry experts helped to determine further opportunities in particular subsectors.
2. Control capabilities matter: The team determined that Auto-DR is compatible with energy efficiency and load management in industrial facilities, but many industries have limited controls capabilities, especially for supporting or non-core systems that may be suited for Auto-DR.
a. Importance of trade association collaboration: The team worked with key trade associations to initiate a survey that establishes a link between Auto-DR participation and controls capability in California’s industrial facilities.
b. Survey findings: Characteristics supporting Auto-DR are: advanced control systems, high-energy use, predictable loads, a history of energy efficiency measures, and participation in energy decision-making by production and facilities managers.
3. Auto-DR inclusion in integrated audits: The team developed and used tools (e.g., spreadsheet-based templates) to assist utility technical assistance providers in screening potential DR candidates. Additionally, the team developed tools to assist utility energy auditors in obtaining better quality information about Auto-DR potential through integrated audits. This research also focused on collecting and analyzing data from utility integrated audits to support Auto-DR recommendations.
4. Characterization, guides, and tools to support participation: The team developed market studies, DR strategy guides, and DR software tools for the targeted subsectors. Market studies supported by field tests helped the team to identify effective shed/shift strategies, while the guides and tools helped users understand Auto-DR event impacts on their processes and better positioned them for Auto-DR participation. Examples include:
a. Refrigerated Warehouses: A market characterization study and partnership with VaCom Technologies (a Technical Advisory Group participant) resulted in development of an Auto-DR strategy guide for refrigerated warehouses. These studies led to the development of the Demand Response Quick Assessment Tool for Refrigerated Warehouses (DRQAT-RW).
b. Agricultural Irrigation Pumping: An initial scoping study in the agricultural sector, which was funded by the PIER program generated interest in Auto-DR for irrigation pumps. As a direct result of this study, PG&E funded the team to develop an
35
Agricultural Irrigation Demand Response Estimation Tool (AIDRET). Additional funding from the Commission led to further enhancements of AIDRET and the development of the Interactive Public Tool for Irrigation Pumping. Throughout this process, the team partnered with academic (Center for Irrigation Technology at Fresno State University) and industry (Observant Inc.) representatives.
5. Opportunities for further study: The team identified barriers to implementing industrial Auto-DR and next steps for research needed to overcome them. Opportunities for further study include:
a. Refrigerated Warehouses: i. Developing a financial justification for Auto-DR based on electricity cost savings
resulting from participation in time-of-use (TOU) and real time electric pricing programs vs. equipment upgrade capital costs, any additional operational costs, and operational risks.
ii. Conducting a qualitative discussion of intangible benefits and strategic value propositions, such as environmental issues and corporate social responsibility, in the context of their relative importance to a facility.
b. Wastewater Treatment Facilities: i. Studying the effect that modulation of variable demand aeration loads has on
effluent quality. ii. Conducting a further study to understand the prevalence of cogeneration in
wastewater treatment facilities and its relationship to Auto-DR potential, including utilizing schedulable self-generation and a self-starting generation unit to contribute to Auto-DR.
c. Agricultural Irrigation Pumping Facilities: i. Conducting an updated study on recent electricity consumption related to
agricultural water pumping. ii. Developing more detailed information on irrigation water sources, and irrigation
methods. iii. Conducting surveys of large growers to determine their motivations (or lack thereof)
for participating in Auto-DR. d. Data Centers:
i. Conducting field demonstrations of all or a subset of Auto-DR strategies for data centers to determine effective strategies, and to evaluate the whole facility load reduction potential against existing baselines.
ii. Identifying emerging data center technologies, vendors, and control strategies to reduce peak electrical load(s) from data center IT and HVAC equipment operation.
Related Publications (See Appendix H for abstracts):
A. T. McKane, M. A. Piette, D. Faulkner, G. Ghatikar, A. Radspieler Jr., B. Adesola, S. Murtishaw and S. Kiliccote
2008 Opportunities, Barriers and Actions for Industrial Demand Response in California
A. B. Lekov, L. Thompson, A. T. McKane, A. Rockoff and M. A. Piette
2009 Opportunities for Energy Efficiency and Automated Demand Response in Industrial Refrigerated Warehouses in California
LBNL-1991E
S. Goli, A. T. McKane and D. Olsen
2011 Demand Response Opportunities in Industrial Refrigerated Warehouses in California
LBNL-4837E
Y. Rongxin, A. Aghajanzadeh, R. Zhang, A. T. McKane, P. L. Therkelsen
2015 Development and Validation of Demand Response Quick Assessment Tool for Refrigerated Warehouses in California
LBNL-1003910
L. Thompson, K. Song, A. B. Lekov and A. T. McKane
2008 Automated Demand Response Opportunities in Wastewater Treatment Facilities
LBNL-1244E
A. B. Lekov, L. Thompson, A. T. McKane, K. Song and M. A. Piette
2009 Opportunities for Energy Efficiency and Open Automated Demand Response in Wastewater Treatment Facilities in California - Phase I Report
LBNL-2572E
L. Thompson, A. B. Lekov, A. T. McKane and M. A. Piette
2010 Opportunities for Open Automated Demand Response in Wastewater Treatment Facilities in California - Phase II Report. San Luis Rey Wastewater Treatment Plant Case Study
LBNL-3889E
D. Olsen, S. Goli, D. Faulkner and A. T. McKane
2012 Opportunities for Automated Demand Response in Wastewater Treatment Facilities in California - Southeast Water Pollution Control Plant Case Study
LBNL-6056E
A. Aghajanzadeh, C.P. Wray, D. Olsen, A. McKane
2015 Opportunities for Automated Demand Response in California Wastewater Treatment Facilities
CPP Critical Peak Pricing, a time-of-use electric rate
CPUC California Public Utilities Commission
D2G Demand to Grid
DDC Direct Digital Control
DER Distributed Energy Resources
DER-CAM Distributed Energy Resources Customer Adoption Model
DR Demand Response
DRAS Demand Response Automation Server
DRQAT Demand Response Quick Assessment Tool
DRQAT-RW Demand Response Quick Assessment Tool for Refrigerated Warehouse
DRRC Demand Response Research Center
EE Energy Efficiency
EMCS Energy Management and Control System
EnergyPlus A building energy use simulation tool produced by US Department of Energy
EPIC Electric Program Investment Charge
GTA Global Temperature Adjustment
HAN Home Area Network
HMG Heschong-Mahone Group is a research and standards development consultancy
HVAC Heating Ventilating and Air Conditioning
IAW Industry, Agriculture and Water, part of the PIER energy efficiency
39
program
IOU Investor-Owned Utilities, among California electric utilities, this is primarily San Diego Gas and Electric, Southern California Edison, and Pacific Gas and Electric Company
ISO Independent System Operator, responsible for managing electric transmission grid
kW kilowatt, 1000 Watts
LBNL Lawrence Berkeley National Laboratory
LEED Leadership in Energy and Environental Design
LLNL Lawrence Livermore National Laboratory
LPD Lighting Power Density
M2M Machine to Machine
MW MegaWatt, 1 million watts
OpenADR The open-source Automated Demand Response language which was developed to communicate signals and information between nodes in the demand response system.
OpenSEG Open Smart Energy Gateway, a secure mechanism for making smart meter data available for consumer use.
PCT Programmable Communicating Thermostat
PG&E Pacific Gas and Electric Company
PIER Public Interest Energy Research
RD&D Research, Development and Demonstration
RDS Radio Display System, a method for transmitting digital information using public FM radio spectrum
REDS Residential Energy Display Survey
RTP Real Time Pricing
SAT Supply Air Temperature
SCE Southern California Edison Company
SEP Smart Energy Profile, a Zigby smart meter communication protocol
Smart Grid Smart Grid is the thoughtful integration of intelligent technologies and
40
innovative services that produce a more efficient, sustainable, economic, and secure electrical supply for California communities.
SMUD Sacramento Municipal Utility District
T24 Title 24 Part 6, the California Energy Code for Buildings
TES Thermal Energy Storage
TOU Time of Use, an electric rate structure based on time-of-day
UC University of California
WECC Western Electricity Coordinating Council
A1
Appendix A - OpenADR and the OpenADR Alliance Report Abstracts Task 5.0 - DR Automation Server
Authors Year Title LBNL#
E. Koch and M. A. Piette
2009
Direct versus Facility Centric Load Control for Automated Demand Response
LBNL-2905E
Direct load control (DLC) refers to the scenario where third party entities outside the home or facility are responsible for deciding how and when specific customer loads will be controlled in response to Demand Response (DR) events on the electric grid. Examples of third parties responsible for performing DLC may be Utilities, Independent System Operators (ISO), Aggregators, or third party control companies. DLC can be contrasted with facility centric load control (FCLC) where the decisions for how loads are controlled are made entirely within the facility or enterprise control systems. In FCLC the facility owner has more freedom of choice in how to respond to DR events on the grid. Both approaches are in use today in automation of DR and both will continue to be used in future market segments including industrial, commercial and residential facilities. This paper will present a framework which can be used to differentiate between DLC and FCLC based upon where decisions are made on how specific loads are controlled in response to DR events. This differentiation is then used to compare and contrast the differences between DLC and FCLC to identify the impact each has on:
• Utility/ISO and third party systems for managing demand response • Facility systems for implementing load control • Communications networks for interacting with the facility • Facility operators and managers
Finally a survey of some of the existing DR related specifications and communications standards is given and their applicability to DLC or FCLC.
Authors Year Title LBNL#
S. Kiliccote, M. A. Piette, G. Ghatikar, E. Koch, D. Hennage, J. Hernandez, A. K. Chiu, O. Sezgen and J. Goodin
2009
Open Automated Demand Response Communications in Demand Response for Wholesale Ancillary Services
LBNL-2945E
The Pacific Gas and Electric Company (PG&E) is conducting a pilot program to investigate the technical feasibility of bidding certain demand response (DR) resources into the
California Independent System Operator’s (CAISO) day-ahead market for ancillary services non-spinning reserve. Three facilities, a retail store, a local government office building, and a bakery, are recruited into the pilot program. For each facility, hourly demand, and load curtailment potential are forecasted two days ahead and submitted to the CAISO the day before the operation as an available resource. These DR resources are optimized against all other generation resources in the CAISO ancillary service. Each facility is equipped with four-second real time telemetry equipment to ensure resource accountability and visibility to CAISO operators. When CAISO requests DR resources, PG&E’s OpenADR (Open Automated DR) communications infrastructure is utilized to deliver DR signals to the facilities’ energy management and control systems (EMCS). The pre-programmed DR strategies are triggered without a human in the loop. This paper describes the automated system architecture and the flow of information to trigger and monitor the performance of the DR events. We outline the DR strategies at each of the participating facilities. At one site a real time electric measurement feedback loop is implemented to assure the delivery of CAISO dispatched demand reductions. Finally, we present results from each of the facilities and discuss findings.
Task 6.0 - DR Auto Server 2007
Authors Year Title LBNL#
E. Koch and M. A. Piette
2008
Scenarios for Consuming Standardized Automated Demand Response Signals
LBNL-1362E
Automated Demand Response (DR) programs require that Utility/ISO's deliver DR signals to participants via a machine-to-machine communications channel. Typically these DR signals constitute business logic information (e.g. prices and reliability/shed levels) as opposed to commands to control specific loads in the facility. At some point in the chain from the Utility/ISO to the loads in a facility, the business level information sent by the Utility/ISO must be processed and used to execute a DR strategy for the facility. This paper explores the various scenarios and types of participants that may utilize DR signals from the Utility/ISO. Specifically it explores scenarios ranging from single end user facility, to third party facility managers and DR Aggregators. In each of these scenarios it is pointed out where the DR signal sent from the Utility/ISO is processed and turned into the specific load control commands that are part of a DR strategy for a facility. The information in these signals is discussed. In some cases the DR strategy will be completely embedded in the facility while in others it may be centralized at a third party (e.g. Aggregator) and part of an aggregated set of facilities. This paper also discusses the pros and cons of the various scenarios and discusses how the Utility/ISO can use an open standardized method (e.g. Open Automated Demand Response Communication Standards) for delivering DR signals that will promote interoperability and insure that the widest range of end user facilities can participate in DR programs regardless of which scenario they belong to.
M. A. Piette, G. Ghatikar, S. Kiliccote, D. S. Watson, E. Koch and D. Hennage
2009
Design and Operation of an Open, Interoperable Automated Demand Response Infrastructure for Commercial Buildings
LBNL-2340E
This paper describes the concept for and lessons from the development and field-testing of an open, interoperable communications infrastructure to support automated demand response (auto-DR). Automating DR allows greater levels of participation, improved reliability, and repeatability of the DR in participating facilities. This paper also presents the technical and architectural issues associated with auto-DR and description of the demand response automation server (DRAS), the client/server architecture-based middle-ware used to automate the interactions between the utilities or any DR serving entity and their customers for DR programs. Use case diagrams are presented to show the role of the DRAS between utility/ISO and the clients at the facilities.
Development and Demonstration of the Open Automated Demand Response Standard for the Residential Sector
LBNL-6531E
The goal of this study was to demonstrate a demand response system that can signal nearly every customer in all sectors through the integration of two widely available and non-proprietary communications technologies—Open Automated Demand Response (OpenADR) over Internet protocol and Utility Messaging Channel (UMC) over FM radio. The outcomes of this project were as follows: (1) a software bridge to allow translation of pricing signals from OpenADR to UMC; and (2) a portable demonstration unit with an Internet-connected notebook computer, a portfolio of DR-enabling technologies, and a model home. The demonstration unit provides visitors the opportunity to send electricity-pricing information over the Internet (through OpenADR and UMC) and then watch as the model appliances and lighting respond to the signals. The integration of OpenADR and UMC completed and demonstrated in this study enables utilities to send hourly or sub-hourly electricity pricing information simultaneously to the residential, commercial and industrial sectors.
Task T.4 - OpenSource DRAS
Authors Year Title LBNL#
C. McParland
2011
OpenADR Open Source Toolkit: Developing Open Source Software for the Smart Grid
Demand response (DR) is becoming an increasingly important part of power grid planning and operation. The advent of the Smart Grid, which mandates its use, further motivates selection and development of suitable software protocols to enable DR functionality. The OpenADR protocol has been developed and is being standardized to serve this goal. We believe that the development of a distributable, open source implementation of OpenADR will benefit this effort and motivate critical evaluation of its capabilities, by the wider community, for providing wide-scale DR services.
Task T.6 - Dynamic Pricing
Authors Year Title LBNL#
G. Ghatikar, J. L. Mathieu, M. A. Piette, E. Koch and D. Hennage
2010
Open Automated Demand Response Dynamic Pricing Technologies and Demonstration
LBNL-3921E
This study examines the use of the OpenADR communications specification version 1.0 (OpenADR v1.0), related data models, technologies, and strategies to send dynamic prices such as real-time prices and peak prices and time-of-use rates to commercial and industrial electricity customers. OpenADR v1.0 is a Web services-based flexible, open information model that has been used in California utilities’ commercialized automated demand response programs since 2007. The OpenADR v1.0 data model can be used to send dynamic prices and time-of-use rates. This study’s project team developed an interface that allows the utility or independent system operator to manually enter “day-ahead” or “day-of” dynamic prices. The team also developed a method for extracting dynamic prices from real-time Internet feeds. Dynamic prices can be delivered in the form of actual prices (in dollars) or mapped into “operation modes.” with both formats acting as inputs to building control systems. The report presents several different methods for mapping actual prices, some of which were implemented in demonstration projects. The study results show that OpenADR allows interoperability with existing and future systems and technologies, and that it can be used in related dynamic pricing activities within the Smart Grid.
Authors Year Title LBNL#
G. Ghatikar, J. L. Mathieu, M. A. Piette and S. Kiliccote
2010
Open Automated Demand Response Technologies for Dynamic Pricing and Smart Grid
LBNL-4028E
We present an Open Automated Demand Response Communications Specifications (OpenADR) data model capable of communicating real-time prices to electricity customers. We also show how the same data model could be used to for other types of dynamic pricing tariffs (including peak pricing tariffs, which are common throughout the United States). Customers participating in automated demand response programs with building control systems can respond to dynamic prices by using the actual prices as inputs to their control systems. Alternatively, prices can be mapped into "building operation modes,"
which can act as inputs to control systems. We present several different strategies customers could use to map prices to operation modes. Our results show that OpenADR can be used to communicate dynamic pricing within the Smart Grid and that OpenADR allows for interoperability with existing and future systems, technologies, and electricity markets.
Authors Year Title LBNL#
J. L. Mathieu, D. S. Callaway and S. Kiliccote
2011
Examining Uncertainty in Demand Response Baseline Models and Variability in Automated Response to Dynamic Pricing
LBNL-5096E
Controlling electric loads to deliver power system services presents a number of interesting challenges. For example, changes in electricity consumption of Commercial and Industrial (C&I) facilities are usually estimated using counterfactual baseline models, and model uncertainty makes it difficult to precisely quantify control responsiveness. Moreover, C&I facilities exhibit variability in their response. This paper seeks to understand baseline model error and demand-side variability in responses to open-loop control signals (i.e. dynamic prices). Using a regression-based baseline model, we define several Demand Response (DR) parameters, which characterize changes in electricity use on DR days, and then present a method for computing the error associated with DR parameter estimates. In addition to analyzing the magnitude of DR parameter error, we develop a metric to determine how much observed DR parameter variability is attributable to real event-to-event variability versus simply baseline model error. Using data from 38 C&I facilities that participated in an automated DR program in California, we find that DR parameter errors are large. For most facilities, observed DR parameter variability is likely explained by baseline model error, not real DR parameter variability; however, a number of facilities exhibit real DR parameter variability. In some cases, the aggregate population of C&I facilities exhibits real DR parameter variability, resulting in implications for the system operator with respect to both resource planning and system stability.
Authors Year Title LBNL#
J. L. Mathieu, D. S. Callaway and S. Kiliccote
2011
Variability in Automated Responses of Commercial Buildings and Industrial Facilities to Dynamic Electricity Prices
LBNL-5129E
Changes in the electricity consumption of commercial buildings and industrial facilities (C&I facilities) during Demand Response (DR) events are usually estimated using counterfactual baseline models. Model error makes it difficult to precisely quantify these changes in consumption and understand if C&I facilities exhibit event-to-event variability in their response to DR signals. This paper seeks to understand baseline model error and DR variability in C&I facilities facing dynamic electricity prices. Using a regression-based baseline model, we present a method to compute the error associated with estimates of
several DR parameters. We also develop a metric to determine how much observed DR variability results from baseline model error rather than real variability in response. We analyze 38 C&I facilities participating in an automated DR program and find that DR parameter errors are large. Though some facilities exhibit real DR variability, most observed variability results from baseline model error. Therefore, facilities with variable DR parameters may actually respond consistently from event to event. Consequently, in DR programs in which repeatability is valued, individual buildings may be performing better than previously thought. In some cases, however, aggregations of C&I facilities exhibit real DR variability, which could create challenges for power system operation.
Task T.8 - OpenADR Standards 2009
Authors Year Title LBNL#
M. A. Piette, G. Ghatikar, S. Kiliccote, E. Koch, D. Hennage, P. Palensky and C. McParland
2009
Open Automated Demand Response Communications Specification (Version 1.0)
LBNL-1779E
The development of the Open Automated Demand Response Communications Specification, also known as OpenADR or Open Auto-DR, began in 2002 following the California electricity crisis. This specification describes an open standards-based communications data model designed to promote common information exchange between the utility or Independent System Operator and electric customers using demand response price and reliability signals. OpenADR is one element of the Smart Grid information and communications technologies that are being developed to improve optimization between electric supply and demand. The intention of the open automated demand response communications data model is to provide interoperable signals to building and industrial control systems that are pre-programmed to take action based on a demand response signal, enabling a demand response event to be fully automated, with no manual intervention. The concept of an open specification is intended to allow anyone to implement the signaling systems, the automation server, or the automation clients. This communication specification is an essential enabling technology for California’s future electrical grid. OpenADR will provide benefits to California by both increasing the number of facilities that participate in demand response, and reducing the cost to conduct frequent and persistent participation in demand response. The work has been carried out by the Demand Response Research Center (DRRC), which is managed by Lawrence Berkeley National Laboratory.
Task DR - OpenADR Standards: Development and Deployment (WA1-8.2-1)
Authors Year Title LBNL#
E. Koch and M. A. Piette
2007
Architecture Concepts and Technical Issues for an Open, Interoperable Automated Demand Response Infrastructure
This paper presents the technical and architectural issues associated with automating Demand Response (DR) programs. The paper focuses on a description of the Demand Response Automation Server (DRAS), which is the main component used to automate the interactions between the Utilities and their customers for DR programs. Use cases are presented that show the role of the DRAS in automating various aspects of DR programs. This paper also describes the various technical aspects of the DRAS including its interfaces and major modes of operation. This includes how the DRAS supports automating such Utility/Customer interactions as automated DR bidding, automated DR event handling, and finally real-time pricing.
Authors Year Title LBNL#
M. A. Piette, S. Kiliccote and G. Ghatikar
2007
Design and Implementation of an Open, Interoperable Automated Demand Response Infrastructure
LBNL-63665
This paper describes the concept for and lessons from the development and field-testing of an open, interoperable communications infrastructure to support automating demand response (DR). Automating DR allows greater levels of participation and improved reliability and repeatability of the demand response and customer facilities. Automated DR systems have been deployed for critical peak pricing and demand bidding and are being designed for real time pricing. The system is designed to generate, manage, and track DR signals between utilities and Independent System Operators (ISOs) to aggregators and end-use customers and their control systems.
Authors Year Title LBNL#
E. Koch and S. Kiliccote
2011
Role of Standard Demand Response Signals for Advanced Automated Aggregation
LBNL-5379E
Emerging standards such as OpenADR enable Demand Response (DR) Resources to interact directly with Utilities and Independent System Operators to allow their facility automation equipment to respond to a variety of DR signals ranging from day ahead to real time ancillary services. In addition, there are Aggregators in today’s markets who are capable of bringing together collections of aggregated DR assets and selling them to the grid as a single resource. However, in most cases these aggregated resources are not automated and when they are, they typically use proprietary technologies. There is a need for a framework for dealing with aggregated resources that supports the following requirements:
• Allows demand-side resources to participate in multiple DR markets ranging from wholesale ancillary services to retail tariffs without being completely committed to a single entity like an Aggregator
• Allow aggregated groups of demand-side resources to be formed in an ad hoc fashion to address specific grid-side issues and support the optimization of the collective response of an aggregated group along a number of different dimensions. This is important in order to tailor the aggregated performance envelope to the needs to of the grid.
• Allow aggregated groups to be formed in a hierarchical fashion so that each group can participate in variety of markets from wholesale ancillary services to distribution level retail tariffs. This paper explores the issues of aggregated groups of DR resources as described above especially within the context of emerging smart grid standards and the role they will play in both the management and interaction of various grid-side entities with those resources.
Authors Year Title LBNL#
D. G. Holmberg, G. Ghatikar, E. Koch and J. Boch
2012
OpenADR Advances
LBNL-6055E
An important goal for the advancement of smart grid deployments is to enable buildings to dynamically respond to the supply of electricity. Buildings should respond to grid event and price signals in order to manage peak demands on the electric grid and fluctuations of intermittent renewable generation. The Open Automated Demand Response—OpenADR—communications standard is an important tool to help develop this market for demand response (DR). This article reviews progress in the development and implementation of OpenADR, focusing on updates since the release of OpenADR 2.0 in December 2011. We introduce the OpenADR Alliance, established in late 2010 to foster the adoption of OpenADR 2.0 profile specifications and provide a testing and certification program to meet U.S. smart grid interoperability goals. The Alliance has developed two profiles of OpenADR to meet the needs of simple DR clients (receiving DR event signals) up to full-featured implementations that enable bidding into wholesale markets. In addition, this article presents details of a pilot conducted in spring 2012 where OpenADR 2.0 was implemented for wholesale DR programs. OpenADR will be a key standard for moving the smart grid forward, both in the U.S. as well as internationally.
Task CD - OpenADR Standards: Conformance (WA1-8.2.2)
Authors Year Title LBNL#
G. Ghatikar and R. Bienert
2011
Smart Grid Standards and Systems Interoperability: A Precedent with OpenADR
LBNL-5273E
This paper describes the Smart Grid standards and systems interoperability through Open Automated Demand Response Standard (OpenADR) conformance development process. The process aligns closely with the national and GridWise® Architecture Council’s recommendations for interoperability. This paper looks at the standards development, and
certification and testing process through the activities of standards organizations, user-groups, industry alliances, and Smart Grid development. It references the Conformance and Interoperability Process Reference Manuals and requirements of the standards organizations for certification and interoperability of OpenADR standard to address consumers and stakeholder needs. The evaluation framework for OpenADR interoperability is characterized through the data transport mechanisms, harmonization and co-existence with other standards and systems, and Smart Grid interoperability across different markets. The result is the interoperable information exchange among Smart Grid standards and technology implementations within the national and international standards activities; primarily the interoperability and backward compatibility needs within the California commercial deployments. This process offers significant value to consumers and builds trust in the system. The service providers and vendors can provide cost-effective solutions, which reduce the implementation costs and improve the operational efficiency of DR programs and automation.
Task AL - OpenADR Standards: OpenADR Alliance (WA1-8.2-3)
Authors Year Title LBNL#
G. Ghatikar and E. Koch
2012
Deploying Systems Interoperability and Customer Choice within Smart Grid
LBNL-6016E
In 2012, significant development of Smart Grid interoperability standards for customers and their systems readied those standards for deployments in commercial demand-response programs. These standards have led to the development of interoperable systems and products for communication between the grid-operating entities (e.g., independent systems operators, utilities) and customer energy management systems. This paper summarizes the efforts to standardize OpenADR in the United States, and traces its evolution from OpenADR 1.0 to an emerging success story, OpenADR 2.0. It also describes the development and deployment of OpenADR and how grid operating entities and customers can use open and secure communication and technologies to provide interoperability and customer choice. It focuses on the development of OpenADR 2.0 specifications and the OpenADR Alliance (Alliance), a non-profit stakeholder and industry consortium with a mission to create “true” and “secure” interoperability and deployment for OpenADR 2.0, including providing the services of the testing and certification authority.. Finally, the paper provides insights into interoperability (with examples), the direction of the Alliance, and applicability of OpenADR experiences for the Smart Grid.
Task IO - OpenADR 1.0/2.0 Transition (WA2-8.2-5)
Authors Year Title LBNL#
G. Ghatikar, D. Riess and M. A. Piette
2014
Analysis of Open Automated Demand Response Deployments in California and Guidelines to Transition to Industry Standards
This report reviews the Open Automated Demand Response (OpenADR) deployments within the territories serviced by California’s investor-owned utilities (IOUs) and the transition from the OpenADR 1.0 specification to the formal standard—OpenADR 2.0. As demand response service providers and customers start adopting OpenADR 2.0, it is necessary to ensure that the existing Automated Demand Response (AutoDR) infrastructure investment continues to be useful and takes advantage of the formal standard and its many benefits. This study focused on OpenADR deployments and systems used by the California IOUs and included a summary of the OpenADR deployment from the U.S. Department of Energy-funded demonstration conducted by the Sacramento Municipal Utility District (SMUD). Lawrence Berkeley National Laboratory collected and analyzed data about OpenADR 1.0 deployments, categorized architectures, developed a data model mapping to understand the technical compatibility of each version, and compared the capabilities and features of the two specifications. The findings, for the first time, provided evidence of the total enabled load shed and average first cost for system enablement in the IOU and SMUD service territories. The OpenADR 2.0a profile specification semantically supports AutoDR system architectures and data propagation with a testing and certification program that promotes interoperability, scaled deployments by multiple vendors, and provides additional features that support future services.
Task ER/MR - DR and DER (WA3-8.1)
Authors Year Title LBNL#
G. Ghatikar, S. Mashayekh, M. Stadler, R. Yin, and Z. Liu
2015
Distributed Energy Systems Integration and Demand Optimization for Autonomous Operations and Electric Grid Transactions
LBNL-1003742
Clean energy generation and power systems in the United States are evolving to provide reliable energy to consumers. California’s energy generation goals require 33 percent of annual retail sales from renewable sources by 2020, and Rule 21 requires identification of customer-side distributed energy resources (DER) controls, communication technologies, and standards. While generation exists at various levels within a Smart Grid, the customer-side DER plays a key role for demand response (DR) options. The challenges include leveraging the existing DER technology infrastructure, and enabling optimized cost, energy, and carbon choices for customers to deploy grid transactions at scale. The report describes the ongoing study on cost-effective communication technologies for DER integration and interoperability using tools and open standards, as well as optimization models for resource planning based on day-ahead price notifications. It identifies architectures and customer engagement strategies in dynamic pricing DR transactions to generate a feedback model for load flexibility, load profiles, and participation schedules. The results show that the model fits within the transactive energy concepts of the GridWise Architecture Council for communication tools that coordinate entities to maximize social
welfare with minimal engagement, and grid system operators to utilize customer-side DER for grid transactions.
B1
Appendix B – Open Smart Energy Gateway Task RD - REDS (WA1-9.1-1)
Authors Year Title LBNL#
J. Searle and C. McParland
2012
HAN Attack Surface and the Open Smart Energy Gateway Project
LBNL-6013E
The cost of deploying smart meters throughout many of California’s utility service areas has been justified by a combination of benefits to both utilities and consumers. Utilities would receive operational benefits from the use of modern Smart Meter communications capabilities (i.e. Advanced Metering Infrastructure – or AMI) for both automated meter reading and enhanced monitoring of the power distribution grid. Consumers would benefit from newly available services that would allow near real-time readout of energy usage – both power and price – and enable, through ubiquitous Demand Response (DR) signaling, cost-saving automatic responses to changing energy price conditions. At this point in time, some of the utility goals related to the “back end” or AMI communications systems have been achieved. However, many of the benefits promised to consumers, such as enhanced control over their energy consumption and related bills, have yet to materialize. Although the installed systems are technically capable of utility-to-residence communications, California utilities have not yet enabled smart meter communications into the home. The reluctance on the part of utilities to enable wireless communication between smart meters and residential devices (e.g. thermostats, energy displays, etc.) has been the primary factor in limiting the availability of these new consumer services. While some of this reluctance has been based on technical shortcomings of the currently selected communications technology (ZigBee PRO and ZigBee SEP 1.0), the overarching issue has been concern about the level of security provided by this particular set of network and application-level protocols, Utilities remain uncertain about the ultimate, system-wide risk entailed by allowing customers to directly interact, via a wireless network, with their smart meters. As a result, the proposed consumer benefits that depend on such communications have not been achieved.
Task RR - REDS Phase III (WA2-8.4,9.1,9.4-1)
Authors Year Title LBNL#
J. Page, C. McParland, M.A. Piette and S. Czarnecki
2012
Design of an Open Smart Energy Gateway for Smart Meter Data Management
LBNL-182358
With the widespread deployment of electronic interval meters, commonly known as smart meters, came the promise of real-time data on electric energy consumption. Recognizing an opportunity to provide consumers access to their near real-time energy consumption data
directly from their installed smart meter, we designed a mechanism for capturing those data for consumer use via an open smart energy gateway (OpenSEG). By design, OpenSEG provides a clearly defined boundary for equipment and data ownership. OpenSEG is an open-source data management platform to enable better data management of smart meter data. Effectively, it is an information architecture designed to work with the ZigBee Smart Energy Profile 1.x (SEP 1.x). It was specifically designed to reduce cyber-security risks and provide secure information directly from smart meters to consumers in near real time, using display devices already owned by the consumers. OpenSEG stores 48 hours of recent consumption data in a circular cache using a format consistent with commonly available archived (not real-time) consumption data such as Green Button, which is based on the Energy Services Provider Interface (ESPI) data standard. It consists of a common XML format for energy usage information and a data exchange protocol to facilitate automated data transfer upon utility customer authorization. Included in the design is an application program interface by which users can acquire data from OpenSEG for further post processing. A sample data display application is included in the initial software product. The data display application demonstrates that OpenSEG can help electricity use data to be retrieved from a smart meter and ported to a wide variety of user-owned devices such as cell phones or a user-selected database. This system can be used for homes, multi-family buildings, or small commercial buildings in California.
C1
Appendix C – Anytime DR and DR Potential Studies Report Abstracts Anytime DR and DR Potentials Studies
Task IR - OpenADR Integration with Renewables, Smart Grid and Energy Storage Systems (WA1-8.3-1)
Authors Year Title LBNL#
S. Kiliccote, P. Sporborg, I. Sheikh, E. Huffaker and M. A. Piette
2010
Integrating Renewable Resources in California and the Role of Automated Demand Response
LBNL-4189E
This scoping study summarizes the challenges with integrating wind and solar generation into the California’s electricity grid. These challenges include: Smoothing intra-hour variability Absorbing excess renewable energy during over-generation periods Addressing morning and evening ramping periods In addition, there are technical challenges to integrating retail demand response (DR) triggered by the wholesale conditions into the CAISO markets. The study describes the DR programs available to the consumers through the utilities in California and CAISO’s ancillary services market because an integration of the wholesale and retail DR requires an understanding of these different offerings and the costs associated with acquiring them. Demand-side active and passive storage systems are proposed as technologies that may be used to mitigate the effects of intermittence due to renewable generation. Commercial building technologies as well as industrial facilities with storage capability are identified as targets for the field tests. Two systems used for ancillary services communications are identified as providing the triggers for DR enablement. Through the field tests, issues related to communication, automation and flexibility of demand-side resources will be explored and the performance of technologies that participate in the field tests will be evaluated. The major outcome of this research is identifying and defining flexibility of DR resources and optimized use of these resources to respond to grid conditions.
Authors Year Title LBNL#
S. Kiliccote, P. N. Price, M. A. Piette, G. C. Bell, S. Pierson, E. Koch, J. Carnam, H. Pedro, J. Hernandez and A. K. Chiu
2012
Field Testing of Automated Demand Response for Integration of Renewable Resources in California’s Ancillary Services Market for Regulation Products
LBNL-5556E
Increasing renewable generation resources supply electricity to 33% by 2020 in California will require solving several problems simultaneously. In California, 33% penetration of
renewable generation resources propose four major challenges: 1) unpredictable and steep ramps; 2) making up for errors in forecasting these resources; 3) intra-hour variability; and 4) over generation in the middle of the night. Storage and demand response are being proposed as ways to address these challenges. Following successful tests using demand response for non-spinning reserves in California Independent System Operator’s ancillary services market, we explored the use of demand response for regulation up and down products in the same market. Regulation is the capability to inject or withdraw power from resources in response to automatic generator control signals to meet the Area Control Error needs of the Independent System Operator. Resources participating in regulation are characterized and certified to meet certain requirements. The objectives of this project were to evaluate if the demand response resources could meet the requirements to replace the generators in this market and if OpenADR would be able to meet the communication speed requirements. Three facilities were recruited to the project: two campuses and one agricultural pumping station. Each site was equipped with an OpenADR client that could receive the automatic generator control signals converted into OpenADR information exchange model. The results showed that 1) the pseudo generator model did not work well for demand response resources; 2) converting automatic generator control signals to OpenADR signals did not introduce significant communication delays; 3) accuracy of load forecasts may introduce significant problems with demand response participation; and 4) latencies due to the facility control system may be a major barrier.
Task R.5 - 24/7 Demand Response
Authors Year Title LBNL#
D. S. Watson, N. Matson, J. Page, S. Kiliccote, M. A. Piette, K. Corfee, B. Seto, R. Masiello, J. Masiello, L. Molander, S. Golding, K. Sullivan, W. Johnson and D. Hawkins
2012
Fast Automated Demand Response to Enable the Integration of Renewable Resources
LBNL-5555E
This study examines how fast automated demand response (AutoDR) can help mitigate grid balancing challenges introduced by upcoming increases in intermittent renewable generation resources such as solar and wind in an environmentally friendly and cost effective manner. This study gathers data from multiple sources to determine the total electric end-use loads in the commercial and industrial sectors of California. The shed capacity available from AutoDR in these sectors varies based on many factors including weather, time of year and time of day. This study estimates that the lowest shed capacity could occur on cold winter mornings and the highest on hot summer afternoons. Based on this analysis, a large-scale deployment of fast AutoDR could provide between 0.18 and 0.90 GW of DR-based ancillary services from the existing stock of commercial and industrial facilities throughout California. With modest investments to upgrade and expand use of automated control systems in commercial and industrial facilities the estimated shed potential could approximately double to between 0.42 and 2.07 GW. Deployed costs for fast
AutoDR (installation, materials, labor and program management) are about 10% of the deployed costs of grid scale battery storage. However, AutoDR in California has less capacity than what is required to meet the grid balancing challenges introduced by the 2020 renewable portfolio standard goals. There are many different types of ancillary services necessary to keep the electric grid in balance. Though AutoDR may not be suitable for all forms of ancillary services, the lower installed cost of AutoDR indicates that it should be considered for use in the time domains and capacities for which it is applicable. By combining AutoDR with traditional gas fired thermal generation and battery storage technologies, an optimal mix of generation, AutoDR and storage should be considered to meet upcoming challenges introduced by the increased use of renewable generation.
Task DE - Analysis of Always Available DR and EE Effectiveness (WA1-9.4-1 )
Authors Year Title LBNL#
P.N. Price, N. Addy and S. Kiliccote
2015
Predictability and Persistence of Demand Response Load Shed in Buildings
LBNL-187399
We analyze data from 36 commercial and government buildings that participated in a Demand Response program in California, to investigate the extent to which Demand Response (DR) load shed in each building depends on outdoor air temperature, and whether the load shed varies systematically from year to year. Our baseline model has substantially lower error than other standard models but uncertainty in the load shed is still an impediment to addressing these questions. The model is accurate enough in 29 buildings to be used to investigate the relationship between outdoor temperature and the DR load shed, and data availability and accuracy are sufficient to investigate year-to-year persistence of load shed in 19 buildings. We find that for buildings in this dataset, most buildings shed several percent of their load during DR events. In about two thirds of buildings, higher outdoor air temperature lead to slightly reduced load shed. Year-to-year changes in load shed were generally small, except that in several buildings the load shed was small or nonexistent in the first year of participation in the program and increased subsequently.
Task SD - Scaled Deployment (WA3-8.1-2)
Authors Year Title LBNL#
S. Kiliccote, D. Olsen, M. Sohn and M.A. Piette
2015
Characterization of Demand Response in the Commercial, Industrial, and Residential Sectors in the U.S.
Wiley Interdisciplinary Review, June 2015
The goal of this paper is to provide an overview of demand response (DR) technologies, including standards and end uses, in the United States and describe resource characteristics and the attributes of 14 specific DR resources in the U.S. commercial, residential, and
industrial sectors. The attributes reviewed for the end uses being considered are response frequency, response time, the need for and impacts of energy pre- or re-charge, the cost of enabling a resource to respond to a load-curtailment signal, and the magnitude of load curtailment in a given resource. We also describe controls and communications technologies that can enable end uses to participate in DR programs. The characterization was initially developed as a foundational work to quantify hourly availability of DR resources from the selected end uses followed by a multi-laboratory effort that quantified DR’s value within the Western Interconnection.
Task SG - LLNL Smart Grid (WA2-8.1-1)
Authors Year Title LBNL#
D. Olsen, M. Sohn, M.A. Piette and S. Kiliccote
2015
Demand Response Availability Profiles for California in the Year 2020
Input to Livermore study
Demand response (DR) is being considered as a valuable resource for keeping the electrical grid stable and efficient, and deferring upgrades to generation, transmission, and distribution systems. However, simulations to determine how much infrastructure upgrades can be deferred are necessary in order to plan optimally. Production cost modeling is a simulation technique, which simulates the dispatch of generators to meet demand and reserves in each hour of the year, at minimal cost. By integrating demand response resources into a production cost model (PCM), their value to the grid can be estimated and used to inform operations and infrastructure planning. DR availability profiles and constraints for 13 end-uses in California for the year 2020 were developed by Lawrence Berkeley National Laboratory (LBNL), and integrated into a production cost model by Lawrence Livermore National Laboratory (LLNL), for the California Energy Commission’s Value of Energy Storage and Demand Response for Renewable Integration in California Study. This report summarizes the process for developing the DR availability profiles for California, and their aggregate capabilities. While LBNL provided potential DR hourly profiles for regulation product in the ancillary services market and five-minute load following product in the energy market for LLNL’s study, additional results in contingency reserves and an assumed flexible product are also defined. These products are included in the analysis for managing high ramps and capacity products and are also presented.
D1
Appendix D – DR Value and Programs, Implementation of DR Report Abstracts DR Values and Programs
Task 3.2 - Programs & Tariffs
Authors Year Title LBNL#
C. A. Goldman, N. C. Hopper, O. Sezgen, M. M. Moezzi, R. Bharvirkar, B. Neenan, R. Boisvert, P. Cappers and D. Pratt
2004
Customer Response to Day-ahead Wholesale Market Electricity Prices: Case Study of RTP Program Experience in New York
LBNL-54761
There is growing interest in policies, programs and tariffs that encourage customer loads to provide demand response (DR) to help discipline wholesale electricity markets. Proposals at the retail level range from eliminating fixed rate tariffs as the default service for some or all customer groups to reinstituting utility-sponsored load management programs with market-based inducements to curtail. Alternative rate designs include time-of-use (TOU), day-ahead real-time pricing (RTP), critical peak pricing, and even pricing usage at real-time market balancing prices. Some Independent System Operators (ISOs) have implemented their own DR programs whereby load curtailment capabilities are treated as a system resource and are paid an equivalent value. The resulting load reductions from these tariffs and programs provide a variety of benefits, including limiting the ability of suppliers to increase spot and long-term market-clearing prices above competitive levels. Unfortunately, there is little information in the public domain to characterize and quantify how customers actually respond to these alternative dynamic pricing schemes. A few empirical studies of large customer RTP response have shown modest results for most customers, with a few very price-responsive customers providing most of the aggregate response. However, these studies examined response to voluntary, two-part RTP programs implemented by utilities in states without retail competition. Furthermore, the researchers had limited information on customer characteristics so they were unable to identify the drivers to price response. In the absence of a compelling characterization of why customers join RTP programs and how they respond to prices, many initiatives to modernize retail electricity rates seem to be stymied. This study attempts to address some of these information gaps through an in-depth case study of 149 large commercial and industrial customer accounts served by Niagara Mohawk Power Corporation (NMPC).
C. A. Goldman, N. C. Hopper, O. Sezgen, M. M. Moezzi, R. Bharvirkar, B. Neenan, D. Pratt, P. Cappers and R. Boisvert
2004
Does Real-Time Pricing Deliver Demand Response? A Case Study of Niagara Mohawk's Large Customer RTP Tariff
LBNL-54974
Real-time pricing (RTP) is advocated as the most economically efficient way to invoke demand response (DR) benefits, yet actual customer experience is limited and thinly documented. This study examines the experience of 130 large (over 2 MW) industrial, commercial and institutional customers at Niagara Mohawk Power Corporation that have faced day-ahead electricity market prices as their default tariff since 1998. It is the first study of large customer response to RTP in the context of retail competition. Through a survey and interviews, we examine how customers adapted to RTP (their satisfaction, hedging choices, adoption of DR-enabling technologies and response capability), and we combined survey information with customer billing data to quantify price response. We find that customers are relatively satisfied. In 2003, 50-55% of customers were exposed to RTP; many say they’d prefer to hedge but attractively priced options are rare. Only 45% of survey respondents have installed DR-enabling technologies since 1998. 54% indicated they were not price responsive at all; of the rest, most employ “low-tech” curtailment strategies and do not reschedule usage. Average price response estimates are modest: the overall substitution elasticity is 0.14. Surprisingly, government/educational customers display the highest response (0.30); industrial response is similar to past research findings (0.11) and commercial customers are least responsive (0.00). New York Independent System Operator DR programs significantly boost industrial participants’ price response when events are called. Default RTP does deliver modest DR benefits, but is best viewed as part of a portfolio of DR options.
Authors Year Title LBNL#
M. M. Moezzi, C. A. Goldman, O. Sezgen, R. Bharvirkar and N. C. Hopper
2004
Real Time Pricing and the Real Live Firm
LBNL-54978
Energy economists have long argued the benefits of real time pricing (RTP) of electricity. Their basis for modeling customers’ response to short-term fluctuations in electricity prices are based on theories of rational firm behavior, where management strives to minimize operating costs and optimize profit, and labor, capital and energy are potential substitutes in the firm’s production function. How well do private firms and public sector institutions’ operating conditions, knowledge structures, decision-making practices, and external relationships comport with these assumptions and how might this impact price response? We discuss these issues on the basis of interviews with 29 large (over 2 MW) industrial, commercial, and institutional customers in the Niagara Mohawk Power Corporation
service territory that have faced day-ahead electricity market prices since 1998. We look at stories interviewees told about why and how they respond to RTP, why some customers report that they can’t, and why even if they can, they don’t. Some firms respond as theorized, and we describe their load curtailment strategies. About half of our interviewees reported that they were unable to either shift or forego electricity consumption even when prices are high ($0.50/kWh). Reasons customers gave for why they weren’t price-responsive include implicit value placed on reliability, pricing structures, lack of flexibility in adjusting production inputs, just-in-time practices, perceived barriers to onsite generation, and insufficient time. We draw these observations into a framework that could help refine economic theory of dynamic pricing by providing real-world descriptions of how firms behave and why.
Authors Year Title LBNL#
C. A. Goldman, N. C. Hopper, R. Bharvirkar, B. Neenan, R. Boisvert, P. Cappers, D. Pratt and K. Butkins
2006
Customer Strategies for Responding to Day-Ahead Market Hourly Electricity Pricing
LBNL-57128
Real-time pricing (RTP) has been advocated as an economically efficient means to send price signals to customers to promote demand response (DR). However, limited information exists that can be used to judge how effectively RTP actually induces DR, particularly in the context of restructured electricity markets. This report describes the second phase of a study of how large, non-residential customers’ adapted to default-service day-ahead hourly pricing. The customers are located in upstate New York and served under Niagara Mohawk Power Corporation (NMPC)’s SC-3A rate class. The SC-3A tariff is a type of RTP that provides firm, day ahead notice of hourly varying prices indexed to New York Independent System Operator (NYISO) day-ahead market prices. The study was funded by the California Energy Commission (CEC)’s PIER program through the Demand Response Research Center (DRRC). NMPC’s is the first and longest-running default-service RTP tariff implemented in the context of retail competition. The mix of NMPC’s large customers exposed to day-ahead hourly prices is roughly 30% industrial, 25% commercial and 45% institutional. They have faced periods of high prices during the study period (2000-2004), thereby providing an opportunity to assess their response to volatile hourly prices. The nature of the SC-3A default service attracted competitive retailers offering a wide array of pricing and hedging options, and customers could also participate in demand response programs implemented by NYISO. The first phase of this study examined SC-3A customers’ satisfaction, hedging choices and price response through in-depth customer market research and a Constant Elasticity of Substitution (CES) demand model. This second phase was undertaken to answer questions that remained unresolved and to quantify price response to a higher level of granularity. We accomplished these objectives with a second customer survey and interview effort, which resulted in a higher, 76% response rate, and the adoption of the more flexible Generalized Leontief (GL)
demand model, which allows us to analyze customer response under a range of conditions (e.g. at different nominal prices) and to determine the distribution of individual customers’ response.
Authors Year Title LBNL#
G. L. Barbose, C. A. Goldman, R. Bharvirkar, N. C. Hopper, M. K. Ting and B. Neenan
2006
Real Time Pricing as a Default or Optional Service for Commercial and Industrial Customers: A Comparative Analysis of Eight Case Studies
LBNL-57661
Demand response (DR) is broadly recognized to be an integral component of well-functioning electricity markets, but currently underdeveloped in most regions. In recent years, there has been renewed interest among a number of public utility commissions (PUC) and utilities in implementing real-time pricing (RTP), typically for large commercial and industrial (C&I) customers, as a strategy for developing greater levels of DR. Such efforts typically face a set of key policy and program design issues, including:
• How to organize the process for developing and implementing RTP in a manner that facilitates productive participation by the relevant stakeholder groups;
• Whether to designate RTP as an optional or default service, and for which customer classes;
• What type of tariff design to adopt given prevailing policy objectives, wholesale market structure, ratemaking practices and standards, and customer preferences; and
• What types of supplemental activities (e.g., customer education, deployment of enabling technologies) are appropriate to facilitate customer participation and price response.
Given resolution of these design and implementation issues, a key question for policymakers is how much DR can ultimately be expected from RTP, which requires analyzing customers' willingness to be exposed to dynamic hourly prices over a sustained time period and their actual price responsiveness.
Authors Year Title LBNL#
N. C. Hopper, C. A. Goldman and B. Neenan
2006
Not All Large Customers Are Made Alike: Disaggregating Response to Default-Service Day-Ahead Market Pricing
LBNL-59629
For decades, policymakers and program designers have gone on the assumption that large customers, particularly industrial facilities, are the best candidates for real-time pricing (RTP). This assumption is based partly on practical considerations (large customers can provide potentially large load reductions) but also on the premise that businesses focused on production cost minimization are most likely to participate and respond to opportunities for bill savings. Yet few studies have examined the actual price response of
large industrial and commercial customers in a disaggregated fashion, nor have factors such as the impacts of demand response (DR) enabling technologies, simultaneous emergency DR program participation and price response barriers been fully elucidated. This second-phase case study of Niagara Mohawk Power Corporation (NMPC)’s large customer RTP tariff addresses these information needs. The results demonstrate the extreme diversity of large customers’ response to hourly varying prices. While two-thirds exhibit some price response, about 20% of customers provide 75-80% of the aggregate load reductions. Manufacturing customers are most price-responsive as a group, followed by government/education customers, while other sectors are largely unresponsive. However, individual customer response varies widely. Currently, enabling technologies do not appear to enhance hourly price response; customers report using them for other purposes. The New York Independent System Operator (NYISO)’s emergency DR programs enhance price response, in part by signaling to customers that day-ahead prices are high. In sum, large customers do currently provide moderate price response, but there is significant room for improvement through targeted programs that help customers develop and implement automated load-response strategies.
Authors Year Title LBNL#
N. C. Hopper, C. A. Goldman and B. Neenan
2006
Killing Two Birds with One Stone: Can Real-Time Pricing Support Retail Competition and Demand Response?
LBNL-59739
As retail choice states reach the end of their transitional, rate-cap periods, state regulators must decide what type of default supply service to provide to customers that have not switched to a competitive retail supplier. In a growing number of states, regulators have adopted real-time pricing (RTP) as the default service for large commercial and industrial (C&I) customers. Although this trend is driven chiefly by policy objectives related to retail competition, default service RTP may have the added benefit of stimulating demand response. To evaluate the potential role of RTP as a means to both ends – retail market development and demand response – we conducted a comprehensive review of experience with default RTP in the U.S. and examined the emergence of RTP as a product offering by competitive retail suppliers. Across the ten utilities with default RTP in place in 2005, between 5% and 35% of the applicable load remained on the rate. Based on interviews with competitive retailers, we find evidence to suggest that a comparable amount of load in these states has switched to hourly pricing arrangements with competitive retailers. Many customers on default or competitive hourly pricing are paying prices indexed to the real-time spot market, and thus have no advance knowledge of prices. Because the price responsiveness of customers under these conditions has yet to be formally analyzed, and relatively few efforts have been undertaken to help these customers become price responsive, the actual demand response impacts from hourly pricing in retail choice states remains largely an open question. However, we find that policymakers and other stakeholders in retail choice states have various strategies at their disposal to capture the
potential demand response benefits from hourly pricing, while simultaneously supporting retail competition.
Task 4.F - DR Value - Summit Blue
Authors Year Title LBNL#
D. Violette
2006
Development of a Comprehensive / Integrated DR Value Framework
LBNL-60130
This report addresses the research and development objectives of the Research Opportunity Notice RON – 1 issued by the Demand Response Research Center (DRRC). The DRRC was created by the California Energy Commission (ENERGY COMMISSION) and charged with conducting and disseminating near-term research that advances the multi-institutional needs for demand response (DR) in California. The objective is the description of a “comprehensive DR conceptual evaluation framework” (from RON – 1 R&D Objectives). This will involve developing and describing approaches, processes, and procedures for making good decisions regarding the role of DR in regional California electric markets. The framework that is described in this document uses as its organizing focus the investment decision in DR, i.e., what information is needed to make good decisions regarding the appropriate investment in DR to lower overall system costs and achieve market-wide objectives. This method is also designed to be able to address different stakeholder objectives. The report develops a “problem statement” for the valuation of DR, and an assessment of needs and objectives that should be met by a comprehensive valuation framework. The report presents an approach to developing a comprehensive valuation framework that consists of four Task Work Areas: 1) Price effects from DR portfolios; 2) Transmission investment avoided/deferred costs; 3) Distribution investment deferred costs; and 4) Market effects focusing on hard to quantify benefits.
Task 4.G - DR Value - E3
Authors Year Title LBNL#
R. Orans and I. Energy and Environmental Economics
2006
Phase 1 Results: Establish the Value of Demand Response
LBNL-60128
This report describes the work performed in response to the Demand Response Research Center’s Research Opportunity Notice DRRC RON-01: "Establish the Value of Demand Response." A research team led by Energy and Environmental Economics, Inc. (E3) reviews approaches for demand response (DR) valuation applied in California and other states, and recommends an approach for developing a comprehensive DR valuation methodology. The review identifies no complete DR valuation framework that can be applied directly in California, and recommends the current standard practice for cost benefit analysis of energy efficiency be modified to capture the attributes of DR. The team identifies a
minimum of six gaps in the existing standard practice that need to be addressed to appropriately value demand response. A Phase 2 proposal is developed to address these gaps, and others that may be identified, in a stakeholder process.
Task 4.H - DR Tariff - Christensen Assoc
Authors Year Title LBNL#
S. D. Braithwait, D. Hansen and L. Kirsch
2006
Incentives and Rate Designs for Efficiency and Demand Response
LBNL-60132 Collaboration Report
This report develops a conceptual framework for designing retail electricity rate structures that provide appropriate incentives for energy efficiency and demand response. The conceptual framework is based upon well-established economic theory of public utility pricing going back at least twenty years, and upon power industry experience of a similar length of history. The emphasis within this document is on the proper application of pricing principles in designing a portfolio of products that will produce the efficient amount of demand response. The report also describes prototype rate designs that illustrate the types of retail rates that provide these incentives. Finally, the report includes a proposed plan for a follow-on Phase II effort that will demonstrate the use of the framework as a tool for long-term research concerning electricity pricing, and will develop, through a utility case study, specific recommended rate structures for use by the California utilities.
Task 4.I - DR Tariff - E3
Authors Year Title LBNL#
R. Orans and I. Energy and Environmental Economics
2006
Phase 1 Results: Incentives and Rate Design for Energy Efficiency and Demand Response
LBNL-60133
This proposal describes the work performed in response to the Demand Response Research Center’s Research Opportunity Notice DRRC RON-02, “Incentives and Rate Design for Energy Efficiency and Demand Response.” A research team led by Energy and Environmental Economics, Inc. (E3) creates, and validates as a proof of concept, an analytical framework for evaluating incentives and rate design for demand response. The framework consists of a number of screens that evaluate different aspects of DR rate design performance. The assessment includes economic efficiency and fit with the California emerging market structure, potential for significant load reduction, value to the system and customers, potential bill savings, and customer acceptance. Taken together, the screening steps should help to ensure that a DR rate design that scores highly against these criteria would be implementable within the California market, regulatory, and policy context. The E3 team then evaluates illustrative DR rate designs with the evaluation framework as a
proof of concept. The analysis, which is completed without input from stakeholders, uses only readily available or proxy data, and therefore the results are not necessarily meaningful beyond a validation of the concept. In Phase 2, the research team proposes further refinement of the analytical process through collaboration with all of the major stakeholders (customers, California ISO, utilities, 3rd party DR providers, and regulators) in the further development of demand response incentive and rate designs.
Task 6.F - DR Behavior - RIA
Authors Year Title LBNL#
S. Lutzenhiser, J. S. Peters, M. M. Moezzi and J. Woods
2009
Beyond the Price Effect in Time-of-Use Programs: Results from a Municipal Utility Pilot, 2007-2008
LBNL-2750e
This paper discusses results of a two-year collaborative research project between the authors and the Demand Response Research Center focused on behavioral response to a voluntary time-of-use pilot rate offered by the Sacramento Municipal Utilities District (SMUD) under the PowerChoice label. The project had two purposes: one was to assess the potential for increasing demand response through the introduction of enhanced information and real-time consumption feedback; the second was to better understand behavioral response to a TOU rate. Three successive waves of telephone surveys collected details about reasons for participation, actions taken, capacities and constraints to altering behavior, and a range of salient conditions, such as demographics and dwelling characteristics. Pre- and post-program interval meter data for participants and a comparison sample of households were also collected and analyzed to consider initial and season-change price effects of the rate and the effect of supplemental information treatments on response. Over half of surveyed participating households reported that they had made a great deal of effort to adjust their electricity consumption to the rate. Despite this, load data analysis revealed only minimal price effects; and, though households subjected to information treatments seemed to have learned from these treatments, load data analysis again detected only minimal effects on load. Given the currently high hopes for behavioral intervention and residential TOU rates, these unexpected results require explanation. We suggest a number of possibilities and discuss some implications for TOU programs, and for understanding demand response behavior and approaches to experiments with TOU rates.
Authors Year Title LBNL#
J. S. Peters, M. M. Moezzi, S. Lutzenhiser, J. Woods, L. Dethman and R. Kunkle
2009
Powerchoice Residential Customer Response to TOU Rates
Research Into Action, Inc. and the Sacramento Municipal Utility District (SMUD) worked together to conduct research on the behaviors and energy use patterns of SMUD residential customers who voluntarily signed on to a Time-of-Use rate pilot launched under the PowerChoice label. The project was designed to consider the how and why of residential customers’ ability and willingness to engage in demand reduction behaviors, and to link social and behavioral factors to observed changes in demand. The research drew on a combination of load interval data and three successive surveys of participating households. Two experimental treatments were applied to test the effects of increased information on households’ ability to respond to the Time-of-Use rates. Survey results indicated that participants understood the purpose of the Time-of-Use rate and undertook substantial appropriate actions to shift load and conserve. Statistical tests revealed minor initial price effects and more marked, but still modest, adjustments to seasonal rate changes. Tests of the two information interventions indicated that neither made much difference to consumption patterns. Despite the lackluster statistical evidence for load shifting, the analysis points to key issues for critical analysis and development of residential Time-of-Use rates, especially pertinent as California sets the stage for demand response in more California residences.
Task 6.G - DR Behavior - HMG
Authors Year Title LBNL#
K. Herter, S. Wayland and J. Rasin
2009
A Successful Case Study of Small Business Energy Efficiency and Demand Response with Communicating Thermostats
LBNL-2743e
This report documents a field study of 78 small commercial customers in the Sacramento Municipal Utility District service territory who volunteered for an integrated energy-efficiency/ demand-response (EE-DR) program in the summer of 2008. The original objective for the pilot was to provide a better understanding of demand response issues in the small commercial sector. Early findings justified a focus on offering small businesses (1) help with the energy efficiency of their buildings in exchange for occasional load shed, and (2) a portfolio of options to meet the needs of a diverse customer sector. To meet these expressed needs, the research pilot provided on-site energy efficiency advice and offered participants several program options, including the choice of either a dynamic rate or monthly payment for air-conditioning setpoint control. Overall results show that pilot participants had energy savings of 20%, and the potential for an additional 14% to 20% load drop during a 100°F demand response event. In addition to the efficiency-related bill savings, participants on the dynamic rate saved an estimated 5% on their energy costs compared to the standard rate. About 80% of participants said that the program met or surpassed their expectations, and three-quarters said they would probably or definitely participate again without the $120 participation incentive. These results provide evidence that energy efficiency programs, dynamic rates and load control programs can be used
concurrently and effectively in the small business sector, and that communicating thermostats are a reliable tool for providing air-conditioning load shed and enhancing the ability of customers on dynamic rates to respond to intermittent price events.
Task 6.L - DR Value - Grayson Heffner
Authors Year Title LBNL#
G. C. Heffner
2009
Demand Response Valuation Frameworks Paper
LBNL-2489E
While there is general agreement that demand response (DR) is a valued component in a utility resource plan, there is a lack of consensus regarding how to value DR. Establishing the value of DR is a prerequisite to determining how much and what types of DR should be implemented, to which customers DR should be targeted, and a key determinant that drives the development of economically viable DR consumer technology. Most approaches for quantifying the value of DR focus on changes in utility system revenue requirements based on resource plans with and without DR. This "utility centric" approach does not assign any value to DR impacts that lower energy and capacity prices, improve reliability, lower system and network operating costs, produce better air quality, and provide improved customer choice and control. Proper valuation of these benefits requires a different basis for monetization. The review concludes that no single methodology today adequately captures the wide range of benefits and value potentially attributed to DR. To provide a more comprehensive valuation approach, current methods such as the Standard Practice Method (SPM) will most likely have to be supplemented with one or more alternative benefit-valuation approaches. This report provides an updated perspective on the DR valuation framework. It includes an introduction and four chapters that address the key elements of demand response valuation, a comprehensive literature review, and specific research recommendations.
Task SD - Scaled Deployment (WA3-8.1-2)
Authors Year Title LBNL#
M.A. Piette, O. Schetrit, S. Kiliccote, I. Cheung and B. Li
2015
Costs to Automate Demand Response – Taxonomy and Results from Field Studies and Programs
LBNL-1003924
During the past decade, the technology to automate demand response (DR) in buildings and industrial facilities has advanced significantly. Automation allows rapid, repeatable, reliable operation. This study focuses on costs for DR automation in commercial buildings with some discussion or residential buildings and industrial facilities. DR automation technology relies on numerous components, including communication systems, hardware and software gateways, standards-based messaging protocols, controls and integration platforms, and measurement and telemetry systems. This paper compares cost data from
several DR automation programs and pilot projects, evaluates trends in the cost per unit of DR and kilowatts (kW) available from automated systems, and applies a standard naming convention and classification or taxonomy for system elements. Median costs for the 56 installed automated DR systems are about $200/kW. The range around this median is large with costs in some cases being only ten times less or ten times more than the median.. This wide range is a result of variations in system age, size of load reduction, sophistication, and type of equipment included in cost analysis. One original goal of DR automation standards was to facilitate development of interoperable software, to reduce automated DR system cost. If standard DR software systems are already part of a building’s control software, there is no need for new hardware to automate an existing, non-automated DR system. The newest (2013) version of California’s building code, Title 24, requires automated DR capabilities for lighting; heating, ventilation, and air conditioning; and electronic messaging centers (Ghatikar et al, 2015). These new control requirements for Title 24 also include acceptance tests. Thus, the cost to automate DR in buildings that comply with the 2013 building code may be far less than the costs of retrofitting an existing building’s DR system to automate it. The costs to automate fast DR systems for ancillary services are not fully analyzed in this report because additional research is needed to determine the total cost to install, operate, and maintain these systems. However, recent research suggests that they could be developed at costs similar to those of existing hot-summer DR automation systems. This report covers only installation and configuration costs and does include the costs of owning and operating these systems. Future analysis of the latter costs should include the costs to the building or facility manager costs as well as utility or third party program manager cost.
OpenADR Implementation
Task 5.1 - Statewide AutoDR IOU/ISO 2006
Authors Year Title LBNL#
M. A. Piette, D. S. Watson, N. Motegi, S. Kiliccote and E. Linkugel
2006
Participation through Automation: Fully Automated Critical Peak Pricing in Commercial Buildings
LBNL-60614
California electric utilities have been exploring the use of dynamic critical peak prices (CPP) and other demand response programs to help reduce peaks in customer electric loads. CPP is a tariff design to promote demand response. Levels of automation in DR can be defined as follows. Manual Demand Response involves a potentially labor-intensive approach such as manually turning off or changing comfort set points at each equipment switch or controller. Semi-Automated Demand Response involves a pre-programmed response strategy initiated by a person via centralized control system. Fully Automated Demand Response does not involve human intervention, but is initiated at a home, building, or facility through receipt of an external communications signal. The receipt of
the external signal initiates pre-programmed demand response strategies. We refer to this as Auto-DR. This paper describes the development, testing, and results from automated CPP (Auto-CPP) as part of a utility project in California. The paper presents the project description and test methodology. This is followed by a discussion of Auto-DR strategies used in the field test buildings. We present a sample Auto-CPP load shape case study, and a selection of the Auto-CPP response data from September 29, 2005. If all twelve sites reached their maximum saving simultaneously, a total of approximately 2 MW of DR is available from these twelve sites that represent about two million ft2. The average DR was about half that value, at about 1 MW. These savings translate to about 0.5 to 1.0 W/ft2 of demand reduction. We are continuing field demonstrations and economic evaluations to pursue increasing penetrations of automated DR that has demonstrated ability to provide a valuable DR resource for California.
Authors Year Title LBNL#
M. A. Piette, D. S. Watson, N. Motegi and S. Kiliccote
2007
Automated Critical Peak Pricing Field Tests: 2006 Pilot Program Description and Results
LBNL-62218
During 2006 Lawrence Berkeley National Laboratory (LBNL) and the Demand Response Research Center (DRRC) performed a technology evaluation for the Pacific Gas and Electric Company (PG&E) Emerging Technologies Programs. This report summarizes the design, deployment, and results from the 2006 Automated Critical Peak Pricing Program (Auto-CPP). The program was designed to evaluate the feasibility of deploying automation systems that allow customers to participate in critical peak pricing (CPP) with a fully-automated response. The 2006 program was in operation during the entire six-month CPP period from May through October.
Authors Year Title LBNL#
N. Motegi, M. A. Piette, D. S. Watson, S. Kiliccote and P. Xu
2007
Introduction to Commercial Building Control Strategies and Techniques for Demand Response
LBNL-59975
Demand Response (DR) is a set of time-dependent program activities and tariffs that seek to reduce electricity use or shift usage to another time period. DR provides control systems that encourage load shedding or load shifting during times when the electric grid is near its capacity or electricity prices are high. DR helps to manage building electricity costs and to improve electric grid reliability. This report provides an introduction to commercial building control strategies and techniques for demand response. Many electric utilities have been exploring the use of critical peak pricing (CPP) and other demand response programs to help reduce summer peaks in customer electric loads. This report responds to an identified need among building operators for knowledge to use DR strategies in their buildings. These strategies can be implemented using either manual or automated
methods. The report compiles information from field demonstrations of DR programs in commercial buildings. The guide provides a framework for categorizing the control strategies that have been tested in actual buildings. The guide’s emphasis is on characterizing and describing DR control strategies for air-conditioning and ventilation systems. There is also good coverage of lighting control strategies. The guide provides some additional introduction to DR strategies for other miscellaneous building end-use systems and non-component-based DR strategies. The core information in this report is based on DR field tests in 28 non-residential buildings, most of which were in California, and the rest of which were in New York State. The majority of the participating buildings were office buildings. Most of the California buildings participated in fully automated demand response field tests.
Authors Year Title LBNL#
J. H. Dudley, M. A. Piette and S. Kiliccote
2008
Field Test Results of Automated Demand Response in a Large Office Building
LBNL-1131e
Demand response (DR) is an emerging research field and an effective tool that improves grid reliability and prevents the price of electricity from rising, especially in deregulated markets. This paper introduces the definition of DR and Automated Demand Response (Auto-DR). It describes the Auto-DR technology utilized at a commercial building in the summer of 2006 and the methodologies to evaluate associated demand savings. On the basis of field tests in a large office building, Auto-DR is proven to be a reliable and credible resource that ensures a stable and economical operation of the power grid.
Authors Year Title LBNL#
M. A. Piette, S. Kiliccote and G. Ghatikar
2008
Linking Continuous Energy Management and Open Automated Demand Response
LBNL-1361E
Advances in communications and control technology, the strengthening of the Internet, and the growing appreciation of the urgency to reduce demand side energy use are motivating the development of improvements in both energy efficiency and demand response (DR) systems. This paper provides a framework linking continuous energy management and continuous communications for automated demand response (Auto-DR) in various times scales. We provide a set of concepts for monitoring and controls linked to standards and procedures such as Open Automation Demand Response Communication Standards (Open Auto-DR or OpenADR). Basic building energy science and control issues in this approach begin with key building components, systems, end-uses and whole building energy performance metrics. The paper presents a framework about when energy is used, levels of services by energy using systems, granularity of control, and speed of telemetry. DR, when defined as a discrete event, requires a different set of building service
levels than daily operations. We provide examples of lessons from DR case studies and links to energy efficiency.
Authors Year Title LBNL#
S. Kiliccote and M. A. Piette
2008
Automation of Capacity Bidding with an Aggregator Using Open Automated Demand Response
LBNL-4383E
This report summarizes San Diego Gas & Electric Company’s collaboration with the Demand Response Research Center to develop and test automation capability for the Capacity Bidding Program in 2007. The report describes the Open Automated Demand Response architecture, summarizes the history of technology development and pilot studies. It also outlines the Capacity Bidding Program and technology being used by an aggregator that participated in this demand response program. Due to delays, the program was not fully operational for summer 2007. However, a test event on October 3, 2007, showed that the project successfully achieved the objective to develop and demonstrate how an open, Web-based interoperable automated notification system for capacity bidding can be used by aggregators for demand response. The system was effective in initiating a fully automated demand response shed at the aggregated sites. This project also demonstrated how aggregators can integrate their demand response automation systems with San Diego Gas & Electric Company’s Demand Response Automation Server and capacity bidding program.
\
Authors Year Title LBNL#
K. Coughlin, M. A. Piette, C. A. Goldman and S. Kiliccote
2009
Statistical analysis of baseline load models for non-residential buildings
LBNL-4984E
Policymakers are encouraging the development of standardized and consistent methods to quantify the electric load impacts of demand response programs. For load impacts, an essential part of the analysis is the estimation of the baseline load profile. In this paper, we present a statistical evaluation of the performance of several different models used to calculate baselines for commercial buildings participating in a demand response program in California. In our approach, we use the model to estimate baseline loads for a large set of proxy event days for which the actual load data are also available. Measures of the accuracy and bias of different models, the importance of weather effects, and the effect of applying morning adjustment factors (which use data from the day of the event to adjust the estimated baseline) are presented. Our results suggest that (1) the accuracy of baseline load models can be improved substantially by applying a morning adjustment, (2) the characterization of building loads by variability and weather sensitivity is a useful indicator of which types of baseline models will perform well, and (3) models that incorporate temperature either improve the accuracy of the model fit or do not change it.
S. Kiliccote, M. A. Piette, G. Wikler, J. Prijyanonda and A. K. Chiu
2008
Installation and Commissioning Automated Demand Response Systems
LBNL-187E
From 2003 through 2006 Lawrence Berkeley National Laboratory (LBNL) and the Demand Response Research Center (DRRC) developed and tested a series of demand response automation communications technologies known as Automated Demand Response (Auto-DR). In 2007, LBNL worked with three investor-owned utilities to commercialize and implement Auto-DR programs in their territories. This paper summarizes the history of technology development for Auto-DR, and describes the DR technologies and control strategies utilized at many of the facilities. It outlines early experience in commercializing Auto-DR systems within PG&E DR programs, including the steps to configure the automation technology. The paper also describes the DR sheds derived using three different baseline methodologies. Emphasis is given to the lessons learned from installation and commissioning of Auto-DR systems, with a detailed description of the technical coordination roles and responsibilities, and costs.
Authors Year Title LBNL#
K. Coughlin, M. A. Piette, C. A. Goldman and S. Kiliccote
2008
Estimating Demand Response Load Impacts: Evaluation of Baseline Load Models for Non-Residential Buildings in California
LBNL-63728
Both Federal and California state policymakers are increasingly interested in developing more standardized and consistent approaches to estimate and verify the load impacts of demand response programs and dynamic pricing tariffs. This study describes a statistical analysis of the performance of different models used to calculate the baseline electric load for commercial buildings participating in a demand-response (DR) program, with emphasis on the importance of weather effects. During a DR event, a variety of adjustments may be made to building operation, with the goal of reducing the building peak electric load. In order to determine the actual peak load reduction, an estimate of what the load would have been on the day of the event without any DR actions is needed. This baseline load profile (BLP) is key to accurately assessing the load impacts from event-based DR programs and may also impact payment settlements for certain types of DR programs. We tested seven baseline models on a sample of 33 buildings located in California. These models can be loosely categorized into two groups: (1) averaging methods, which use some linear combination of hourly load values from previous days to predict the load on the event, and (2) explicit weather models, which use a formula based on local hourly temperature to predict the load. The models were tested both with and without morning
adjustments, which use data from the day of the event to adjust the estimated BLP up or down.
Key findings from this study are:
• The accuracy of the BLP model currently used by California utilities to estimate load reductions in several DR programs (i.e., hourly usage in highest 3 out of 10 previous days) could be improved substantially if a morning adjustment factor were applied for weather-sensitive commercial and institutional buildings.
• Applying a morning adjustment factor significantly reduces the bias and improves the accuracy of all BLP models examined in our sample of buildings.
• For buildings with low load variability, all BLP models perform reasonably well in accuracy.
• For customer accounts with highly variable loads, we found that no BLP model produced satisfactory results, although averaging methods perform best in accuracy (but not bias). These types of customers are difficult to characterize with standard BLP models that rely on historic loads and weather data.
Implications of these results for DR program administrators and policymakers are: • Most DR programs apply similar DR BLP methods to commercial and industrial sector
customers. The results of our study when combined with other recent studies (Quantum 2004 and 2006, Buege et al., 2006) suggests that DR program administrators should have flexibility and multiple options for suggesting the most appropriate BLP method for specific types of customers.
• Customers that are highly weather sensitive, should be given the option of using BLP models that explicitly incorporate temperature in assessing their performance during DR events.
• For customers with more variable loads, it may make more sense to direct these facilities to enroll in DR programs with rules that require customers to reduce load to a firm service level or guaranteed load drop (e.g. which is a common feature of interruptible/curtailable tariffs) because DR performance is difficult to predict and evaluate with BLP models.
• DR program administrators should consider using weather-sensitivity and variability of loads as screening criteria for appropriate default BLP models to be used by enrolling customers, which could improve the accuracy of DR load reduction estimates.
Task 5.G - AutoDR Commercialization and Implementation Pilot
Authors Year Title LBNL#
G. Wikler, A. K. Chiu, M. A. Piette, S. Kiliccote, D. Hennage and C. Thomas
2008
Enhancing Price Response Programs through Auto-DR: California’s 2007 Implementation Experience
This paper describes automated demand response (Auto-DR) activities, an innovative effort in California to ensure that DR programs produce effective and sustainable impacts. Through the application of automation and communication technologies coupled with well-designed incentives and DR programs such as Critical Peak Pricing (CPP) and Demand Bidding (DBP), Auto-DR is opening up the opportunity for many different types of buildings to effectively participate in DR programs. We present the results of Auto-DR implementation efforts by the three California investor-owned utilities for the Summer of 2007. The presentation emphasizes Pacific Gas and Electric Company's (PG&E) Auto-DR efforts, which represents the largest in the state. PG&E's goal was to recruit, install, test and operate 15 megawatts of Auto-DR system capability. We describe the unique delivery approaches, including optimizing the utility incentive structures designed to foster an Auto-DR service provider community. We also show how PG&E's Critical Peak Pricing (CPP) and Demand Bidding (DBP) options were called and executed under the automation platform. Finally, we show the results of the Auto-DR systems installed and operational during 2007, which surpassed PG&E's Auto-DR goals. AutoDR is being implemented by a multi-disciplinary team including the California Investor Owned Utilities (IOUs), energy consultants, energy management control system vendors, the Lawrence Berkeley National Laboratory (LBNL), and the California Energy Commission (CEC).
Task 7.1 - Small Commercial PCT AutoDR
Authors Year Title LBNL#
S. Kiliccote, J. H. Dudley, M. A. Piette, E. Koch and D. Hennage
2009
Open Automated Demand Response for Small Commercial Buildings
LBNL-2195E
This report characterizes small commercial buildings by market segments, systems and end uses; develops a framework for identifying demand response (DR) enabling technologies and communication means; and reports on the design and development of a low-cost OpenADR enabling technology that delivers demand reductions as a percentage of the total predicted building peak electric demand. The results show that small offices, restaurants and retail buildings are the major contributors making up over one third of the small commercial peak demand. The majority of the small commercial buildings in California are located in southern inland areas and the central valley. Single-zone packaged units with manual and programmable thermostat controls make up the majority of heating ventilation and air conditioning (HVAC) systems for small commercial buildings with less than 200 kW peak electric demand. Fluorescent tubes with magnetic ballast and manual controls dominate this customer group’s lighting systems. There are various ways, each with its pros and cons for a particular application, to communicate with these systems and three methods to enable automated DR in small commercial buildings using the Open Automated Demand Response (or OpenADR) communications infrastructure. Development of DR strategies must consider building characteristics, such as weather
sensitivity and load variability, as well as system design (i.e. under-sizing, under-lighting, over-sizing, etc.). Finally, field tests show that requesting demand reductions as a percentage of the total building predicted peak electric demand is feasible using the OpenADR infrastructure.
Authors Year Title LBNL#
J. Page, S. Kiliccote, J. H. Dudley, M. A. Piette, A. K. Chiu, B. Kellow, E. Koch and P. Lipkin
2011
Automated Demand Response Technology Demonstration Project for Small and Medium Commercial Buildings
LBNL-4982E
Small and medium commercial customers in California make up about 20-25% of electric peak load in California. With the roll out of smart meters to this customer group, which enable granular measurement of electricity consumption to this customer group, the investor-owned utilities plan to offer dynamic prices as default tariffs by the end of 2011. Pacific Gas and Electric Company, which successfully deployed Automated Demand Response (AutoDR) Programs to its large commercial and industrial customers, started investigating the same infrastructures application to the small and medium commercial customers. This project aims to identify available technologies suitable for automating demand response for small-medium commercial buildings; to validate the extent to which that technology does what it claims to be able to do; and determine the extent to which customers find the technology useful for DR purpose. Ten sites, enabled by eight vendors, participated in at least four AutoDR test events per site in the summer of 2010. The results showed that while existing technology can reliably receive OpenADR signals and translate them into pre-programmed response strategies, it is likely that better load sheds could be obtained than what is reported here if better understanding of the building systems were developed and the DR strategies had been carefully designed and optimized for each site.
Task C.3 - Statewide OpenADR 2009
Authors Year Title LBNL#
S. Kiliccote, M. A. Piette, J. L. Mathieu and K. Parrish
2010
Findings from Seven Years of Field Performance Data for Automated Demand Response in Commercial Buildings
LBNL-3643E
California is a leader in automating demand response (DR) to promote low-cost, consistent, and predictable electric grid management tools. Over 250 commercial and industrial facilities in California participate in fully-automated programs providing over 60 MW of peak DR savings. This paper presents a summary of Open Automated DR (OpenADR) implementation by each of the investor-owned utilities in California. It provides a summary of participation, DR strategies and incentives. Commercial buildings can reduce peak demand from 5 to 15% with an average of 13%. Industrial facilities shed much higher loads. For buildings with multi-year savings we evaluate their load variability and shed
variability. We provide a summary of control strategies deployed, along with costs to install automation. We report on how the electric DR control strategies perform over many years of events. We benchmark the peak demand of this sample of buildings against their past baselines to understand the differences in building performance over the years. This is done with peak demand intensities and load factors. The paper also describes the importance of these data in helping to understand possible techniques to reach net zero energy using peak day dynamic control capabilities in commercial buildings. We present an example in which the electric load shape changed as a result of a lighting retrofit.
Task TL - AutoDR Inter Testing Lab (WA9.2-1)
Authors Year Title LBNL#
G. Ghatikar, V. Ganti, M.A. Piette, J. Page, S. Kiliccote, C. McParland and D. Watson
2013
Demonstration and Results of Grid Integrated Technologies at the Demand to Grid Laboratory (D2G Lab): Phase I Operations Report
LBNL-6368E
This report details the operations of the Demand to Grid Laboratory (D2G Lab) demonstrations at Lawrence Berkeley National Laboratory (LBNL) since 2011, or Phase 1. Its purpose is to list the D2G Lab demonstration activities and results, and identify next steps to advance grid-integrated technologies and demand response (DR) research. The D2G Lab was set up at LBNL's Demand Response Research Center in 2011 to support research in the areas of open and related automated DR technologies, end-use devices, and their integration with the electric grid. The D2G Lab advances Smart Grid deployment for commercial, industrial, and residential end-uses, including measurement, communications, and control networks. The D2G lab aims to develop low-cost and easy-to-implement solutions and technologies. To meet these goals and functions, the D2G Lab was set up with careful thought toward supporting the DR and grid-integration goals of California.
Appendix E – DR Strategies and Tools Report Abstracts Task 3.1 - Performance Platform
Authors Year Title LBNL#
N. Motegi, M. A. Piette, D. S. Watson and O. Sezgen
2004
Measurement and Evaluation Techniques for Automated Demand Response Demonstration
LBNL-55086
The recent electricity crisis in California and elsewhere has prompted new research to evaluate demand response strategies in large facilities. This paper describes an evaluation of fully automated demand response technologies (Auto-DR) in five large facilities. Auto-DR does not involve human intervention, but is initiated at a facility through receipt of an external communications signal. This paper summarizes the measurement and evaluation of the performance of demand response technologies and strategies in five large facilities. All the sites have data trending systems such as energy management and control systems (EMCS) and/or energy information systems (EIS). Additional sub-metering was applied where necessary to evaluate the facility's demand response performance. This paper reviews the control responses during the test period, and analyzes demand savings achieved at each site. Occupant comfort issues are investigated where data are available. This paper discusses methods to estimate demand savings and results from demand response strategies at five large facilities.
Authors Year Title LBNL#
D. S. Watson, M. A. Piette, O. Sezgen and N. Motegi
2004
Machine to Machine (M2M) Technology in Demand Responsive Commercial Buildings
LBNL-55087
Machine-to-Machine (M2M) is a term used to describe the technologies that enable computers, embedded processors, smart sensors, actuators and mobile devices to communicate with one another, take measurements and make decisions — often without human intervention. M2M technology was applied to five commercial buildings in a test. The goal was to reduce electric demand when a remote price signal rose above a predetermine price. In this system, a variable price signal was generated from a single source on the Internet and distributed using the meta-language, XML (Extensible Markup Language). Each of five commercial building sites monitored the common price signal and automatically shed site-specific electric loads when the price increased above predetermined thresholds. Other than price signal scheduling, which was set up in advance by the project researchers, the system was designed to operate without human intervention during the two-week test period. Although the buildings responded to the same price signal, the communication infrastructures used at each building were substantially different. This
study provides an overview of the technologies used at each building site, the price generator/server, and each link in between. Network architecture, security, data visualization and site-specific system features are characterized. The results of the test are discussed, including: functionality at each site, measurement and verification techniques, and feedback from energy managers and building operators. Lessons learned from the test and potential implications for widespread rollout are provided.
Authors Year Title LBNL#
C. Shockman, M. A. Piette and L. t. Hope
2004
Market Transformation Lessons Learned from an Automated Demand Response Test in Summer and Fall of 2003
LBNL-55110
A recent pilot test to enable an Automatic Demand Response system in California has revealed several lessons that are important to consider for a wider application of a regional or statewide Demand Response Program. The six facilities involved in the site testing were from diverse areas of our economy. The test subjects included a major retail food marketer and one of their retail grocery stores, financial services buildings for a major bank, a postal services facility, a federal government office building, a state university site, and ancillary buildings to a pharmaceutical research company. Although these organizations are all serving diverse purposes and customers, they share some underlying common characteristics that make their simultaneous study worthwhile from a market transformation perspective. These are large organizations. Energy efficiency is neither their core business nor are the decision makers who will enable this technology powerful players in their organizations. The management of buildings is perceived to be a small issue for top management and unless something goes wrong, little attention is paid to the building manager's problems. All of these organizations contract out a major part of their technical building operating systems. Control systems and energy management systems are proprietary. Their systems do not easily interact with one another. Management is, with the exception of one site, not electronically or computer literate enough to understand the full dimensions of the technology they have purchased. Despite the research team's development of a simple, straightforward method of informing them about the features of the demand response program, they had significant difficulty enabling their systems to meet the needs of the research. The research team had to step in and work directly with their vendors and contractors at all but one location. All of the participants have volunteered to participate in the study for altruistic reasons, that is, to help find solutions to California's energy problems. They have provided support in workmen, access to sites and vendors, and money to participate. Their efforts have revealed organizational and technical system barriers to the implementation of a wide scale program. This paper examines those barriers and provides possible avenues of approach for a future launch of a regional or statewide Automatic Demand Response Program.
M. A. Piette, O. Sezgen, D. S. Watson, N. Motegi, C. Shockman and L. t. Hope
2005
Development and Evaluation of Fully Automated Demand Response in Large Facilities
LBNL-55085
This report describes the results of a research project to develop and evaluate the performance of new Automated Demand Response (Auto-DR) hardware and software technology in large facilities. Demand Response (DR) is a set of activities to reduce or shift electricity use to improve electric grid reliability, manage electricity costs, and ensure that customers receive signals that encourage load reduction during times when the electric grid is near its capacity. The two main drivers for widespread demand responsiveness are the prevention of future electricity crises and the reduction of electricity prices. Additional goals for price responsiveness include equity through cost of service pricing, and customer control of electricity usage and bills. The technology developed and evaluated in this report could be used to support numerous forms of DR programs and tariffs.
Authors Year Title LBNL#
M. A. Piette, D. S. Watson, N. Motegi and N. Bourassa
2005
Automated Demand Response and Commissioning
LBNL-57384
This paper describes the results from the second season of research to develop and evaluate the performance of new Automated Demand Response (Auto-DR) hardware and software technology in large facilities. Demand Response (DR) is a set of activities to reduce or shift electricity use to improve the electric grid reliability and manage electricity costs. Fully-Automated Demand Response does not involve human intervention, but is initiated at a home, building, or facility through receipt of an external communications signal. We refer to this as Auto-DR. The evaluation of the control and communications must be properly configured and pass through a set of test stages: Readiness, Approval, Price Client/Price Server Communication, Internet Gateway/Internet Relay Communication, Control of Equipment, and DR Shed Effectiveness. New commissioning tests are needed for such systems to improve connecting demand responsive building systems to the electric grid demand response systems.
Authors Year Title LBNL#
M. A. Piette, D. S. Watson, N. Motegi and N. Bourassa
2005
Findings from the 2004 Fully Automated Demand Response Tests in Large Facilities
LBNL-58178
This report describes the results of the second season of research to develop and evaluate the performance of new Automated Demand Response (Auto-DR) hardware and software
technology in large facilities. Demand Response (DR) is a set of time dependent activities that reduce or shift electricity use to improve electric grid reliability, manage electricity costs, and provide systems that encourage load shifting or shedding during times when the electric grid is near its capacity or electric prices are high. Demand Response is a subset of demand side management, which also includes energy efficiency and conservation. The overall goal of this research project was to support increased penetration of DR in large facilities through the use of automation and better understanding of DR technologies and strategies in large facilities. To achieve this goal, a set of field tests were designed and conducted. These tests examined the performance of Auto-DR systems that covered a diverse set of building systems, ownership and management structures, climate zones, weather patterns, and control and communication configurations. Electric load shedding that is often part of a DR strategy can be achieved by modifying end-use loads. Examples of load shedding include reducing electric loads such as dimming or turning off non-critical lights, changing comfort thermostat set points, or turning off non-critical equipment. Levels of automation in DR can be defined as follows. Manual Demand Response involves a labor-intensive approach such as manually turning off or changing comfort set points at each equipment switch or controller. Semi-Automated Demand Response involves a pre-programmed load shedding strategy initiated by a person via centralized control system. Fully automated DR does not involve human intervention, but is initiated at a home, building, or facility through receipt of an external communications signal. The receipt of the external signal initiates pre-programmed shedding strategies. We refer to this as Auto-DR. One important concept in Auto-DR is that a homeowner or facility manager should be able to "opt out" or "override" a DR event if the event comes at time when the reduction in enduse services is not desirable.
Authors Year Title LBNL#
S. Kiliccote and M. A. Piette
2005
Advanced Control Technologies and Strategies Linking Demand Response and Energy Efficiency
LBNL-58179
This paper presents a preliminary framework to describe how advanced controls can support multiple modes of operations including both energy efficiency and demand response (DR). A general description of DR, its benefits, and nationwide status is outlined. The role of energy management and control systems for DR is described. Building systems such as HVAC and lighting that utilize control technologies and strategies for energy efficiency are mapped on to DR and demand shedding strategies are developed. Past research projects are presented to provide a context for the current projects. The economic case for implementing DR from a building owner perspective is also explored.
Advanced Controls and Communications for Demand Response and Energy Efficiency in Commercial Buildings
LBNL-59337
Commercial buildings account for a large portion of summer peak demand. Research results show that there is significant potential to reduce peak demand in commercial buildings through advanced control technologies and strategies. However, a better understanding of commercial buildings contribution to peak demand and the use of energy management and control systems is required to develop this demand response resource to its full potential. This paper discusses recent research results and new opportunities for advanced building control systems to provide demand response (DR) to improve electricity markets and reduce electric grid problems. The main focus of this paper is the role of new and existing control systems for HVAC and lighting in commercial buildings. A demand-side management framework from building operations perspective with three main features: daily energy efficiency, daily peak load management and event driven, dynamic demand response is presented. A general description of DR, its benefits, and nationwide potential in commercial buildings is outlined. Case studies involving energy management and control systems and DR savings opportunities are presented. The paper also describes results from three years of research in California to automate DR in buildings. Case study results and research on advanced buildings systems in New York are also presented.
Authors Year Title LBNL#
M. A. Piette, D. S. Watson, N. Motegi, S. Kiliccote and P. Xu
2006
Automated Critical Peak Pricing Field Tests: Program Description and Results
LBNL-59351
California utilities have been exploring the use of critical peak prices (CPP) to help reduce needle peaks in customer end-use loads. CPP is a form of price-responsive demand response (DR). Recent experience has shown that customers have limited knowledge of how to operate their facilities in order to reduce their electricity costs under CPP (Quantum 2004). While the lack of knowledge about how to develop and implement DR control strategies is a barrier to participation in DR programs like CPP, another barrier is the lack of automation of DR systems. During 2003 and 2004, the PIER Demand Response Research Center (DRRC) conducted a series of tests of fully automated electric demand response (Auto-DR) at 18 facilities. Overall, the average of the site-specific average coincident demand reductions was 8% from a variety of building types and facilities. Many electricity customers have suggested that automation will help them institutionalize their electric demand savings and improve their overall response and DR repeatability. This report focuses on and discusses the specific results of the Automated Critical Peak Pricing (Auto-CPP, a specific type of Auto-DR) tests that took place during 2005, which build on the
automated demand response (Auto-DR) research conducted through PIER and the DRRC in 2003 and 2004.
Task 4.5 – Indoor Air Quality Impacts of Load Shed
Authors Year Title LBNL#
T. Hotchi, A. T. Hodgson and W. J. Fisk
2006
Indoor Air Quality Impacts of a Peak Load Shedding Strategy for a Large Retail Building
LBNL-59293
Mock Critical Peak Pricing (CPP) events were implemented in a Target retail store in the San Francisco Bay Area by shutting down some of the building’s packaged rooftop air-handling units (RTUs). Measurements were made to determine how this load shedding strategy would affect the outdoor air ventilation rate and the concentrations of volatile organic compounds (VOCs) in the sales area. Ventilation rates prior to and during load shedding were measured by tracer gas decay on two days. Samples for individual VOCs, including formaldehyde and acetaldehyde, were collected from several RTUs in the morning prior to load shedding and in the late afternoon. Shutting down a portion (three of 11 and five of 12, or 27 and 42%) of the RTUs serving the sales area resulted in about a 30% reduction in ventilation, producing values of 0.50-0.65 air changes per hour. VOCs with the highest concentrations (>10 μg/m3) in the sales area included formaldehyde, 2-butoxyethanol, toluene and decamethylcyclopentasiloxane. Substantial differences in concentrations were observed among RTUs. Concentrations of most VOCs increased during a single mock CPP event, and the median increase was somewhat higher than the fractional decrease in the ventilation rate. There are few guidelines for evaluating indoor VOC concentrations. For formaldehyde, maximum concentrations measured in the store during the event were below guidelines intended to protect the general public from acute health risks.
M. A. Piette, D. S. Watson, N. Motegi, S. Kiliccote and E. Linkugel
2006
Automated Demand Response Strategies and Commissioning Commercial Building Controls
LBNL-61013
California electric utilities have been exploring the use of dynamic critical peak pricing (CPP) and other demand response programs to help reduce peaks in customer electric loads. CPP is a new electricity tariff design to promote demand response. This paper begins with a brief review of terminology regarding energy management and demand response, followed by a discussion of DR control strategies and a preliminary overview of a forthcoming guide on DR strategies. The final section discusses experience to date with these strategies, followed by a discussion of the peak electric demand savings from the
2005 Automated CPP program. An important concept identified in the automated DR field tests is that automated DR will be most successful if the building commissioning industry improves the operational effectiveness of building controls. Critical peak pricing and even real time pricing are important trends in electricity pricing that will require new functional tests for building commissioning.
Task 4.4 - Dimmable Ballasts
Authors Year Title LBNL#
F. M. Rubinstein and S. Kiliccote
2007
Demand Responsive Lighting: A Scoping Study
LBNL-62226
The objective of this scoping study is: 1) to identify current market drivers and technology trends that can improve the demand responsiveness of commercial building lighting systems and 2) to quantify the energy, demand and environmental benefits of implementing lighting demand response and energy-saving controls strategies Statewide. Lighting systems in California commercial buildings consume 30 GWh. Lighting systems in commercial buildings often waste energy and unnecessarily stress the electrical grid because lighting controls, especially dimming, are not widely used. But dimmable lighting equipment, especially the dimming ballast, costs more than non-dimming lighting and is expensive to retrofit into existing buildings because of the cost of adding control wiring. Advances in lighting industry capabilities coupled with the pervasiveness of the Internet and wireless technologies have led to new opportunities to realize significant energy saving and reliable demand reduction using intelligent lighting controls. Manufacturers are starting to produce electronic equipment — lighting-application specific controllers (LAS controllers) — that are wirelessly accessible and can control dimmable or multilevel lighting systems obeying different industry-accepted protocols. Some companies make controllers that are inexpensive to install in existing buildings and allow the power consumed by bi-level lighting circuits to be selectively reduced during demand response curtailments. By intelligently limiting the demand from bi-level lighting in California commercial buildings, the utilities would now have an enormous 1 GW demand shed capability at hand. By adding occupancy and light sensors to the remotely controllable lighting circuits, automatic controls could harvest an additional 1 BkWh/yr savings above and beyond the savings that have already been achieved. The lighting industry’s adoption of DALI as the principal wired digital control protocol for dimming ballasts and increased awareness of the need to standardize on emerging wireless technologies are evidence of this transformation. In addition to increased standardization of digital control protocols controller capabilities, the lighting industry has improved the performance of dimming lighting systems over the last two years. The system efficacy of today’s current dimming ballasts is approaching that of non-dimming program start ballasts. The study finds that the benefits of applying digital controls technologies to California’s unique commercial buildings market are enormous. If California were to embark on a concerted 20 year
program to improve the demand responsiveness and energy efficiency of commercial building lighting systems, the State could avoid adding generation capacity, improve the elasticity of the grid, save Californians billions of dollars in avoided energy charges and significantly reduce greenhouse gas emissions.
Task 6.4 - Advanced Demand Responsive Lighting
Authors Year Title LBNL#
F. M. Rubinstein, D. Bolotov, M. S. Levi, K. Powell and P. Schwartz
2008
The Advantage of Highly Controlled Lighting for Offices and Commercial Buildings
LBNL-2514E
The paper presents results from pilot studies of new “workstation-specific” luminaires that are designed to provide highly, efficient, customized lighting for open-office cubicles. Workstation specific luminaires have the following characteristics: 1) they provide separate, dimming control of the cubicle’s “ambient” and “task” lighting components, 2) occupancy sensors and control photosensors are integrated into the fixture’s design and operation, 3) luminaires can be networked using physical cabling, microcontrollers and a PC running control software. The energy savings, demand response capabilities and quality of light from the two WS luminaires were evaluated and compared to the performance of a static, low-ambient lighting system that is uncontrolled. Initial results from weeks of operation provide strong indication that WS luminaires can largely eliminate the unnecessary lighting of unoccupied cubicles while providing IESNA-required light levels when the cubicles are occupied. Because each cubicle’s lighting is under occupant sensor control, the WS luminaires can capitalize on the fact cubicles are often unoccupied during normal working hours and reduce their energy use accordingly.
Task 6.5 - DR Lighting – Lumenergi
Authors Year Title LBNL#
I. S. Walker and A. K. Meier
2008
Residential Thermostats: Comfort Controls in California Homes
LBNL-938E
This report summarizes results of a literature review, a workshop, and many meetings with demand response and thermostat researchers and implementers. The information obtained from these resources was used to identify key issues of thermostat performance from both energy savings and peak demand perspectives. A research plan was developed to address these issues and activities have already begun to pursue the research agenda. The key issues identified were:
• Design and implementation of user interfaces tend to be poor in current thermostats • The wide range of what occupants find comfortable presents a challenge to designing
• There is a considerable range of existing advanced thermostat controls whose effectiveness requires evaluation
• Other countries have more sophisticated controls that may be applicable in California • Existing controls lack features that some users consider desirable and could also have significant energy savings
• Little is known about optimizing user interfaces for comfort controls
The key points of the research plan were to:
• Understand how people use and regard thermostats today • Improve the effectiveness of user interfaces • Develop standards and design specifications • Reconsider the role of the thermostat in the context of very low energy homes, zero-
energy homes, and “healthy” homes • Investigate ways to link public information to more effective thermostat habits
Recommended future activities are:
• Follow-up with further research to address the five key points in the research plan. • Ensure that all interested parties (manufacturer’s, utilities, consumer groups, regulatory
bodies (the Energy Commission, EPA and DOE)) work together to find solutions • Collaboration with EPA in developing new EnergyStar specifications. • Collaboration with other research entities (e.g., ASHRAE)
‘
Task B.6 - Dimmable Ballasts Phase I
Authors Year Title LBNL#
F. M. Rubinstein, L. Xiaolei and D. S. Watson
2010
Using Dimmable Lighting for Regulation Capacity and Non-Spinning Reserves in the Ancillary Services Market. A Feasibility Study
LBNL-4190E
The objective of this Feasibility Study was to identify the potential of dimmable lighting for providing regulation capacity and contingency reserves if massively-deployed throughout the State. We found that one half of the total electric lighting load in the California commercial sector is bottled up in larger buildings that are greater an 50,000 square feet. Retrofitting large California buildings with dimmable lighting to enable fast DR lighting would require an investment of about $1.8 billion and a “fleet” of about 56 million dimming ballasts. By upgrading the existing installed base of lighting and controls (primarily in large commercial facilities) a substantial amount of ancillary services could be provided. Though not widely deployed, today’s state-of-the art lighting systems, control systems and communication networks could be used for this application. The same lighting
control equipment that is appropriate for fast DR is also appropriate for achieving energy efficiency with lighting on a daily basis. Thus fast DR can leverage the capabilities that are provided by a conventional dimming lighting control system. If dimmable lighting were massively deployed throughout large California buildings (because mandated by law, for example) dimmable lighting could realistically supply 380 MW of non-spinning reserve, 47% of the total non-spinning reserves needed in 2007.
Task LC - OpenADR and Lighting Controls ( WA1-9.3-1 )
Authors Year Title
K. Sills, K. Papamichael, and S. Kiliccote
2013 Networked Lighting Systems Open the Way to Automated Demand Response
LD+A Nov 2013 www.ies.org
The California Lighting Technology Center and Lawrence Berkeley National Laboratory recently joined to test the readiness of commercially available networked lighting control systems to implement ADR.
Task 5.F - Wireless Demand Response Controls - HVAC Systems
Authors Year Title LBNL#
C. C. Federspiel
2007
Wireless Demand Response Controls for HVAC Systems
LBNL-2512E
The objectives of this scoping study were to develop and test control software and wireless hardware that could enable closed-loop, zone-temperature-based demand response in buildings that have either pneumatic controls or legacy digital controls that cannot be used as part of a demand response automation system. We designed a SOAP client that is compatible with the Demand Response Automation Server (DRAS) being used by the IOUs in California for their CPP program, design the DR control software, investigated the use of cellular routers for connecting to the DRAS, and tested the wireless DR system with an emulator running a calibrated model of a working building. The results show that the wireless DR system can shed approximately 1.5 Watts per design CFM on the design day in a hot, inland climate in California while keeping temperatures within the limits of ASHRAE Standard 55: Thermal Environmental Conditions for Human Occupancy.
Task 4.J - Residential DR Scoping Study
Authors Year Title LBNL#
C.-K. Woo and K. Herter Residential demand response evaluation scoping study
The primary goals of this scoping study were to (1) summarize existing methods for estimating demand response, (2) evaluate these methods' abilities to accurately estimate residential demand response for the purpose of program evaluation, (3) recommend a preferred approach, and (4) outline any remaining knowledge gaps. This study was motivated by the CPUC directive (D.05-11-009) to develop measurement and evaluation protocols for demand response.
Our evaluation considers both “day matching” and regression techniques, outlining the following alternative methods: (1) prior-day averaging, (2) weather-matching techniques, (3) regression-based load profile comparison, and (4) econometric demand analysis. Based on a review of these methods for evaluating demand response, we find that customer-specific regression analysis is likely to give accurate, transparent and intuitive results. Depending on program requirements, this method can be modified to estimate hourly demand response before, during and after events, providing hourly kW response results and load profiles. Beyond basic demand response estimation, several issues need to be addressed before a practical method for residential demand response program evaluation can be determined. Among them are the ability to evaluate multiple events on consecutive days, an understanding of how advance notification affects demand response, and incorporation of considerations affecting the extrapolation of results from a voluntary pilot to a large-scale program.
Task 6.9 - Home Networks Survey
Authors Year Title LBNL#
B. Nordman 2008 Networks in Buildings: Which Path Forward? LBNL-2511E
To date, digital networks have principally been installed for connecting information technology devices, with more modest use in consumer electronics, security, and large building control systems. The next 20 years will see much greater deployment of networks in buildings of all types, and across all end uses. Most of these are likely to be introduced primarily for reasons other than energy efficiency, and add energy use for network interfaces and network products. Widespread networking could easily lead to increased energy use, and experience with IT and CE networks suggests this may be likely. Active engagement by energy efficiency professionals in the architecture and design of future networks could lead to their being a large and highly cost-effective tool for efficiency. However, network standards are complex and take many years to develop and negotiate so that lack of action on this in the near term may foreclose important opportunities for years or decades to come. Digital networks need to be common globally, providing another challenge to building systems and elements that are more commonly designed only for national or regional markets. Key future networks are lighting, climate control, and security/presence. This paper reviews some examples of past network designs and use and
the lessons they hold for future building networks. It also highlights key needed areas for research, policy, and standards development.
Authors Year Title LBNL#
C. McParland
2008
Home Network Technologies and Automating Demand Response
LBNL-3093E
Over the past several years, interest in large-scale control of peak energy demand and total consumption has increased. While motivated by a number of factors, this interest has primarily been spurred on the demand side by the increasing cost of energy and, on the supply side by the limited ability of utilities to build sufficient electricity generation capacity to meet unrestrained future demand. To address peak electricity use Demand Response (DR) systems are being proposed to motivate reductions in electricity use through the use of price incentives. DR systems are also be design to shift or curtail energy demand at critical times when the generation, transmission, and distribution systems (i.e. the "grid") are threatened with instabilities. To be effectively deployed on a large-scale, these proposed DR systems need to be automated. Automation will require robust and efficient data communications infrastructures across geographically dispersed markets. The present availability of widespread Internet connectivity and inexpensive, reliable computing hardware combined with the growing confidence in the capabilities of distributed, application-level communications protocols suggests that now is the time for designing and deploying practical systems.
Authors Year Title LBNL#
C. McParland
2009
The Evolution of the Internet Community and the "Yet-to-evolve" Smart Grid Community: Parallels and Lessons-to-be-learned
LBNL-2904e
The Smart Grid envisions a transformed US power distribution grid that enables communicating devices, under human supervision, to moderate loads and increase overall system stability and security. This vision explicitly promotes increased participation from a community that, in the past, has had little involvement in power grid operations – the consumer. The potential size of this new community and its member’s extensive experience with the public Internet prompts an analysis of the evolution and current state of the Internet as a predictor for best practices in the architectural design of certain portions of the Smart Grid network.
Technology Evaluation of Programmable Communicating Thermostats with Radio Broadcast Data System Communications
LBNL-6530E
Programmable Communicating Thermostats are thermostats that can be programmed by the user to respond to signals indicating a grid-level system emergency or pricing event. The California Energy Commission is considering standards that would include a requirement for Programmable Communicating Thermostats in residential and small commercial applications. The current specification for Programmable Communicating Thermostats requires Radio Data System communications to Programmable Communicating Thermostats. This study tested the signal strength and reliability of Radio Data System signals at 40 customer sites within the Sacramento Municipal Utility District, which is serviced by 17 radio stations that already transmit Radio Data System signals. The study also tested the functionality of a commercially available Programmable Communicating Thermostat for compliance with California Energy Commission design standards. Test results demonstrated that Radio Data System is capable of reliably sending price and emergency signals. This study also provides evidence that existing Programmable Communicating Thermostats, on receiving a Radio Data System pricing or event signal, are capable of automatically increasing setpoints to a customer-determined or utility-determined level, thus providing air-conditioning demand response within seconds or just a few (less than 5) minutes.
Authors Year Title LBNL#
K. Herter, S. Wayland and J. Rasin
2009
Small Business Demand Response with Communicating Thermostats: SMUD's Summer Solutions Research Pilot
LBNL-2742E
This report documents a field study of 78 small commercial customers in the Sacramento Municipal Utility District service territory who volunteered for an integrated energy-efficiency/ demand-response (EE-DR) program in the summer of 2008. The original objective for the pilot was to provide a better understanding of demand response issues in the small commercial sector. Early findings justified a focus on offering small businesses (1) help with the energy efficiency of their buildings in exchange for occasional load shed, and (2) a portfolio of options to meet the needs of a diverse customer sector. To meet these expressed needs, the research pilot provided on-site energy efficiency advice and offered participants several program options, including the choice of either a dynamic rate or monthly payment for air-conditioning setpoint control. An analysis of hourly load data indicates that the offices and retail stores in our sample provided significant demand response, while the restaurants did not. Thermostat data provides further evidence that restaurants attempted to precool and reduce AC service during event hours, but were unable to because their air-conditioning units were undersized. On a 100°F reference day, load impacts of all participants during events averaged 14%, while load impacts of office and retail buildings (excluding restaurants) reached 20%. Overall, pilot participants
including restaurants had 2007-2008 summer energy savings of 20% and bill savings of 30%. About 80% of participants said that the program met or surpassed their expectations, and three- quarters said they would probably or definitely participate again without the $120 participation incentive. These results provide evidence that energy efficiency programs, dynamic rates and load control programs can be used concurrently and effectively in the small business sector, and that communicating thermostats are a reliable tool for providing air-conditioning load shed and enhancing the ability of customers on dynamic rates to respond to intermittent price events.
Task C.1 - Load Variability - Price
Authors Year Title LBNL#
P. N. Price
2010
Methods for Analyzing Electric Load Shape and its Variability
LBNL-3713E
“Whole-building electric load” is the total electrical power used by a building at a given moment. The load changes with time in response to changes in lighting levels; heating, ventilating, and air conditioning (HVAC) requirements; and uses such as computers, copy machines, and so on. The curve that represents load as a function of time, called the “load shape,” can often yield useful information. Unexpectedly high night-time loads may indicate waste (such as lights that needlessly remain on when the building is unoccupied); a change in load shape may indicate an equipment or thermostat malfunction; unexpectedly high sensitivity to outdoor temperature may indicate that excessive outdoor air is being brought into the building by the HVAC system; and so on. In this report, we discuss several elements of electric load shape analysis: 1. Characterizing daily load shape: what is a small set of parameters that are useful for describing the load variation during a day, and from one day to the next? 2. Describing energy consumption changes over long timescales (months or years): has the energy consumption changed? If so, was the change gradual or sudden? 3. Relating changes in energy consumption to explanatory variables. To what extent is higher energy use associated with higher outdoor temperatures? Did consumption increase at night or during the day? On weekdays or weekends? Was demand response effective? We begin by making a few suggestions concerning graphical displays of load data. We then define some terminology to describe load shapes, and introduce several ways of describing load shapes statistically, with examples from real data. Weather sensitivity is then discussed, along with several standard approaches to adjusting for weather in load predictions. We choose linear regression modeling to illustrate weather adjustments, begin with simple temperature standardization and moving on to more sophisticated approaches. Methods for quantifying demand response effectiveness are also discussed. Finally, we give several examples to illustrate how the methods in this paper can be used to detect and quantify changes in building behavior.
J. L. Mathieu, P. N. Price, S. Kiliccote and M. A. Piette
2011
Quantifying Changes in Building Electricity Use, with Application to Demand Response
LBNL-4944E
We present methods for analyzing commercial and industrial facility 15-minute-interval electric load data. These methods allow building managers to better understand their facility’s electricity consumption over time and to compare it to other buildings, helping them to ‘ask the right questions’ to discover opportunities for demand response, energy efficiency, electricity waste elimination, and peak load management. We primarily focus on demand response. Methods discussed include graphical representations of electric load data, a regression-based electricity load model that uses a time-of-week indicator variable and a piecewise linear and continuous outdoor air temperature dependence, and the definition of various parameters that characterize facility electricity loads and demand response behavior. In the future, these methods could be translated into easy-to-use tools for building managers.
Authors Year Title LBNL#
P. N. Price, J. L. Mathieu, S. Kiliccote and M. A. Piette
2011
Using Whole-Building Electric Load Data in Continuous or Retro-Commissioning
LBNL-5057E
Whole-building electric load data can often reveal problems with building equipment or operations. In this paper, we present methods for analyzing 15-minute-interval electric load data. These methods allow building operators, energy managers, and commissioning agents to better understand a building's electricity consumption over time and to compare it to other buildings, helping them to 'ask the right questions' to discover opportunities for electricity waste elimination, energy efficiency, peak load management, and demand response. For example: Does the building use too much energy at night, or on hot days, or in the early evening? Knowing the answer to questions like these can help with retro-commissioning or continuous commissioning. The methods discussed here can also be used to assess how building energy performance varies with time. Comparing electric load before and after fixing equipment or changing operations can help verify that the fixes have the intended effect on energy consumption. Analysis methods discussed in this paper include: ways to graphically represent electric load data; the definition of various parameters that characterize facility electricity loads; and a regression-based electricity load model that accounts for both time of week and outdoor air temperature. The methods are illustrated by applying them to data from commercial buildings. We demonstrate the ability to recognize changes in building operation, and to quantify changes in energy performance. Some key findings are: 1) Plotting time series electric load data is useful for understanding electricity consumption patterns and changes to those patterns, but results may be misleading if data from different time intervals are not weather-normalized. 2) Parameter plots can highlight key features of electric load data and may be easier to
interpret than plots of time series data themselves. 3) A time-of-week indicator variable (as compared to time-of-day and day-of-week indicator variables) improves the accuracy of regression models of electric load. 4) A piecewise linear and continuous outdoor air temperature dependence can be derived without the use of a change-point model (which would add complexity to the modeling algorithm) or assumptions about when structural changes occur (which could introduce inaccuracy). 5) A model that includes time-of-week and temperature dependence can be used for weather normalization and can determine whether the building is unusually temperature-sensitive, which can indicate problems with HVAC operation.
Task C.8 – UC Berkeley Automated DR – LBNL
Authors Year Title LBNL#
R. Yin, S. Kiliccote, and M. A. Piette
2014
Linking measurements and models in commercial buildings: A case study for model calibration and demand response strategy evaluation
LBNL-7006E
The use of simulation to evaluate energy-efficient operations, commissioning problems, and demand-response (DR) strategies offers important insights into building operations. This paper describes a step-by-step procedure for using measured end-use energy data from a UC Berkeley campus building to calibrate a simulation model developed in EnergyPlus. This process included identification of key input parameters for reducing uncertainties in the model. The building geometry and internal thermal zones were modeled to match the actual heating ventilation and air conditioning (HVAC) zoning for each individual variable air-volume (VAV) zone. We evaluated most key building and HVAC system components, including space loads (actual occupancy number, lighting and plug loads), HVAC air-side components (VAV terminals, supply and return fans) and water-side components (chillers, pumps, and cooling towers). Comparison of the pre- and post-calibration model shows that the calibration process greatly improves the model’s accuracy for each end use. We propose an automated model calibration procedure that links the model to a real-time data monitoring system, allowing the model to be updated any time. The approach enables the automated data feed from sMAP into the EnergyPlus model to create realistic schedules of space loads (occupancy, lighting and plug), performance curves of fans, chillers and cooling towers. We also field-tested DR control strategies to evaluate the model’s performance in predicting dynamic response effects. Finally, this paper describes application of the calibrated model to analyze control systems and DR strategies with the goal of reducing peak demand. We compare end-use data from modeled and actual DR events.
J. Thiemann, N. DeForest, M. Stadler, J. Lai, W. Feng, K. LaCommare, J. Huang and C. Marnay
2013
Identification of Demand Response Potential for Microgrids Using the Distributed Energy Resources Customer Adaption Model: A Case Study of the Alameda County Santa Rita Jail of 2011
LBNL-1005114
As renewable energy production increases and the electricity market paradigm changes Demand Response (DR) programs are at the forefront of the effort to reduce peak loads. Another emerging trend is microgrids, which allow for the integration of renewable distributed energy resources (DER) into power systems controlled at the local level. Therefore, the potential of microgrids to participate in DR simultaneously lowering electricity costs and supporting reliable macrogrid operation should be analyzed. Santa Rita “Green” Jail (SRJ), run by the local County government, is a microgrid demonstration project integrating 1MW fuel cell, 1.2MW PV and 2MW 4MWh of electrical storage. The interaction of these DER can save electricity costs and lower demand peaks. As the markets and tariffs for DR are not straightforward an analysis is needed to tap the full potential of the installed infrastructure. As a public sector demonstration project SRJ can encourage broader adaption of DER and electric storage. This report evaluates the potential for DR for SRJ focusing on the value of electric storage under different utility DR programs. Key operating characteristics are determined to ensure viable operation in different use cases. Also, load shed and shift capabilities are evaluated to identify their economic value under DR programs compared to electrical storage. The Distributed Energy Resources Customer Adoption Model (DER-CAM) is able to find the optimal battery operation schedule. DER-CAM was enhanced by DR capabilities and load shed and shift modules to optimize operational behavior based on DER generation, load and DR events. This report demonstrates how much the microgrid can save by participating in DR. It is identified which DR program is most viable and which barriers and success factors must be considered. Finally, the amount of peak load mitigation that can be delivered to the macrogrid by SRJ to help meet national and federal policy targets for DR is presented
Task SL - Small Loads (WA3-8.4)
Authors Year Title LBNL#
S. Lanzisera, A. Weber, A. Liao, O. Schetrit, S. Kiliccote and M.A. Piette
2015
Field Testing of Telemetry for Demand Response Control of Small Loads
LBNL-1004415
The electricity system in California, from generation through loads, must be prepared for high renewable penetration and increased electrification of end uses while providing
increased resilience and lower operating cost. California has an aggressive renewable portfolio standard that is complemented by world-leading greenhouse gas goals. Taken together, it is clear that all elements of the electricity ecosystem will need to be smarter and more interactive to ensure grid reliability and minimize overall system cost. The goal of this project was to evaluate methods of enabling fast demand response (DR) signaling to small loads for low-cost site enablement. The term “fast DR” is defined as demand-side resources that respond without advanced notification and with fast response time (within minutes to seconds). We used OpenADR 2.0 to meet telemetry requirements for providing ancillary services, and we used a variety of low-cost devices coupled with open-source software to enable an end-to-end fast DR. The devices, architecture, implementation, and testing of the system is discussed in this report. We demonstrate that the emerging Internet of Things (IoT) and Smart Home movements provide an opportunity for diverse small loads to provide fast, low-cost demand response. We used Internet-connected lights, thermostats, load interruption devices, and water heaters to demonstrate an ecosystem of controllable devices. The utility-installed smart meter with a home area network (HAN) radio provides near real-time power data for telemetry feedback to the OpenADR 2.0 virtual top node (VTN, also commonly called the server).The system demonstrated is capable of providing fast load shed for between $20 and $300 per kilowatt (kW) of available load. The wide range results from some loads may have very low cost but also very little shed capability (a 10 watt [W] LED light can only shed a maximum of 10 W) while some loads (e.g., water heaters or air conditioners) can shed several kilowatts but have a higher initial cost. These costs, however, compare well with other fast demand response costs, with typically are over $100/kilowatt of shed. We contend these loads are even more attractive than their price suggests because many of them will be installed for energy efficiency or non-energy benefits (e.g., improved lighting quality or controllability), and the ability to use them for fast DR is a secondary benefit. Therefore the cost of enabling them for DR may approach zero if a software-only solution can be deployed to enable fast DR after devices are installed for other reasons. One significant barrier to widespread deployment of small loads for fast DR is the availability and documentation of open network interfaces for the devices under control and for the smart meter HAN interface. Today devices use a custom communication protocol, and the level of protocol documentation varies widely from device to device. OpenADR does not naturally fill the role of providing specific control to individual devices. We recommend that the demand response research community continues to engage with the IoT community to encourage the use of documented and open development interfaces. A library of device drivers and machine-readable interface specifications would significantly reduce the burden on users or system integrators for deploying systems in large numbers of buildings in California.
F1
Appendix F – AutoDR in California Building Energy Efficiency Standards Report Abstracts Task 4.8 - Title 24 Commercial DR
Authors Year Title LBNL#
D. S. Watson
2005
Proposal for 2008 Title 24 Global Temperature Adjustment (GTA)
n/a
Presentation: click on presentation below:
Task C.5 - OpenADR New Construction
Authors Year Title LBNL#
S. Kiliccote, M. A. Piette, J. D. Fine, O. Schetrit, J. H. Dudley and H. Langford
2012
LEED Demand Response Credit: A Plan for Research towards Implementation
Buildings represent a large portion of the electric system consuming over 70% of electricity and approximately third of the electric peak is due to the commercial sector. We introduce the need and methods for commercial building sector involvement in demand response (DR). We summarize the new Demand Response Partnership Program, whose goal is to facilitate the adoption of variety of timescales of DR in LEED certified buildings. We describe the program’s research goals, methodology and preliminary results from socializing the new USGBC LEED DR credit with the building industry stakeholders, including architects, engineers, consultants, contractors, and building owners and managers. Finally, we share the proposed credit language.
Task NC - T24 & New Construction (WA3-9.3-NC)
Authors Year Title LBNL#
G. Ghatikar, E. Sung and M.A. Piette
2015
Diffusion of Automated Grid Transactions Through Energy Efficiency Codes
LBNL-6995E
Building codes have defined minimum requirements for the energy efficiency of building equipment and systems. There has been a growing interest in building codes that support standards for automation of demand responsiveness and grid transactions. These new codes to facilitate energy efficiency and demand response (DR) goals enable buildings to transact with the electric grid at various time scales. Energy efficiency and DR are at the top of the loading order in California and are important global strategies to lower carbon emissions and costs, and to optimize supply and demand. There is a strong need to educate building owners, vendors, and code officials on the intent of these new codes for electric grid transactions, and to engage electric utilities to take advantage of the DR automation capabilities in new buildings, to advance sustainable and economically sound energy technologies and policies. This paper reviews recent work on this topic and the new requirements in California’s mandatory 2013 Title 24 building energy efficiency standards that became effective on July 1, 2014. Title 24 has requirements for non-residential demand responsiveness and automation in lighting controls, plus heating and ventilation and air conditioning controls. It also requires the control system to be able to receive a standards-based demand response signal. The paper summarizes the history of how this feature was included in the code. The code language is intended to be general, as communications technology changes over every few years, and to provide guidance to enable architects, engineers, vendors, contractors, and building owners to have DR systems that can function with future technology. This paper provides an application of Open Automated Demand Response data and communication standards and how they can be used in Title 24 to lower technology costs and enable buildings and grid interoperability. We identify the significance of such building codes and discuss how the solution for adoption of DR automation in the United States can be applicable in Europe.
Appendix G – Active and Passive Storage Report Abstracts Task 4.2 - Demand Shift
Authors Year Title LBNL#
P. Xu, P. Haves, M. A. Piette and J. E. Braun
2004 Peak Demand Reduction from Pre-Cooling with Zone Temperature Reset in an Office Building
LBNL-55800
The objective of this study was to demonstrate the potential for reducing peak-period electrical demand in moderate-weight commercial buildings by modifying the control of the HVAC system. An 80,000 ft2 office building with a medium-weight building structure and high window-to-wall ratio was used for a case study in which zone temperature set-points were adjusted prior to and during occupancy. HVAC performance data and zone temperatures were recorded using the building control system. Additional operative temperature sensors for selected zones and power meters for the chillers and the AHU fans were installed for the study. An energy performance baseline was constructed from data collected during normal operation. Two strategies for demand shifting using the building thermal mass were then programmed in the control system and implemented progressively over a period of one month. It was found that a simple demand limiting strategy performed well in this building. This strategy involved maintaining zone temperatures at the lower end of the comfort region during the occupied period up until 2 pm. Starting at 2 pm, the zone temperatures were allowed to float to the high end of the comfort region. With this strategy, the chiller power was reduced by 80-100% (1 - 2.3 W/ft2) during normal peak hours from 2 - 5 pm, without causing any thermal comfort complaints. The effects on the demand from 2 - 5 pm of the inclusion of pre-cooling prior to occupancy are unclear.
Authors Year Title LBNL#
I. Flexo Hiner & Partners
2004
Summary Report of Pre-Cooling and SCE Energy$mart ThermostSM Focus Groups
LBNL-62556
Southern California Edison (SCE) began offering the SCE Energy$mart ThermostatSM program to qualified customers in early 2002. Prior to the launch of the program, SCE had completed focus groups and a telephone survey to help determine key program parameters and marketing messages. The program achieved considerable success meeting enrollment goals as customers responded to SCE’s marketing efforts that promoted the most relevant program features: (1) customers would receive at no cost a new programmable thermostat installed at each qualifying location; (2) customers would receive a $300 incentive payment at the end of the summer season for each installed SCE Energy$mart Thermostat; and (3) customers would be able to help SCE avoid rotating blackouts during peak demand times.
In exchange for these benefits, customers’ thermostat set-points would be automatically increased on a limited number of occasions in response to peak electrical system demand conditions and general program testing. Eligible customers are small commercial businesses, with most program participants on the GS-1 rate (nondemand), though some are GS-2 (demand rate). In the summer of 2002, SCE completed another set of focus groups among program participants to assess their experiences with the administration of the program, and their satisfaction with all of their experiences. Some of the most important outcomes of these focus groups were:
• Most customers who signed up for the program did so in direct response to the key marketing messages: (1) the free thermostats that they thought would help them better manage their AC energy consumption; (2) the $300 incentive; and (3) the belief that short term inconvenience of higher temperature is a small price to pay to avoid rotating blackouts.
• Many customers signed up quickly without much deliberation, so they had little understanding of program details and conditions, particularly about the thermostat adjustments.
• Surprisingly, these customers also had little interest in learning too much more about the program – they would be content with a brief refresher.
• While customers had a wide range of thermostat installation experiences, their most significant complaints were that the thermostats were not properly programmed initially, and they did not learn how to program the thermostat themselves to optimize its potential for saving energy.
• While most customers were aware of at least one set-point adjustment, the adjustments were generally insignificant and unmemorable experiences. GS-1 customers were more likely to notice the curtailments than GS-2, though the parameters of 4 degrees for 4 hours were considered reasonable.
• Customers’ primary concern was achieving energy savings with the new thermostat rather than worrying or bothering about the program details.
• Even without confidence that the thermostats were saving them energy in some cases, all customers in the focus groups said they would continue on with the program. Objectives Now, SCE is looking for additional feedback from customers for two purposes:
• SCE is investigating a pre-cooling option for the thermostat program, where participating customers would have their set-points lowered a few degrees in advance of a set-point increase. This would potentially allow for a longer period of time when a customer’s AC would remain idle, while keeping customers in a reasonable “comfort zone.”
• SCE is planning to continue the existing SCE Energy$mart Thermostat program with a few modifications, so would like to gauge customers recent experiences and perceptions about participating in the program.
G3
Authors Year Title LBNL#
K.-h. Lee and J. E. Braun
2004
Development and Application of an Inverse Building Model for Demand Response in Small Commercial Buildings
IBSPA Conference
This paper describes development of an inverse building model and its application in studying the performance of a demand-limiting (DL) control strategy. The demand-limiting strategy involves precooling (PC) a building during unoccupied times, maintaining the zone temperature setpoints at the lower limit of comfort during off-peak, occupied periods, and then limiting the peak cooling rate to a target for on-peak, occupied times that keeps zone conditions within comfort limits. Data from the Iowa Energy Center (IEC), which is typical of small commercial buildings, were used to train an inverse model that was then employed as a tool to evaluate the potential for peak load reduction through control of building thermal mass. The potential for demand limiting was investigated through parametric analysis compared with night-setup (NS) control.
Authors Year Title LBNL#
P. Xu
2006
Evaluation of Demand Shifting Strategies with Thermal Mass in Two Large Commercial Buildings
LBNL-2907E
Building thermal mass can be used to reduce the peak cooling load. For example, in summer, the building mass can be pre-cooled during non-peak hours in order to reduce the cooling load in the peak hours. As a result, the cooling load is shifted in time and the peak demand is reduced. The building mass can be cooled most effectively during unoccupied hours because it is possible to relax the comfort constraints. While the benefits of demand shift are certain, different thermal mass discharge strategies result in different cooling load reduction and savings. The goal of an optimized discharge strategy is to maximize the thermal mass discharge and minimize the possibility of rebounds before the shed period ends. A series of field tests were carefully planned and conducted in two commercial buildings in Northern California to investigate the effects of various precooling and demand shed strategies. Field tests demonstrated the potential of cooling load reduction in peak hours and importance of discharge strategies to avoid rebounds. EnergyPlus simulation models were constructed and calibrated to investigate different kind of recovery strategies. The results indicate the value of pre-cooling in maximizing the electrical shed in the on-peak period. The results also indicate that the dynamics of the shed need to be managed in order to avoid discharging the thermal capacity of the building too quickly, resulting in high cooling load and electric demand before the end of the shed period. An exponential trajectory for the zone set-point during the discharge period yielded good results and is recommended for practical implementation.
Demand Shifting With Thermal Mass in Large Commercial Buildings: Field Tests, Simulations and Audits
LBNL-58815
The principle of pre-cooling and demand limiting is to pre-cool buildings at night or in the morning during off-peak hours, storing cooling in the building thermal mass and thereby reducing cooling loads during the peak periods. Savings are achieved by reducing on-peak energy and demand charges. The potential for utilizing building thermal mass for load shifting and peak demand reduction has been demonstrated in a number of simulation, laboratory, and field studies. In Summer 2003, a pre-cooling case study was conducted at the Santa Rosa Federal Building. It was found that a simple demand limiting strategy performed well in this building. This strategy involved maintaining zone temperatures at the lower end of the comfort range (70°F) during the occupied hours before the peak period and floating the zone temperatures up to the high end of the comfort range (78°F) during the peak period. With this strategy, the chiller power was reduced by 80 to 100% (1 to 2.3 W/ft2) during peak hours from 2 pm to 5 pm without having any thermal comfort complaints submitted to the operations staff. Although the initial study was quite successful, some key questions remained unanswered, including: What was the actual comfort reaction? What is the effect of extended (nighttime) pre-cooling on the following day peak shed? What will happen in really hot weather? In order to address these questions, field tests were performed in two buildings in 2004. In addition to further testing at the Santa Rosa Federal Building, tests were performed in a medium size office building in Rancho Cordova (McCuen Center One Building). A key feature of the 2004 study was the comfort survey. A web-based comfort survey instrument was developed and used in the field tests to assess thermal sensation, comfort and productivity ratings in these two buildings. To supplement the field tests, EnergyPlus computer simulation models were built for the two buildings and used to estimate the impact of various pre-cooling strategies on peak demand. In addition, a set of buildings were audited to assess their suitability for pre-cooling in terms of their building materials and control system and the willingness and ability of the building staff to implement pre-cooling strategies. These audits provide a preliminary assessment of customer acceptability and market readiness of pre-cooling.
Authors Year Title LBNL#
P. Xu and L. Zagreus
2009
Demand Shifting with Thermal Mass in Light and Heavy Mass Commercial Buildings
LBNL-2301E
The potential for utilizing building thermal mass for load shifting and peak demand reduction has been demonstrated in a number of simulation, laboratory, and field studies. This project studied the potential of pre-cooling and demand limiting in a heavy mass and a light mass building in the Bay Area of California. The conclusion of the work to date is that
pre-cooling has the potential to improve the demand responsiveness of commercial buildings while maintaining acceptable comfort conditions. Results indicate that pre-cooling increases the depth (kW) and duration (kWh) of the shed capacity of a given building, all other factors being equal. Due to the time necessary for pre-cooling, it is only applicable to day-ahead demand response programs. Pre-cooling can be very effective if the building mass is relatively heavy. The effectiveness of night pre-cooling under hot weather conditions has not been tested. Further work is required to quantify and demonstrate the effectiveness of pre-cooling in different climates. Research is also needed to develop screening tools that can be used to select suitable buildings and customers, identify the most appropriate pre-cooling strategies, and estimate the benefits to the customer and the utility.
Task 4.2B - Integrated CPP
Authors Year Title LBNL#
P. Xu and L. Zagreus
2006
Demand Shifting With Thermal Mass in Light and Heavy Mass Commercial Buildings
LBNL-61172
The potential for utilizing building thermal mass for load shifting and peak demand reduction has been demonstrated in a number of simulation, laboratory, and field studies. This project studied the potential of pre-cooling and demand limiting in a heavy mass and a light mass building in the Bay Area of California. The conclusion of the work to date is that pre-cooling has the potential to improve the demand responsiveness of commercial buildings while maintaining acceptable comfort conditions. Results indicate that pre-cooling increases the depth (kW) and duration (kWh) of the shed capacity of a given building, all other factors being equal. Pre- cooling and demand shed strategies worked well in both the light and heavy mass buildings. A properly-controlled exponential temperature set up strategy in the shed period discharged thermal mass smoothly in both buildings. The optimal strategy for avoiding rebound was an exponential temperature reset strategy. Pre-cooling was very effective even in cool weather conditions in the heavy mass building. Night pre- cooling had noticeable effects on the second day cooling load in the heavy mass building. Night pre-cooling reduced both HVAC peak demand and energy consumption in cool weather in the heavy mass building. Due to the time necessary for pre-cooling, it is only applicable to day-ahead demand response programs. The effectiveness of night pre-cooling under hot weather conditions has not been tested. Further work is required to quantify and demonstrate the effectiveness of pre- cooling in different climates. Research is also needed on occupant response with advance notification of the pre-cooling DR event. Further work is necessary to develop screening tools that can be used to select suitable buildings and customers, identify the most appropriate pre-cooling strategies, and estimate the benefits to the customer and the utility.
Demand Shifting with Thermal Mass in Large Commercial Buildings in a California Hot Climate Zone
LBNL-3898E
The potential for using building thermal mass for load shifting and peak energy demand reduction has been demonstrated in a number of simulation, laboratory, and field studies. Previous Lawrence Berkeley National Laboratory research has demonstrated that the approach is very effective in cool and moderately warm climate conditions (California Climate Zones 2–4). However, this method had not been tested in hotter climate zones. This project studied the potential of pre-cooling the building early in the morning and increasing temperature setpoints during peak hours to reduce cooling-related demand in two typical office buildings in hotter California climates – one in Visalia (CEC Climate Zone 13) and the other in San Bernardino (CEC Climate Zone 10). The conclusion of the work to date is that pre-cooling in hotter climates has similar potential to that seen previously in cool and moderate climates. All other factors being equal, results to date indicate that pre-cooling increases the depth (kW) and duration (kWh) of the possible demand shed of a given building. The effectiveness of night pre-cooling in typical office building under hot weather conditions is very limited. However, night pre-cooling is helpful for office buildings with an undersized HVAC system. Further work is required to duplicate the tests in other typical buildings and in other hot climate zones and prove that pre-cooling is truly effective.
\
Task B.8 - Campus DR Chilled Water Storage
Authors Year Title LBNL#
J. Granderson, J. H. Dudley, S. Kiliccote and M. A. Piette
2009
Chilled Water Storage System and Demand Response at the University of California at Merced
LBNL-2753E
University of California at Merced is a unique campus that has benefited from intensive efforts to maximize energy efficiency, and has participated in a demand response program for the past two years. Campus demand response evaluations are often difficult because of the complexities introduced by central heating and cooling, non-coincident and diverse building loads, and existence of a single electrical meter for the entire campus. At the University of California at Merced, a two million gallon chilled water storage system is charged daily during off-peak price periods and used to flatten the load profile during peak demand periods. This makes demand response more subtle and challenges typical evaluation protocols. The goal of this research is to study demand response savings in the presence of storage systems in a campus setting. First, University of California at Merced is characterized; second, its participation in two demand response events is detailed. In each
event a set of strategies were pre-programmed into the campus control system to enable semi-automated response. Finally, demand savings results are applied to the utility’s DR incentives structure to calculate the financial savings under various DR programs and tariffs.
Task C.6 - Energy Plus DR - Campus Building
Authors Year Title LBNL#
J. H. Dudley, D. R. Black, M. G. Apte, M. A. Piette and P. M. Berkeley
2010
Comparison of Demand Response Performance with an EnergyPlus Model in a Low Energy Campus Building
LBNL-3644E
We have studied a low energy building on a campus of the University of California. It has efficient heating, ventilation, and air conditioning (HVAC) systems, consisting of a dual-fan/dual-duct variable air volume (VAV) system. As a major building on the campus, it was included in two demand response (DR) events in the summers of 2008 and 2009. With chilled water supplied by thermal energy storage in the central plant, cooling fans played a critical role during DR events. In this paper, an EnergyPlus model of the building was developed and calibrated. We compared both whole building and HVAC fan energy consumption with model predictions to understand why demand savings in 2009 were much lower than in 2008. We also used model simulations of the study building to assess pre-cooling, a strategy that has been shown to improve demand saving and thermal comfort in many types of building. This study indicates a properly calibrated EnergyPlus model can reasonably predict demand savings from DR events and can be useful for designing or optimizing DR strategies.
Task C.7 - DRQAT 2010
Authors Year Title LBNL#
R. Yin, P. Xu and S. Kiliccote
2008
Auto-DR and Pre-cooling of Buildings at Tri-City Corporate Center
LBNL-3348E
Over the several past years, Lawrence Berkeley National Laboratory (LBNL) has conducted field tests for different pre-cooling strategies in different commercial buildings within California. The test results indicated that pre-cooling strategies were effective in reducing electric demand in these buildings during peak periods. This project studied how to optimize pre-cooling strategies for eleven buildings in the Tri-City Corporate Center, San Bernardino, California with the assistance of a building energy simulation tool – the Demand Response Quick Assessment Tool (DRQAT) developed by LBNL’s Demand Response Research Center funded by the California Energy Commission’s Public Interest Energy Research (PIER) Program. From the simulation results of these eleven buildings, optimal pre-cooling and temperature reset strategies were developed. The study shows that
after refining and calibrating initial models with measured data, the accuracy of the models can be greatly improved and the models can be used to predict load reductions for automated demand response (Auto-DR) events. This study summarizes the optimization experience of the procedure to develop and calibrate building models in DRQAT. In order to confirm the actual effect of demand response strategies, the simulation results were compared to the field test data. The results indicated that the optimal demand response strategies worked well for all buildings in the Tri-City Corporate Center. This study also compares DRQAT with other building energy simulation tools (eQUEST and BEST). The comparison indicate that eQUEST and BEST underestimate the actual demand shed of the pre-cooling strategies due to a flaw in DOE2’s simulation engine for treating wall thermal mass. DRQAT is a more accurate tool in predicting thermal mass effects of DR events.
Authors Year Title LBNL#
R. Yin, P. Xu, M. A. Piette and S. Kiliccote
2010
Study on Auto-DR and Pre-cooling of Commercial Buildings with Thermal Mass in California
LBNL-3541E
This paper discusses how to optimize pre-cooling strategies for buildings in a hot California climate zone with the Demand Response Quick Assessment Tool (DRQAT), a building energy simulation tool. This paper outlines the procedure used to develop and calibrate DRQAT simulation models, and applies this procedure to eleven field test buildings. The results of a comparison between the measured demand savings during the peak period and the savings predicted by the simulation model indicate that the predicted demand shed match well with measured data for the corresponding Auto-Demand Response (Auto-DR) days. The study shows that the accuracy of the simulation models is greatly improved after calibrating the initial models with measured data. These improved models can be used to predict load reductions for automated demand response events. The simulation results were compared with field test data to confirm the actual effect of demand response strategies. Results indicate that the optimal demand response strategies worked well for most of the buildings tested in this hot climate zone.
Authors Year Title LBNL#
R. Yin, S. Kiliccote, M. A. Piette and K. Parrish
2010
Scenario Analysis of Peak Demand Savings for Commercial Buildings with Thermal Mass in California
LBNL-3636E
This paper reports on the potential impact of demand response (DR) strategies in commercial buildings in California based on the Demand Response Quick Assessment Tool (DRQAT), which uses EnergyPlus simulation prototypes for office and retail buildings. The study describes the potential impact of building size, thermal mass, climate, and DR strategies on demand savings in commercial buildings. Sensitivity analyses are performed
to evaluate how these factors influence the demand shift and shed during the peak period. The whole-building peak demand of a commercial building with high thermal mass in a hot climate zone can be reduced by 30% using an optimized demand response strategy. Results are summarized for various simulation scenarios designed to help owners and managers understand the potential savings for demand response deployment. Simulated demand savings under various scenarios were compared to field-measured data in numerous climate zones, allowing calibration of the prototype models. The simulation results are compared to the peak demand data from the Commercial End-Use Survey for commercial buildings in California. On the economic side, a set of electricity rates are used to evaluate the impact of the DR strategies on economic savings for different thermal mass and climate conditions. Our comparison of recent simulation to field test results provides an understanding of the DR potential in commercial buildings.
Task B.2 - DR Strategy Assessment Tools
Authors Year Title LBNL#
R. Yin and D. Black
2015
Improvement of Demand Response Quick Assessment Tool (DRQAT) and Tool Validation Case Studies
LBNL-1003751
In 2006, the Demand Response Research Center (DRRC) at Lawrence Berkeley National Laboratory (LBNL) initiated the development of a quick assessment tool for demand response in buildings and, in 2007, the DRRC released the first version of the Demand Response Quick Assessment Tool (DRQAT) for public use. Over the past few years, the DRRC has been improving the DRQAT tool based on users’ feedback and upgrading the engine with the EnergyPlus energy simulation tool. Currently, DRQAT enables users to evaluate a single DR strategy configuration at a time. Users could greatly benefit from being able to run multiple strategy configurations at a time and directly compare their performance in a single output report. The latest update of DRQAT, described in this report, enables users to do just that to compare different pre-cooling and reset strategies. Also, to help customers better understand the demand response performance of their facilities; this report presents several case studies to compare demand response predictions with measured values. A previous study indicated that the predictive value of the DRQAT simulation model can be significantly improved after calibrating the model with measured data. Most users are not familiar with model calibration, a process that can be time consuming. This report shows a comparison of DRQAT results generated as a typical user would—without calibration. The results show that the DRQAT tool can generate credible predictions of peak demand savings and load shapes throughout demand response event hours.
Task ES and E2 - TES Scoping Study (WA2-9.4-3 and WA3-9.3-E2)
Authors Year Title LBNL#
R. Yin, D. Black and M.A. Piette and K. Schiess
2015
Control of Thermal Energy Storage in Commercial Buildings for California Utility Tariffs and Demand Response
LBNL-1003740
Thermal Energy Storage (TES) is an established technology that shifts heating or cooling energy use from on-peak period when demand and rates are highest to off-peak period, when rates are lower. There are two main categories of TES systems evaluated in this study, which are full and partial cooling storage. For a full storage TES system, the cooling energy during on-peak hours is completely shifted to off-peak hours. For a utility tariff that has a monthly demand charge and on-peak demand charge as well, a full storage system can provide much bill savings of demand and energy charges by reducing the peak demand and the use of electricity during on-peak hours. For a partial storage system, the storage runs along with the cooling plant during on-peak hours, which can reduce a portion of peak demand with reduced cooling plant capacity. TES systems shift electricity use from on-peak periods to off-peak periods on a recurring basis, which is characterized as permanent load shifting (PLS). PLS can be quite reliable and consistent throughout on-peak hours in the summer season. Partial storage TES systems are better suited than full storage systems for participating in demand response (DR) programs because full storage systems create peak period baselines with little to no room for shedding cooling related loads. For DR events called on peak demand days, the integration of partial TES systems with typical DR control strategies (e.g. global temperature adjustment) can also provide one-hour or 20-minute load shed resources by aggregating the cooling load reduction during the GTA deployment period. Buildings with partial TES systems can be good resources for participating in DR programs requiring faster response times and shorter response durations. TES demand shifting and economic payback is greatly influenced by the following factors: (1) utility rate structures; (2) building load characteristics (e.g. load pattern, ratio of on-peak and off-peak cooling load); (3) climate; (4) available physical space for retrofit installations. In this study, a matrix of various TES use cases was simulated to evaluate the impact of building load, climate and California utility tariffs. Simulations show that typical TES installations will have enough excess capacity to provide cooling demand shifting on most days. With current retail DR programs that have a relatively small number of “event” days, typically on the hottest days, the amount of excess is minimal, and, so is the benefit to customers of participating in DR with only TES. TES resources could be aggregated to participate in wholesale DR and/or ancillary services on days other than the hottest days, which are a vast majority of the days of the year. In some cases, the TES configuration that provides the greatest reduction in the annual utility bill does not provide the shortest payback period. For older office buildings in PG&E territory, bill reduction is greatest with a full 9-hr TES, but payback is faster with a full 6-hr TES. Similarly, for old and new office buildings in SDG&E territory, a full 9-hr TES provides the lowest annual utility costs, but payback is
G11
faster with a partial 9-h. Peak day or critical peak pricing with TES alone (without other measures such as increasing thermostat set points or reducing lighting) provides a small cost savings, but if automated controls are in place, the effort to participate in DR event days with TES alone may be low enough to be beneficial. Utilities currently look to TES to provide maximum peak period reduction. In most cases studied here, the TES configuration that provided the greatest economic benefit to the customer also provided the greatest peak period load reduction. However, small-to-medium retail customers will have the lowest utility costs with a partial storage system, which only provides a fraction, typically half, of peak period demand reduction compared to that of a full storage system. Older less efficient buildings have higher peak period loads and present greater potential demand reductions that can be achieved with TES. Utilities should target older buildings with incentives to install TES to maximize demand reduction achieved with incentive programs. Incentives structured as dollar per kW of TES installed will achieve greater peak period reductions per dollar of incentive if targeted at new buildings, but, all other things being equal, the peak period load reduction provided by TES will be lower with a newer building.
H1
Appendix H – Industrial, Agriculture and Water Report Abstracts Roadmaps
Task A.1 - IAW DR Roadmapping
Authors Year Title LBNL#
A. T. McKane, M. A. Piette, D. Faulkner, G. Ghatikar, A. Radspieler. Jr., B. Adesola, S. Murtishaw and S. Kiliccote
2008
Opportunities, Barriers and Actions for Industrial Demand Response in California
LBNL-1335E
In 2006 the Demand Response Research Center (DRRC) formed an Industrial Demand Response Team to investigate opportunities and barriers to implementation of Automated Demand Response (Auto-DR) systems in California industries. Auto-DR is an open, interoperable communications and technology platform designed to:
• Provide customers with automated, electronic price and reliability signals; • Provide customers with capability to automate customized DR strategies; • Automate DR, providing utilities with dispatchable operational capability similar to
conventional generation resources.
This research began with a review of previous Auto-DR research on the commercial sector. Implementing Auto-DR in industry presents a number of challenges, both practical and perceived. Some of these include: the variation in loads and processes across and within sectors, resource-dependent loading patterns that are driven by outside factors such as customer orders or time-critical processing (e.g. tomato canning), the perceived lack of control inherent in the term "Auto-DR", and aversion to risk, especially unscheduled downtime. While industry has demonstrated a willingness to temporarily provide large sheds and shifts to maintain grid reliability and be a good corporate citizen, the drivers for widespread Auto-DR will likely differ. Ultimately, most industrial facilities will balance the real and perceived risks associated with Auto-DR against the potential for economic gain through favorable pricing or incentives. Auto-DR, as with any ongoing industrial activity, will need to function effectively within market structures.
D. Olsen, A. Aghajanzadeh, A. T. McKane
2015
Opportunities for Automated demand Response in California Agricultural Irrigation
During periods of peak electrical demand on the energy grid or when there is a shortage of supply, the stability of the grid may be compromised or the cost of supplying electricity may rise dramatically, respectively. Demand response programs are designed to mitigate the severity of these problems and improve reliability by reducing the demand on the grid during such critical times. In 2010, the Demand Response Research Center convened a group of industry experts to suggest potential industries that would be good demand response program candidates for further review. The dairy industry was suggested due to the perception that the industry had suitable flexibility and automatic controls in place. The purpose of this report is to provide an initial description of the industry with regard to demand response potential, specifically automated demand response.
This report qualitatively describes the potential for participation in demand response and automated demand response by dairy processing facilities in California, as well as barriers to widespread participation. The report first describes the magnitude, timing, location, purpose, and manner of energy use. Typical process equipment and controls are discussed, as well as common impediments to participation in demand response and automated demand response programs. Two case studies of demand response at dairy facilities in California and across the country are reviewed. Finally, recommendations are made for future research that can enhance the understanding of demand response potential in this industry.
H3
Task J.1 - IAW 2008
Authors Year Title LBNL#
A. T. McKane, I. Rhyne, A. B. Lekov, L. Thompson and M. A. Piette
2008
Automated Demand Response: The Missing Link in the Electricity Value Chain
LBNL-2736E
In 2006, the Public Interest Energy Research Program (PIER) Demand Response Research Center (DRRC) at Lawrence Berkeley National Laboratory initiated research into Automated Demand Response (OpenADR) applications in California industry. The goal is to improve electric grid reliability and lower electricity use during periods of peak demand. The purpose of this research is to begin to define the relationship among a portfolio of actions that industrial facilities can undertake relative to their electricity use. This "electricity value chain" defines energy management and demand response (DR) at six levels of service, distinguished by the magnitude, type, and rapidity of response. One element in the electricity supply chain is OpenADR, an open-standards based communications system to send signals to customers to allow them to manage their electric demand in response to supply conditions, such as prices or reliability, through a set of standard, open communications. Initial DRRC research suggests that industrial facilities that have undertaken energy efficiency measures are probably more, not less, likely to initiate other actions within this value chain such as daily load management and demand response. Moreover, OpenADR appears to afford some facilities the opportunity to develop the supporting control structure and to "demo" potential reductions in energy use that can later be applied to either more effective load management or a permanent reduction in use via energy efficiency. Under the right conditions, some types of industrial facilities can shift or shed loads, without any, or minimal disruption to operations, to protect their energy supply reliability and to take advantage of financial incentives.1 In 2007 and 2008, 35 industrial facilities agreed to implement OpenADR, representing a total capacity of nearly 40 MW. This paper describes how integrated or centralized demand management and system-level network controls are linked to OpenADR systems. Case studies of refrigerated warehouses and wastewater treatment facilities are used to illustrate OpenADR load reduction potential. Typical shed and shift strategies include: turning off or operating compressors, aerator blowers and pumps at reduced capacity, increasing temperature set-points or pre-cooling cold storage areas and over-oxygenating stored wastewater prior to a DR event. This study concludes that understanding industrial end-use processes and control capabilities is a key to support reduced service during DR events and these capabilities, if DR enabled, hold significant promise in reducing the electricity demand of the industrial sector during utility peak periods.
2008-2010 Research Summary: Analysis of Demand Response Opportunities in California Industry
LBNL-5680E
From 2008-2010, the Industrial Demand Response Team of the Demand Response Research Center (DRRC) continued its research into the potential for Demand Response (DR) and Automated Demand Response (Auto-DR) in the Industrial-Agricultural- Water (IAW) sector. Auto-DR refers to a technology and communications framework designed to: Provide customers with automated, electronic price and reliability signals; Provide customers with capability to automate customized DR strategies; and Automate DR, providing utilities with dispatchable operational capability similar to conventional generation resources. Research continued into the implementation of DR and Auto-DR strategies in the three IAW sectors previously identified as having good potential for DR: refrigerated warehouses, data centers, and wastewater treatment. This included case studies and generation of sector specific research reports documenting details of facility characteristics and DR opportunities. The cement industry and agricultural irrigation were also identified as having DR potential, and were the subject of scoping studies. As Auto-DR capabilities are strongly influenced by the sophistication of facility controls, research was also conducted to determine the state of controls in industrial facilities in California. This research resulted in a list of sector characteristics that appear to be conducive to DR along with the observation that case-by-case sub-sector analysis is often a necessary part of narrowing down focus areas. Planned future research will deepen the knowledge of Auto-DR capabilities in the previously identified sectors, as well as broaden the scope of DR studies to include agricultural irrigation and other sectors identified by the control survey as having capacity for Auto-DR. Research will also be conducted into the potential for and implementation of shorter-notice, shorter-duration DR events.
Water
Task 4.E - DR - Water TOU Tariffs
Authors Year Title LBNL#
L. House 2007
Water Supply Related Electricity Demand in California
LBNL-62041 / CEC 500-2007-114
This report estimates the water supply-related peak electrical demands for investor-owned electric utilities in California, based on data from the California Energy Commission and California investor-owned utilities. Water supply-related electrical demands exceed 2,000
megawatts on summer peak days in California. Agricultural groundwater and surface water pumping represent 60 percent of the total water supply-related peak day electrical demand, with water agency demands representing the remaining 40 percent. Over 500 megawatts of water agency electrical demand is used for providing water/sewer services to residential water customers. This study also forecasts future peak-day electrical loads and estimates peak demand impacts of population growth and the impact of potential demand reduction programs.
Food Processing
Task 4.K - Industrial DR Scoping Study - Lewis
Authors Year Title LBNL#
Glen Lewis Group
2007
Strategies to Increase California Food Processing Industry Demand Response Participation: A Scoping Study
LBNL-63668
State energy planners and electric utilities are interested in opportunities to reduce peak electric demand in the food processing sector using Demand Response (DR) programs and technologies. However, the industrial sector and food processing, in particular, pose unique challenges for DR implementation. The feasibility of DR depends on plant operating schedules and supply chain needs, and plant operators have been reluctant to adjust production schedules where productivity and economics may suffer. Hence DR for the industrial sector does not fit the “buildings model” for which DR has been successfully demonstrated and implemented. However, the results of this scoping study indicate that significant potential for DR can be realized in this sector given coordination, tools and incentives planned from a perspective of plant operations. These findings may also apply to other areas of California’s industrial sector.
Task 6.K - Food & Beverage Industry AutoDR Case Studies - Lewis
Authors Year Title LBNL#
G. Lewis, I. Rhyne and B. A. Atkinson
2009
California Food Processing Industry Wastewater Demonstration Project: Phase I Final Report
LBNL-2585E
Wastewater treatment is an energy-intensive process and electricity demand is especially high during the utilities’ summer peak electricity demand periods. This makes wastewater treatment facilities prime candidates for demand response programs. However, wastewater treatment is often peripheral to food processing operations and its demand response opportunities have often been overlooked. Phase I of this wastewater
demonstration project monitored wastewater energy and environmental data at Bell-Carter Foods, Inc., California's largest olive processing plant. For this monitoring activity the project team used Green Energy Management System (GEMS) automated enterprise energy management (EEM) technologies. This report presents results from data collected by GEMS from September 15, 2008 through November 30, 2008, during the olive harvest season. This project established and tested a methodology for (1) gathering baseline energy and environmental data at an industrial food-processing plant and (2) using the data to analyze energy efficiency, demand response, daily peak load management, and environmental management opportunities at the plant. The Phase I goals were to demonstrate the measurement and interrelationship of electricity demand, electricity usage, and water quality metrics and to estimate the associated CO2 emissions.
Task M1-M3 – IAW 2009
Authors Year Title LBNL#
D. Olsen, S. Goli and A. T. McKane
2012
Examining Synergies between Energy Management and Demand Response: A Case Study at Two California Industrial Facilities
LBNL-5719E
This study was conducted to determine if the process of developing and maintaining an energy management system improves an industrial facility’s capabilities for demand response. An energy management system is a set of procedures, documents, and records designed to help an organization improve its energy performance over time. Organizations and facilities use energy management systems in an iterative process to plan, measure, monitor, and modify their energy use and consumption, with the goal of continual improvement. Continual improvement is based on comparing current performance to past performance, to ensure that energy performance improvements from capital projects and operational changes are sustained and that new opportunities for improvement continue to be identified and implemented. Energy management can include actions not only to improve energy efficiency, but also for load management and demand response. Energy management in industrial facilities is generally more complex than in commercial buildings due to the range and type of industrial energy systems and processes. Demand response (DR) refers to a set of strategies and systems used by electricity consumers to temporarily reduce their electrical load in reaction to electrical grid or market conditions. There exist a wide range of DR programs offered to consumers and many ways for the consumer to achieve the desired demand reduction. Both DR and energy management have been seen to be effective tools in improving energy utilization, but the relationship between the two has not yet been demonstrated.
Agricultural Irrigation Task AI - Ag Irrigation Tool (WA3-10.2-AI)
Authors Year Title LBNL#
D. Olsen, A. Aghajanzadeh, A. T. McKane
2015
Opportunities for Automated demand Response in California Agricultural Irrigation
LBNL-1003786
Pumping water for agricultural irrigation represents a significant share of California’s annual electricity use and peak demand. It also represents a large source of potential flexibility, as farms possess a form of storage in their wetted soil. By carefully modifying their irrigation schedules, growers can participate in demand response without adverse effects on their crops. This report describes the potential for participation in demand response and automated demand response by agricultural irrigators in California, as well as barriers to widespread participation. The report first describes the magnitude, timing, location, purpose, and manner of energy use in California. Typical on-farm controls are discussed, as well as common impediments to participation in demand response and automated demand response programs. Case studies of demand response programs in California and across the country are reviewed, and their results along with overall California demand estimates are used to estimate statewide demand response potential. Finally, recommendations are made for future research that can enhance the understanding of demand response potential in this industry.
In addition, an Agricultural Irrigation Demand Response Estimation Tool (AIDRET) was developed as an online standalone calculator that can be used to estimate a farm’s DR potential based on the model of the pumping load. It can be accessed via any browser at http://cec-aidret:6024/index/.
AIDRET was designed to be used by energy analysts or customers contemplating applying to IOU DR programs. It enables users to estimate how much DR might be approved for their farm and the dollar amount of incentives that might be available. The tool also provides external resources that users can access to learn more about pumping efficiency, overall irrigation efficiency, and their irrigation system/crop mix.
Task M1-M3 - IAW2009
Authors Year Title LBNL#
G. Marks, E. Wilcox, D. Olsen and S. Goli
2013
Opportunities for Demand Response in California Agricultural Irrigation: A Scoping Study
LBNL-6108E
California agricultural irrigation consumes more than ten billion kilowatt hours of electricity annually and has significant potential for contributing to a reduction of stress on
the grid through demand response, permanent load shifting, and energy efficiency measures. To understand this potential, a scoping study was initiated for the purpose of determining the associated opportunities, potential, and adoption challenges in California agricultural irrigation. The primary research for this study was conducted in two ways. First, data was gathered and parsed from published sources that shed light on where the best opportunities for load shifting and demand response lie within the agricultural irrigation sector. Secondly, a small limited survey was conducted as informal face-to-face interviews with several different California growers to get an idea of their ability and willingness to participate in permanent load shifting and/or demand response programs. Analysis of the data obtained from published sources and the survey reveal demand response and permanent load shifting opportunities by growing region, irrigation source, irrigation method, grower size, and utility coverage. The study examines some solutions for demand response and permanent load shifting in agricultural irrigation, which include adequate irrigation system capacity, automatic controls, variable frequency drives, and the contribution from energy efficiency measures. The study further examines the potential and challenges for grower acceptance of demand response and permanent load shifting in California agricultural irrigation. As part of the examination, the study considers to what extent permanent load shifting, which is already somewhat accepted within the agricultural sector, mitigates the need or benefit of demand response for agricultural irrigation. Recommendations for further study include studies on how to gain grower acceptance of demand response as well as other related studies such as conducting a more comprehensive survey of California growers.
Cement
Task M1-M3 – IAW 2009
Authors Year Title LBNL#
D. Olsen, S. Goli, D. Faulkner and A. T. McKane
2010
Opportunities for Energy Efficiency and Demand Response in the California Cement Industry
LBNL-4849E
This study examines the characteristics of cement plants and their ability to shed or shift load to participate in demand response (DR). Relevant factors investigated include the various equipment and processes used to make cement, the operational limitations cement plants are subject to, and the quantities and sources of energy used in the cement-making process. Opportunities for energy efficiency improvements are also reviewed. The results suggest that cement plants are good candidates for DR participation. The cement industry consumes over 400 trillion Btu of energy annually in the United States, and consumes over 150 MW of electricity in California alone. The chemical reactions required to make cement occur only in the cement kiln, and intermediate products are routinely stored between processing stages without negative effects. Cement plants also operate continuously for months at a time between shutdowns, allowing flexibility in operational scheduling. In
addition, several examples of cement plants altering their electricity consumption based on utility incentives are discussed. Further study is needed to determine the practical potential for automated demand response (Auto-DR) and to investigate the magnitude and shape of achievable sheds and shifts.
Controls
Task M1-M3 – IAW 2009
Authors Year Title LBNL#
G. Ghatikar, A. T. McKane, S. Goli, P. L. Therkelsen and D. Olsen
2012
Assessing the Control Systems Capacity for Demand Response in California Industries
LBNL-5319E
The capabilities of industrial facilities control systems influence a facility's ability to use energy efficiently. Control capabilities enable a range of energy management techniques, including participation in Automated Demand Response programs. Due to a lack of information on the current state of controls in California industry, an effort was undertaken by Lawrence Berkeley National Laboratory (LBNL) beginning in 2009 to investigate the status of industrial controls and the link between control capabilities and Demand Response participation. A survey was designed to gather information on facilities' control capabilities, as well as other factors believed to be pertinent to Demand Response participation. The survey was tested and deployed via a web-based tool, and survey responses were analyzed to ascertain the prevalence of sophisticated control systems and the validity of the researchers' assumptions regarding the link between facilities' operational and technical characteristics and their Demand Response potential. Outreach by Lawrence Berkeley National Laboratory and various industry contacts yielded 46 valid survey responses. Preliminary findings obtained from these responses were presented to a group of industrial control experts, whose feedback was used to refine the conclusions. Analysis of the survey responses received showed that while the vast majority of industrial facilities have semi- or fully automated control systems, participation in Demand Response programs is still low due to perceived barriers. The results also showed that the facilities that use continuous processes are good Demand Response candidates. When comparing facilities participating in Demand Response to those not participating, several similarities and differences emerged. Demand Response-participating and non-participating facilities had similar timings of peak energy use, similar production processes, and similar participation in energy audits. The key characteristics of Demand Response-participating facilities are: Higher energy consumption, More automated controls, More centralized controls, Use of controls for peak management, Facilities with on-site generation, and delegation of Demand Response decision-making authority to production and facility-level staff. The results of the aggregated analysis were compared against two additional sources of information: (1) electricity meter data from a survey respondent attempting load shifts,
and (2) feedback from the control experts. In both cases, the additional information agreed with the research team's characterization of Demand Response-enabling attributes. The feedback from the control experts was also used to suggest industrial subsectors with unharnessed Demand Response potential. Though the survey sample of industrial facilities was smaller than anticipated, the results seemed to support our preliminary assumptions. Future work yielding more information on the control capabilities of California industrial facilities and their potential for Demand Response could include obtaining a larger survey response data set from which to draw conclusions. Demonstrations of Auto-Demand Response in industrial facilities with good control capabilities are needed to dispel perceived barriers to participation, and investigating industrial subsectors suggested of having inherent Demand Response potential. California's electricity markets are moving toward dynamic pricing models, such as real-time pricing, within the next few years, which could have a significant impact on an industrial facility's cost of energy use during the times of peak use. The findings from this report, and partnership with key industrial trade associations, will help the California industries develop a comprehensive strategy for responding to electricity price and reliability signals, to achieve a competitive advantage over those that do not. Better understanding of the state of controls and automation will help facility managers gain real-time access to both energy use and cost information. The results from this report will contribute to the industry's technical capacity to voluntarily receive and respond to open automated demand response (Open Auto-DR) signals, currently offered by California investor-owned utilities. The results also provide an understanding of shifting or shedding non-essential electrical load, and, more importantly, help shape public policies to effectively assist industry in meeting the challenges of real-time pricing in California.
Task M1-M3 – IAW 2009
Authors Year Title LBNL#
D. Scott, R. Hoest, F. Yang, S. Goli and D. Olsen
2012
The Impact of Control Technology on the Demand Response Potential of California Industrial Refrigerated Facilities Final Report
LBNL-5750E
The primary objective of this report was to provide an overview of the variety of industrial refrigerated facilities, refrigeration systems, and control systems found throughout California. Since robust control systems are considered key to reliable and safe demand response participation, an evaluation of nearly three hundred facilities was undertaken to identify the current landscape of industrial refrigeration control systems found in the state. The evaluation included review of the information database developed to characterize these facilities as well as phone conversations with several facility managers. In addition to a review of existing refrigeration and control systems, the second objective of this report was to identify the challenges to maximizing the demand response potential related to:
facility types, operational factors and product quality, refrigeration system configurations and control system architectures. The report was structured with sections addressing each of the primary objectives. The information presented in this report is intended to set the stage for future development of a set of specific demand response guidelines for the various types of industrial refrigerated facilities. This future effort would provide facility owners and operators managers with detailed, actionable demand response control options to apply in their individual facilities.
Data Centers
Task J.5 - Demand Response in Data Centers
Authors Year Title LBNL#
V. Ganti and G. Ghatikar
2012
Smart Grid as a Driver for Energy-Intensive Industries: A Data Center Case Study
LBNL-6104E
The Smart Grid facilitates integration of supply- and demand-side services, allowing the end-use loads to be dynamic and respond to changes in electricity generation or meet localized grid needs. Expanding from previous work, this paper summarizes the results from field tests conducted to identify demand response opportunities in energy-intensive industrial facilities such as data centers. There is a significant opportunity for energy and peak-demand reduction in data centers as hardware and software technologies, sensing, and control methods can be closely integrated with the electric grid by means of demand response. The paper provides field test results by examining distributed and networked data center characteristics, end-use loads and control systems, and recommends opportunities and challenges for grid integration. The focus is on distributed data centers and how loads can be “migrated” geographically in response to changing grid supply (increase/decrease). In addition, it examines the enabling technologies and demand-response strategies of high performance computing data centers. The findings showed that the studied data centers provided average load shed of up to 10% with short response times and no operational impact. For commercial program participation, the load-shed strategies must be tightly integrated with data center automation tools to make them less resource-intensive.
Task IE - IAW DR End-Use Analysis and Field Studies (WA1-10.1)
Authors Year Title LBNL#
G. Ghatikar, M.A. Piette, S. Fujita, A. McKane, J. Dudley, and A. Radspieler
2010
Demand Response and Open Automated Demand Response Opportunities for Data Centers
This study examines data center characteristics, loads, control systems, and technologies to identify demand response (DR) and automated DR (Open Auto-DR) opportunities and challenges. The study was performed in collaboration with technology experts, industrial partners, and data center facility managers and existing research on commercial and industrial DR was collected and analyzed. The results suggest that data centers, with significant and rapidly growing energy use, have significant DR potential. Because data centers are highly automated, they are excellent candidates for Open AutoDR. “Non-mission-critical” data centers are the most likely candidates for early adoption of DR. Data center site infrastructure DR strategies have been well studied for other commercial buildings; however, DR strategies for information technology (IT) infrastructure have not been studied extensively. The largest opportunity for DR or load reduction in data centers is in the use of virtualization to reduce IT equipment energy use, which correspondingly reduces facility cooling loads. DR strategies could also be deployed for data center lighting, and heating, ventilation, and air conditioning. Additional studies and demonstrations are needed to quantify benefits to data centers of participating in DR and to address concerns about DR’s possible impact on data center performance or quality of service and equipment life span.
Task IE - IAW DR End-Use Analysis and Field Studies (WA1-10.1)
Authors Year Title LBNL#
G. Ghatikar, V. Ganti, N. Matson and M. A. Piette
2012
Demand Response Opportunities and Enabling Technologies for Data Centers: Findings From Field Studies
LBNL-5763E
The energy use in data centers is increasing and, in particular, impacting the data center energy cost and electric grid reliability during peak and high price periods. As per the 2007 U.S. Environmental Protection Agency (EPA), in the Pacific Gas and Electric Company territory, data centers are estimated to consume 500 megawatts of annual peak electricity. The 2011 data confirm the increase in data center energy use, although it is slightly lower than the EPA forecast. Previous studies have suggested that data centers have significant potential to integrate with supply-side programs to reduce peak loads. In collaboration with California data centers, utilities, and technology vendors, this study conducted field tests to improve the understanding of the demand response opportunities in data centers. The study evaluated an initial set of control and load migration strategies and economic feasibility for four data centers. The findings show that with minimal or no impact to data center operations a demand savings of 25% at the data center level or 10% to 12% at the whole building level can be achieved with strategies for cooling and IT equipment, and load migration. These findings should accelerate the grid-responsiveness of data centers through technology development, integration with the demand response programs, and provide operational cost savings.
A. B. Lekov, L. Thompson, A. T. McKane, A. Rockoff and M. A. Piette
2009
Opportunities for Energy Efficiency and Automated Demand Response in Industrial Refrigerated Warehouses in California
LBNL-1991E
This report summarizes the Lawrence Berkeley National Laboratory’s research to date in characterizing energy efficiency and automated demand response opportunities for industrial refrigerated warehouses in California. The report describes refrigerated warehouses characteristics, energy use and demand, and control systems. It also discusses energy efficiency and automated demand response opportunities and provides analysis results from three demand response studies. In addition, several energy efficiency, load management, and demand response case studies are provided for refrigerated warehouses. This study shows that refrigerated warehouses can be excellent candidates for open automated demand response and that facilities which have implemented energy efficiency measures and have centralized control systems are well suited to shift or shed electrical loads in response to financial incentives, utility bill savings, and/or opportunities to enhance reliability of service. Control technologies installed for energy efficiency and load management purposes can often be adapted for automated demand response (Open ADR) at little additional cost. These improved controls may prepare facilities to be more receptive to Open ADR due to both increased confidence in the opportunities for controlling energy cost/use and access to the real-time data.
Task J.1 - IAW 2008
Authors Year Title LBNL#
S. Goli, A. T. McKane and D. Olsen
2011
Demand Response Opportunities in Industrial Refrigerated Warehouses in California
LBNL-4837E
Industrial refrigerated warehouses that implemented energy efficiency measures and have centralized control systems can be excellent candidates for Automated Demand Response (AutoDR) due to equipment synergies, and receptivity of facility managers to strategies that control energy costs without disrupting facility operations. Auto-DR utilizes OpenADR protocol for continuous and open communication signals over internet, allowing facilities to automate their Demand Response (DR). Refrigerated warehouses were selected for research because: They have significant power demand especially during utility peak periods; most processes are not sensitive to short-term (2-4 hours) lower power
and DR activities are often not disruptive to facility operations; the number of processes is limited and well understood; and past experience with some DR strategies successful in commercial buildings may apply to refrigerated warehouses. This paper presents an overview of the potential for load sheds and shifts from baseline electricity use in response to DR events, along with physical configurations and operating characteristics of refrigerated warehouses. Analysis of data from two case studies and nine facilities in Pacific Gas and Electric territory, confirmed the DR abilities inherent to refrigerated warehouses but showed significant variation across facilities. Further, while load from California’s refrigerated warehouses in 2008 was 360 MW with estimated DR potential of 45–90 MW, actual achieved was much less due to low participation. Efforts to overcome barriers to increased participation may include, improved marketing and recruitment of potential DR sites, better alignment and emphasis on financial benefits of participation, and use of Auto-DR to increase consistency of participation.
R. Yin, A. Aghajanzadeh, R. Zhang, A. T. McKane, P. L. Therkelsen, T. Hong
2015
Development and Validation of Demand Response Quick Assessment Tool for Refrigerated Warehouses in California
LBNL-1003910
The goal of this project was to develop a Demand Response Quick Assessment Tool for Refrigerated Warehouses (DRQAT-RW) that can make accurate recommendations about Energy Efficiency (EE) and Demand Response (DR) potential in individual facilities. The objective of this tool is to provide a reliable way for simulating the operations of individual refrigerated warehouse facilities. This report discusses EE measures, DR considerations, and load shed or shift strategies relevant to refrigerated warehouses. In addition, the EnergyPlus model used as the simulation engine of the tool is described in detail.
DRQAT-RW was tested and validated at an actual cooler facility in southern California. An analysis on the measured and simulated space temperature resulted in acceptable tolerance values suggesting that even without model calibration DRQAT-RW’s simulation engine is capable of predicting accurate space temperature. In addition the model accurately predicted 1.5°F temperature increase due to a DR event at the test facility. The predicted temperature rise precisely represents the facility’s behavior during an actual event during which 9 probes collected real-time space temperature. The estimated demand reduction during the two hour DR event is 157 kW, which is very close to the measured load shed based on the baseline days of 3/17/2015 and 3/18/2015. It was found that the compressor load had large fluctuations before and after the DR test day. Using the average demand of all baseline days, the simulated load shed from compressor load is 20% higher than the measured on the DR test day, which is still within the acceptable model tolerances.
L. Thompson, K. Song, A. B. Lekov and A. T. McKane
2008
Automated Demand Response Opportunities in Wastewater Treatment Facilities
LBNL-1244E
Wastewater treatment is an energy intensive process which, together with water treatment, comprises about three percent of U.S. annual energy use. Yet, since wastewater treatment facilities are often peripheral to major electricity-using industries, they are frequently an overlooked area for automated demand response opportunities. Demand response is a set of actions taken to reduce electric loads when contingencies, such as emergencies or congestion, occur that threaten supply-demand balance, and/or market conditions occur that raise electric supply costs. Demand response programs are designed to improve the reliability of the electric grid and to lower the use of electricity during peak times to reduce the total system costs. Open automated demand response is a set of continuous, open communication signals and systems provided over the Internet to allow facilities to automate their demand response activities without the need for manual actions. Automated demand response strategies can be implemented as an enhanced use of upgraded equipment and facility control strategies installed as energy efficiency measures. Conversely, installation of controls to support automated demand response may result in improved energy efficiency through real-time access to operational data. This paper argues that the implementation of energy efficiency opportunities in wastewater treatment facilities creates a base for achieving successful demand reductions. This paper characterizes energy use and the state of demand response readiness in wastewater treatment facilities and outlines automated demand response opportunities.
Task J.3 - Wastewater
Authors Year Title LBNL#
A. B. Lekov, L. Thompson, A. T. McKane, K. Song and M. A. Piette
2009
Opportunities for Energy Efficiency and Open Automated Demand Response in Wastewater Treatment Facilities in California - Phase I Report
LBNL-2572E
This report summarizes the Lawrence Berkeley National Laboratory’s research to date in characterizing energy efficiency and automated demand response opportunities for wastewater treatment facilities in California. The report describes the characteristics of wastewater treatment facilities, the nature of the wastewater stream, energy use and demand, as well as details of the wastewater treatment process. It also discusses control
systems and energy efficiency and automated demand response opportunities. In addition, several energy efficiency and load management case studies are provided for wastewater treatment facilities. This study shows that wastewater treatment facilities can be excellent candidates for open automated demand response and that facilities which have implemented energy efficiency measures and have centralized control systems are well-suited to shift or shed electrical loads in response to financial incentives, utility bill savings, and/or opportunities to enhance reliability of service. Control technologies installed for energy efficiency and load management purposes can often be adapted for automated demand response at little additional cost. These improved controls may prepare facilities to be more receptive to open automated demand response due to both increased confidence in the opportunities for controlling energy cost/use and access to the real-time data.
\
Authors Year Title LBNL#
L. Thompson, A. B. Lekov, A. T. McKane and M. A. Piette
2010
Opportunities for Open Automated Demand Response in Wastewater Treatment Facilities in California - Phase II Report. San Luis Rey Wastewater Treatment Plant Case Study
LBNL-3889E
This case study enhances the understanding of open automated demand response opportunities in municipal wastewater treatment facilities. The report summarizes the findings of a 100-day submetering project at the San Luis Rey Wastewater Treatment Plant, a municipal wastewater treatment facility in Oceanside, California. The report reveals that key energy-intensive equipment such as pumps and centrifuges can be targeted for large load reductions. Demand response tests on the effluent pumps resulted a 300 kW load reduction and tests on centrifuges resulted in a 40 kW load reduction. Although tests on the facility’s blowers resulted in peak period load reductions of 78 kW sharp, short-lived increases in the turbidity of the wastewater effluent were experienced within 24 hours of the test. The results of these tests, which were conducted on blowers without variable speed drive capability, would not be acceptable and warrant further study. This study finds that wastewater treatment facilities have significant open automated demand response potential. However, limiting factors to implementing demand response are the reaction of effluent turbidity to reduced aeration load, along with the cogeneration capabilities of municipal facilities, including existing power purchase agreements and utility receptiveness to purchasing electricity from cogeneration facilities.
Task M1-M3 – IAW 2009
Authors Year Title LBNL#
D. Olsen, S. Goli, D. Faulkner and A. T. McKane
2012
Opportunities for Automated Demand Response in Wastewater Treatment Facilities in California - Southeast Water Pollution Control Plant Case Study
This report details a study into the demand response potential of a large wastewater treatment facility in San Francisco. Previous research had identified wastewater treatment facilities as good candidates for demand response and automated demand response, and this study was conducted to investigate facility attributes that are conducive to demand response or which hinder its implementation. One years’ worth of operational data were collected from the facility's control system, submetered process equipment, utility electricity demand records, and governmental weather stations. These data were analyzed to determine factors which affected facility power demand and demand response capabilities. The average baseline demand at the Southeast facility was approximately 4 MW. During the rainy season (October-March) the facility treated 40% more wastewater than the dry season, but demand only increased by 4%. Submetering of the facility's lift pumps and centrifuges predicted load shifts capabilities of 154 kW and 86 kW, respectively, with larger lift pump shifts in the rainy season. Analysis of demand data during maintenance events confirmed the magnitude of these possible load shifts, and indicated other areas of the facility with demand response potential. Load sheds were seen to be possible by shutting down a portion of the facility’s aeration trains (average shed of 132 kW). Load shifts were seen to be possible by shifting operation of centrifuges, the gravity belt thickener, lift pumps, and external pump stations. These load shifts were made possible by the storage capabilities of the facility and of the city’s sewer system. Large load reductions (an average of 2,065 kW) were seen from operating the cogeneration unit, but normal practice is continuous operation, precluding its use for demand response. The study also identified potential demand response opportunities that warrant further study: modulating variable demand aeration loads, shifting operation of sludge-processing equipment besides centrifuges, and utilizing schedulable self-generation.
Task IE - IAW DR End-Use Analysis and Field Studies (WA1-10.1)
Authors Year Title LBNL#
A. Aghajanzadeh, C.P. Wray, D. Olsen, A. McKane
2015
Opportunities for Automated Demand Response in California Wastewater Treatment Facilities
LBNL-1003845
Previous research over a period of six years has identified wastewater treatment facilities as good candidates for demand response (DR) and automated demand response (Auto-DR). This report summarizes that work, including the characteristics of wastewater treatment facilities, the nature of the wastewater stream, energy used and demand, as well as details of the wastewater treatment process. It also discusses control systems and automated demand response opportunities. Furthermore, this report summarizes the DR potential of three wastewater treatment facilities. In particular, Lawrence Berkeley National Laboratory (LBNL) has collected data at these facilities from control systems, submetered process equipment, utility electricity demand records, and governmental weather stations.
The collected data were then used to generate a summary of wastewater power demand, factors affecting that demand, and demand response capabilities. These case studies show that facilities that have implemented energy efficiency measures and that have centralized control systems are well suited to shed or shift electrical loads in response to financial incentives, utility bill savings, and/or opportunities to enhance reliability of service. In summary, municipal wastewater treatment energy demand in California is large, and energy-intensive equipment offers significant potential for automated demand response. In particular, large load reductions were achieved by targeting effluent pumps and centrifuges. One of the limiting factors to implementing demand response is the reaction of effluent turbidity to reduced aeration at an earlier stage of the process. Another limiting factor is that cogeneration capabilities of municipal facilities, including existing power purchase agreements and utility receptiveness to purchasing electricity from cogeneration facilities, limit a facility’s potential to participate in other DR activities.