HAL Id: halshs-00928678 https://halshs.archives-ouvertes.fr/halshs-00928678 Submitted on 13 Jan 2014 HAL is a multi-disciplinary open access archive for the deposit and dissemination of sci- entific research documents, whether they are pub- lished or not. The documents may come from teaching and research institutions in France or abroad, or from public or private research centers. L’archive ouverte pluridisciplinaire HAL, est destinée au dépôt et à la diffusion de documents scientifiques de niveau recherche, publiés ou non, émanant des établissements d’enseignement et de recherche français ou étrangers, des laboratoires publics ou privés. Demand-side management and European environmental and energy goals: an optimal complementary approach Claire Bergaentzlé, Cédric Clastres, Haikel Khalfallah To cite this version: Claire Bergaentzlé, Cédric Clastres, Haikel Khalfallah. Demand-side management and European environmental and energy goals: an optimal complementary approach. Energy Policy, Elsevier, 2014, 67 (April), pp.858-869. 10.1016/j.enpol.2013.12.008. halshs-00928678
Transcript
HAL Id: halshs-00928678https://halshs.archives-ouvertes.fr/halshs-00928678
Submitted on 13 Jan 2014
HAL is a multi-disciplinary open accessarchive for the deposit and dissemination of sci-entific research documents, whether they are pub-lished or not. The documents may come fromteaching and research institutions in France orabroad, or from public or private research centers.
L’archive ouverte pluridisciplinaire HAL, estdestinée au dépôt et à la diffusion de documentsscientifiques de niveau recherche, publiés ou non,émanant des établissements d’enseignement et derecherche français ou étrangers, des laboratoirespublics ou privés.
Demand-side management and European environmentaland energy goals: an optimal complementary approach
To cite this version:Claire Bergaentzlé, Cédric Clastres, Haikel Khalfallah. Demand-side management and Europeanenvironmental and energy goals: an optimal complementary approach. Energy Policy, Elsevier, 2014,67 (April), pp.858-869. �10.1016/j.enpol.2013.12.008�. �halshs-00928678�
Energy efficiency is one of the means of achieving the targets set by many countries, including
European Union Member States, for security of supply, free competition and cuts in greenhouse-gas
emissions. The development of smart grids is a possible solution for achieving these goals in
activating the demand through Demand Side Management (DSM) programs.. Currently, consumers
receive limited amounts of information and they cannot adapt their demand to price variations for two
reasons (Chao, 2011). The first reason relates to the widespread enforcement of fixed, regulated prices.
The level of these fixed prices generally prevents the emergence of any elasticity of demand, seen as
one of the key structural problems in electricity markets (Stoft, 2002). The second reason is due to the
technical obstacles preventing price signals from being sent to the consumer.
The deployment of smart grids and DSM programs should lessen this last obstacle. DSM would
enable consumers to optimize consumption, while giving network operators greater flexibility in the
management of the system. This in turn would lead to operational gains due in particular to the
appearance of demand elasticity in response to price signals, transmitted following the deployment of
smart metering and DSM (Haney et al., 2009). Many pilot studies have been carried out to study
demand response (DR) in the US and more recently in Europe (Coll-Mayor et al., 2007; Faruqui and
Sergici, 2010; Faruqui et al., 2010a and 2010b). The initial conclusions suggest that peak load-
shedding may be significant (Faruqui et al., 2007). DSM may also have an impact upstream mainly
due to changes in the marginal power plant(s). A generation bid may thus be replaced by load-
shedding. Demand elasticity affects both the cost of energy (productive and allocative efficiencies)
and efforts to reduce greenhouse gas emissions (environmental efficiency).
In this work we study the extent to which DSM tools could be used by policy makers or energy
operators to enhance system efficiency. To do so, we conduct a literature review of the effectiveness
of various DSM tools in terms of load reductions and costs implications. Based on the literature
results, we undertake a comparative analysis of the economic and environmental gains that could be
obtained by implementing different kinds of DSM tools. We distinguish three categories of DSM
3
measures going from simpler but less efficient DSM tools –efficiency is measured by the level of
expected demand shedding- to complex but more efficient tools. The comparison is based on the
optimisation of a simple quantitative model that considers five interconnected countries which are
different regarding their energy mix and their energy costs. A social planner is supposed to determine
optimal merit orders in each country, for each DSM scenarios, and the potential energy exchanges
between them by minimizing total dispatching costs. Two periods, a peak and an off-peak period, are
considered. The main criteria used to compare between the effectiveness of the studied DSM tools are
the variations in countries’ merit orders and their energy exchanges, dispatch and environmental costs’
reductions and technologies choices. Moreover, by considering rebound rate or consumption report, it
is worth studying the necessity or not to implement costly and complex instruments, often linked with
deep reductions of consumption, to significantly improve efficiencies and achieve a less costly
equilibrium. The work presented in this paper adds to the literature on modelling and analysing the
extent to which a DSM tool implemented in one country could impact energy exchanges and energy
mix in an interconnected markets.
The paper is organized as follows. Section 1 focuses on the use of DSM tools to elicit a demand
response from the retail market. Based on a literature analysis, we shall show that these signals do
really allow demand to be managed with consumers responding to price signals. As has often been
observed, deploying several information or price-based tools yields the best results. In section 2 we
present a quantitative study of gains in energy and environmental efficiency linked to demand-side
management. We shall see that these gains depend in particular on the generation technologies being
used and on report and rebound effects. Lastly section 3 gives recommendations to public authorities
to deploy the optimal set of DSM programmes in taking into account both energy & market integration
characteristics and the behaviour of demand.
4
1. Dynamic pricing and energy efficiency
1.1 Demand-response instruments for retail consumers
In the literature, two kinds of instruments are commonly used to implement Demand Response
(DR). The first one is the informational feedback. Indirect feedback corresponds to the information
“that has been processed” (Darby, 2006). It spreads good practices through education and information
campaigns. Direct feedback can be defined as an immediate transfer of information from the meter or
monitoring interfaces. Consumers are able to know their real time consumption level and to follow the
price variations.
The second instrument is the dynamic pricing with or without Direct Load Control (DLC), i,e a
third-party operator that manages load-shedding instead of consumers. We retain five pricing schemes:
(1) Time-of-use (ToU) pricing breaks down the day into set periods of time, each associated with
a specific, predetermined price. This is the simplest and most commonly used form of dynamic
pricing. However, it only allows limited flexibility, often with only slight price differences between
baseline and peak periods (Vickrey, 1971).
(2) Critical-peak pricing (CPP) responds to this criticism regarding flexibility. It is based on the
same principles as ToU but segments periods with a finer mesh (baseline, day time and critical-peak
periods). A warning signal is sent to consumers alerting them to a critical-peak period. Usually, the
price spread between day time and critical peak time is set large enough to further foster load
reductions.
(3) Peak-time rebate (PTR) pricing differs from the others: rather than being based on the
principle of a surcharge for peak consumption, PTR rewards a drop in consumption for such periods,
in relation to the baseline load curve.
(4) Real-time pricing (RTP) transmits per hour variations of the wholesale price to consumers.
(5) Inclining Block Rate (IBR) reduces average electricity consumption in applying an increasing
price with the level of consumption. A lower price compared to fixed price should be charged for the
first blocks that refer to the first kWh consumed. Above a determined threshold, a higher price is set.
5
Combining several of these instruments usually brings the most effective results. Thus, to
reinforce positive gains, these tools could be supplemented by DLC. Many studies recognized DLC as
a prerequisite to maximize the benefits of dynamic pricing schemes (Borenstein, 2002).
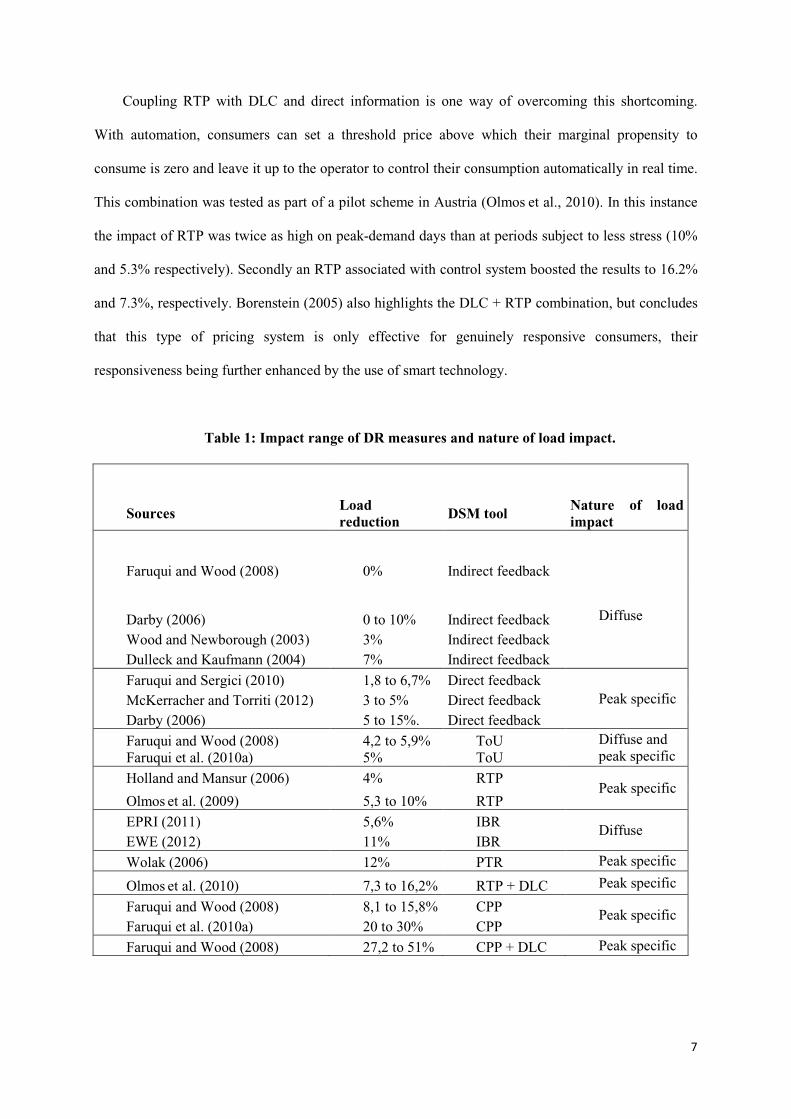
1.2 Energy efficiency related to real load reduction
A brief literature review will allow us to classify these measures according to their respective
impact on peak load reduction and diffuse or average load reductions, regardless of the period (Table
1).
The potential impact of indirect feedback is highly uncertain. It could be between 0 and 10%
(Darby, 2006), near 3% or 7% (Wood and Newborough, 2003; Duleck and Kaufmann, 2004), or can
have no impact (Faruqui and Wood, 2008). Various studies on direct feedback have shown that the
presence of an in-home display (IHD) could constitute an incentive to change consumption patterns.
The study of McKerracher and Torriti (2012) based on the analysis of 33 recent pilots concluded
direct information could reach a peak load shedding between 3% and 5%. The study by Faruqui and
Sergici (2010) shows its impact in reducing peak demand ranges from 1.8% to 6.7% on average1.
Darby (2006) estimates this impact to be between 5% and 15%. Using information with dynamic or
variable pricing further strengthens the load impact, although many studies underline the complexity
of determining what range of load cut can be attributable to each of the measures. The pilot scheme
carried out by Hydro One in Ontario, linking IHD and ToU, revealed that for an average reduction of
7.3%, more than half (4.3%) could be attributed to IHD (Faruqui at al. ,2010b).
Among the five pricing schemes mentioned above, two of them, IBR and ToU pricing, enable a
diffuse load reduction over time. In addition, ToU may have a substantial peak load effect. CPP, PTR
and RTP schemes are rather designed to peak shedding, although the peak load impact of RTP is more
marginal.
1The study cites two results exceeding those mentioned (-18% and -13%). However we have not used them, either because the pilot study was not complete at the time of publication, so the data were not final, or because the reduction had not been corrected to allow for climatic factors, despite the results of the pilot being compared with consumption by the same participants a year earlier.
6
Some empirical (Ito, 2012) or theorical (Crampes and Lozachmeur, 2012) studies demonstrate
that IBR scheme induces suboptimal consumption patterns and does not significantly reduce the
demand while other experiments show positive results. Pilots implemented by Commonwealth Edison
in the U.S. and the project eTelligence in Germany reached an average decrease of demand of 5.6%
and 11% respectively (EPRI, 2011 ; EWE, 2012).
The first feedback on ToU obtained from Californian pilot SPP show an average day time load
reduction between 0.6% and 5.9% (Faruqui and Wood, 2008). The upper end of this result is
consistent with the study of Faruqui et al. (2010a) which compiled the results of 26 pilot schemes
carried out by 18 utilities that revealed an average load reduction of 5%.
CPP and PTR are specifically designed to shed peak demand. CPP allows an average load
reduction between 20 and 30% (Faruqui et al., 2010a). The earlier studies by Faruqui and Wood
(2008) on SPP pilot scheme in California revealed that CPP had an impact of 8,1 to 51% on the load,
or an average peak reduction of 25%. The most significant results were obtained in using smart
technologies and DLC with CPP (27 to 51%). Wolak (2006), who studied the impact of another
Californian experiment in the municipality of Anaheim involving PTR, concluded this pricing could
reach 12% of peak load reduction. PTR implementation obtained a lesser impact than CPP. This
difference suggests that CPP offers consumers a greater incentive to adapt consumption at peak hours
than PTR, a fact borne out by a study made by the Baltimore Gas and Electric Company. In this case
the results obtained with CPP were 11% better than with PTR, with or without technology (The Brattle
Group, 2011).
Theoretical research on RTP (Chao, 2010) concludes that deploying RTP at all retail sites would
achieve optimum allocation with no deadweight losses. Regarding its potential impacts on the load,
pilot results mostly converge on the need of applying this pricing to a critical mass of consumers to be
able to reduce peak load by 4% with a substantial increase of consumption during off peak periods
(Holland and Mansur, 2006). However, empirical experiments show a relatively limited success of this
rate. Many RTP pilots illustrate the difficulties to achieve a sufficient amount of participants to
effectively improve the system efficiency (Barbose et al., 2005; Navigant Consulting Inc., 2011).
7
Coupling RTP with DLC and direct information is one way of overcoming this shortcoming.
With automation, consumers can set a threshold price above which their marginal propensity to
consume is zero and leave it up to the operator to control their consumption automatically in real time.
This combination was tested as part of a pilot scheme in Austria (Olmos et al., 2010). In this instance
the impact of RTP was twice as high on peak-demand days than at periods subject to less stress (10%
and 5.3% respectively). Secondly an RTP associated with control system boosted the results to 16.2%
and 7.3%, respectively. Borenstein (2005) also highlights the DLC + RTP combination, but concludes
that this type of pricing system is only effective for genuinely responsive consumers, their
responsiveness being further enhanced by the use of smart technology.
Table 1: Impact range of DR measures and nature of load impact.
Sources Load
reduction DSM tool
Nature of load
impact
Faruqui and Wood (2008) 0% Indirect feedback
Diffuse Darby (2006) 0 to 10% Indirect feedback
Wood and Newborough (2003) 3% Indirect feedback
Dulleck and Kaufmann (2004) 7% Indirect feedback
Faruqui and Sergici (2010) 1,8 to 6,7% Direct feedback
Peak specific McKerracher and Torriti (2012) 3 to 5% Direct feedback
Darby (2006) 5 to 15%. Direct feedback
Faruqui and Wood (2008) 4,2 to 5,9% ToU Diffuse and peak specific Faruqui et al. (2010a) 5% ToU
Holland and Mansur (2006) 4% RTP Peak specific
Olmos et al. (2009) 5,3 to 10% RTP
EPRI (2011) 5,6% IBR Diffuse
EWE (2012) 11% IBR
Wolak (2006) 12% PTR Peak specific
Olmos et al. (2010) 7,3 to 16,2% RTP + DLC Peak specific
Faruqui and Wood (2008) 8,1 to 15,8% CPP Peak specific
Faruqui et al. (2010a) 20 to 30% CPP
Faruqui and Wood (2008) 27,2 to 51% CPP + DLC Peak specific
8
1.3 Benefits and costs of DSM
As underlined by many authors (Borenstein, 2002; Borenstein et al., 2002; Borenstein, 2005;
Chao, 2010; Faruqui et al., 2007; Haney et al., 2009; Hogan, 2009), demand response (DR) can yield
significant economic and environmental gains. Economic gains are linked with the decrease in peak
load prices, with lower price volatility and consequently with the reduction of the risks borne by the
actors. According to Faruqui et al. (2007), reducing the American annual peak load by 5% would
allow a $5 to $10 billion benefits per year, corresponding to the short term drop of wholesale market’s
energy prices2. As peak-load generators are often thermal-units, environmental gains appear with
peak-load shedding that positively impacts GHG emissions cuts. At last the reshaping of the demand
curve allows to better integrate intermittent energies at least cost (Strbac et al., 2006; Hesser and
Succar, 2011). Additional benefits could come from consumers’ energy savings and reduced bills
(Haney et al., 2009) or from reduced transmission and distribution investments (Strbac, 2008).
As pointed out by Schweppe et al.. (1988) or Albadi and Al-Saadany (2013), consumers may
respond to a price variation in two ways: either by a net reduction in consumption or by delaying
usage. Yet the greater the volume of consumption that is shifted, the lower the economic and
environmental gains which may be expected from load-shedding (Rious et al., 2012). Thus, these
gains could be moderated by the rebound effect and the report effect.
The rebound effect characterizes the direct shift of avoided load during the few hours post event.
The Peaksaver® programme, which was developed in Ontario for remote control of air-conditioning
devices, proved its effectiveness by shedding 64.5MW of aggregated capacity. However it also
revealed a rebound effect of up to 65% (Kema, 2010). The greater the load-shedding, the more delayed
consumption must be controlled and spread over several hours.
Such spread leads to the second type of shifting effect, namely the report effect that could reduce
the efficiency gains expected of DSM under specific generation mix conditions. Some studies
highlight the tendency of significant load shifting from peak to off-peak periods. Spees and Lave
2Adding long term benefits such as avoided generation and transport & distribution capacity costs would increase this result by $3 billion per year (Faruqui et al., 2007).
9
(2007) clearly explain their concerns that RTP have been designed by many utilities to drive demand
down during peak periods while incentivizing a greater increase of demand during off-peak periods.
Obviously, costs of DSM are in line with expected benefits. So, results of a cost-benefit analysis
on the overall value chain are always uncertain. According to many studies, the cost per household of
deploying smart meters is comprised between $95 and $600 (Faruqui et al.,2010; Gyamfia and
Krumdieckb, 2013). Rious et al. (2012) report a 4 to 8 billion Euros to deploy 30 million smart meters
in France. The authorized deployment costs in California reached $4 billion to replace 10,5 million
meters. Faruqui et al. (2010) estimate the complete deployment costs in the EU to be 51 billion Euros.
As stated by Haney et al. (2009), the costs of deploying the technology can only be justified in
including well designed DSM measures, enabling efficient DR resources.
In what follows, we study the extent to which DSM tools could be used by policy makers or
energy operators to enhance system efficiency. As regard to EU energy and environmental policy
objectives, several DSM tools should help to alleviate the economic obstacles to that policy by, among
other issues, improving efficiencies and trades. Moreover, by considering rebound effect or
consumption report, it is worth studying the necessity or not to implement costly and complex
instruments, often linked with deep reductions of consumption, to significantly improve efficiencies
and achieve a less costly equilibrium.
2. Policy makers decisions and demand-side management tools:
illustration with five interconnected countries
The European Commission, throughout its Third Climate and Energy package, has set energy and
environmental goals for 2020 (European Commission, 2010). Further objectives beyond 2020 are
today in discussions. Beside these measures, the idea of an integrated energy market is always one of
the main fields the EC wants to promote3. It should improve minimisation of costs and optimisation of
3One of the major obstacles to market integration in Europe is the lack of interconnection capacities and lack of
incentives to invest on this infrastructure. Efficient DSM measures, by reducing countries’ consumption and by optimizing energy mix in all the interconnected countries, would help to reduce the need to invest more in the interconnection capacities and would make countries’ exchanges more possible and less costly. DSM could also
10
resources allocations. Integrating consumers as active players in the electricity system, where savings
are achieved by reducing peaks in demand and improving energy efficiency, are one of the necessary
measures to reach the appointed goals. According to the Blue Map scenario (IEA, 2008), controlling
energy consumption and electricity generation are two relatively inexpensive ways of cutting
greenhouse gas emissions by 2050. So, DSM is one of the tools that policy makers and energy players
could promote in order to:
• Increase energy and environmental efficiencies (with net reduction in demand or its
report during less costly generation periods, usually correlated with lower CO2
emissions).
• Improve exchanges and generation allocations between interconnected countries
(reducing blackout probability, intermittency or the use of inefficient technology).
• Increase system flexibility (to cope with increasing renewable energies penetration rate
and increasing peak load demand).
As regard to these European objectives, in the following we investigate how far implementing
DSM tools in an interconnected market could improve energy efficiency. We have modelled five
interconnected countries, each equipped with its own generation resources with specific constant
marginal costs for each generation technology4 (Appendix A).
To simplify the presentation of results, we will assimilate theses countries as those of CWE5:
• A country characterized by high penetration of wind and natural gas energy sources
(Spain).
• A country characterized by high penetration of gas power (the Netherlands).
• A country characterized by high penetration of coal and wind power (Germany).
have a direct effect on promoting internal and integrated electricity market. When countries are observing a reduction in their consumption and being more able to export energy at low cost, this would constitute an efficient way to optimize energy exchanges and to improve efficiency within integrated electricity systems. 4 Datas on the marginal cost of generation are the private property of firms. It is consequently difficult to observe
or calculate such data. The marginal cost here is an approximation based on available data relating to the variables costs for each country. The values are the authors’ own estimates. 5According to ENTSO-E categorisation for countries of the Central West European area.
11
• A country characterized by high penetration of nuclear and hydro-power (France).
• A country characterized by high penetration of gas and nuclear power (Belgium).
We assume there are two periods of consumption: a peak period, at 7pm, and an off-peak period,
at 4am (Appendix B). For each country, we will compute overall costs to serve demand. They are
made by the sum of generation and environmental costs of the two periods of consumption.
A tonne of CO2 is valued at €14.186. Appendix C shows the contribution of each generation
technology to carbon emissions. Currently, the European Emission Trading System (ETS) is less
restricting and free permits are allocated. Consequently, we consider that these costs are not included
in bidding strategies7.
Two scenarios are tested. The first one determines the level of DSM necessary to improve energy
and environmental efficiencies in a context of isolated markets. The second one extends the reflexion
with limited interconnexion capacity between the countries. At last, we introduce the constraints of
rebound and report effects to make sound recommendations in the implementation of DSM programs.
The various countries are looking for ways of optimising productive efficiency, i,e minimising
dispatching costs, while balancing supply and demand. The optimisation program developed
(Appendix D) aims to minimise total generation costs for each country (Eq. D.1), as a function of the
quantity produced to serve both the domestic demand and the exports, subject to several constraints of
generation (Eq. D.2), of exchanges (Eq. D.3) and of balancing supply and demand (Eq. D.4). To
analyse DSM tools, we use the results of the minimisation program of total dispatching costs and the
subsequent merit orders. We determine the generation that should be shed to change the marginal plant
or to increase exports and trades between countries. Then, we analyse two cases without and with
report of load shedding to another period of consumption (report or rebound effects).
6Bluenext value on 17 January 2011 corresponding to the period of consumption covered by our study.
7The introduction or modifications of CO2 prices do not impact the main intuitions and results of our study
(Appendix F shows that total dispatching cost is always decreasing at a decreasing rate whatever the price of a tonne of CO2). Few impacts on the merit orders in countries are observed (only in France or Germany between gas and coal thermal units) but our conclusions are not modified. A very high price of CO2 (around 650€/tCO2) will be needed to introduce oil thermal units in merit orders.
12
We note that our analysis is not a cost-benefit one8. Its main objective is to study the effectiveness
of several DSM tools in terms of variations in countries’ merit orders and energy exchanges, dispatch
and environmental costs’ reductions and technologies choices. We omit so the specific costs of the
analysed DSM measures9.
2.1. Demand-side management strategies for isolated markets
Without interconnection, the countries would fall into two categories. On the one hand we find
countries with well diversified generation capacities, producing little pollution but with only limited
peak capacity. France and Belgium belong to this group. By deploying demand-side management
measures they would above all improve reliability. The aim would be to reduce peak demand, either to
bring down energy costs (France) or to balance supply and demand (Belgium). In France 2% DSM
would avoid the need to use oil-fired plants at peak hours, making gas-fired plants the marginal
source. The reduction in peak demand would also lead to environmental gains through avoided
generation. Belgium has insufficient capacity to satisfy peak demand. Operating in isolation, it would
have to face substantial value of loss load. Reducing 5% of demand would enable it to restore market
balance.
In contrast we find countries heavily equipped with fossil-fuel power plants, with overall capacity
more than sufficient to cover peak demand. This group comprises the Netherlands, Spain and
Germany. These countries would gain by deploying DSM measures in order to reduce their overall
demand. These reductions result in substantial energy and environmental gains, there being less need
to use fossil-fuel capacity. In Germany, coal-fired plants being marginal at peak hours, any drop in
8 In that case not only the cost of DSM has to be considered but other costs such as additional system operation
costs and also other benefits of DSM, i.e. the avoided infrastructure and interconnection costs for instance. For example, the smart grids project implemented in Orkney, UK, has an estimated cost of building new power lines of £30 million to integrate 28MW of wind energy whereas a smart grids technology investment was of £0.5 million (Kema, 2012). 9For our analysis, including these costs would not affect our results. Indeed as we will see in the next section, our
results suggest that there is no need to implement a sophisticated and a de facto costly DSM measure. A simple DSM measure will be sufficient where no rebound effects are observed contrarily to a complex DSM measure. Including these costs would just have the effect of strengthening the inefficiency of a complex DSM measure. The second reason is that a DSM measure as an innovation investment is a long term task. One would need to depreciate the DSM cost and determine its precise hourly cost which would be irrelevant for our analysis as we only consider two representative hours of consumption.
13
demand would immediately result in greater efficiency, and direct energy and environmental gains. A
scenario in which Germany stops using nuclear power would substantially change this result. The
merit order would be affected, with oil-fired plants used at peak hours. Germany would gain by cutting
peak consumption by more than 3.45% in order to improve energy and environmental efficiency, with
gas or coal-fired plants acting as the marginal electricity source.
Each of these countries would consequently gain by developing DSM, either to achieve greater
flexibility and reliability, or to reduce carbon emissions. In view of the respective energy mixes,
relatively limited demand-response incentives would yield significant gains. In most cases priority
should be given to simple, inexpensive DSM solutions (Table 2). Time-of-use pricing or direct
information on price variations is enough to achieve reductions in load of between 2% and 3.45%. To
achieve additional gains it will be necessary to deploy critical-peak pricing or peak-time rebates. More
complex DSM schemes are preferable in situations, such as Belgium, where the security of supply is
compromised. Although it is possible to achieve a 5% reduction in load by deploying the solutions
recommended for greater flexibility, the prime constraint of maintaining equilibrium is an incentive to
prefer automated load-control measures. Lastly ToU pricing, Inclining Block Rates (IBR) and direct
feedback, seem more appropriate for reducing overall demand in countries with substantial fossil-fuel
capacity.
Table 2: DSM strategies for various energy goals
Target Country Goal DR amount DSM solution
Flexibility
Belgium Reliability,
load-balancing 5% DLC
France Switch to
inframarginal plant 2%
ToU, PTR, CPP, direct feedback
Germany without nuclear
Switch to inframarginal plant
3.45% ToU, PTR, CPP, direct
feedback
Direct environmental
gains
Germany with nuclear Reduce output level to
cut emissions Maximum
IBR, direct feedback,
ToU
Spain
The Netherlands
14
Table 2 shows the DR efforts required to achieve initial efficiency gains associated with load-
shedding. Higher gains may be achieved through more intensive DR measures, but with decreasing
returns due to the increasingly low economic or environmental cost of the marginal plants being shed.
This tendency may offer an incentive to develop more ambitious DSM tools, but its effect is limited if
allowance is made for the effect of peak demand shifting to off-peak hours. The greater the DR, the
more the gains achieved at peak hours will be clawed back at off-peak hours. This effect is all the
more noticeable in countries with large fossil-fuel capacity. Progressive reconnection may prove
effective in the event of substantial load-shifting.
2.2. Efficiency, demand side management and limited interconnection
capacities
We consider now a second scenario where countries are interconnected with limited capacities.
With this model the only countries to be coupled at peak hours are Germany and the Netherlands, and
France and Belgium; interconnection capacities are not saturated. The costs in force in the four
markets would be, respectively, the cost of the marginal German plant and the cost of the marginal
French plant (Table 3). The Spanish market is uncoupled, trade saturating its interconnections.
15
Table 3: Energy marginal cost with limited interconnection capacity
Period Countries
Energy marginal
cost (€/MWh)
Technology Trades
Peak
Spain 27 Gas Exports 1,300 MWh to France
The Netherlands 32 German coal Exports 1,716.4 MWh to Germany and 2,400
MWh to Belgium
Germany 32 Coal Exports 2,700 MWh to France;
imports 1,716.4 MWh from the Netherlands
France 41 Gas Imports 1,300 MWh from Spain, 2,700
MWh from Germany and 561.1 MWh from Belgium
Belgium 41 French gas Imports 2,400 MWh from the Netherlands;
exports 561.1 MWh to France.
Base
Spain 27 Gas Imports 500 MWh from France
The Netherlands 16 Gas Exports 3,850 MWh to Germany and 2,400
MWh to Belgium.
Germany 32 Coal Imports 3,200 MWh from France and 3,850
MWh from the Netherlands.
France 18 Belgian gas Exports 500 MWh to Spain, 3,200 MWh to
Germany and 1533.5 MWh to Belgium.
Belgium 18 Gas Imports 2,400 MWh from the Netherlands
and 1533.5 MWh from France.
Demand-side management measures would improve the productive and environmental efficiency in all
the countries, provided that load-shifting effects are zero. Countries with substantial fossil-fuel
capacity operating as marginal plants (Netherlands, Spain and Germany) would see increasing linkage
between DSM and efficiency, particularly through improved environmental efficiency. Shifting of
demand would wipe out these gains, because the plants operating at off-peak hours run on fossil fuel
and interconnection capacity would be saturated. In contrast, the other countries (France and Belgium)
use much more widely diversified capacity to meet demand. DSM would be likely to reduce the total
cost of energy, by changing the marginal plants (France and Belgium) or by increasing exports
(Netherlands), but also emissions costs if the plants being shed were fossil-fuelled. We shall now look
at what would happen if these three countries simultaneously deployed various types of DSM
measures (see Table 4).
16
Table 4: DSM scenarios
Country Demand-side management (%)
Slight effort Medium effort Large effort Very large effort
The Netherlands 4.36 6.8 12.68 12.68
France 4.12 11.6 13.82 16.91
Belgium 7.31 9.28 14 14
Interconnections play a key role in energy efficiency and as a result in environmental efficiency.
If none of the load initially shed is shifted, Spain and the Netherlands are not affected by the measures:
because in Spain interconnection capacity is constantly saturated, and in the Netherlands exports take
the place of national DSM measures. On the other hand for the other countries any change to the
structure of demand in one country would have repercussions on the energy and environmental
efficiency of its neighbors due to trade.
Even limited demand-control measures in France, Belgium and the Netherlands lead to an
increase in imports in Germany and a drop in its coal-fired output. The effort made by the Netherlands
results in additional available output which it can export to Germany at €32 per MWh (German coal-
fired plant), a price exceeding the generation marginal costs of each of its plants being brought online.
So, in the light of this result, efforts by neighboring countries could contribute to the success of
German plans to phase out nuclear power.
A slight DSM effort in France would substantially reduce the marginal cost of energy, with
marginal generating sources switching from gas to coal. Imports from Belgium would increase,
contributing, in combination with DSM, to a change in the French marginal plants. French coal-fired
power plants would become the marginal plant for the French and Belgian markets, costing €35 per
MWh. Furthermore Belgium could export more electricity, thanks to the DSM policies it deploys.
Much as the Netherlands it would gain by exporting output rather than cutting it back, as the Belgian
and French markets are coupled. Though such exports entail additional energy and environmental
costs, they also yield a benefit associated with the overall improvement in productive efficiency, and
with export earnings.
17
Between 4% and 17% DSM, ranging from minor to quite substantial efforts, would significantly
improve energy and environmental efficiency. The reduction in the dispatching cost of satisfying
demand in each country, for the two periods under study, could exceed 80% of the baseline cost
(Figure 1). This result is intuitive because it assumes there is no shifting of demand, once it has been
shed. As a result optimised trade and reduced consumption would yield greater efficiency. Germany,
without making any effort itself, would benefit from the measures taken by its neighbours, by
importing energy which would take the place of output from its coal-fired plants, with their high
carbon emissions. These results highlight the fact that all the countries would not necessarily need to
adopt the same measures to achieve significant overall results. Effective real-time transmission of
information in the Netherlands would be likely to lead to a sufficient cut in demand. Countries such as
Belgium that can benefit the most from aggressive DSM could choose to use peak-load specific
pricing (CPP, PTR or any DLC-based pricing). However, any DSM measure improves efficiency, so
just effective direct information or ToU (representing a slight or medium effort) would yield
significant efficiency gains (reducing the dispatching cost by 40% to 80% depending on the countries).
Additional measures would certainly produce further efficiency gains, but with a decreasing rate.
Figure 1: Variations of aggregated total variable cost – peak and off-peak periods (with no
shifting of demand)
-50
-45
-40
-35
-30
-25
-20
-15
-10
-5
0
Slight effort Medium effort Large effort Very large
effort
Germany
France
Belgium
Total
DSM effort %
18
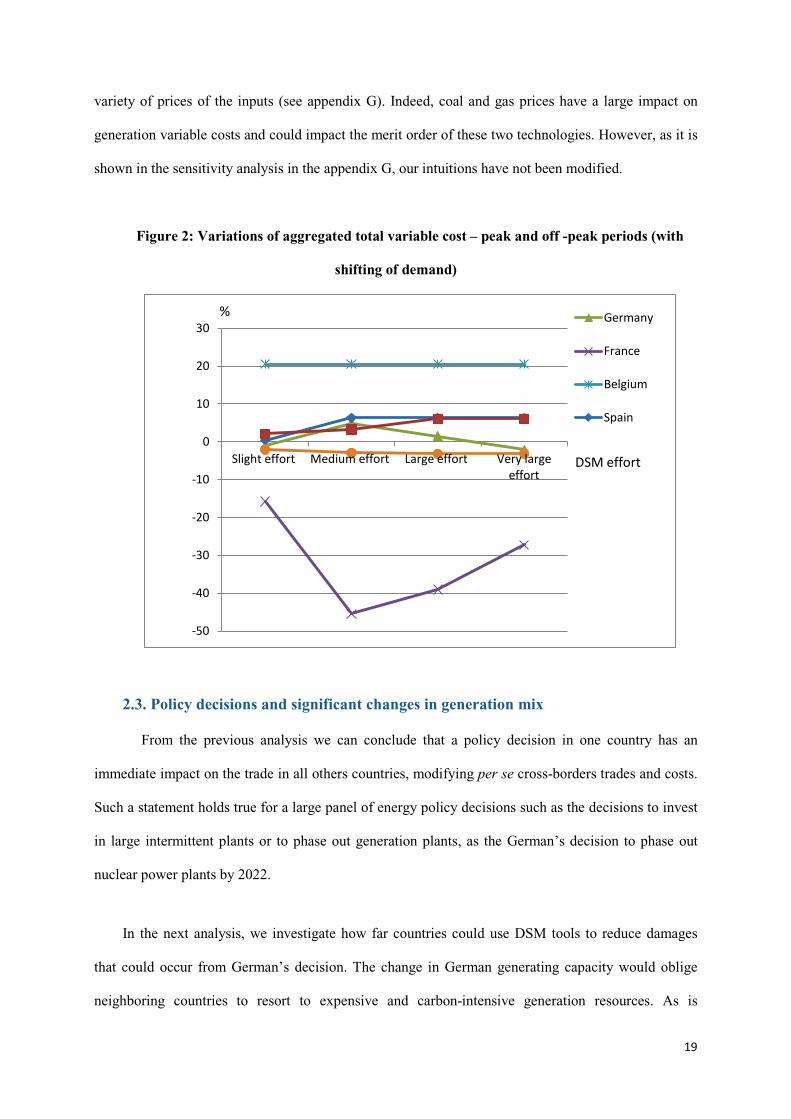
If all the load shed during the peak period was shifted to an off-peak period, it would not reduce
DSM’s positive impact on efficiency (see Figure 2). In some countries, excessive DSM would damage
efficiency through changes in trade and costly load shifting. Costs in Spain would rise, because the
shifting of demand to the off-peak period would tip the balance from importing to exporting country.
Spanish gas-fired generation costs less than the additional base load generating technologies used by
its neighbors due to load-shifting. As a result its base load gas-fired generation would increase,
pushing up its energy and environmental costs. Obviously this leads to trade-related revenue,
counterbalancing the negative effect on costs. The Netherlands would be in the same position. Its
national DSM system would enable it to export more gas-generated energy, available in larger
quantities thanks to reduced demand. There would consequently be no gain in terms of cost during the
peak period. On the other hand, load-shifting would increase base load consumption, which would
lead de facto to an increase in energy and environmental costs, the surplus demand being supplied
thanks to gas-fired plants. Here again the negative effects would be counterbalanced by revenue
derived from trade.
Integrating DSM in Spain and Germany in this analysis does not change the above results. This
addition does allow a further improvement in dispatching costs, without load-shifting. However it does
not allow a reduction in imports by these two countries, with marginal fossil-fuel plants (coal in
Germany, gas in Spain) operating as the base load resource and with plenty of capacity. Any shift in
demand reduces these gains, as the off-peak marginal plants are thermal.
As we can see from Figure 2, the most effective solution would be a slight or medium-intensity
DSM effort. More aggressive measures would not significantly improve the situation and might even
make it worse for some countries, load-shifting to the off-peak period increasing carbon emissions and
dispatching costs. Here again real time information or ToU would yield significant results. The
complexity of the measures entailed by more intensive DSM (dynamic pricing, DLC) would not
necessarily yield substantial marginal gains. These results always hold even if we modify some
assumptions as for instance internalizing CO2 prices in variable costs (see appendix F) or considering a
19
variety of prices of the inputs (see appendix G). Indeed, coal and gas prices have a large impact on
generation variable costs and could impact the merit order of these two technologies. However, as it is
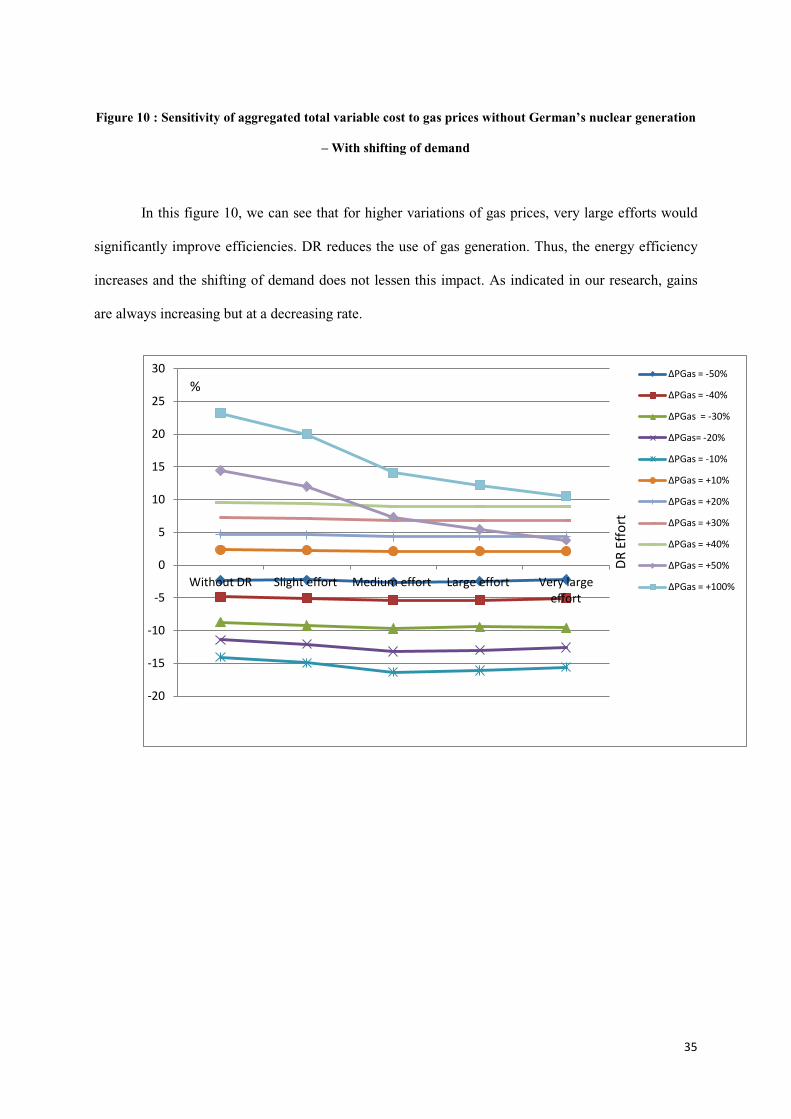
shown in the sensitivity analysis in the appendix G, our intuitions have not been modified.
Figure 2: Variations of aggregated total variable cost – peak and off -peak periods (with
shifting of demand)
2.3. Policy decisions and significant changes in generation mix
From the previous analysis we can conclude that a policy decision in one country has an
immediate impact on the trade in all others countries, modifying per se cross-borders trades and costs.
Such a statement holds true for a large panel of energy policy decisions such as the decisions to invest
in large intermittent plants or to phase out generation plants, as the German’s decision to phase out
nuclear power plants by 2022.
In the next analysis, we investigate how far countries could use DSM tools to reduce damages
that could occur from German’s decision. The change in German generating capacity would oblige
neighboring countries to resort to expensive and carbon-intensive generation resources. As is
-50
-40
-30
-20
-10
0
10
20
30
Slight effort Medium effort Large effort Very large
effort
Germany
France
Belgium
Spain
DSM effort
%
20
intuitively clear, any load-shedding that does not simply lead to demand shifting to a later period,
reduces the energy and environmental costs of electricity generation.
Shifting of demand does not change these overall conclusions (Figure 3). However the situation
deteriorates for Spain and Germany. Load-shifting leads to surplus costs because Spain could not
import cheap energy from France. The shifting of demand lessens the availability of cheaper and less
carbon-intensive generations. Thus, Germany must produce more energy with its coal-fired power
plants in off-peak hours and increases its costs. In Belgium gas becomes highly competitive. With
load-shedding and for large efforts, it has less need for its peaking resources to meet demand and can
therefore increase exports towards Germany.
Here again, it is apparent that due to load-shifting, high-intensity DSM measures do not yield any
gain in efficiency. Slight or medium-intensity measures are both the least expensive to deploy and the
most efficient.
Figure 3: Evolution in aggregated total variable cost without German’s nuclear generation
(with shifting of demand)
-50
-40
-30
-20
-10
0
10
20
30
40
50
Slight effort Medium effort Large effort Very large effort
Spain
Netherlands
Germany
France
Belgium
Total
DSM Effort
%
21
2.4. Load-shedding and the rebound effect
The rebound effect has been studied in the literature (Greening et al., 2000) and could alleviate
DSM gains. So far, we have focused on the effect of load-shifting to off-peak hour. However, this
effect generally appears a few hours after the event, associated with a rebound effect, at a time when
the level of demand is still high. The rebound effect occurs due to massive load-shifting, creating
another peak in demand which undermines system reliability (Earle et al., 2009). Under rebound and
reconnection effects, the positive impacts of load-shedding may be reduced or altogether reversed.
To study this phenomenon we assume two adjoining periods of peak demand (7 and 8pm, see
Appendix B).
With a relatively low rebound effect, (less than 60% of reconducted shed load), high-intensity
DSM would be preferable to less ambitious measures (see Figure 4). The positive gains obtained
through load-shedding are sufficient to counterbalance the additional generating costs caused by the
rebound effect. When the rebound effect is larger (60% or more), then more limited load-shedding
would be preferable to minimize the overall energy and environmental cost. Low-intensity DSM
measures avoid the loss of the positive gains, even in the event of a large rebound effect.
Figure 4: Variation of aggregated total variable cost as a function of the rebound effect
-10
-9 -8 -7 -6 -5 -4 -3 -2 -1 0 1 2 3 4 5 6 7 8 9
10 11 12 13 14
0 10 20 30 40 50 60 70 80 90 100
DSM 4%
DSM 7%
DSM 9%
%
%
Rebound
effect
22
There is a significant divergence between the variations in overall cost in the countries under
study. In Spain and the Netherlands there is no change in efficiency, but for different reasons. Much as
the assumption without a rebound effect, the interconnection between Spain and France is saturated
and exports from the Netherlands to Germany increase.
Germany benefits from its central position and the quality of interconnections with neighboring
countries. For all the load-shedding scenarios (see Table 4), its energy and environmental efficiency
are improved. Germany imports surplus output from the Netherlands, generated by gas-fired plants,
taking the place of its own coal-fired plants, which are more expensive and emit more greenhouse
gases.
The picture regarding efficiency is similar both in France and Belgium. With a low rebound effect
(under 50%) ambitious DSM generally cuts costs (down by between 7% and 35%). However a higher
rebound effect results in increased use of very expensive, carbon-intensive power plants (coal, gas and
oil), which makes it preferable to deploy more limited DSM, in order to preserve the net gains
associated with the measures deployed (Figures 5).
Figure 5: Variations in the aggregated total variable cost as a function of the rebound effect
– France
-60
-40
-20
0
20
40
60
80
0 10 20 30 40 50 60 70 80 90
DSM 4%
DSM 7%
DSM 9%
DSM
11%
%
Rebound
effect (% )
23
3. Conclusions and Policy Implications
The analysis made in this paper can recommend that relying on DSM tools would be an efficient
measure to achieve part of EU environmental and energy objectives. More precisely, five main policy
recommendations emerge from this study:
Adopting DSM tools would help to reach EU energy policy in terms of energy efficiency
By relying on tariff and information-based instruments, we can expect a reduction of both total
and peak demand. The various experiments reported above show that a combination of several
instruments is the most effective solution to induce large-scale load-shedding. Feedback from these
pilots highlights a range of DSM solutions which may shed from 1.8% of the load, with initial
measures (direct information broadcasting), rising to more than 30% at peak hours (critical-peak
pricing and direct load control). It seems that the diversity of DSM tools, their degree of flexibility, the
manner in which they are deployed and the certainty regarding their effects is sufficiently large to
meet the specific demands of individual countries.
Less costly or simplest DSM tools are often sufficient to improve significantly energy and
environmental efficiencies, and to move towards European objectives.
Simple solutions are sufficient to decrease the energy cost of covering the demand. More
sophisticated solutions such as emergency tariffs (CPP, PTR) could be used to increase those gains
and become increasingly necessary to reduce the risk of unbalance. Adding a DLC would allow to
offset the uncertainty linked to the voluntary response made by consumers and should be preferred in
the case of short available power capacity. On the other hand countries with a lower risk of system
failure, but more serious environmental impacts, should prefer simplest load-shedding tools with a
broader effect (information, IBR, ToU). Two further steps of research could be introduced for future
works. The first one will be to distinguish retail and industrial consumptions. In our analysis, no
distinction between consumers profile is made. This distinction could modify the notion of simple DR
tools, as defined in this work. Indeed, retail consumers represent more than 60% of electricity
24
consumption in Europe, industry about 40%. Industry consumption has been managed for a long time
with DR tools. As an example, the RTP is successfully and widely used for large consumers. They
could manage their consumption with dedicated persons who pilot their demand considering the price
of energy. Because of their high level of consumption, gains will be significant for each of them.
However, the intuition of this research remains valuable even if this distinction is no made. It is true
that if DSM for industry leads to very low load-shedding, retail consumers should increase their
demand response and operators must adapt DSM tools to increase efficiency. But in practice, DSM is
more mature in industry, so the impact of DR tools could be greater, lowering then DSM needs for
households. The second step is to integrate network needs in the analysis that should open additional
policy implications. Public authorities should consider that deeper DSM tools could be preferred to
improve the management of renewable energies and to avoid costly networks reinforcements. Nykamp
(2012) has shown the substitutability between traditional investments in expanding and reinforcing the
grids and "smart solutions". So, favoring smart solution leads to enhanced network operations and is
likely to represent a smaller investment compared to conventional solutions.
Beside the per se benefit of cross-borders infrastructures, DSM tools would bring to all
countries strong positive externalities in terms of energy efficiency.
As regard to EU policy, each country should invest in cross-borders infrastructures to increase
exchanges and to improve efficiency of matching generation and demand. Because of its impact on a
country’s generation mix, DSM tools would increase the optimal use of all cross-borders lines to
reduce costs of energy. Countries are then able to export or import cheaper and environmental friendly
energy, improving their productive efficiency.
DSM tools can provide additional solutions to counterbalance the shortfall in generation due
to the expected phasing-out of less acceptable power plants. i.e. German’s nuclear power plants
As it has been discussed, DSM would be a successful backup tool to counterbalance the expected
generation shortfall due to the near phasing-out of older power plants in most European countries. It
25
should also help to absorb negative impacts that will occur due to possible changes in merit order in
these countries. For instance, German’s decision to phase out nuclear power and to replace part of it by
renewable energies should be accompanied by implementing DSM measures, alleviating the negative
impact on environmental, reliability and efficiencies goals. German’s decision would also alter the
“economic model” of its gas units, i.e. many power plants being stopped for an undetermined period.
More intensive DSM measure would be needed to reduce the relying on coal units, since ETS market
still being imperfect and unable to give right price signals. These conclusions hold mainly when coal
generation is highly competitive compared to gas technologies (appendix G). This should restore the
balance of the economic model of gas units which constitutes the efficient back-up technology to a
system going to have a great share of renewable energy.
Avoiding a strong rebound effect with medium intensity DSM or diffuse load-shifting would
help to preserve energy and environmental gains.
These conclusions endorse our intuitive understanding, namely that limited DSM measures are
preferable when substantial rebound effects are expected. DSM measures do not necessarily impact on
a country’s efficiency, witness the Netherlands. Individual countries may benefit from exporting more
output, in order to boost revenue and reduce the aggregate costs of balancing supply and demand.
Interconnections transfer the benefits of DSM from one country to another through trade and
generation cost differentials, as can be seen from Germany’s central role. Without making an effort
itself, efficiency is improved without suffering the constraints of a rebound effect. Much as Spain, it
can nevertheless deploy DSM, as any rebound effect less than 100% of demand shedding yields net
gains in terms of energy and environmental efficiency.
Rebound and load-shifting effects require the use of complementary tools. The rebound effect
generally occurs with CPP and PTR. So it should be managed using price signals or DLC. Load-
shifting should be dealt with using DSM solutions such as direct information broadcasting or ToU
pricing.
26
References
Albadi, M.H., El-Saadany, E.F., 2013. A summary of demand response in electricity markets.
Electric Power Systems Research 78 (11), 1989–1996.
Barbose, G., Goldman, C., Bharvirkar, R., Hopper, N., Ting, M., Neenan, B., 2005. Real Time
Pricing as a Default or Optional Service for C&I Customers: A Comparative Analysis of Eight Case
Studies. Lawrence Berkeley National Laboratory-57660.
Borenstein, S., Jaske, M., Rosenfeld, A., 2002. Dynamic Pricing, Advanced Metering and
Demand Response in Electricity Markets. Center for the Study of Energy Markets, University of
California Energy Institute, Berkeley.
Borenstein, S., 2002. The Trouble With Electricity Markets: Understanding California's
Restructuring Disaster. The Journal of Economic Perspectives 16 (1), 191–211.
Borenstein, S., 2005. The Long-Run Efficiency of Real-Time Electricity Pricing. The Energy
Journal 26 (3), 93–116.
Chao, H.P., 2011. Demand response in wholesale electricity markets: the choice of customer
baseline. Journal of Regulatory Economics 39 (1), 68–88.
Chao, H.P., 2010. Price-Responsive Demand Management for a Smart Grid World. The
Electricity Journal 23(1), 7–20.
Coll-Mayor, D., Paget, M., Lightner, E., 2007. Future intelligent power grids : Analysis of the
vision in the European Union and the United States. Energy Policy 35 (4), 2453–2465.
Crampes C., Lozachmeur J-M., 2012. Tarification Progressive de l’Electricité. Conférence
Annuelle de l’Association des Economistes de l’Energie (AEE). Paris, 11 décembre 2012.
Darby, S., 2006. The effectiveness of feedback on residential energy consumption. A review for
DEFRA of the literature on metering, billing and direct displays. Environmental Change Institute,
University of Oxford.
Dulleck, U., Kaufmann, S., 2004. Do customer information programs reduce household
electricity demand – the Irish program. Energy Policy 32 (8), 1025-1032.