Working Paper No. 2011/32
Demand Variability in Supply Chains:
The Influence of Global developments and
Globalization on the Local Dutch Steel Industry
Herman de Kwaasteniet 1
November 2011
© The author, 2011
1. Maastricht School of Management, The Netherlands
2
The Maastricht School of Management is a leading provider of management education
with worldwide presence. Our mission is to enhance the management capacity of
professionals and organizations in and for emerging economies and developing countries
with the objective to substantially contribute to the development of these societies.
www.msm.nl
The views expressed in this publication are those of the author(s). Publication does not
imply endorsement by the School or its sponsors, of any of the views expressed.
THIS PAPER IS A DRAFT VERSION PREPARED FOR THE 1ST ANNUAL MSM RESEARCH
CONFERENCE, 11-12 NOVEMBER 2011 – IT IS INTENDED FOR DISCUSSION PURPOSES
ONLY
3
Abstract
For many decades the steel industry has developed on a slow but steady pace. Since
2004 the developing economies in Eastern Europe, Asia and South America radically
influenced this situation. The growth in these regions was an important cause of
shortages in raw material and resulting price fluctuations. Other aspects were
improved logistics, speculation and the creation of global multinationals in the steel
and mining industries.
The local Dutch steel market evolved differently. In recent years, the market volume
has shown a slow but steady decline as a result of economic, social and demographic
factors as well as outsourcing and off shoring. As a result, local competition increased,
causing pressure on operational margins and increasing financial risks. The current
increased demand variability has a negative impact on these effects.
This study aims to identify the causes and the consequences of the variability in
demand that has been experienced by the Dutch steel sector. The study focuses on
steel sheets and sections (beams); products which are used in different markets. Steel
construction companies (SCCs) purchase steel sections for uniquely designed building
projects. Steel sheet processing companies (SSPCs) are process orientated and supply a
wide range of industries, often on the basis of medium term contracts. This orientation
provides them with the options to hold stocks, in sharp contracts to steel companies
operating in the construction sector. Second, this study aims to find solutions for the
supply chain to mitigate the negative consequences of demand fluctuations.
Secondary company data was analyzed to establish to what extent variability of
demand in the Dutch supply chain of steel sheets and sections exists. By using a survey,
the consequences for the Dutch steel sector were quantified for SCCs and SSPCs. The
study identified the causes of the variability of demand by conducting a survey among
a group of SCCs and SSPCs and by comparing demand data to both local and global
market indicators. Finally, possible solutions were discussed with steel processors by
means op in-depth unstructured interviews.
The study confirms that different echelons in the supply chain inflict different levels of
demand variability on their upstream suppliers. SCCs and SSPCs increase variability
demand significantly, while steel distributors facilitate a smoother demand pattern for
steel mills, a phenomenon known as the reversed bullwhip effect.
The most important factor that influences the level of variability of demand is
(expected) price fluctuations, followed by batch ordering. Price fluctuations are
identified to be largely dependent on global factors. To a lesser extent they are related
to local economic development. Therefore we can conclude a direct influence of global
developments and globalisation on the local Dutch stele sector exists.
4
1. INTRODUCTION; AN OVERVIEW
After a long period of relative stability, the global steel industry has undergone
significant changes since 2004. The economic growth of the emerging economies of
East Asia and South America resulted in global shortages and price rises for many raw
materials, energy, labour and logistical services. Mining companies and steel mills
expanded their capacities. China became the dominant producer, increasing its share
from 13% to more than 50% of world steel output (CRU, AM Fact book 2009).
Increased options for transportation created a global market for raw materials.
Through a process of mergers and acquisitions, large multinationals came into being. In
2002, the top 3 mining corporations had a market share of 33%. Today, they account
for 71% of global mining activities (AT Kearny, 2007). Globalization of the steel market
has become a dominant driver that caused a sharp increase in variability of demand
and price levels.
The current situation in the Western European steel supply chain is in sharp contrast to
the global market. Demographic factors, insufficient adjustment to globalization and
the recent economic crisis caused a steady decline in building and construction
activities. Outsourcing and off shoring to low cost countries had a negative impact on
local industrial production. In the next years, a further decline in growth rates is to be
expected. The steel supply chain is currently in a transition phase, as it needs to reduce
capacity and adapt to changes in customer demands; flexibility, higher levels of
technology and sustainability. Today, steel distributors face an unfavourable
combination of fierce competition and high risks caused by demand and price
volatility.
Destocking, overstocking, dumping and speculative purchases occur in local markets
and increase globally initiated fluctuations in demand and price. Steel processors try to
fix prices at the lowest possible levels, or engage in renegotiations. This leads to
increased pressure on the operational margins of distributors. Variability in demand
results in a number of other unfavourable consequences. Processing and distribution
capacity occupancy as well as capital requirements and financial ratios fluctuate
sharply. Depreciation is a common phenomenon; six months after the recent economic
crisis set in, leading European steel distributor Klöckner & Co. announced its inventory
5
value had decreased by €600 million (Source: Steel Business Briefing). Demand
forecasting becomes less accurate. Safety levels increase or, stock service levels
decrease, causing extra expenditures for additional on-the-spot purchases.
Competition between steel distributors intensifies as customers cannot rely on the
services of a single supplier. A final undesirable consequence is an increased
vulnerability of the Dutch steel processing sector as it is exposed to similar market
conditions.
This study will investigate the causes of recent demand variability in the Dutch supply
chains of steel sheets and steel sections (beams). Steel sheets are utilized as input
material for many different applications in industrial production processes. Steel sheet
processing companies (SSPCs) are process orientated and hold inventories. Steel
sections are used as input material for construction related applications. Steel
construction companies (SCCs) are project orientated. The majority of SCCs order just-
in-time and generally hold no inventories. The different orientation of both sectors can
help to create an understanding of the dynamics of variability.
As a direct result steel demand and steel prices have, after many decades of stability,
shown drastic fluctuations. Multiple causes for this sudden change can be identified.
The economic growth in China, India, Brazil and other countries has been a main driver.
Consolidations of mining companies and (to a lesser extent) steel mills, temporary
shortages in raw material supplies, fluctuations in transportation costs and the
introduction of steel future contracts have also contributed to these fluctuations.
These effects were experienced in steel markets worldwide; both in growth and
mature markets, such as the EU15 countries.
Many European industrial sectors have been under pressure in recent years. In these
sectors price competition is especially fierce under conditions that provide only limited
options to add value to output. Examples of industries that experienced these
conditions are the mining, textile fabrications and shipbuilding industries. Due to the
severe structural productivity problems in the EU15 countries and the insufficient
adjustment to globalization a permanent and significant decline in potential growth
rates is to be expected (Carone et al. 2006). Similar conditions apply to the Dutch steel
construction and steel sheet processing industries. The Dutch construction sector will
6
be hampered by a decline in future demand. No structural recovery is to be expected
in the coming years (TNO/Dutch Ministry of Housing and Planning, 2009). The steel
sheet processing sector has a slightly better outlook but is also under pressure due to
generally lower demand and competition, mainly from low-cost countries (ING Bank;
Dutch Manufacturing 2010).
In the steel sector, demand and price variability are not only affected by global and/or
cost developments, but also by local market mechanisms. Destocking and overstocking
are commonly observed phenomena and distributors target other market segments as
their markets become saturated. Variability of demand can have unfavourable
consequences:
• Decreasing service levels, leading to extra expenditures for additional on-the-
spot purchases, increasing of (safety) stock levels
• Fluctuating occupancy of processing and distribution capacity
• Added pressure on operational margins and increased risks
• Fluctuating financial ratios and capital requirements
• Decreasing accuracy in demand forecasting
The existence of the problem is confirmed by the analysis of company data from a
leading Dutch steel distributor over the years 2002-2010 as well as cross-sectional
information based on expert opinions from executives in the steel distribution market.
The literature review revealed considerable research has been undertaken in the area
of demand fluctuations. The common ways in which the problem has been examined
include the application of general economic principles to commodity good markets,
adopting an approach based on the (mainly theoretical) price elasticity of demand and
the (often mathematical) approach of the bullwhip effect in supply chain. The review
did not reveal a holistic vision of the existence of demand variability in the steel
industry and its relationship to these factors.
1.1 Causes of demand variability in the supply chain
The existing literature reveals three different areas from which causes arise. First,
evidence shows that global economic and business developments and incidents have a
major influence on demand variability upstream in the supply chain and on
consequential price levels throughout the supply chain. In respect of industrial
7
ECONOMIC & BUSINESS CYCLES GLOBAL
EVENTS & INCIDENTS
GLOBAL ECONOMIC
DEVELOPMENT
IRON ORE, FREIGHT, LABOUR, COAL, SCRAP, ENERGY AND SUBSTITUTION MARKETS
STEEL MILLS
STEEL
DISTRIBUTORS
BULLWHIP EFFECT
• Lead times
• Ration gaming
• Price expectations
• Demand forecasting
• Batch ordering
PRICE ELASTICITY OF DEMAND
• Substitutes
• Product durability
• % of budget
• Other uses
• Peak times
• Market structure
END USERS LOCAL
COMPETITION
LOCAL
DEVELOPMENTS
PRODUCTION SMOOTHING
commodity products, demand is determined by local competition and end-user
demand for a range of final products. In our case these include products such as
warehouses, transport equipment, housing, bridges and machinery. End-user demand
is thus mainly determined by local conditions in industrial sectors.
Second, economic factors outside the immediate supply chain cause demand and price
to vary. Price elasticity of demand, volatility of commodity prices and business cycles
are identified as important indicators of this influence. Third, evidence is found that
variability is caused within the supply chain itself. The prevailing researched and
documented theory on this subject is that of the bullwhip effect. It provides both an
understanding of the factors that increase variability as well as the solutions which
reduce the effects. The identified causes of the bullwhip effect are; demand
forecasting, lead times, rationing and shortage gaming, batch ordering and price
expectations. Production smoothing was identified as highly debated but utilized
method to moderate the impact of demand variability by achieving a constant use of
production capacity. Figure 1 is a modelled view of the factors that were identified in
the literature review and their relationships.
Figure 1: Diagram of the theoretical framework (source: author)
8
2. THE GLOBAL STEEL INDUSTRY
Steel is one of the most important input materials for many industry sectors. Steel
fabrication is a capital intensive mass production process using iron ore and coal or
scrap and electricity as input. The importance of labour as a production factor is
declining. Steel sections (the commonly used term for steel H-, U- and I-beams) and
sheets are both producers’ goods, meaning their demand is derived from the
consumers’ demand for the finished products in which they are used as raw material
(McGuigan et al. 2005). Steel sections are mostly used for the construction of industrial
buildings such as warehouses, plants and factories. Other applications are machine
frames, warehouse equipment and staircases. Steel sheets have a much wider scope of
use. Target markets for steel distributors include shipbuilders, original equipment
manufacturers, transport and agricultural equipment manufacturers, white and brown
good producers, parts suppliers and the machinery industry. Thus steel demand for
sheets and sections depends on developments in the building sector and a wide range
of other industrial sectors.
From the Second World War until the early years of the 21st century, the steel market
was fairly stable and enjoyed a steady but slow growth. Trade barriers were common
as many countries protected their steel industry because of its strategic importance
and role of big employer. However, periods with significant changes occurred. Between
1960 and 1974 the world steel consumption doubled and subsequently decelerated
until 1982 (www.economywatch.com).
2.1 Recent developments in the global steel industry
In recent years, two important developments took place in the steel industry.
Traditionally country members of the Organization for Economic Cooperation and
Development (OECD) were the biggest steel producers. In the last decade, the
emerging economies of South Korea, India and China turned these countries into
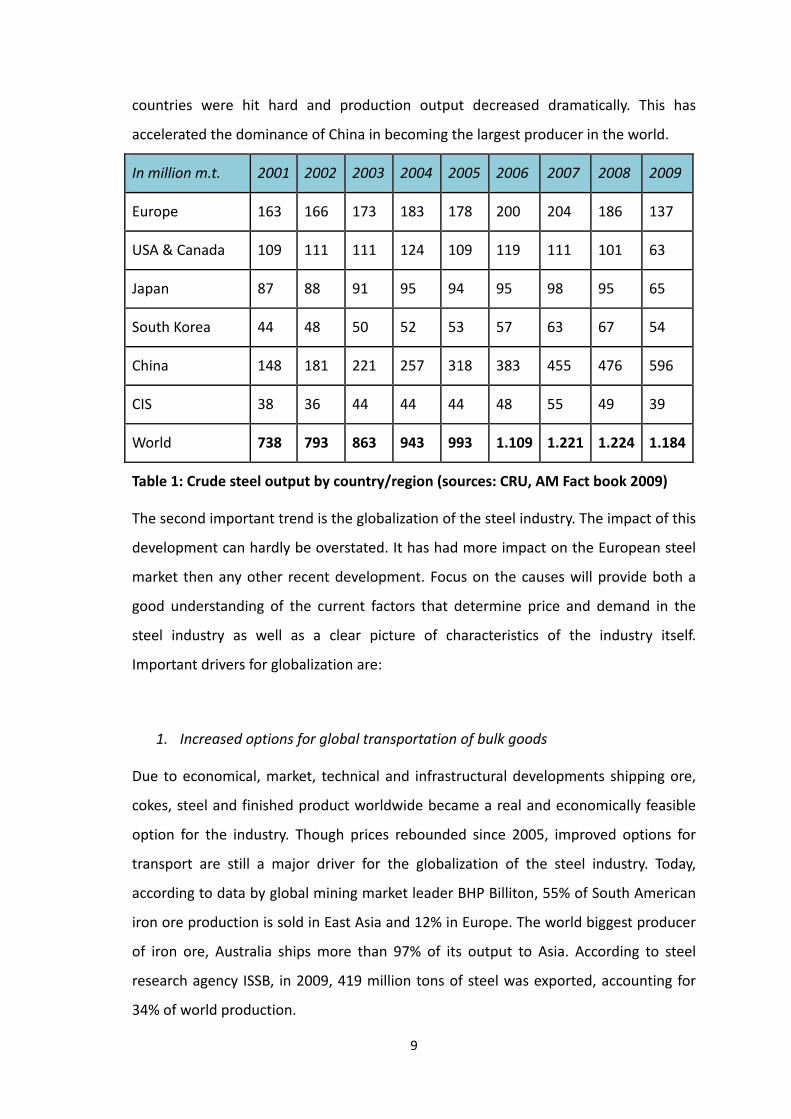
important producers and consumers of steel. As shown in table 1, Chinese steel
production has sharply increased; from 13% in 1995 to around 50% today.
Nevertheless, due to its massive national consumption, China remains overall a net
steel importer. During the recent economic crisis, the steel industries in the developed
9
countries were hit hard and production output decreased dramatically. This has
accelerated the dominance of China in becoming the largest producer in the world.
In million m.t. 2001 2002 2003 2004 2005 2006 2007 2008 2009
Europe 163 166 173 183 178 200 204 186 137
USA & Canada 109 111 111 124 109 119 111 101 63
Japan 87 88 91 95 94 95 98 95 65
South Korea 44 48 50 52 53 57 63 67 54
China 148 181 221 257 318 383 455 476 596
CIS 38 36 44 44 44 48 55 49 39
World 738 793 863 943 993 1.109 1.221 1.224 1.184
Table 1: Crude steel output by country/region (sources: CRU, AM Fact book 2009)
The second important trend is the globalization of the steel industry. The impact of this
development can hardly be overstated. It has had more impact on the European steel
market then any other recent development. Focus on the causes will provide both a
good understanding of the current factors that determine price and demand in the
steel industry as well as a clear picture of characteristics of the industry itself.
Important drivers for globalization are:
1. Increased options for global transportation of bulk goods
Due to economical, market, technical and infrastructural developments shipping ore,
cokes, steel and finished product worldwide became a real and economically feasible
option for the industry. Though prices rebounded since 2005, improved options for
transport are still a major driver for the globalization of the steel industry. Today,
according to data by global mining market leader BHP Billiton, 55% of South American
iron ore production is sold in East Asia and 12% in Europe. The world biggest producer
of iron ore, Australia ships more than 97% of its output to Asia. According to steel
research agency ISSB, in 2009, 419 million tons of steel was exported, accounting for
34% of world production.
10
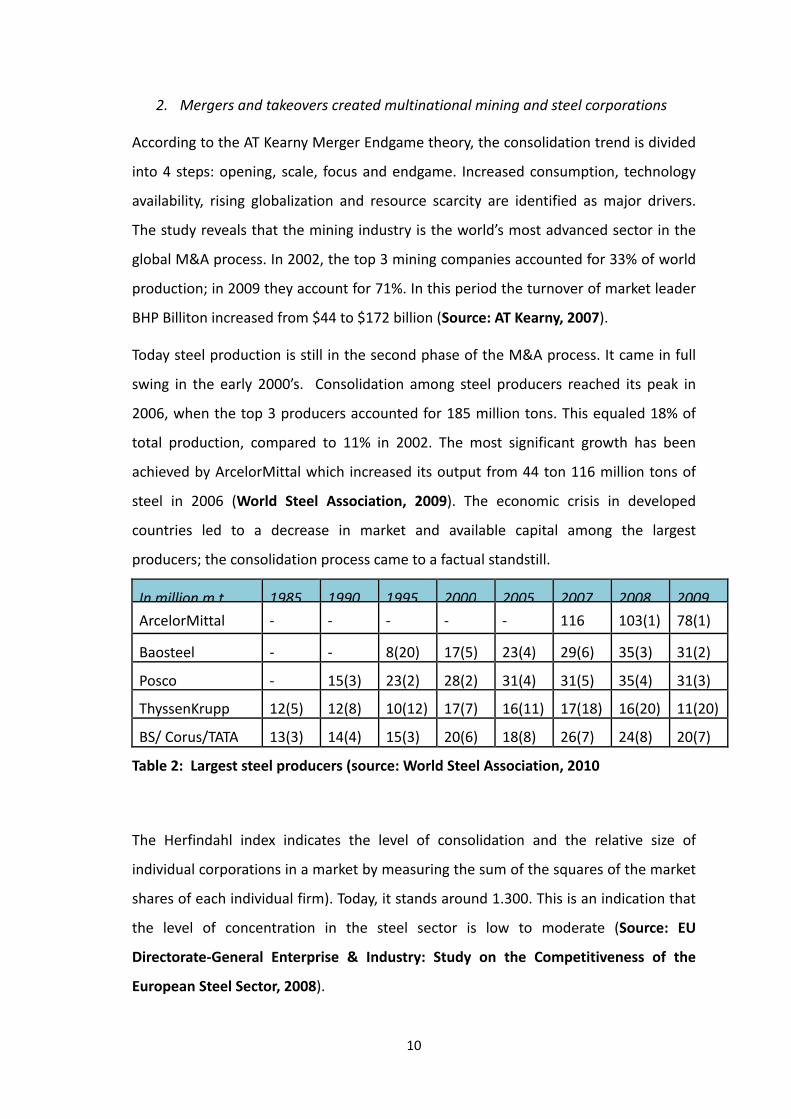
2. Mergers and takeovers created multinational mining and steel corporations
According to the AT Kearny Merger Endgame theory, the consolidation trend is divided
into 4 steps: opening, scale, focus and endgame. Increased consumption, technology
availability, rising globalization and resource scarcity are identified as major drivers.
The study reveals that the mining industry is the world’s most advanced sector in the
global M&A process. In 2002, the top 3 mining companies accounted for 33% of world
production; in 2009 they account for 71%. In this period the turnover of market leader
BHP Billiton increased from $44 to $172 billion (Source: AT Kearny, 2007).
Today steel production is still in the second phase of the M&A process. It came in full
swing in the early 2000’s. Consolidation among steel producers reached its peak in
2006, when the top 3 producers accounted for 185 million tons. This equaled 18% of
total production, compared to 11% in 2002. The most significant growth has been
achieved by ArcelorMittal which increased its output from 44 ton 116 million tons of
steel in 2006 (World Steel Association, 2009). The economic crisis in developed
countries led to a decrease in market and available capital among the largest
producers; the consolidation process came to a factual standstill.
In million m.t. 1985 1990 1995 2000 2005 2007 2008 2009
ArcelorMittal - - - - - 116 103(1) 78(1)
Baosteel - - 8(20) 17(5) 23(4) 29(6) 35(3) 31(2)
Posco - 15(3) 23(2) 28(2) 31(4) 31(5) 35(4) 31(3)
ThyssenKrupp 12(5) 12(8) 10(12) 17(7) 16(11) 17(18) 16(20) 11(20)
BS/ Corus/TATA 13(3) 14(4) 15(3) 20(6) 18(8) 26(7) 24(8) 20(7)
Table 2: Largest steel producers (source: World Steel Association, 2010
The Herfindahl index indicates the level of consolidation and the relative size of
individual corporations in a market by measuring the sum of the squares of the market
shares of each individual firm). Today, it stands around 1.300. This is an indication that
the level of concentration in the steel sector is low to moderate (Source: EU
Directorate-General Enterprise & Industry: Study on the Competitiveness of the
European Steel Sector, 2008).
11
3. Large infrastructural and oil & gas projects in developing countries
These projects require the input of worldwide production capacity. They are
indentified as major drivers by the online economist community Economy Watch
(www.economywatch.com). Among major projects on the Schiller Institute list are the
Sakhalin-Vladivostok Pipeline in Russia, the Trans Aqua project in the Maghreb, the
Beijing-Tibet railway and the Eurasian land bridge
(www.schillerinstitute.org/economy/ maps/ maps.html).
4. The adoption of liberalization policies and its impact on the reduction of trade
barriers (www.economywatch.com)
According to Economy Watch, trade barriers have been significantly reduced in recent
years. However, other sources claim they still have a major impact on the global steel
industry. The 2009 OECD report “Export Barriers and Global Trade in Raw Materials:
The Steel Industry Experience” concludes: “Currently, trade in these raw materials is
not free, with major producers imposing a variety of restrictions on exports. These
restrictions drive up global prices, increase price volatility, and give domestic producers
in the countries with export restrictions an artificial advantage in international
competition. In this way, export restrictions distort not only the world markets for
these raw materials, but the broader world markets for steel and for product made
from steel.”
5. Consolidation in customer markets increased demand for globally operating
suppliers
Today, many important markets are dominated by multinationals. Mitsubishi is such an
example; a major steel consuming company with a global presence in construction,
machinery, automobile, metal products, mining and transport equipment markets.
Other drivers of globalization are recent investments in state-of-the-art production
capacity in emerging countries which have raised are the general quality level of steel,
12
the increased availability of market information, improved communication techniques
and outsourcing of production to low cost countries.
2.2 The consequences of globalization
Globalization has had a major impact on the steel supply chain. It has created a market
in which local conditions no longer form the basic components that determine price
levels, lead times and availability. Prices are now determined by growth regions like
China and India: “…the world metal price rose by 180 per cent and of energy by 170
per cent, according to Goodman Sachs, in good part because of China’s
demand.”(Financial Times, January 23, 2008), and global events: “The recent floods in
Queensland Australia are already inflating prices of coking coal and restricting
availability. The disruptions in supply drove coking coal spot prices up by USD 40-50 a
ton.”(The Economic Times, February 2nd
, 2011). The same influence applies to raw
materials markets.
The ABNAMRO Sector Research Report 2010 states: “Because steel is traded globally
and China accounts for approximately 45% of global steel production, the development
of steel prices in China have a high influence on the global HRC price.” The same
influence applies to the raw materials markets. The graphs below show the correlation
between prices of scrap, iron ore and finished steel. Price rises in raw materials are
absorbed in the price of steel some 2 months later.
Figure 2: The correlation between raw materials scrap/iron ore (left) and steel prices
(right)
(Sources: Steel Business Briefing/Gerdau and US Department of Labour, Bureau of
Labour Statistics)
This view in confirmed by the following table showing the German price level of both
steel sheets and sections. Although the fluctuations in price bear relevance to the
overall economic growth, price developments are much more correlated to the world
markets of steel related commodities.
€/t. 2000 2001 2002 2003 2004 2005 2006 2007 2008 2009
HR Coil 317 258 276 309 443 450 464 488 630 420
Change y/y -7% -9% 7% 12% 43% 2% 3% 5% 29% -33%
Sections 315 310 318 350 495 509 552 658 818 525
Change y/y -5% -2% 3% 10% 41% 3% 8% 19% 24% -36%
Table 2: German coil and section prices 2000-2009 (Sources: CRU, TEX report, Metal
Bulletin and ArcelorMittal estimates, AM Factbook 2009)
14
2.3 The Dutch steel construction and sheet processing markets
Steel construction companies (SCCs) specialize in processing (welding, cutting, sawing,
drilling and surface treatment) and assembling steel sections. Despite having optimized
these processes in recent years, the sector still has a traditional character and little
innovation occurs. The steel construction sector is considered by CBS (the Dutch
Central Statistics Bureau) a very important part of the national economy. According to
a recent ING Bank study (2007), the value of steel products supplied to the Dutch
building sector was just under €3 billion per year, achieved by 1,500 companies with
37,000 employees. This accounts for around 20% of the total output of the total Dutch
steel industry.
SCCs are highly project orientated. Typically, the length of building projects varies
between 6 and 24 months. Steel constructors are generally hired as subcontractors,
pre-financing and building the steel construction. Prices are usually set in advance. The
prevalent risk of price fluctuations and their influence on margins is a threat for the
profitability of SCCs. The project orientation leads to fluctuations in the workload.
Adding to this concern is the need for steel constructors to ensure a steady and
sufficient inflow of work in order to keep their production capacity filled. Efficient
production and economics of scale and high investments in production capacity put
pressure on filling capacity, further increasing the risks. The third cause for concern is
the relative size of SCCs compared to their suppliers and customers. Consolidation is
not a trend for SCCs in contrast to the contracting and distribution sectors.
ABN AMRO states on the current economic climate for the construction sector: “The
production of residential and commercial properties will show no significant recovery
in 2011. A fragile recovery of the economy and uncertainty in the market still has a
pressing effect on demand for new construction. In addition, the number of
maintenance projects will decline in 2011. Local governments lack financial strength as
a result of declining revenue from housing land development. Therefore, the economic
conditions for construction in 2011 are expected to remain weak (ABN AMRO Sector
Economic Perspectives, Q3, 2010).
Steel sheet processing companies (SSPCs) supply to a much wider scope of industries.
Sheets require a much more diversified number of processing techniques such as laser
15
welding and cutting and 3-dimensonal designing. This is reflected in many recent
technical innovations in input material. New qualities for special application have been
developed by steel mills. SSPCs optimize processes by implementing technical and
organizational innovations. Mainly due to a steady decrease in volume and order size
and the influence of low-cost production countries, SSPCs are much more focused on
increasing flexibility, on becoming a supplier of systems and finished products and on
vertical integration in the supply chain (ING, Dutch Manufacturing Report, 2010).
According to ABN AMRO, the sector has a reasonably good economic perspective;
“Thereby, the economic outlook for the Netherlands and its main export countries are
relatively favourable. Recovery is still fragile, but based on the expected economic
growth, many modes should benefit (ABN AMRO Sector Economic Perspectives, Q3,
2010).”
The Dutch steel distributors earn their place in the steel supply chain because only
they are capable of transforming the irregular and volume orientated output of steel
mills into a customized offer to smaller and medium sized steel processors. Distributors
have a wide product range, processing facilities and logistics and transportation
services. Steel is typically delivered on a just-in-time basis. Supplying steel is highly
capital intensive for stockholders because of the requirement to have adequate stocks
in many sizes, lengths and qualities, in combination with the relatively high and
fluctuating cost of steel. Keeping inventories low, maximizing stock turnover rate,
minimizing working capital and creating efficient operations are essential to keep
business profitable. Dutch stockholders are independent or integrated. Independent
stockholders enjoy the freedom to obtain sections from any supplier, but they could
lack the support of steel mills. Integrated stockholders are part of steel producing
multinationals and enjoy the advantages of better availability, first-hand information
and project support.
3. VARIABILITY OF DEMAND AND PRICE OF COMMODITY GOODS
Price variability of commodity goods has a negative impact on economic growth (Van
Duyne, 1979; Labys and Maizels, 1990; Dehn, 2000). Also variability in price and
16
demand - especially of commodity goods - is often indicated as an economic factor of
major importance which can lead to changes in employment, output - including
economic cycles - and changing conditions in money supply, interest and exchange
rates. Maizels (1987) underlines the importance of the commodity markets as a
potential source of economic instability; ‘the commodity sector has come increasingly
to operate not only as a mechanism for the transmission of recession from the
developed or industrial countries to peripheral economies, but it has also become a
major source of instability in the world economy as a whole.’ Many commodity prices
have a forward-looking element and are determined in auction markets. These markets
respond quickly to changes in supply and demand - in contrast to prices in consumer
markets for manufactured goods. This adds to their influence on economic
development (Bosworth and Lawrence, 1982, Beckerman and Jenkinson 1986). Dehn
(2000) identifies price shocks and price uncertainty as having a significant influence on
economic growth rates. According to Dehn, the magnitude of the effect of negative
shocks on growth is substantial. Negative shocks seem to have no correlation to
investment levels. This is an indication that timely adjustments can be achieved by
restraining existing utilization of production capacity. Positive shocks often lead to
inflation; prices are not adapted after up cycles. Minerals are identified by Labys and
Maizels (1990) to have a larger influence than agricultural products due to the ability
to be stored for longer periods.
In his classic work “Das Kapital”, Karl Marx (1894) emphasized the consequences of
price fluctuations on the rate of profit; “But in general, it should be noted here (…),
that if variations take place, either due to savings in constant capital, or due to
fluctuations in the price of raw materials, they always affect the rate of profit…” This
influence depends on the ability of the individual firm to adapt sales prices to changing
levels of costs; “… that the price of the product does not rise in proportion to that of
the raw material, and that it does not fall in proportion to that of the raw material.
Consequently, the rate of profit falls lower in one instance, and rises higher in the
other than would have been the case if products were sold at their value.” Thus we can
conclude that the consequences of demand and price variability also apply for
individual companies.
17
3.1 Demand and price dynamics in the steel supply chain
The ABNAMRO Sector Research Report (Q2, 2010) acknowledges the influence of raw
materials price levels on the price of steel. It concludes the behaviour of the input
prices of steelmaking raw materials are the key factor in the development of steel
price. The influence of volatility in raw materials on steel prices increased when the
pricing mechanism of both iron ore and coking coal changed from yearly to quarterly
pricing, where the price is based on the average spot price of the three months prior.
As a result, steel prices became more volatile and steel mills were forced to negotiate
steel price with end users on a more frequent basis.
Sharma (2010) confirms that the steel industry around the world has been faced with
price volatility over different periods of time. This has been placed as an added
pressure on the production and consumption of steel.
In 2009 the London Metal Exchange (LME) launched the first steel futures contract.
The LME claims trading steel via future contracts acts as an institutional mechanism of
risk management creating a stabilizing effect on the world steel market. Sharma (2010)
however concludes the opposite. Similar commodity markets (aluminium and oil) have
shown an increased volatility after the introduction of future contracts. He claims
contracts will not lead to speculation in the form of ‘rational behaviour’ (e.g. hedging)
but to gain profits in the form of risk premiums. He argues that especially in emerging
markets, a futures trading mechanism might hamper growth. His findings are backed
by Feingold who states; “...the hedge funds and financiers are trying to suck whole new
areas into the whirlpool of commodities speculation, including, now, world steel
production”. (Executive Intelligence Review, July 7, 2006) In similar fashion, Lakshmi N.
Mittal, CEO of ArcelorMittal, commented a few months later; "I don't think we need a
futures market for steel”. (Executive Intelligence Review, July 7, 2006)
From an economics viewpoint, business cycles refer to periods of expansion and
recession in the level of economic activities (Burns and Mitchell, 1950). Many sources
confirm the steel industry is a cyclical industry, i.e. it shows a more than average
cyclical pattern. Sectors related to industry, transport and automotive are usually early-
cyclical, while the shipbuilding and construction sectors are regarded late-cyclical. The
18
recent economic crisis caused a decrease in building activities of 28% (housing sector)
and 43% (industrial sector) in the Netherlands in 2009 (ING Bank, 2010).
3.2 Price elasticity of demand
The relationship between changes in price and demand is studied in the concept of
elasticity. The price elasticity of demand refers to the response of demand to changes
in price. The price elasticity of supply measures how much the supplied quantity
responds to changes in price. According to Thompson (1926), price fluctuations are
less apparent under elastic demand. Elastic demand causes a strong reaction to price
fluctuations. Resulting increases or decreases in demand stabilize the price level, thus
limiting fluctuations. McGuigan et al. (2005) define the relationship between a
product’s price elasticity of demand and the marginal revenue at that point as one of
the most important in managerial economics. The level of elasticity in the steel
industry is determined by the market structure and a number of product/market
characteristics (Mankiw and Taylor, 2006).
1. Market structure
Market structure is defined by taking four factors into account; the number and
relative size of firms in the industry, the similarity of the products sold, the degree by
which decision making is interdependent between firms and the conditions of entry
and exit (McGuigan et al., 2005). When focussing on these factors, we noticed in
section 2.2.4 that the number of suppliers (steel stockholders) in the Dutch steel
market is relatively low. Steel sections and sheets are highly standardized in
application, shape, size and quality. Product differentiation is very low. Suppliers try to
differentiate in other aspects of their service: availability, logistics, customer relations,
processing and stock programme. Nevertheless the degree of supplier differentiation is
also relatively low. A notable degree of interdependence exists in the steel market as
well as a strong focus on sales and stock volumes. Every action of a major supplier has
a direct impact on the sales of its rival and provokes reactions. The volume of the steel
market is slowly decreasing, fuelling fierce competition. The focus on market share (to
maintain sufficient economics of scale) is strong and capital requirements to build up
19
inventories are high. These factors lead to relatively high entry barriers. Exit causes a
limited financial risk but in practice it seems a no-go option for steel stockholders as
they show a strong determination to survive even in the most difficult of times.
We can conclude that the steel section stockholder market is a pure and tight form of
oligopoly. This is confirmed by Tian et al. (2005) who identify the overall market
structure of the steel industry as being “close to the oligopolistic market.” Doz and
Hamel (1998) state that oligarch firms have to face two sources of insecurity when
making their decisions on pricing; unknown events in the future and the reaction of
other competitors towards their actions and these events.
In an oligopoly, the demand curve is typically elastic above the market price (prices
above the prevailing market level hardly generate demand). The point at which the
demand curve suddenly changes into elastic is the prevailing market price. The shape
of the demand curve is an important characteristic of any oligopoly: limited
possibilities to pursue an individual market strategy. The transparency of the market
competitors quickly adapt to strategies and prices of competitors; any action provokes
a reaction. Achieving higher outputs at lower prices, adding value by increasing
performance and making outstanding offerings is difficult to maintain on the long run.
However McGuigan et al. (2005) emphasize it is difficult to define an individual firm’s
demand curve because of the existing interdependence between firms.
2. Product/market characteristics
Product/market factors influence the level of elasticity of the demand curve. Lamb et
al. (2010)
identify a number of factors affecting the elasticity of demand. Sufficient availability of
substitutes means customers can easily switch to other products. This makes demand
more elastic. Steel sections and sheets are typically products for narrowly defined
applications by specialized processors. Thus, the availability of substitutes is relatively
low. Second, they conclude that demand will be more elastic when a good has a
relatively high price in relation to a budget. The share of steel costs as part of the final
product’s sales price is expected to be relatively high but variable in the steel
20
processing industry. It will be analysed as part of the research undertaken in chapter 4.
Another important aspect influencing the level of elasticity is product durability; the
more durable a product; the more elastic is its demand because consumers can choose
to repair or keep a product instead of replacing it. But steel processors do not have this
choice; in a just-in-time production environment waiting is usually not an option as
production needs to proceed. Although steel is highly durable, this aspect therefore
strongly suggests a higher level of inelasticity. Also demand tends to be more price-
inelastic at peak times – a feature that suppliers can take advantage of when setting
higher prices. Finally a product’s other possible uses is relevant; as the number of uses
increases, demand becomes more elastic.
No. Factor: Indication: Creates:
1. Market
structure
Oligopoly Elasticity
2. Substitutes Low Inelasticity
3. Budget ratio SCC: high/SSPC:
variable
Elasticity/? (subject of this research)
4. Durability Low Inelasticity
5. Peak times Variable ? (subject of this research)
6. Alternative
uses
SCC: low/SSPC:
variable
Inelasticity/? (subject of this research)
Table 3: Factors influencing price elasticity of demand in the steel supply chain
(source: author)
3.2.1 Price elasticity of supply
The elasticity of supply depends on the ability of producers to quickly adapt their
production levels to changes in demand. If supply is elastic, producers can increase
output without a significant rise in cost or a time delay. If supply is inelastic, firms find
it hard to change production in a given time period. Therefore it measures how scarce
good are rationed between competing uses and how producers react to the incentive
of a higher market price.
21
Suthikarnnarunai et al. (2009) conclude the steel industry has a limited capacity for
quick adaptations to changes in demand. Nevertheless production cuts have been an
important instrument for Western European steel producers to create relative
shortages to improve price levels. In general, sheet mills producing on the basis of iron
ore and coke can only shut down blast furnaces over a prolonged period of time. This
procedure takes time to execute and typically leads to cutting down production by at
least 30%. As we already concluded in section 2.2.4, production on the basis of scrap
(section) allows quicker and more fine-tuned adaptation to market circumstances.
Cutting production is a normal phenomenon, but refusing to do so is equally common:
“China’s steel mills appear to be churning out steel more in a fight for market share
than to meet buyer’s demands. The big state steel mills in particular are the most
reluctant to cut production fearing they will lose market share to competitors, so
instead they are cutting prices just as the third quarter contract iron ore prices rises hit
the balance sheet, pushing up raw material costs.” (Thomson Reuters)
3.3 Variability of demand within the supply chain
The final part of the literature review focuses on demand variability occurring within
the supply chain, mainly by examining the theory of ‘the bullwhip effect’.
In the 1980, companies focused on improving manufacturing efficiency by strategies
such as just-in-time manufacturing, kanban and lean manufacturing. The possibilities
for further improvements in this area declined in recent years. Consequently attention
shifted towards more effective supply chain management as the next step to lower
costs, increase profits and market share (Simchi-Levi et al., 2008). Cucchiella and
Gastaldi (2006) notice a shifting of attention from internal to supply chain in striving
for efficiency of manufacturing. Heng et al. (2005) conclude supply chain management
influences the (economic) business cycle.
Challenges in the current field of supply chain management can be related to three
observations; (1) supply chain strategies cannot be determined in isolation, (2)
designing a supply chain with minimal system-wide costs and maximum service levels
and (3) uncertainty and risk are a natural part of every supply chain. These risks have
been increased by recent industry trends; outsourcing, lean production and off
22
shoring. Other factors that increase risks are matching uncertain supply and demand,
inadequate forecasting and fluctuating inventory/back-order levels across the supply
chain (Simchi-Levi et al., 2008).
Paik & Bagchi (2005) identify 4 interrelated but distinct flows in the supply chain;
material, information, ownership and payment. All of these flows must be streamlined
from manufacturer to end-user through the integration of key processes, which include
planning, controlling and managing conflicting objectives, like commercial flexibility vs.
efficient production (Simchi-Levi et al., 2008). Globalization further enhances the
complexity and dynamics of the supply chain. In line with our findings on the global
steel industry, we find evidence that global events such as the recent flooding in
Queensland and the earthquake in Japan almost immediately affect many supply
chains.
3.4 The bullwhip effect
Variability and distortion of demand is a well researched topic in the field of supply
chain management. J.D. Forrester is regarded a pioneer. The author of ‘Industrial
Dynamics, A Major Breakthrough for Decision Makers’ (1958), studied the
amplification of demand which occurs travelling upstream in the supply chain by using
computer simulation models. According to Forrester, this problem is caused by the
existence of lead (delivery) times and the inaccuracy of forecasts. Later studies at
Procter and Gamble focused on small changes in customer demand that create
unusually big changes in order levels at the producer. Lee et al (1997B) focused their
research on the causes and identified four factors causing what became to be known
as the ‘bullwhip effect’. They state; “Distorted information from one end of a supply
chain to the other can lead to tremendous inefficiencies: excessive inventory
investment, poor customer service, lost revenues, misguided capacity plans, inactive
transportation, and missed production schedules. How do exaggerated order swings
occur? What can companies do to mitigate them?”
The theoretical model of the bullwhip effect consists of a qualitative and a quantitative
approach. The qualitative approach tries to identify the different factors that
contribute to an increase in variability in the supply chain as well as possible measures
23
to mitigate these consequences. The quantitative approach tries to improve insight by
mathematically testing the relationships between different causes and the individual
significance of each variable.
3.4.1 The reverse bullwhip effect
Rong et al. (2010) conclude in their study that in certain cases it is the wholesaler and
not the manufacturer who see the largest variance of demand. This implies that part of
the supply chain can smooth out bullwhip patterns, in other words; demand volatility
is greater than supply volatility. This process is identified as the reverse bullwhip effect.
This phenomenon is confirmed by Cachon et al. (2007) who identified the presence of
the bullwhip effect to be the largest in the middle of the supply chain in 50% of the
industries they researched.
3.5 Production smoothing
Cachon et al (2007) conclude many economists prefer to focus on production
smoothing than on the
bullwhip effect when framing discussions on supply chain volatility. An upstream
manufacturer usually pursues smooth production. The preferable condition is a
minimal variability in replenishment orders from downstream customers. Balakrishnan
et al. (2004) emphasize dampening upstream demand variability as an opportunity to
reduce supply chain costs. Cost advantages could be achieved due to factors such as
the nature of the cost function or to purchase price advantages. If they outweigh
increasing marginal costs and demand is relatively predictable, for example because of
seasonality, such a strategy can be effective. In this respect, Boute et al. (2007) state;
“..if production costs are convex, then it is optimal for a firm to only partially adjust
output in response to a change in its inventory position.“ Also they identify
manufacturers as being the main benefactors from production smoothing. Retailers
would prefer a replenishment policy based on actual customer demand. Both Cachon
and Boute find considerable evidence in academic literature questioning the
effectiveness of production smoothing strategies.
Production smoothing is not a well documented phenomenon in the steel supply
chain, indicating it might not frequently be applied. Possible causes could be the
24
capital intensity of steel production, the made to order policy of steel mills and the
irregular pattern of demand and price variability which increases the risks of
production smoothing.
3.6 The causes of the bullwhip effect
Alony and Munoz (2007) state that the identification of causes for the bullwhip effect is
difficult as most real world supply chains are not easy to study. Forrester (1958, 1961)
attributed the cause to both irrational behaviour of participants in the supply chain
and the absence of a holistic vision (e.g. an integrated view on the entire supply chain).
After rigorous testing of the famous beer game, Sterman (1989) and Rong et al. (2006)
confirm irrational behaviour as a major cause of the bullwhip effect; participants
underestimated the ordering delays and did not take the entire supply chain inventory
into account. Sterman’s research provides evidence that the participants have a
tendency to underweight the existing inventory in the supply line. Schweitzer and
Cachon (2000) also indentify irrational behaviour; individuals often exhibit some form
of decision bias in business contexts. The study of Rong et al. found evidence “..that
human behaviour creates an additional layer of variability to systems under supply
disruptions...this introduces new challenges for designing and managing flexible supply
chains.”
Lee et al. (1989) come to a different conclusion; the bullwhip effect is mainly caused by
rational behaviour within the supply chain's infrastructure. Thus, if companies want to
mitigate the bullwhip effect, they need to focus on modifying the infrastructure of the
supply chain instead of changing the behaviour of decision makers. They identify four
different causes of the bullwhip effect which all interact with the infrastructure of the
supply chain:
1. Demand forecast updating
Every company in a supply chain forecasts for production and material requirements
planning and inventory control. Forecasting is usually based on the historic order data
from direct company customers. Simchi-Levi et al. (2008) state that if traditional
inventory techniques based on period review policies and the single parameter base-
25
stock level are used in each individual stage of the supply chain, the estimates of the
mean and the variability of customer demand are regularly modified. Upstream
variability increases as a consequence. Lee et al. (1997A) emphasize the interpretation
of data on occurring demand patterns data by supply chain management leading to
adjustments in demand forecasts.
In this respect, Lee (2001) describes the story of the green Volvos. The Volvo marketing
department decided to give a price discount on green cars because of excess inventory.
This action created an artificial demand for green Volvos. The production department
decided to ramp up production, creating an even greater inventory problem.
2. Order batching (the Burbridge effect)
When demand depletes inventories, companies usually do not start placing orders at
an upstream organization immediately. Purchase orders are often batched; in fact they
represent accumulated demand. This behaviour is caused by running the material
requirements planning (MRP) not on a constant, but on a cyclical basis. Another cause
is the trade-off between incurring ordering and storage costs, also known as the
economic lot size model (Harris, 1915). Factors like economics of transportation,
minimum order size requirements and the costs of handling and payment influence
ordering costs. When ordering costs increase, customers have an incentive to
postpone purchase orders. As a consequence, demand will become more irregular. If a
company uses period
ordering, naturally its upstream demand surges, followed by a period without orders;
this amplifies
variability and contributes to the bullwhip effect. Theoretically, if all customers showed
this
behaviour randomly, no significant bullwhip effect would occur. In the words of Cachon
(1999); “The supplier’s demand variance is maximized when the retailers’ orders are
synchronized (all retailers order in the same periods). It is minimized when the
retailers’ orders are balanced (the same number of retailers order each period).” Lee et
al. (1997A) state the latter rarely occurs; usually the surge in demand is even more
26
pronounced as customers tend to order at the same time. Such peaks are known as
‘MRP-jitters’. De Souza et al. (2000) only observed a minor influence of order batching
as an individual factor.
3. Price fluctuation
According to Lee et al. (1997A), significant volumes in b2c and b2b markets are traded
because of forward buying. Forward buying is a result of price fluctuations occurring in
the market. These fluctuations can be due to special promotions (price discounts,
payment terms, price terms, coupons, quantity discounts, rebates etc.). However, in
the steel supply chain we already found evidence that price fluctuations result from
dynamics in global commodity markets and global economic developments. The result
is identical. Customers buy in quantities that do not reflect their actual and immediate
demand; they buy in larger quantities to stock up, expecting extra profits.
4. Rationing and shortage gaming (the Houlihan effect)
In situations when a product’s supply capacity cannot meet its demand, manufacturers
often ration
their supply to customers. These customers anticipate by exaggerating their real needs
when ordering. In a later stage, orders will cease and cancellations follow. Lee et al.
(1997A) argue this behaviour is not an overreaction, but based on rational economic
decisions and game theory in times of expected rationing. Shortage gaming thus occurs
when customers’ orders do not represent real demand. Customers place identical
orders at suppliers and buy at the first opportunity that occurs. This practice is
common and mostly witnessed in the early life cycle stages of a product. Simchi-Levi et
al. (2008) describe this cause as ‘inflated orders’. De Souza et al. (2000) identify this as
the dominant cause for the bullwhip effect. Rationing was apparent in the steel
industry in 2004 and to a lesser extent in 2007. It was caused both by excessive
demands throughout the supply chain and by the production cuts mentioned in
section 2.3.4.
27
A fifth cause of the bullwhip effect, lead time, is identified by Simchi-Levi et al. (2008)
and other studies (Cachon, 2007; Alony and Munoz, 2007; Paik and Bagchi, 2006).
5. Lead time
Required safety and base stock levels are calculated by multiplying the estimates of the
average and standard deviation of customer demand by the sum of the lead times and
order review periods. Therefore the extrapolation from small fluctuations is magnified
under conditions of long lead times. Long lead times also reduce the opportunities for
correcting unfavourable patterns. Towill (1991) and Paik and Bagchi (2007) both divide
this cause into lead times for information and for material. In the supply chain,
transmission of material and information is typically subject to delays.
6. Other factors
De Souza et al. (2000) identify seven possible causes of the bullwhip effect by
classifying two other factors; capacity constraints and poor coordination. Li et al.
(2005) deduce from the existing literature three more abstractly stated, interrelated
phenomena as causes of the bullwhip effect; bias demand information from the
downstream chain members, delayed information transferring and unsuitable logistical
operations responding to downstream demand. The most comprehensive set of causes
is set by Paik and Bagchi (2007) who have identified 9 caused which they divide into 5
categories: (a) Supply chain structures and processes: (1) demand update forecasting,
(2) order batching, (3) Rationing and shortage gaming, (4) price variations - (b) Material
and information lead times - (c) Supply variability: (5) Machine breakdowns - (d) Other
causes: (6) Capacity limits, (7) Number of echelons - (E) Additional causes: (8) Lead
time variability, (9) Workloads.
Machine breakdowns are identified by Forrester (1958) and Taylor (1999) as the only
real cause for supply variability. Chatfield et al. (2004) found no evidence of lead times
initiating the bullwhip effect but found a correlation between the two variables.
Akkermans and Vos (2003) found evidence of higher workloads that causing a higher
28
level of quality deficiencies. As a result, the necessary rework further increased
workloads.
3.7 The bullwhip effect in the steel supply chain
Although the bullwhip effect originates from research on consumers products, it is
widely applied in the context of industrial and commodity product markets (Cachon,
2007; Terland & Mankowitz, 2008; Glatzel et al., 2009). Suthikarnnarunai et al. (2009)
conclude that in times when prices rises are expected, steel manufacturers and
processors will increase their purchase volumes above the level of their expected
demand. Consequently, in times of expected price falls, existing inventory is used to
minimize purchasing extra material.
According to Simchi et al. (2008), achieving a sufficient level of communication and
coordination in the supply chain should be an important objective for any company.
Central coordination can reduce the effects of variability by improving forecasts and
reducing lead times. However information in the supply chain is highly decentralized.
Traditionally trust is not abundant in the steel sector. This is due to the ‘conservative’
nature of the business and to the standardization of the product (it is relatively easy to
switch between suppliers). The presence of both integrated and independent steel
distributors in the same market cause suppliers to be the same companies as
competitors. The general level of distrust in the steel sector is attributable to the
asymmetry of information (Lewicki and Buncker, 1995).
McCafferty states in Forward Online (issue September/October 2006): “The downturn
that ravaged the steel industry between 2000 and 2003 created massive bullwhips.” He
claims large steel consumers did not have sufficient incentives to push for efficiency in
the supply chain and blames the fragmentation of the industry as a cause that keeps
margins depressed. According to the Wall Street Journal (April 5, 2010) companies
along the metals supply chain cut production and lived off existing inventories in
expectation of a global economic collapse. Both restocking and destocking have the
same instantaneous and powerful effect on demand and therefore were significant
causes for the bullwhip effect. In 2004, Jim Owens, CEO of Caterpillar, the world’s
largest manufacturer of construction and mining machines, said: “The inventory burn-
29
off is over”. His statement was part of a deliberate attempt by the company to boost
production in the steel industry due to an expected rise in demand caused by
restocking. As Caterpillar had experienced problems in times of strong growth, it
deliberately contributed to the creation of the bullwhip effect. In his Industry News
article (September, 2009), Katz also identified destocking at the end of 2008;
manufacturers have cut or halted production while unloading inventory stockpiles that
built up because of decreasing demand.
3.8 The bullwhip effect and the economic and financial crisis
Fransoo et al. (2010) find evidence that directly after the fall of Lehman Brothers on
September 15, 2008, a shock wave hit the international business community
instantaneously. Their study concludes that inventory depletion along the supply chain
directly after the credit crisis was largely due to destocking; during the 2008/2009
financial crisis, the decrease in sales volume at companies up the supply chain was
significantly higher compare to downstream echelons and the sales decline of
companies further upstream in the supply chain was increasingly due to inventory
reductions along the supply chain.
3.9 Managing the consequences of the bullwhip effect
Geary et al. (2006) identify two types of principles that can reduce the bullwhip effect.
The first type are the actual causes of the bullwhip effect; inflated orders, lead times,
price fluctuations, demand forecasting and batch ordering. The second type of
principles is related to the design of the supply chain; control systems, time
compression, centralization of demand information, eliminating echelons and
synchronizing.
Simchi-Levi et al. (2008) have four suggestions for reducing the bullwhip effect.
Reducing uncertainty by centralizing demand information, by providing complete and
identical information simultaneously to each member of the supply chain.
Magnification of demand variability due to individual forecasting and analysis could
thus be eliminated. Second, reducing variability by trying to eliminate causes such as
changes in price (promotions). Third, lead-time reduction of orders and information. If
demand can be signalled earlier, the supply chain can react quicker. If delivery times
30
shorten, stocks can faster be replenished. The use of ERP/EDI systems could be a
method to reduce lead times. Finally, strategic partnerships enhance information
exchange and risk sharing.
In this research, findings are combined into 5 main solutions to reduce demand
variability;
• Smoothing the flow of products; reduction of batch sizes, frequent (JIT)
deliveries
• Information sharing; centralizing demand information
• Vendor managed inventory (VMI)
• Strategic partnerships
• Eliminate inherent variability; reducing price fluctuations and inflated orders
3.10 Quantifying the bullwhip effect
In addition to their statement on the difficulties in studying the causes of the bullwhip,
Alony and Munoz (2007) concluded quantifying the degree to which each individual
factor contributes to the bullwhip effect is even more difficult. DeSouza et al. (2000)
benchmarked individual causes by using the beer game mode. By running a series of
tests in which one variable is alternating set at zero they could analyze the influence of
each factor.
Cachon (2007) does not focus on individual causes, but measures variability of
purchase vs. sales orders; the volatility of demand imposed to that industry by its
downstream customer vs. the volatility of the inflow on that industry, a measure we
call production. The same method is applied
by Simchi-Levi et al. (2008) who calculate the bullwhip effect by comparing the
variance of placed
orders (Q) to the variance of customer demand (D).
31
4. DEMAND VARIABILITY IN THE DUTCH STEEL SECTOR
The first part of research is based on secondary data. This data is extracted from the
ERP (SAP) and demand forecasting program (SLIM4) of a steel distributor and from the
Dutch statistics agency CBS. These are monthly data collected from 2002 until the first
quarter of 2011. Data from SLIM4 has been collected since 2004, when the program
became operational. To exclude the influence of holidays, sales volumes are measured
per official working day. In order to compare company data with market indicators, the
researcher made use of the production index of industrial buildings (factories,
warehouses, stables, etc.) in the Netherlands and the production index of the Dutch
metal fabrication sector from CBS (www.cbs.nl). It is important to acknowledge these
calculations exclude certain factors (lead times, commercial targets, competition).
However, they are measured over a period of 6-8 years which dilutes these influences.
4.1 The extent to which demand variability is apparent in the Dutch steel sector
The extent of increase in demand variability when travelling upstream in the supply
chain, can be quantified by comparing upstream and downstream variability (Simchi-
Levi et al., 2008). From this, Cachon et al. (2007) conclude the difference in variability
can be calculated by comparing purchase and sales orders levels at each member of
the supply chain. On the distributor level, monthly purchase and sales volumes have
been collected. Sales volumes of distributors equal purchase levels of steel processors.
Downstream variability of steel processors (SCCs and SSPCs) is measured by means of
secondary data from the production index of industrial buildings (factories,
warehouses, stables, etc.) in the Netherlands and the production index of the Dutch
metal fabrication sector from the Dutch statistics agency CBS (www.cbs.nl).
The researcher uses the coefficient of variance (CV%) to compare the level of
variability. CV% is a normalized measure as this measure eliminates differences in
means. The researcher determined relevant statistical values for each member of the
supply chain from the data included in appendix 4A. The ‘Dutch industrial building
volume index 2004-2010’ indicates SCCs experience a CV% in demand from their
customers of 16.83. Upstream, distributors experience a CV% in demand from SCCs of
24.29. Thus we can conclude SCCs cause an increase of variance by 44.3%
32
(24.29/16.83). Further upstream, steel mills experience a CV% in demand from
distributors of 17.72, indicating distributors moderate variability by 27.0%
(17.72/24.29). An identical calculation on the steel sheet supply chain shows an
increase of demand variability between SSPCs and distributors of 84.4% (27.47/14.89).
In their turn, distributors reduce upstream variability by variability 23.3%
(21.05/27.47). Cachon et al. (2007) found a similar increase of 50% in the North
American metal wholesale industry. This research also finds a dampening effect caused
by steel distributors as they reduce variability in demand by 16.4% (sections)
respectively 23.3% (sheets). Cachon et al. (2007) and Rong et al. (2006) acknowledge
the existence of smoothing of variance, especially in the middle parts of the supply
chain. They identify existing stocks as an important cause of this effect.
The same method was applied to establish demand variability between periods. The
average demand variability experienced by distributors over 3 periods of time is shown
in tables 4.4 and 4.5. CV% of demand (sections) at the distributor level shows an
increase of 4.7% between 2002/04 and 2005/07 and of 62.7% between 2005/07 and
2008/10. Similar outcomes apply for sheet demand; demand variability increased by
7.1%, respectively 43.7%.
The researcher concludes that steel distributors have played an important role in
moderating demand variability in the supply chain in recent years. The second
conclusion is that demand variability moderately increased between 2002/06 and
sharply increased between 2006/10.
4.2 The effect of demand variability on steel distributor performance
A higher demand variability results in higher forecast errors (Simchi-Levi et al., 2008).
The researcher compared three categories of data on steel sections extracted from
January 2004 to February 2010 (demand forecast errors, deviation of demand and
stock service level). Data are included as appendix 4C. Statistical analysis reveals a
significant moderate positive correlation between the monthly deviation of average
sales volumes and monthly forecasting errors (r= .491, p< .001). Secondly, the
researcher established if a correlation exists between the level of demand forecasting
errors and the level of stock service levels, defined by the demand forecasting
33
program (SLIM4) as ‘the percentage of orders which can be satisfied from on-hand
stocks’. Statistical analysis reveals a significant weak to moderate negative correlation
between monthly forecasting errors and stock service levels (r= -.311, p= .007).
The researcher concludes that a higher variability in demand increases the level of
forecasting errors, which in turn reduces stock service levels. This conclusion is
confirmed by the graphical representation of data in figure 3 The findings confirm the
negative impact of an increase of demand variability on stock service levels. Stock
service levels were often too low (resulting in lower performance levels and increased
costs due to extra expenditures for additional on-the-spot purchases) or too high
(resulting in increased risks and capital requirements for keeping stock). Simchi et al.
(2008) describe this as the trade-off between customer service and costs.
The capital requirement for keeping stock is represented by estimating the monthly
value of the stocks between June 2004 and March 2011. This figure is calculated by
multiplying the stock volume by the replacement value. It shows large fluctuations,
resulting in a variation of capital requirements of 304% for sheets and 368% for
sections.
Figure 3: The relation between demand forecast errors and stock service levels
(source: author)
Relation between demand forecast and stock service level
jan-04 jul-04 jan-05 jul-05 jan-06 jul-06 jan-07 jul-07 jan-08 jul-08 jan-09 jul-09 jan-10
Demand forecast error (actual demand -/- prognosis) Stock service level
34
To investigate the effect on operational margins, the researcher compared data on
demand (sales volume per working day) and net margin per ton in a graph. In this
graph, the researcher indicates 9 points that visually indicate a negative correlation
between margins and sales levels. Statistical analysis only reveals a negative weak
insignificant correlation (r= .073, Sig. 451).
4.3 The level and the influence of demand variability on Dutch steel processors
The existing level of demand variability is measured by survey question 3 (CONS1); The
fluctuation of purchased volumes of steel by my company can be ranked as ... This
fluctuation can not be measured by analysis of company data because steel processors
usually have more than one supplier. The influence of demand variability on customer
performance is measured by survey questions 4, 5 and 6. CONS2 (The impact of
demand variability on my company’s performance is negative) measures the positive or
negative impact of variability on steel processors. CONS3 (The impact of demand
variability on my company’s present stocks is negative) and CONS4 (The impact of
demand variability on my company’s running customer orders/projects is negative)
focus on two different aspects of this impact: on present stocks and on running
orders/projects.
Items on the level
and the influence of
demand variability
All cases SCCs SSPCs SCC- SSPC Hypothesis
testing: SCC=SSPC Mea
n
SD Mea
n
SD Mea
n
SD Mean
CONS1 5.19 1.0
4
4.57 .96 5.78 .73 -1.21 .000* Reject
CONS2 4.31 1.1
2
4.68 1.33 3.98 .77 0.70 .110* Retai
n
CONS3 3.58 1.2
5
2.81 1.12 4.30 .88 -1.49 .000* Reject
CONS4 4.72 1.0
5
4.97 1.25 4,50 .75 0.47 .580* Retai
n
* Kolgomorov- Smirnov test for ranked data, significance level .05
Table 4: Descriptive analysis of consequences of demand variability including
significance testing between categories
SCC and SSCP (source: author)
35
SSPCs generally experience a higher level of variability in volumes of steel purchased,
but are less exposed to negative consequences. The financial consequences that both
categories experience are in line with the nature of their respective ordering patterns;
process/stock vs. project/order orientated. SSPCs experience a negative impact on
their existing stocks. Because SCCs mainly purchase directly for customer orders, they
have a lower score. In return, SSPCs experience a lower negative impact on running
orders/projects. The Kolgomorov-Smirnov test for ranked data reveals that both the
level of demand variability (CONS1) and the difference of financial risk on holding stock
(CONS3) are statistically significant (p= .000).
4.4 The influence the bullwhip effect on Dutch steel processors
Independent variables (the
bullwhip effect)
All cases SCC SSPC SCC-
SSPC
Hypothesis
testing: SCC=SSPC
Mea
n
SD Mea
n
SD Mea
n
SD Mea
n
Factor Inflated Orders (IO) 5.12 .79 4.95 .91 5.28 .64 -.33 Sig.
.825*
Retain
Factor Lead Times (LT) 4.34 1.02 4.54 .90 4.15 1.1
0
.39 Sig.
.447*
Retain
Factor Price Fluctuations
(PF)
4.72 1.68 3.66 1.04 5.85 .77 -
2.19
Sig.
.000*
Reject
Factor Batch Ordering (BO) 5.22 .95 4.76 .98 5.65 .70 -.89 Sig.
.004*
Reject
Factor Demand Forecasting
(DF)
4.77 .87 4.38 .86 5.13 .72 -.75 Sig.
.002*
Reject
* Kolgomorov- Smirnov test for ranked data, significance level .05
Table 5: Descriptive analysis of the independent variables related to the bullwhip
effect and significance testing between categories SCC and SSCP (source: author)
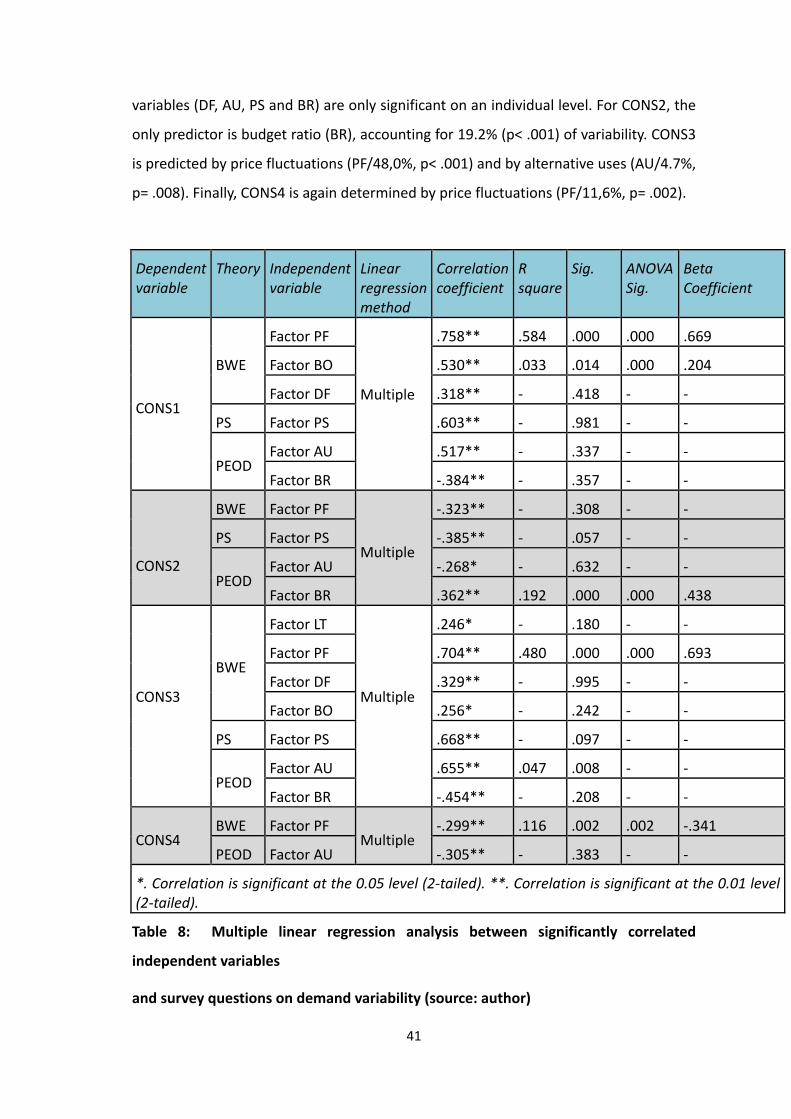
From the variables contributing to the bullwhip effect inflated orders and batch
ordering received the highest attribution by respondents. Between both categories,
SSPCs scored highest on price fluctuations and demand forecasting. Ordering steel for
stock replenishment makes SSPCs focus much more on demand forecasting and stock
control. In addition they attribute a significantly higher value to sharing demand
information in the supply chain compared to SCCs. SCCs responded high on lead times
36
and on inflated ordering as a possible method to cope with availability, but low in an
active pursuit of this strategy and on price fluctuations. However, although customers
of SCCs don’t adapt their actual demand to price expectations, their price negotiation
strategy largely depends on it. As a result, SCCs and distributors face a higher demand
variability and increased risks. When price fluctuations occur, SSPCs can more easily
adapt their purchase volumes to the market situation. This is confirmed in the results
on item CONS1, which indicates a higher degree of demand variability caused by
SSPCs. Cachon et al. (2007) identified a similar significant association between price
differences and demand variability.
Order batching is less apparent in the SCC sector. Their purchase orders mainly consist
of individually specified, cut-to-length sections for uniquely designed building projects.
Order batching typically leads to a delay in information and demand shock, as
purchase orders are bundled (Alony, I., and Munoz, A., 2007). Steel sheets are typically
delivered per mill packet of 2,500-5,000 kilograms to ensure an attractive purchase
price. SSPCs confirm material price as the most important cause for batch ordering.
The factors price fluctuations and batch ordering show a strong positive correlation to
the level of demand variability.
Overall, analysis reveals the bullwhip effect to be the strongest predictor of demand
variability as the independent variable price fluctuations (PF) is the most important
determinant for demand variability. The second determinant is batch ordering (BO).
4.5 The influence of production smoothing on Dutch steel processors
For SSPCs production smoothing is an important method to dampen the effects of
demand fluctuations from downstream customers. A prerequisite for production
smoothing is knowing future demand will come. The existence of long-term contracts
is such a condition, of which the existence is confirmed by survey question 9 (PS3).
Cachon et al. (2007) identify the importance of a low variability in order levels from
downstream customers. This aspect is confirmed by the moderate response on survey
question 15 (PT1) on the level of disruption of customer demand.
The literature review shows mixed opinions on the effectiveness of production
smoothing. Blanchard (1983) concludes ‘...inventory behaviour is destabilizing; the
37
variance of production is larger than the variance of sales’. In this survey respondents
indicate production smoothing does not lead to a lower level of demand variability; it
has a strong positive relationship to the variability in purchase volumes (rS = .603, p<
.001). This finding is in contradiction to the literature review which revealed
production smoothing as a cause for lower levels of demand variability. The researcher
concludes SSPCs enjoy a certain degree of freedom in timing their purchase orders:
SSPCs generally experience a lower level of customer involvement in their production
planning (PT3). Purchasing steel in a favourable market can lead to important cost
advantages. This is confirmed by the low score on CONS2; demand variability does not
heavily affect SSPCs performance. It is also confirmed by the role price fluctuations
have in determining purchasing policies; SSPCs are much more focused on future
market developments (factor PF). Binder (1986) confirms production smoothing is
often much more related to price fluctuations than it is related to demand fluctuations.
Finally SSPCs have greater opportunities to use material for other purposes, making
them more flexible than SCCs. SCCs mainly produce for unique building projects. They
are dependent on the planning of the entire project, in which the steel construction is
only a part. Often last minute changes occur. Therefore engaging in production
smoothing is usually not an option. This is confirmed by the low score of SCCs in this
survey.
When regarded as a single factor, production smoothing has an overall significant
correlation to the level of demand variability and is an important contributor as such.
This is confirmed by Cachon et al. (2007) who define the metalworking industry as a
‘production smoother’. However, in combination with the bullwhip effect and price
elasticity, no significant cause-and-effect relation could be determined.
Independent variables
(production smoothing)
All cases SCC SSPC SCC-
SSPC
Hypothesis
testing: SCC=SSPC
Mea
n
SD Mea
n
SD Mea
n
SD Mea
n
Factor Prod. Smoothing (PS) 4.10 1.37 2.97 .98 5.15 .66 -
2.18
Sig.
.000*
Reject
* Kolgomorov- Smirnov test for ranked data, significance level .05
38
Table 6: Descriptive analysis of independent variable related to production
smoothing and significance testing between categories SCC and SSPC (source:
author)
4.6 The influence of price elasticity of demand on Dutch steel processors
Overall, respondents attributed a moderate value to their exposure to factors that
increase price elasticity of demand. SCCs are more exposed to peak times. In the
previous section it was concluded that they often don’t engage in production
smoothing and are more dependent on short and reliable lead times (LT). Despite
moderate values, the researcher found correlations between two factors causing price
elasticity level of demand and demand variability. First, the factor alternative uses (AU)
has a moderate to strong positive correlation. This relates to our findings on minor
research question 3; when existing stocks have alternative uses, the customer becomes
less dependent on single articles and enjoys a greater freedom in timing purchase
orders. Accordingly, a high score on the factor AU reduces the impact on running
orders/projects. However it also leads to a higher impact on existing stocks, which is
explained by the existence of much higher stock levels among this category of steel
processors.
Budget ratio is identified as being a positively correlated to price elasticity of demand
(Lamb et al., 2010). This is not confirmed by this research; budget ratio (BR) has a
significant correlation to all aspects of demand variability. Companies which can add
more value to their purchased steel experience a more positive impact of demand
variability on their performance, hence they are less influenced by steel market
dynamics. They also enjoy a greater freedom in timing, which results in a larger
variability. Finally, they experience a smaller impact of demand variability on their
existing stocks. Overall the researcher concludes the demand of SCCs is more inelastic
due to a lack of available substitutes, durability (SCCs cannot delay production) and a
lack of alternative uses. Despite a higher budget ratio, SCCs have only limited options
to determine the moments at which they purchase steel from distributors.
When applying multiple linear stepwise regression, price elasticity of demand is not a
significant cause of demand variability. However, a cause-and-effect relationship exists
39
between budget ratio and the impact of demand variability on company performance,
explaining 19.2% of variation. Steel processors that can add the most value to their
purchased products are a less negatively impacted by variability in demand. The level
of alternative uses is a moderate predictor for the impact of demand variability on
existing stocks.
Independent
variables (price
elasticity of
demand)
All cases SCC SSPC SCC-
SSPC
Hypothesis testing:
SCC=SSPC
Mean SD Mea
n
SD Mea
n
SD Mea
n
Factor Peak Times
(PT)
4.31 .67 4.54 .69 4.1 .59 .44 Sig..010** Rejec
t
Factor Alt. Uses (AU) 4.14 1.62 2.89 1.32 5.3 .82 -2.41 Sig. .000** Rejec
t
Factor Budget
Relation (BR)
37,0% 15.6 48.1 12.21 26.8 10.
7
21.2
9
t= 8.173, df=
75, Sig<.001*
Rejec
t
* Independent groups T-test for numerical data, significance level .001
** Kolgomorov- Smirnov test for ranked data, significance level .05
Table 6: Descriptive analysis of independent variables related to price elasticity of
demand and significance testing between categories SCC and SSPC (source: author)
4.7 Conclusions on the causes of demand variability for Dutch steel processors
For this purpose, the researcher used the non parametric Spearman’s rank correlation
coefficient (Spearman’s rho) test. To assess cause-and-effect relationships, the
researcher applied multiple linear (stepwise) regression on significantly correlating
variables. This method shows the combined influence of significant independent
variables, therefore improving the value of the prediction. The r-values of multiple
regression are higher then each individual coefficient, indicating that a larger part of
variance is explained. As a result, the number of significant determinants decreases. All
coefficients are shown in table 7.
40
Correlations between dependent variables (CONS 1-2) versus independent variables and
general characteristics
All factors Spearman’s Rho (N=77), factor BR
(Pearson’s PMCC) CONS1 CONS2 CONS3 CONS4
The bullwhip
effect
Factor IO Correlation Coeff. ,252* ,113 ,122 -,171
Sig. (2-tailed) ,027 ,329 ,289 ,137
Factor LT Correlation Coeff. -,044 ,134 -,246* -,016
Sig. (2-tailed) ,706 ,246 ,031 ,893
Factor PF Correlation Coeff. ,758** -,323** ,704** -,299**
Sig. (2-tailed) ,000 ,004 ,000 ,008
Factor DF Correlation Coeff. ,318** -,036 ,329** -,184
Sig. (2-tailed) ,005 ,753 ,004 ,109
Factor BO Correlation Coeff. ,530** ,003 ,256* -,078
Sig. (2-tailed) ,000 ,977 ,025 ,500
Production
smoothing
Factor PS Correlation Coeff. ,603** -,385** ,668** -,153
Sig. (2-tailed) ,000 ,001 ,000 ,185
Price elasticity
of demand
Factor PT Correlation Coeff. -,069 ,066 -,136 -,146
Sig. (2-tailed) ,551 ,568 ,240 ,206
Factor AU Correlation Coeff. ,517** -,268* ,655* -,305*
Sig. (2-tailed) ,000 ,019 ,000 ,007
Factor BR Correlation Coeff. -,384** ,362** -,454** ,221
Sig. (2-tailed) ,001 ,001 ,000 ,054
*. Correlation is significant at the 0.05 level (2-tailed). **. Correlation is significant at the 0.01
level (2-tailed).
Table 7: Correlation coefficients : independent variables and demand variability
(source: author)
Regression analysis shows that in combination with other variables, price fluctuations
(PF) is the strongest predictor of demand variability for CONS1, causing 58.4% (p< .001)
of variance. If the factor PF increases by .100, it will increase demand variability by
.669. Batch ordering (BO) ranks second; both variables cause 61.7% of variability (p=
.014). An increase of BO by .100 will increase demand variability by .204. The other
41
variables (DF, AU, PS and BR) are only significant on an individual level. For CONS2, the
only predictor is budget ratio (BR), accounting for 19.2% (p< .001) of variability. CONS3
is predicted by price fluctuations (PF/48,0%, p< .001) and by alternative uses (AU/4.7%,
p= .008). Finally, CONS4 is again determined by price fluctuations (PF/11,6%, p= .002).
Dependent
variable
Theory Independent
variable
Linear
regression
method
Correlation
coefficient
R
square
Sig. ANOVA
Sig.
Beta
Coefficient
CONS1
BWE
Factor PF
Multiple
.758** .584 .000 .000 .669
Factor BO .530** .033 .014 .000 .204
Factor DF .318** - .418 - -
PS Factor PS .603** - .981 - -
PEOD Factor AU .517** - .337 - -
Factor BR -.384** - .357 - -
CONS2
BWE Factor PF
Multiple
-.323** - .308 - -
PS Factor PS -.385** - .057 - -
PEOD Factor AU -.268* - .632 - -
Factor BR .362** .192 .000 .000 .438
CONS3
BWE
Factor LT
Multiple
.246* - .180 - -
Factor PF .704** .480 .000 .000 .693
Factor DF .329** - .995 - -
Factor BO .256* - .242 - -
PS Factor PS .668** - .097 - -
PEOD Factor AU .655** .047 .008 - -
Factor BR -.454** - .208 - -
CONS4 BWE Factor PF
Multiple -.299** .116 .002 .002 -.341
PEOD Factor AU -.305** - .383 - -
*. Correlation is significant at the 0.05 level (2-tailed). **. Correlation is significant at the 0.01 level
(2-tailed).
Table 8: Multiple linear regression analysis between significantly correlated
independent variables
and survey questions on demand variability (source: author)
42
4.8 Comparing process and project orientated steel processors
Many different values and patterns occur between respondents that buy sections
(SCCs ) and sheets (SSPCs). Overall SCCs cause a lesser degree of demand variability to
distributors, although they are exposed to a higher degree of demand variability from
their customers. This results in a higher level of peak times in their production. In the
SCC market, the majority of demand comes in the form of building projects, consisting
of a unique combination of materials (AU). Often SCCs depend on definitive drawings,
as many changes occur. Small changes can result in drastic changes in input material
because of lengths and strength of profiles. This makes it difficult for SCC to
standardize production and use material from stock. Unpredictable demand also
allows a low degree of production smoothing because producing early imposes a risk.
As a consequence, SCCs often perform last-minute just-in-time purchases. Thus, their
demand is a reflection of their real-time material requirements. Length and reliability
of lead times becomes more important. Batch ordering and inflating orders are less
prevalent. Even though SCCs indicate material availability and lead times as more
important then SSPCs, they engage significantly less in inflating orders in times of
shortages. Demand forecasting is less important; SCCs generally deal with immediate
demand. The period between the fixing of project prices and the moment of steel
purchases varies. SCCs are less involved in showing actively causing the bullwhip effect
and production smoothing but are more exposed to negative consequences of these
phenomena in terms of risk, performance and dependency.
SSPCs have a wider array of measures when coping with the demand variability of
downstream customers as they hold stock. As a consequence, these inventories are a
source of risk for SSPCs. Inventories are indicated to have a smoothening effect on
demand variability by Cachon et al. (2007), Rong et al. (2005) and Boute et al. (2007).
According to Buffa and Miller (1979), ‘inventory acts as a buffer, absorbing increases or
decreases in demand while production remains relatively steady’. However, many
business articles conclude the opposite in the steel supply chain (Aeppel, 2010, Laing,
2010, McAfferty, 2006); inventories are used up in times of expected price decreases
and built up in times of expected increases. Therefore inventories can increase
demand variability as well as dampen it.
43
4.9 Conclusions
These outcomes lead to the following main conclusions in respect of the factors that
cause demand variability in the Dutch supply chains of steel sections and sheets:
1. The bullwhip effect is the most important cause for demand variability in the
Dutch supply chain of sections and sheets. Multiple (stepwise) regression
analysis indicates that of the independent variables that cause the bullwhip
effect, price fluctuations (PF) is the most significant predictor. Batch ordering
(BO) ranks second.
2. SSPCs generally initiate more actions that lead to the bullwhip effect. Lead
times (length and reliability) is the only aspect which is rated higher by SCCs.
3. Production smoothing mainly exists in the SSPC sector because of long term
contracts. Production smoothing (PS) has a strong positive correlation to
demand variability. Also, the ability to hold inventories causes an increased
demand variability of steel sheets for distributors.
4. Two independent variables linked to price elasticity of demand have a
significant correlation to demand variability. Alternative uses (AU) is strongly
positively correlated and budget ratio (BR) is strongly negatively correlated.
Overall, price elasticity of demand is not identified as a significant predictor for
the level of demand variability.
5. IDENTIFYING POSSIBLE SOLUTIONS
The results from the survey clearly indicate price fluctuations as the major cause of
demand variability with its unfavourable side effects. So, how can these effects be
mitigated, especially since the causes of the fluctuations have been identified as lying
in on a global steel level. To address this problem, 14 in-depth unstructured interviews
have been conducted with medium/large Dutch steep processors.
44
5.1 Possible solutions for the SCC sector
SCCs manufacture steel constructions by using traditional techniques such as drilling,
welding and bending. Most SCCs outsource surface treatment. Assembling, a core
activity of SCCs, is performed in-house. Three types of construction projects are
identified. Each type is different in relation to the issuers, the role of the SCC, the risks
involved, competition between SCCs and the possibilities to create added value. These
differences put specific demands on the relationship between SCCs and steel
distributors, leading to different counter measures. A positive correlation exists
between the size of the SCC and the size of the construction project the company
engages in.
Reducing uncertainty/centralizing demand information
Overall, centralizing demand information is not a key focus for the project orientated
SCCs. In particular SCCs focusing on medium/smaller regard demand as being
unpredictable and unfit to forecast or share. Each project consists of a unique
specification for sections in type (size and strength), length and sometimes quality.
These specifications often change due to cost reductions, technical improvements and
changing requirements set by end users. The majority of SCCs tender after the
development phase. Purchasing is often executed on a last-minute basis due to delays
in the approval of specifications. This leads to time pressure in the execution of
construction projects. In the words of Shenhar and Laufer (1995); today’s construction
projects are ‘complex, uncertain and quick’. This is confirmed by the survey score for
DF3 (a low overview of customer demand/score 3.68) and DF4 (a low level of sharing
demand information/score 3.92), as stated in appendix 4F.
SCCs rely on distributors to (just-in-time) supply a wide range of sections from stock
which are cut to specification. Regular qualities and lengths are readily available. Each
supply chain member tries to reduce costs by engaging in sub-optimization. Strong
competition between distributors leads to small price differences. Distributors are
faced with high stock safety levels and waste percentages to meet the requirements of
the construction sector. The incentives for smaller SCCs to engage in close relationships
with steel distributors are low. Large SCCs, targeting large projects are often involved in
45
the design phase of projects. Steel sections used in these projects are often pre-
ordered via distributors from rollings at steel mills. SCCs can create cost advantages by
the optimal use of existing stock programmes, price lists and by optimizing the
logistical processes. Steel distributors play an important role in financing by offering
SCCs credit facilities. As a result, the necessary coordination leads to an increased level
of information sharing in the supply chain.
Smoothing the flow of products
Overall, interviewees acknowledge the importance of just-in-time deliveries per
individual, cut-to-length sections by steel distributors. SCCs involved in
medium/smaller projects rely heavily on the quality, speed and reliability of steel
distributors. Availability is regarded a key issue. Lee et al. (1997A) acknowledge the
importance of decreasing lead times as a contributor to a lower variability in demand.
SCCs indicate a that a higher degree of standardization of the section types used for
constructions could reduce the risk of obsolete material due to specification changes,
especially in medium/smaller projects. It could also facilitate distributors; reducing the
number of slow movers creates reduced overlap, clearer demand information and
improved stock service levels (McAfferty, 2006, Tommelein et al. 2008). Simchi-Levi et
al. (2008) call this ‘the product variety/inventory trade-off’.
Eliminating inherent variability; reducing price fluctuations and inflated orders
All interviewees indicated price fluctuations to be a major cause for concern for the
supply chain, confirming the findings of the survey. Decreasing price fluctuations is
expected to contribute substantially to smoothen the flow of products though the
supply chain. Demand for constructions is largely independent of the (expected) price
level of steel. Despite the fact that for most contractors of industrial buildings (project
developers, government institutions, investment firms) the cost of steel components
only accounts for around 7 to 13% of the total investment (Evers et al. 2003).
Contractors often fix prices or engage in re-negotiations if market developments favour
them. SCCs try to mitigate risks by optimal timing; they purchase at the last minute
46
when prices are expected to decrease and they enter into medium term contracts
when prices are expected to rise. This behaviour increases the risks for the distribution
sector. Furthermore, in today’s volatile steel market, fixing purchase prices in
combination with material reservations increases the risk of obsolete stocks.
The only interviewee that did not attribute value to this role is a turnkey builder for
whom the average share of the cost of steel sections only accounts for 15-20% of its
sales prices. In contradiction to smaller SCCs, the two largest interviewed SCCs actively
anticipate on price fluctuations by purchasing large volumes of steel when prices are
perceived as being low. These SCCs acknowledge the fact that their purchases can
cause extra price volatility. In fact, for these firms, the bullwhip effect is an option to
improve margins. A similar strategy has recently been pursued by Caterpillar (Wall
Street Journal, January 27, 2010). When these SCCs make correct assumptions about
the price development, they experience an advantage early after their purchases, as
they can secure projects at low prices while maintaining reasonable margins. However
they also identify important disadvantages. Stock holding causes extra administration
and financing costs. When most sections are used, mostly slow movers remain, causing
increased waste percentages. Also, these SCCs incur price risks, as future price
developments are unknown. The existing stocks cause extra pressure on the margins of
other SCCs, especially in times when steel prices rise.
Vendor managed inventory (VMI)
VMI is not considered a real option by most SCCs because they hold no significant
stocks. The SCCs that do so to create medium term price advantages regard their
inventories as a part of their individual strategy. No involvement of steel distributors is
desired.
Strategic alliances
According to Tommelein et al. (2006) strategic alliances and supply chain management
in a construction project environment can help to increase the influence of SCCs on the
project definition, design, supply, assembly and use. Ballard et al. (2004) highlight the
47
increased options for work structuring resulting in improved supply chain performance
and resource allocation. As a result, the supply chains become more competitive and
customer orientated. In particular SCCs targeting project type 1 acknowledge these
factors as being important. They are increasingly focusing on improving their
relationship with steel distributors. Their main goal is to achieve a larger degree of
price stability, secure availability and share project risks. SCCs identify trust as the
prevailing condition to achieve this goal. The importance of trust is emphasized by
Clark and Hammond (1997) who suggest that trust still has to emerge in many value
stream relationships, the inhibition being the persistence with traditional “adversarial
win-lose negotiations”. According to Li et al. (2007), maximum benefits can only be
achieved when alliances have a long term character. Thus, both partners must be
willing to sacrifice short term gains in order to create a more profitable long term
alliance.
The formation of strategic alliances is hampered by several factors. First, a majority of
SCCs indicate purchase management is a delegated part of project management. Each
project manager is responsible for project revenues. The fragmentation of the
purchase function leads to sub-optimization and hampers company policy
development and execution. Second, due to cost savings the average quality of the
purchasing function of SCCs has deteriorated in recent years. Third, the extensive
range of sections (size, quality and length) and the importance of quick, just-in-time
delivery cause SCCs not to rely on a single supplier. Fourth, SCCs find competition
between steel distributors a necessary condition to achieve the lowest possible
purchase price. This contradicts Li et al. (2007), who indicate that strategic alliances
cause downstream customers to lose control over the relationship with suppliers. Fifth,
by spreading credit facility risks SCCs create some degree of flexibility. Finally, the
current oligopolistic market structure leads to intense price competition. Long term
relationships with cost advantages for both parties are therefore difficult to create.
5.2 Possible solutions for the SSPC sector
The majority of the SSPCs interviewed acknowledge the irregular pattern of their steel
purchases. In particular larger SSPCs that serve a wide array of customer segments by
using standard quality sheets try to time their moments of purchase optimally. The
48
existence of inventories is an important condition for them to be able to do so. Buffa
and Miller (1979) identify inventories act as a buffer, absorbing increases and
decreases in demand. Blanchard (1983) concludes the opposite; ‘..inventory behaviour
is destabilizing’. This is confirmed by Blinder and Mancini (1991) and by the findings of
the survey questions about the role of the inventories of SSPCs.
The strategy of SSPCs has changed in recent years. Due to a lower level of local
industrial activities and outsourcing to low cost countries, the total market volume has
decreased. SSPCs are focused on adding value by increasing their flexibility and
processing portfolio. They design and manufacture more complex products in smaller
lot sizes. The share of the cost of steel has declined. Most SSPCs produce by using
sheets from their own stock. Frequently, sheets are stored in cassette systems which
are an integral part of the processing equipment. The use of advanced techniques and
automated production is an important development in the sector. It requires a high
quality standard of input material. Recently, the number of different steel qualities
used for special applications has increased, offering distributors the option of
improving their value proposition on the basis of their product range.
Reducing uncertainty/centralizing demand information
Being stockholders, SSPCs naturally engage more in analyzing demand and stock
management than SCCs. Their survey score in respect of demand forecasting (DF) is
5.65 which is significantly higher than that of SCCs (appendix 4F). Interviewees
indicated that the availability of material, especially for longer term contracts was their
most important motivation to engage in sharing demand information with suppliers.
SSPCs using special steel qualities rely much more on supplier relations. Standard steel
qualities are commonly available and are purchased at spot markets.
Three trends are likely to cause an increase in the sharing of demand information. First,
the majority of SSPCs are experiencing a higher demand for increased price stability
from their customers. In this respect, SSPCs acknowledge the importance of a closer
cooperation with steel distributors. Second, SSPCs are trying to increase their added
value by improving flexibility and by introducing high tech processing techniques. Their
49
approach is changing from production oriented to integrated and solution based
offerings. Using special steel qualities for niche products is an important aspect of this
change. Third, the increased use of high tech production equipment facilitates
information sharing. This equipment relies on the use of sophisticated hardware and
software which is also suitable for managing stocks and sharing information. As a
result, supply chain effectiveness is likely to increase in the future.
Smoothing the flow of products
The flow of sheets through the supply chain is more irregular compared to the flow of
sections. Distributors offer significant price advantages for delivering sheets per mill
package of 2-4 tons or full truckloads. Purchasing in mill packages also facilitates the
process of identification and certification. SSPCs hold their own stocks and have a
degree of freedom to time their purchases. In times of expected price drops, SSPCs can
wait. One medium sized SSPC indicated the optimal lot size forces the company to
order slow movers on average once every two months.
Eliminating inherent variability; reducing price fluctuations and inflated orders
The majority of the interviewees favour price stability. In recent years, customers of
SSPCs accepted shorter term contracts. However, today SSPCs are experiencing an
increased pressure to fix prices on a longer term. SSPCs indicate that if distributors can
offer medium-term price fixing, it will have a positive effect on decreasing the
variability in demand
Vendor managed inventory (VMI) and strategic alliances
Most interviewees regard VMI to be an attractive option, in particular in combination
with monthly billing and contracts that aim to secure availability. SSPCs who specialize
in processing special steel qualities which are supplied by a single distributor often
already engage in partnerships. Important aspects of these partnerships are a mutual
interest in optimizing the material and processing quality, securing availability and
50
reducing price and stock risks. Another important aspect is the ability to secure supply
of material in a constant quality. Forming a partnership with a supplier sets favourable
conditions to achieve this goal. Larger SSPCs process standard quality sheets which are
generally purchased at spot markets. The lot size of their orders secures low prices.
The volume also requires large SSPCs to have more than one supplier and sometimes
to purchase directly from steel service centres. VMI is not yet widespread.
Consignment stocks, usually located at the distributor, do exist in the supply chain.
5.3 Conclusions
Overall, interviewees identified different problem areas for which distributors can offer
different solutions to suit their individual needs. Steel processors acknowledge the
improvements the distribution sector has made in recent years to supply just-in-time
and made to specifications. Recent years are characterized by a high volatility in price
and availability; distribution has been an essential part of the supply chain. The
combination of fluctuations and a declining demand for steel products have lead to a
difficult situation for steel processors. Until today, most processors are not inclined to
look for solutions outside their sector. However, especially among SSPCs, this view is
changing. The options for cooperation between echelons in the supply chain will
increase in the near future.
Arbulu and Ballard (2004) find the construction industry is still in exploration toward a
holistic vision on its supply chain. The industry is dominated by specialization within
functions and great fragmentation (Tommelein et al. 2003). Interviewees confirm SCCs
are still hampered by the design of the steel construction supply chain. Only large SCCs
are often involved in the design phase of large and long term projects. The majority of
SCCs are tendering after the development phase. This practice increases demand
variability because it leads to a high level of uncertainty. Demand is still ‘an
unpredictable sum of incidents caused by the character of the sector’, as one
interviewee stated. Thus, the construction sector relies on distributors supplying a
wide range of sections just-in-time and cut to length, eventually resulting in sub-
optimization as each supply chain member tries to reduce costs. Simchi-Levi et al.
(2007) identify the importance of delaying product differentiation as long as possible.
This allows products to stay generic and thus be used for different purposes.
51
Distributors which cut to length comply with this principle. However due to
unpredictable demand and short lead times they are still faced with higher stock safety
levels and waste percentages. Tommelein et al. (2008) emphasize the importance of
standardization for products used in the construction market as it reduces the
workload pertaining to submittals and approvals, simplifies all handling and allows for
risk pooling. According to Ballard and Howell (1994), standardization can only be
achieved when applied in the design phase of a project. Distributors can have an
important role in determining the level of standardization. However, standardization
could have a negative impact on the opportunities for distributors to add value by
offering unique product ranges and/or offering specialties.
Significant reduction of variability in demand will probably be difficult, especially as it
requires a redesign of the construction supply chain. Notwithstanding this, distributors
have the option to tighten relationships with SCCs on an individual basis. SCCs are
increasingly searching for options to increase their added value by being involved in
the design phase of projects. Price fluctuations are regarded as being undesirable.
Engaging in strategic alliances to share risks could be a real option. In today’s volatile
market, distributors must carefully asses the acceptable risk levels. In the current
supply chain this means the number of strategic alliances should be restricted. The
long term rewards of strategic alliances can create benefits: limitation of waste
percentages, decreasing handling and transport costs and improving demand
forecasting accuracy and a larger degree of price stability.
SSPCs have a larger influence on the pattern of their purchase. Not all SSPCs regard the
influence of variability in demand and price as being negative. SSPCs which rely on
special material qualities acknowledge the importance of a good relationship with
suppliers. Overall SSPC are technically much better equipped to share information in
the supply chain. Distributors have several options to smoothen demand variability as
they can focus on sales contracts that fix prices on a medium term and design
contracts that allow smaller lot sizes at favourable prices. Literature provides solutions
to mitigate increases in costs as a result of batch ordering; consolidating loads from
multiple suppliers located near each other (Paik and Bagchi, 2007) and the use of
advanced information technology (Simchi-Levi et al. 2008).
52
Distributors and selected SSPCs can engage in strategic partnerships and create vendor
managed inventory. However, because the price of steel is determined in the global
market, fixing prices in the supply chain requires a high level of trust and willingness to
engage in long-term relationships. Steel distributors can also reduce uncertainty
without entering into strategic alliances. According to Özer and Wei (2006), alternative
contract forms between suppliers and customers can focus on providing incentives to
reveal buyer’s true forecasts and to match purchasing patterns to actual demand
patterns. Capacity reservation contracts relate between establishing guaranteed
availability and price setting. Advanced purchase contracts relate between demand
uncertainty and price security. Paul and Bose (2004) identify price-only and buyback
contracts to smoothen demand. The research shows that SSPCs are willing to engage in
such contract forms.
5.4 Possible solutions for steel distributors
The literature review revealed that the price of steel is determined by global factors,
independent of Dutch market dynamics. To reduce uncertainty caused by price
fluctuations, members of the supply chain have to cooperate in order to decrease
system wide risks. Despite the traditional ‘adversarial win-lose character’ of the sector,
a number of SCCs consider strategic alliances an attractive option. However, a number
of conditions do not favour the existence of strategic alliances: short term project
cycles, competition between distributors as a necessary condition to achieve low
prices, securing availability and the fragmentation of the purchase function. SCCs
identify trust to be the most important requirement to form alliances. The interviews
reveal that on an individual basis, this trust exists. Because of the capital intensive
character of steel, distributors should carefully choose where they engage in alliances
in order to limit the overall risks. Smaller SCCs targeting type 2 and 3 construction
projects often buy sections on the spot market. They have no apparent incentives to
cooperate with their suppliers. Larger SCCs targeting type 1 construction projects are
already engaged in closer relationships with distributors. These relationships can be
extended into the area of demand forecasting. Larger SCCs increasingly look for
partnerships to decrease financial risks, secure material availability and share financial
risks. Distributors can play an important role because of their insight into future market
53
conditions, their inventories and their financial strength. The researcher concludes
distributors should opt to put greater focus on the creation of strategic alliances based
on long term relationships and mutual benefits.
Overall SCCs indicate availability and just-in-time delivery to be important aspects of
the service of steel distributors. SCCs targeting type 2 and 3 construction projects
especially depend on these aspects. The design of the supply chain creates uncertainty
and pressure on lead times. Smaller SCCs try to increase their added value and to
reduce their dependence, but they have limited power in the supply chain. Achieving a
higher level of standardization in sections would make SCCs less vulnerable to incidents
occurring in the course of their projects. It would result in smoother demand patterns.
Standardization would also reduce the number of slow movers, improve demand
information and increase service levels for distributors. Because of their role in the
supply chain, distributors can have an important role in determining the level of
standardization. This would, however, have a negative impact on the opportunities for
distributors to offer a unique product range and/or specialties.
Distributors should focus on SCCs which are able to redesign their role in the supply
chain. A clear strategy, technical know-how and financial strength are the required
characteristics to achieve this. Distributors and SCCs can also create stability by
creating contract forms which are designed to reduce price risks. Until today, both
sectors have primarily engaged in sub-optimization. Advanced purchase contracts can
both mitigate price risks for both SCCs and distributors, while providing an incentive to
SCCs to share their true demand forecast information.
SSPCs
Overall, SSPCs engage much more in actions that cause the bullwhip effect, hence
limiting
variability is closely linked to the limitation of the independent variables that cause this
phenomenon. The existence of inventories in the sheet supply chain is an important
condition for SSPCs to cause an increase in demand variability.
54
Steel sheet distributors can reduce the variability of the flow of products within the
supply chain in a variety of ways. An important cause for demand volatility is batch
ordering, in particular for slow movers. SSPCs engage in batch ordering because large
batches have attractive prices. Distributors offer these lower prices because of lower
handling and transportation costs. However, batch ordering also has unfavourable
consequences for distributors: an increased variability of demand and a decrease in
service levels. Due to batch ordering, SSPC are forced to hold larger stocks, increasing
their requirement for capital. Literature provides solutions for distributors to perform a
larger number of smaller, but cost effective deliveries.
SSPCs have several incentives to engage in long term relationships with distributors.
First, high tech processing techniques require a constant quality of input material.
Second, end users demand a higher level of price stability. Relying on a single
distributor improves the options that SSPCs have to achieve these targets. The
automated processes, high tech production equipment and present stock management
provide SSPCs with the hardware and software needed to engage in centralizing
demand information. VMI could be part of a strategic alliance, in particular for SSPCs
focusing on specialization. Steel distributors need to engage in strategic alliances to
reduce uncertainty. They can offer new contract forms to their customers. By focusing
on revealing the capacity levels in the supply chain and by fixing prices, the buyer’s
true forecasts can be revealed. As a result, the matching of the purchasing patterns to
the real demand patterns will improve. The dependency on global price developments
decreases when a larger volumes are fixed. These contracts must provide clear
incentives for SSPCs to commit themselves.
5.5 Recommendations for steel distributors
These outcomes provide steel distributors with the following principal options when it
comes to reducing the negative effects of demand variability:
1. Distributors can reduce demand variability in both sectors by offering suitable
contract forms, which are aimed at fixing prices, securing availability and sharing
risks.
55
2. Distributors need to focus on tailored solutions as steel processors experience
different problem areas, depending on the strategic choices they make and the
end user markets they supply.
3. Distributors can reduce demand variability from SCCs by forming strategic
alliances, designed to generate long-term advantages The most important
condition to form alliances is mutual trust.
4. Smaller SCCs would benefit from an increased level of standardization of sections
as this decreases the risk of obsolete material. Inventory management of
distributors would improve because the number of slow movers will decrease and
reduced overlap will improve the reliability of demand information.
5. Most SSPCs engage in batch ordering to minimize material prices. Distributors can
reduce demand variability by designing the supply chain with the purpose of
effectively performing a larger number of smaller deliveries.
6. SSPCs have more incentives (dependence due to the use of special qualities, long
term contracts and constant material quality) and are better equipped (hardware,
software and inventory management) to engage in strategic alliances. Price
stability is also an incentive for SSPCs to enter into an alliances.
5.6 Further research
Demand variability will not be the only future challenge for Dutch steel processors and
distributors. A recent article published by the association of Dutch steel distributors
(Staalfederatie, October 2010) confirms the supply chain is in a period of transition
and that that steel distributors need to redefine their role.
Specialization, supply chain integration, prefab manufacturing and sustainability are
already becoming important topics. The global reserves of many raw materials will be
exhausted in the next decade. The industry will have to use these reserves wisely. It is
essential for the Dutch steel industry to find opportunities to improve the efficiency of
the supply chain in order to decrease system wide costs and increase the focus on
customer demands. The quality of information technology will further improve and will
56
increasingly be applied in the sector. As a consequence, cooperation in the supply
chain will increase.
Demand will show an overall slow and steady decline in the future. Steel distributors
must search for partners in the supply chain to strengthen their position and to reduce
the unfavourable consequences of demand and price variability. Today, literature
research reveals little information on how these challenges can be met. Further
research is necessary to establish the optimal design of the supply chain and the
available solutions for distributers to contribute to this process.
57
BIBLIOGRAPHY
Textbooks, articles, reports;
Adams, G. and Schvaneveldt, J. (1991) Understanding research methods. 2nd edition.
New York; Longman
Aeppel, T. (2010, January 27) Bullwhip hits firms as growth snaps back. Wall Street
Journal.
Akkermans, H. and Vos, B. (2003) Amplification in service supply chains: an exploratory
case study from the telcon industry. Production and Operations Management. Vol. 12,
pp. 203-223
Alony, I. and Munoz A. (2007, October) The bullwhip effect in complex supply chains.
International Symposium on Communications and Information Technologies ISCIT.
Balakrishnan, A., Geunes, J., Pangburn, M. (2004) Coordinating supply chains by
controlling upstream variability propagation. Manufacturing & Service Operations
Management. Vol. 6(2), pp. 163-183.
Ballard, G. and Arbulu, R. (2004) Making production lean. 12th International Group for
Lean Construction Conference. Elsinore, Denmark.
Ballard, G. and Howell, G. (1994), Implementing lean construction; stabilizing work
flow. 2nd annual conference for the International Group for Lean Construction.
Rotterdam: A.A. Balkema,
Beckerman, W. and Jenkinson, J. (1986) What stopped the inflation: unemployment or
commodity price. Economic Journal. Vol. 96, pp. 39-54.
Binder, A. (1986) Can the production smoothing model of inventory behaviour be
saved?. Quarterly Journal of Economics. Vol. 101, pp. 431-453.
Blanchard, O. (1983) The production and inventory behavior in the American
automobile industry. Journal of Political Economy. Vol. 91, pp. 365-400.
Bosworth, B. and Lawrence, R.Z. (1982) Commodity prices and the new inflation.
Washington, DC: The Brookings Institution.
58
Boute, R., Disney, S., Lambrecht, M., Houdt, Van, B. (2007) An integrated production
and inventory model to dampen upstream demand variability in the supply chain.
European Journal of Operational Research. Vol. 178, pp.121-142.
Bryman, A. (2006) Integrating quantitative and qualitative research; how is it done?.
Qualitative Reseach. Vol. 6, pp. 97-113.
Buffa, E.S. and Miller, J.G. (1979), Production-inventory systems; planning and control.
3rd edition. Homewood, IL: Irwin
Burns, A.F. and Mitchell, W.C. (1950) Measuring business cycles. National Bureau of
Economic Research. New York.
Cachon, G.P. (1999, June) Managing supply chain demand variability with scheduled
ordering policies management. Science. Vol. 45, no. 6, pp. 843-856.
Cachon, G.P., Randall, T., Schmidt G.M. (2007) In search of the bullwhip effect.
Manufacturing & Service Operations Management. Vol. 9, no. 4, pp. 457-479.
Carone, G., Denis, C., McMorrow, K., Mourre G., Röger W. (2006) Long-term labour
productivity and GDP projections for the EU25 member states: a production function
framework. Directorate-General For Economic And Financial Affairs, Economic Papers.
No. 253.
Chatfield, D.C., Kim, J.G., Harrison, T.P., Hayya, J.C. (2004) The bullwhip effect – impact
of stochastic lead time, information quality and information sharing; a simulation
study. Production and Operations Management. Vol. 13, pp. 340-353.
Clark, T.H. and Hammond, J.H., (1997) Reengineering Reordering Processes to Improve
Total Supply Chain Performance. Production And Operations Management .Vol. 6, no.
3, pp 248-265.
Cook, T. D. and Campbell, D. T. (1979) Quasi-experimentation. Boston: Houghton Mifflin
Company
Cooper, D.R. and Schindler, P.S. (2008) Business research methods. 10th edition. Boston:
McGraw-Hill
59
Cucchiella, F. and Gastaldi, M. (2006) Risk management in supply chain: a real option
approach. Journal of Manufacturing Technology Management. Vol. 17, no. 6. Emerald
Group Publishing
De Souza, R., Zice, S., Chaoyang L. (2000, May) Supply chain dynamics and
optimization. Integrated Manufacturing Systems. Vo. 11/5, page 348-364. MCB
University Press.
Dehn, J. (2000) Commodity price uncertainty and shocks: implications for economic
growth. Centre for the Study of African Economies. Department of Economics
University of Oxford.
Doz, Y.L. and Hamel, G. (1998) Alliance Advantage. Boston: Harvard Business School
Press
Duyne, van, C. (1979) The macroeconomic effects of commodity market disruptions in
open economies. Journal of International Economics. Vol. 9, pp. 559-582.
Easterby-Smith, M. , Thorpe, R., Jackson, P. and Lowe, A. (2008) Management
Research. 3rd edition. London: Sage
Evers, H., Hamerlinck, A.F., Dolsma, A. (2003) Kostenbewust bouwen met staal.
Rotterdam: Stichting Bouwen met Staal.
Forrester, J. (1958) Industrial dynamics-a major breakthrough for decision makers.
Harvard Business Review. Vol. 36, no. 4, pp. 37-66.
Forrester, J. (1961). Industrial Dynamics. Cambridge (USA): MIT Press
Fransoo, J.C., Udenio, M , Peels, R. (2010) Responding to the Lehman Wave: Sales
Forecasting and Supply Management during the Credit Crisis. Eindhoven: University of
Technology.
Geary, S., Disney, S.M., Towill, D.R., (2003, 3-7 August) Bullwhip in Supply Chains: Past,
Present and Future. 17th International conference on Production Research. Virginia.
Glatzel, C., Helmcke, S., Wine, J. (2009, March) Building a flexible supply chain for
uncertain times. McKinsey quarterly.
Harris, F. W. (1915) Operations Cost. Chicago: Shaw
60
Heng, M.S.H., Chung, Y. Wang, W., He, X., (2005, March) Supply chain management and
business cycles. Supply Chain Management. Vol. 3, pp.157-161, Emerald Group
Publishing
Jones, S., Wahba, K., Heijden, van der, B. (2007) How to write your MBA Thesis. Oxford:
Meyer & Meyer (Maastricht School of Management series)
Katz, J. (2009, September 16) Buried under inventory. Industrial Weekly.
Labys, W.C. and Maizels, A. (1990, November) Commodity price fluctuations and
macro-economic adjustments in developed countries. World Institute for Developments
economics; research of the United Nations University.
Laing, J.R. (2010, April 5) When profits are as strong as steel. Wall Street Journal.
Lamb, C.W., Hair, J.F., McDaniel, C. (2010) Marketing. Mason: South-Western Cengage
Lee, H.L. and Billington, C. (1989) Managing Supply Chain Inventory: Pitfalls and
Opportunities. Journal of Manufacturing and Operations Management. Vol. 2, pp. 81–
104.
Lee, H.L., Padmanabhan, V., Whang, S. (1997A) The bullwhip effect in supply chains
.Sloan Management Review. Vol. 38, no. 3, pp. 93-102.
Lee, H.L., Padmanabhan, V., Whang, S. (1997B) Information distortion in a supply
chain: the bullwhip effect. Management Science. Vol. 43, no. 4, pp. 546-558.
Lee, H.L. (2001) Ultimate enterprise value creation using demand based management.
Stanford: Global Supply Chain Management Forum
Lewicki, R.J. and Bunker, B.B. (1995) Trust in Relationships: A Model of Trust
Development and Decline. San Francisco: Jossey-Bass
Li, Y., Gao, L., Liu, J. Kong, Z., Lu, K., Zhao, Z. (2007) Research on refraining the
bullwhip effect in supply deficiency conditions. International Journal of Business and
Management. Vol. 2, no. 4., pp. 94-98
Li, G., Yan, H., Wang, S., Xia Y. (2005, January) Comparative analysis on value of
information sharing in supply chains. Supply Chain Management Journal. Vol. 1, pp.
34–46, Emerald Group
61
Maizels, A. (1987) Commodities in Crisis: An Overview of the Main Issues. World
Development. Vol. 15, pp. 537-550.
Mankiw, N.G. and Taylor, M.P. (2006) Economics. London: Thompson Learning
Manshanden, H. and Jonkhof, R. (2009) Bouw Prognose 2009-2014 (Dutch
governmental publication). Delft: TNO/MIN. VROM
Marx, K. (1894) Capital: a critique of political economy - Vol. III - Part I. 1st edition.
Chicago: Charles H. Kerr & Co.
McCafferty, J.P. (2006, September, October) Supply Chain; Distortions are amplified up
and down the supply chain. While you can’t stop it, you can try to contain it. Forward
Online Magazine. Available: http://forward.msci.org/articles/0906supplychain.cfm.
Accessed: 2010, December 20).
McGuigan, J.R., Moyer, R.C., Harris, F.H. (2005) Managerial economics. 10th
edition. Mason: South Western/Thompson Learning.
Miles, M.B. and Huberman, A.M. (1994) Qualitative data analysis. 2nd edition.
Thousand Oaks: Sage.
Mitchell, V. (1996) Assessing the reliability and validity of questionnaires; an empirical
example. Journal of applied management studies .Vol. 5, no. 2 pp. 199-207.
Özer, Ö. and Wei, W. (2006) Strategic commitments for optimal capacity decisions
under asymmetric forecast information. Management Science. Vol. 52, pp. 1239-1258.
Paik, S-K. and Bagchi, P.K. (2007) Understanding the causes of the bullwhip effect
in a supply chain. International Journal of Retail & Distribution Management. Vol. 35,
no. 4, pp. 308-324. Emerald Group
Paul, A., and Bose, I. (2004) Demand variability and incentives in inventory-based
contracts. Operations Research Letters. Vol. 32, pp. 409-414. Elsevier.
Robson, C. (2002) Real world research. 2nd edition. Oxford; Blackwell.
Rong, Y., Shen, Z-J, M., Snyder, L.V. (2009, February) The impact of ordering behavior on
order-quantity variability: a study of forward and reverse bullwhip effects. Services and
Manufacturing Journal. Vol. 20(1), pp. 95-124.
62
Saunders, M., Lewis, P., Thornhill, A. (2009) Research methods for business students. 5th
edition. Harlow: Pearson Education
Sharma, S. (2010) Introduction of Steel Futures Contracts on the Commodity Futures;
Market Effects of Hedging and Speculation on Commodity Prices. Available:
http://www.scribd.com/doc/15744584. Accessed: 2011, January 17.
Shenhar, A.J. and Laufer, A. Integrating product and project management – a new
synergetic approach. Engineering Management Journal. Vol. 7 (3), pp. 11-15.
Simchi-Levi, D., Kaminsky, P., Simchi-Levi, E. (2008) Designing and managing the
supply chain. 3rd edition. New York: McGraw-Hill Irwin.
Suthikarnnarunai, N. and Muangthong, K. (2009, October) Economics factors
influencing logistics cost of Thai steel industry. Proceedings of the World Congress on
Engineering and Computer Science. Vol. 2. San Francisco.
Terland, G. and Mankowitz, J. (2008) Supply chain management in the Swedish steel
industry. Stockholm: KTH
Thompson, C.M. (1926) Elementary economics. B.H. Sanborn & Co
Tian, Z., He, Y., Zhao, C., Yi, G. (2005) The pricing behavior of firms in the Chinese iron
and steel industry. Asia Pacific Journal of Marketing and Logistics. Vol. 17, no. 3, pp.67-
88.
Tommelein I.D., Walsh, K.D., Herschauer, J.C. (2003) Improving capital projects supply
chain performance, a research report to the construction industry institute. Austin:
University of Texas.
Tommelein, I.D., Gil, N., Schruben, L.W. (2006) External Change in Large Engineering
Design Projects: The Role of the Client. IEEE Transactions on Engineering Management.
Vol. 53, no. 3, pp. 426-439.
Tommelein, I.D., Gil, N., Beckman, S. (2008) Problem-Solving Base Building under
Uncertainty and Ambiguity: A Multiple-Case Study on an Airport Expansion Program.
ASCE, Journal of Construction Engineering and Management. Vol. 134, no. 12, pp. 991-
1001,
63
Towill, D.R. (1991) Supply Chain Dynamics. International Journal of Computer
Integrated Manufacturing. Vol. 4(4), pp. 197-208.
Sterman, J. (1989) Modeling managerial behavior: Misperceptions of feedback in a
dynamic decision-making experiment. Management Science. Vol. 35, pp. 321–339.
Schweitzer, M.E. and Cachon, G.P. (2000) Decision Bias in the Newsvendor Problem
with a Known Demand Distribution: Experimental Evidence. Management Science. Vol.
46, no. 3, pp. 404-420.
Web sites:
ArcelorMittal (2009) ArcelorMittal Annual Report and Management report. Available:
www.arcelormittal.com. Accessed: 2010, September 21.
BHP Billiton reports and presentations. Available:
www.bhpbilliton.com/home/investors/reports/Pages/default.aspx. Accessed: 2011,
February 2nd.
CBS (2011) CBS building statistics 2001-2010 Central Agency of Statistics of the Dutch
government. Available: www.cbs.nl. Accessed: 2011, April, 4.
CRU Steel Long Products Monitor. Available: www.crumonitor.com. Accessed: 2011,
February 2nd). CRU London
Export barriers and global trade in raw materials: the steel industry experience.
Available: www.oecd.org/dataoecd/39/26/43934105.pdf. Accessed: 2011, January 5.
Maps of great infrastructure development projects around the world. Available:
www.schillerinstitute.org/economy/ maps/ maps.html. Accessed: 2011, January 5.
Staal In Beeld Report and Dutch steel market volumes. Available;
www.staalfederatie.nl. Accessed: 2011, March 15.
Steel export reports. Available: www.issb.co.uk. Accessed: 2011, January 5.
Thompson Reuters, commodity customer updates, Available:
http://commoditiesupdates.thomsonreuters.com/. Accessed: 2011, March 15
64
W.S.A.: Top steel producers. Available:
http://www.worldsteel.org/?action=programs&id=53. Accessed: 2011, February 2th.
Wold Steel Association, Brussels.
World Industry Directory. Available: http://www.economywatch.com/world-
industries/. Accessed: 2010, December 18.
Corporate reports:
ABN AMRO Group Economics Sector Research (2009, September) Visie op Sectoren.
ABN AMRO Bank NV Amsterdam
ABN AMRO International Shipping & Marine Services (2010, October) Global Economy
& Dry Bulk Outlook. ABNAMRO Bank London
ABN AMRO Group Economics Sector Research (2010) Commodity Price Forecast Q4-
2010. ABN AMRO Bank NV Amsterdam
ABN AMRO Policy & Portfolio Sector Research (2009, February) Sectoren in stress: Een
analyse naar de gevolgen van de kredietcrisis voor sectoren in Nederland. ABN AMRO
Bank NV Amsterdam
ABN AMRO Group Economics Sector Research (2010) Prospects for EU steel production
until 2011. ABN AMRO Bank NV Amsterdam
ECORYS - Directorate-General Enterprise & Industry (2008, August) Study on the
Competitiveness of the European Steel Sector Within the Framework Contract of
Sectoral Competitiveness Studies – ENTR/06/054. ECORYS SCS Group Rotterdam
Eurometal (2010, June) Outlook on economies and steel markets. Eurometal, European
Organisation of National Associations of Steel, Tube and Metal Distribution
LaPlace Conseil (2003, May 23) The Steel Industry Globalization Trends
Gaspar, D., Dalmolin, J.R., Masiero, L., Rachik, A. (2010) Mining & steel: How will M&A
play out?. Chicago: AT Kearny Reports
ING Bank Economisch Bureau (2010) My Industry: Dutch Manufacturing. ING Bank,
Amsterdam.
65
ING Bank Economisch Bureau (2008) Toeleveranciers Bouw, Sectorstudie. ING Bank,
Amsterdam.
Krebbekx, J.A., Wolf, de, W.A. (2009, August) Dutch Hall: de duurzame hal die geld
oplevert. Berenschot/Bouwen Met Staal
Price, A.H., Nance, S. (2009, October) Export Barriers and Global Trade in Raw
Materials: The Steel Industry Experience. Report To The Raw Materials Committee of
the Organization For Economic Cooperation And Development. Washington: Wiley
Rein LLP.
Staalfederatie, Staal in Beeld (Oktober 2010)
TATA Steel (2010, December) Price environment: supporting information. Internal
presentation.
Other resources:
Barendsz, M.A. (2010, October) Market Survey and Analysis: Multi-storey and
Industrial Buildings. Zoetermeer: Bouwen Met Staal
Bolarín F.G., Lisec, A., Cruz, F., Esteban, L. (2008) Inventory cost consequences of
variability demand process within a multi-echelon supply chain. Logistics & Sustainable
Transport. Vol.1, no.3
Cassivi, L., Lefebvre, L.A., Le Hen, G. (2000, February) Supply Chain Integration in the
Automobile Industry: The Case of ANX. Proceedings at the 8th International Conference
on Management of Technology. Oxford: Elsevier Advanced Technology.
Cross, J. (2005, March) Steel Market Trends. Modern Steel Construction, AISC. Vol. 45,
no. 3, pp. 23-25.
Halmai, P. and Vásáry, V. (2010) Growth crisis in the main groups of the EU
Member States; a comparative analysis. University of Pannonia Hungary; Faculty of
Economics
Holste, C. (2010, March) The bullwhip effect caused by Caterpillar. Supply Chain Digest.
Jansen, F.J. and Sijpersma, R. (2006) Opdrachtgevers aan het woord, meting 2006.
Economisch Instituut voor de Bouwnijverheid.
66
Kaipia, R., Korhonen, H., Hartiala, H. (2006) Planning nervousness in a demand supply
network: an empirical study. International Journal of Logistics Management. Vol. 17,
no. 1, pp. 95-113. Emerald Group
Kalagnanam, J. and Claessens, D. (2008) Steel on demand: how steelmakers can
become more responsive, inventory policies which can change the industry. IBM Global
Business Services: Metals Industry.
Kyung-Hee Jung and Sang-Kyu Lee (2006, April) New paradigm of steel mills in the
supply chain of sheets. Supply Chain Management Journal. Vol. 4, pp. 328-336.
Emerald Group
Lowengart, O., Mizrahi, S. (2000) Applying international reference price. International
Marketing Review. Vol. 17, no. 6, pp. 525-537. MCB University Press
Machline, C. (2010, May 7-10) The Global Supply Chain Pricing Dynamics. Proc. of the
21st POMS Annual Conference. Vancouver.
Morita, K. (1983) On a destabilizing effect of commodity market intervention. The
Developing Economies. Vol. 21, no. 1, pp. 24-34.
Newlands, D.J. (2005) Forrester Effect Solutions. ICIL Seminar presentation.
Montevideo.
Ramesh, V. (2009, July) Effectively manage demand variability in the CPG industry.
Infosys publications
Richardson, P.K. (1998) Steel Price Determination in the European Community. Journal
of Product & Brand Management. Vol. 7, no. 1, pp. 62-73. MCB University Press.
Roodposhti, F.R., Nikomaram, H. & Amirhosseini, Z. (2009) Managing a firm's
systematic risk through sales variability minimization - a test of three competing
techniques. Global Economy & Finance Journal. Vol. 2, no.2, pp. 63-74.
Royal, W. (2001, May 21) Putting Out Supply-Chain Fires; Bullwhip effect minimized by
National Steel Corp.. Industry week.
Zwart de, C. (2004) Collaborative planning, IT Logistiek, No. 10
67
No
.
Question Item Variable Data type
1 My company purchases (1) steel sections, (2)
steel sheets
GC1 - Dichotomous
2 My company purchases annually .. tons of
steel
GC2 - Continuous
(ratio) data
3 My company purchases steel for stock
replenishments
GC3 -
Ranked
4 My company purchases steel for customer
orders/projects
GC4 -
Ranked
5 The fluctuation of purchased volumes of steel
by my company can be ranked as ..
CONS1
Dependent
variable
(demand
variability)
Ranked
6 The impact of demand variability on my
company’s performance is ..
CONS2 Ranked
7 The impact of demand variability on my
company’s present stocks is ..
CONS3 Ranked
8 The impact of demand variability on my com-
pany’s running customer orders/projects is..
CONS4 Ranked
9 My company has long term contracts with
customers
PS3 Production
smoothing
Ranked
10 Fluctuations in delivery time influence my
ordering behaviour
LT2 Bullwhip
effect
Ranked
11 My company can easily find alternative
suppliers
IO2 Bullwhip
effect
Ranked
12 My company runs MRP periodically BO1 Bullwhip
effect
Ranked
13 My company uses production smoothing PS2 Production
smoothing
Ranked
14 The cost for steel ranks as .. % of sales price BR Price
elasticity
Continuous
(ratio) data
15 (Expected) price changes are disrupting
smooth patterns of customer demand
PT1 Price
elasticity
Ranked
16 My company has a good overview of its stock
levels
DF2 Bullwhip
effect
Ranked
17 My customers increase order levels in times of
expected price rises
PF2 Bullwhip
effect
Ranked
18 Ordering extra volumes in times of shortages
is important to maintain sufficient availability
IO3 Bullwhip
effect
Ranked
68
19 My company keeps finished products on stock PS1 Production
smoothing
Ranked
20 My purchased steel products can be used for
multiple purposes
AU Price
elasticity
Ranked
21 utilization of product capacity PT2 Price
elasticity
Ranked
22 Future market conditions are an important
aspect of purchasing steel
PF3 Bullwhip
effect
Ranked
23 My company batches orders to reduce
handling costs
BO3 Bullwhip
effect
Ranked
24 My company batches orders to reduce
material prices
BO4 Bullwhip
effect
Ranked
25 My company has a good overview of future
customer demand
DF1 Bullwhip
effect
Ranked
25 Delivery times of purchase orders influence
my ordering behaviour
LT1 Bullwhip
effect
Ranked
28 My company shares information on demand
with suppliers
DF4 Bullwhip
effect
Ranked
30 I adapt purchasing levels on price expectations PF1 Bullwhip
effect
Ranked
31 Customers determine our production
planning
PT3 Price
elasticity
Ranked
32 Reliability of lead times is vital for my
company
LT3 Bullwhip
effect
Ranked
33 My company uses advanced forecasting
techniques
DF3 Bullwhip
effect
Ranked
34 My company increases purchase levels in
times of expected shortages
IO1 Bullwhip
effect
Ranked
35 My company batches orders BO2 Bullwhip
effect
Ranked