1 Dell Demo Center – https://demos.dell.com | Dell Inc., 2016
Demo Lab Guide – Dell XC
XC-Series Web-Scale Converged Appliance
Product Domain: Storage
Author: Joseph Correia
Version: 1.01 Date: 24/01/2016
2 Dell Demo Center – https://demos.dell.com | Dell Inc., 2016
Table of Contents 1 Product Overview ............................................................................................................................................ 3
1.1 Lab Preparation Considerations and Caveats ................................................................................. 4
2 Introduction ...................................................................................................................................................... 5
2.1 Lab Topology and Essential Information .......................................................................................... 5
3 Nutanix Walk-through ................................................................................................................................... 6
3.1.1 LAB 1 - Basic Navigation of Nutanix Prism – [Step by Step] ........................................................ 6
3.1.2 Monitoring .............................................................................................................................................. 7
3.1.3 Advanced talking points ................................................................................................................... 25
3.1.4 Maintenance ....................................................................................................................................... 30
3.1.5 Upgrade Software ............................................................................................................................... 31
3.1.6 Automation ......................................................................................................................................... 32
4 Conclusion..................................................................................................................................................... 33
3 Dell Demo Center – https://demos.dell.com | Dell Inc., 2016
1 Product Overview
Consolidate compute and storage into a single chassis with Dell XC Series web-scale converged
appliances, powered by Nutanix software. XC Series appliances install quickly, integrate easily into any
data center, and can be deployed for multiple virtualized workloads including desktop
virtualization, database and private cloud projects. With Dell XC Series appliances, your enterprise can:
- Grow incrementally with pay as you grow, scale-out expansion
- Increase capacity and performance one node at a time
- Meet future needs without over-provisioning
- Deploy desktop virtualization infrastructure up to 6 times faster-and at up to 27% lower cost
over a three-year duty cycle-than traditional white box solutions1
.
4 Dell Demo Center – https://demos.dell.com | Dell Inc., 2016
1.1 Lab Preparation Considerations and Caveats
It is in your best interests to ensure the demo environment you will be demonstrating is clean & tidy
before you begin. For this reason we would recommend, where possible, you log in to your demo at
least 15 minutes prior to delivery and check the following;
1. Familiarize yourself with the environment during this time and check any specific features you are
expecting to demo.
2. Most importantly, be crystal clear with yourself on what it is you plan to show. A full demo of every
feature described below (with questions) can take several hours. If you only have a short time slot
be sure to focus on the key points that address the customer’s pain points and will drive value
home to them.
3. Ensure that you have scheduled the demo for sufficient time so as not to have the demo end
before you are finished with the customer.
4. This demo provides read-only access to the Nutanix Prism UI only
a. Please do not
i. Remove/Change the Demo Storage Pool
ii. Remove / Change the Dell World01 container
iii. Remove / Change the landing machines container
iv. Change any user passwords
v. Remove / Change the banner
Any other guidance on how the user should prepare for the lab can be added here. If there are
limitation or something the user should be aware of call out also.
5 Dell Demo Center – https://demos.dell.com | Dell Inc., 2016
2 Introduction
This document provides details on HOW to deliver an effective live demonstration of the
Dell XC to customers.
In this demo you will cover the following subject areas;
- Monitoring
- Configuration
- Data Protection
- Maintenance
.
2.1 Lab Topology and Essential Information
6 Dell Demo Center – https://demos.dell.com | Dell Inc., 2016
3 Nutanix Walk-through
3.1.1 LAB 1 - Basic Navigation of Nutanix Prism – [Step by Step]
Normally you type the Nutanix Web console (Prism) IP address into a web-browser (preferably Internet
Explorer).
1. Enter the following details when prompted:
a. Username: demouser
b. Password: password
Note: If necessary explain to the customer that the Nutanix Prism Element is the central point of
management and is a single pane of glass management console for the Dell XC.
7 Dell Demo Center – https://demos.dell.com | Dell Inc., 2016
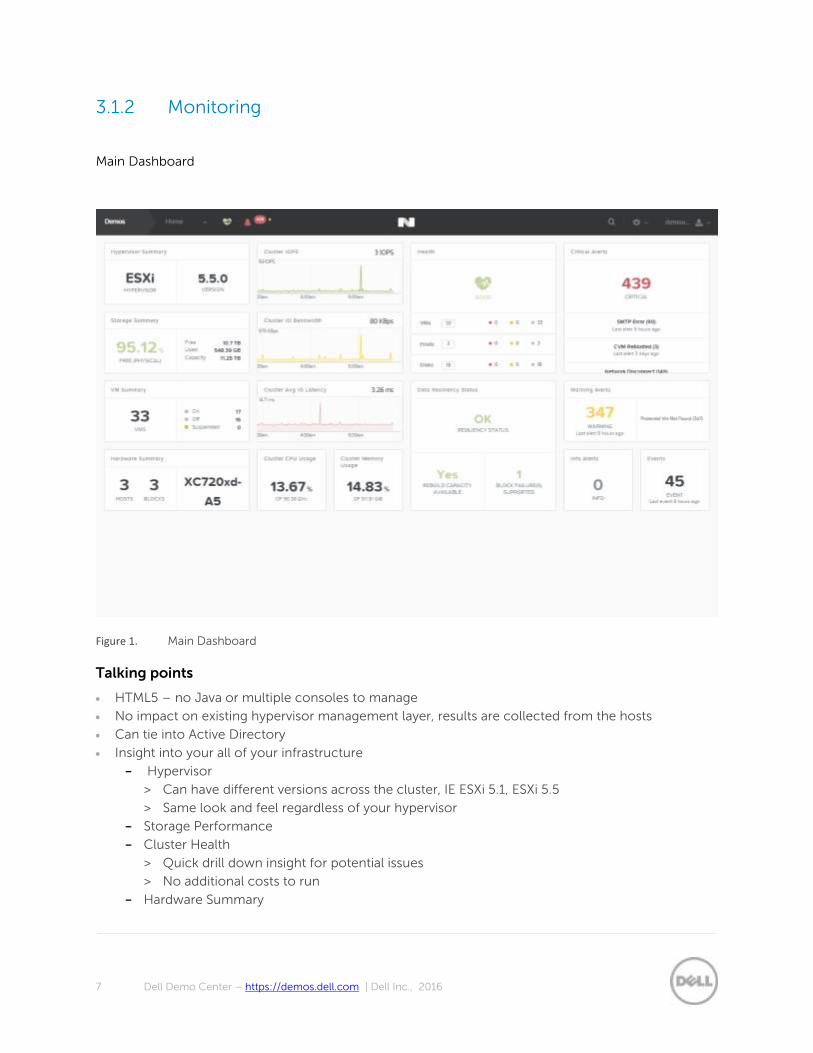
3.1.2 Monitoring
Main Dashboard
Figure 1. Main Dashboard
Talking points
HTML5 – no Java or multiple consoles to manage
No impact on existing hypervisor management layer, results are collected from the hosts
Can tie into Active Directory
Insight into your all of your infrastructure
- Hypervisor
> Can have different versions across the cluster, IE ESXi 5.1, ESXi 5.5
> Same look and feel regardless of your hypervisor
- Storage Performance
- Cluster Health
> Quick drill down insight for potential issues
> No additional costs to run
- Hardware Summary
8 Dell Demo Center – https://demos.dell.com | Dell Inc., 2016
Daily administration tasks are broken up to the left and configuration tasks to the right
The Prism UI is reachable from any one of virtual storage controllers; the cluster external address
provides a Highly Available address
1. To illustrate Active Direction integration, click on the COG Icon, on the top right of the screen and
scroll down and click on Authentication.
2. Click on Client in the Authentication Configuration menu to illustrate the ability set up SSL
certificates if needed.
9 Dell Demo Center – https://demos.dell.com | Dell Inc., 2016
3. Click on heart icon on the screen or Health from the pull-down list on the left of the main menu.
a. The Health dashboard displays dynamically updated health information about VMs, hosts, and
disks in the cluster.
10 Dell Demo Center – https://demos.dell.com | Dell Inc., 2016
Figure 2. Over 55 Health Checks that are configurable
Talking points:
View of all of your infrastructure, virtual machines, hosts and disks.
Taking local storage and forming a storage fabric spread out over many nodes/servers can be very
complex. As the cluster size grows, the chances increase of getting faults. Quick isolation and
resolution of a problem are important to maintaining high availability. Without the need to dig into
the CLI or get Support on the phone you have the ability to use highly functional visual aids.
If you want to show some tests, show them some of the disk tests to explain how we have insight
into both HDD and SSD latency and track accordingly.
If you show guest VMs, focus on the per-application instead of infrastructure. Finding the needle in
the haystack for performance issues has never been so easy!
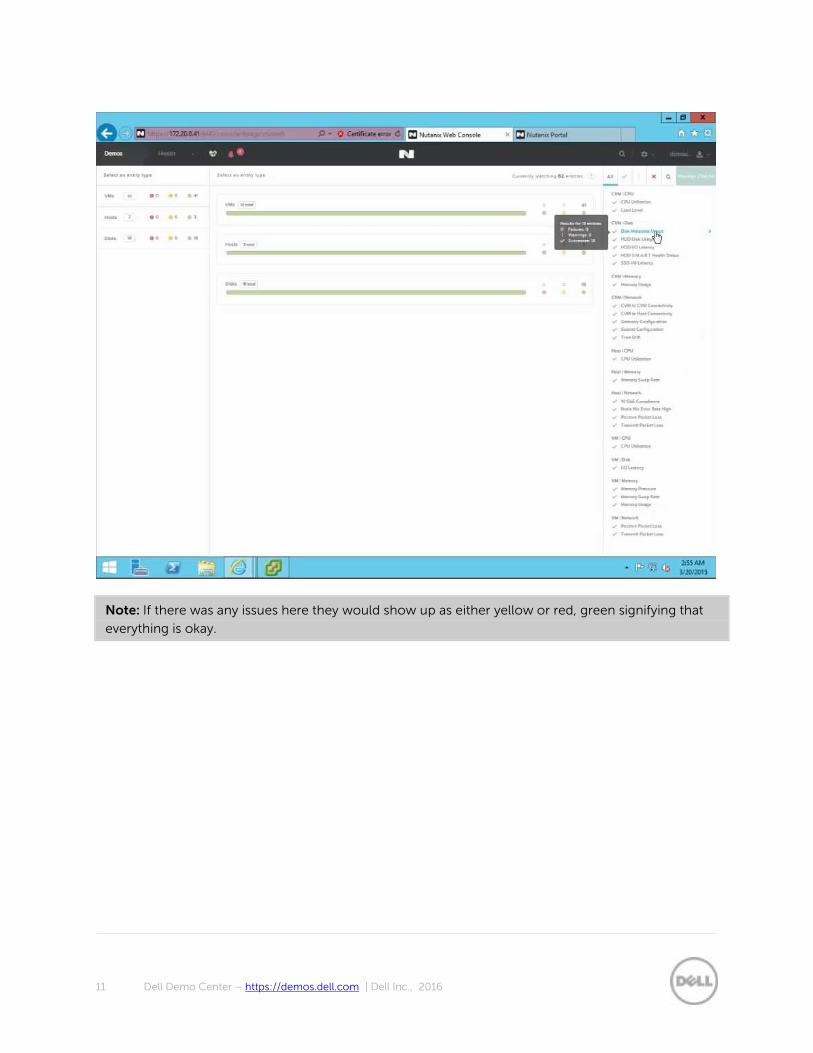
4. On the right hand pane, click on Disk Metadata Usage under the CVM | Disk field to examine
more details.
11 Dell Demo Center – https://demos.dell.com | Dell Inc., 2016
Note: If there was any issues here they would show up as either yellow or red, green signifying that
everything is okay.
12 Dell Demo Center – https://demos.dell.com | Dell Inc., 2016
Talking points
Hover your mouse over both the Cause and Resolution, demonstrating to the customer the
helpful feature for troubleshooting along with calling out the impact any failures are currently
having. These are also located in the Alerts tab in the drop down menu under Home.
This is all part of the software and there is no additional licensing required for this.
5. Click on the Go Back button on the top right hand side to go back to the main Health dashboard.
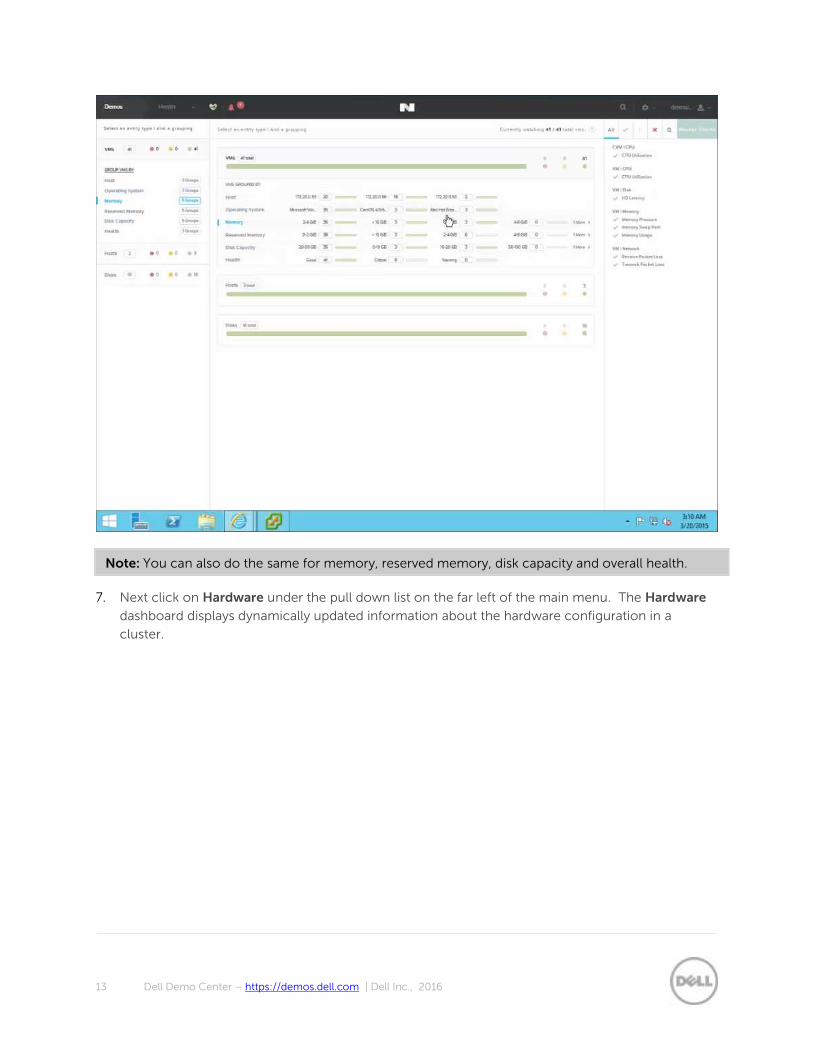
6. Next click on VM’s to illustrate the grouping Nutanix applying to quick view of all of your hosts. As
an example we can see that under the Operating System group we have some Microsoft, CertOS
and RedHat.
13 Dell Demo Center – https://demos.dell.com | Dell Inc., 2016
Note: You can also do the same for memory, reserved memory, disk capacity and overall health.
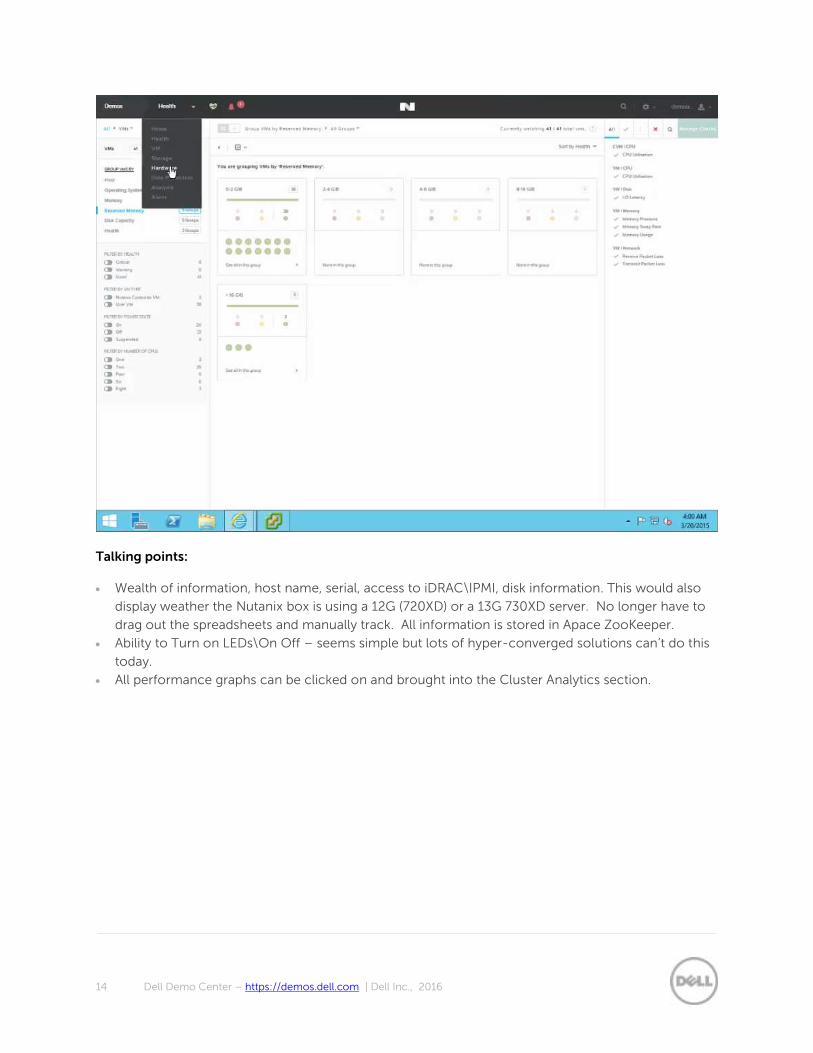
7. Next click on Hardware under the pull down list on the far left of the main menu. The Hardware
dashboard displays dynamically updated information about the hardware configuration in a
cluster.
14 Dell Demo Center – https://demos.dell.com | Dell Inc., 2016
Talking points:
Wealth of information, host name, serial, access to iDRAC\IPMI, disk information. This would also
display weather the Nutanix box is using a 12G (720XD) or a 13G 730XD server. No longer have to
drag out the spreadsheets and manually track. All information is stored in Apace ZooKeeper.
Ability to Turn on LEDs\On Off – seems simple but lots of hyper-converged solutions can’t do this
today.
All performance graphs can be clicked on and brought into the Cluster Analytics section.
15 Dell Demo Center – https://demos.dell.com | Dell Inc., 2016
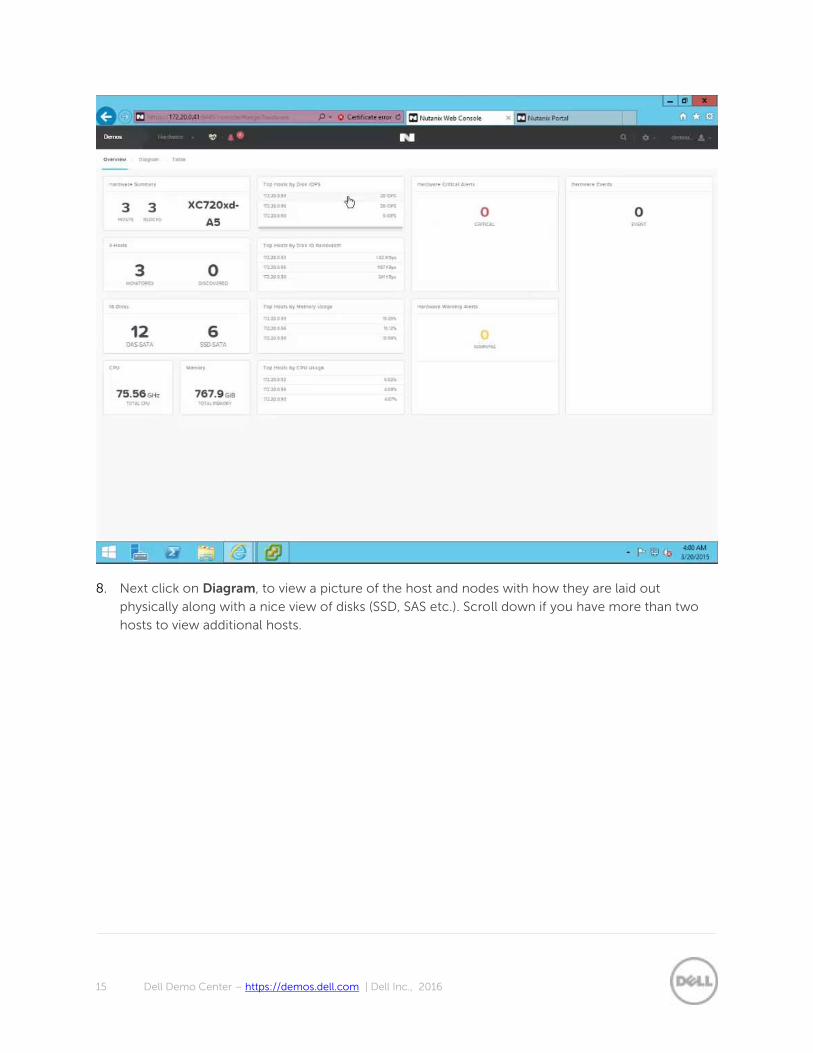
8. Next click on Diagram, to view a picture of the host and nodes with how they are laid out
physically along with a nice view of disks (SSD, SAS etc.). Scroll down if you have more than two
hosts to view additional hosts.
16 Dell Demo Center – https://demos.dell.com | Dell Inc., 2016
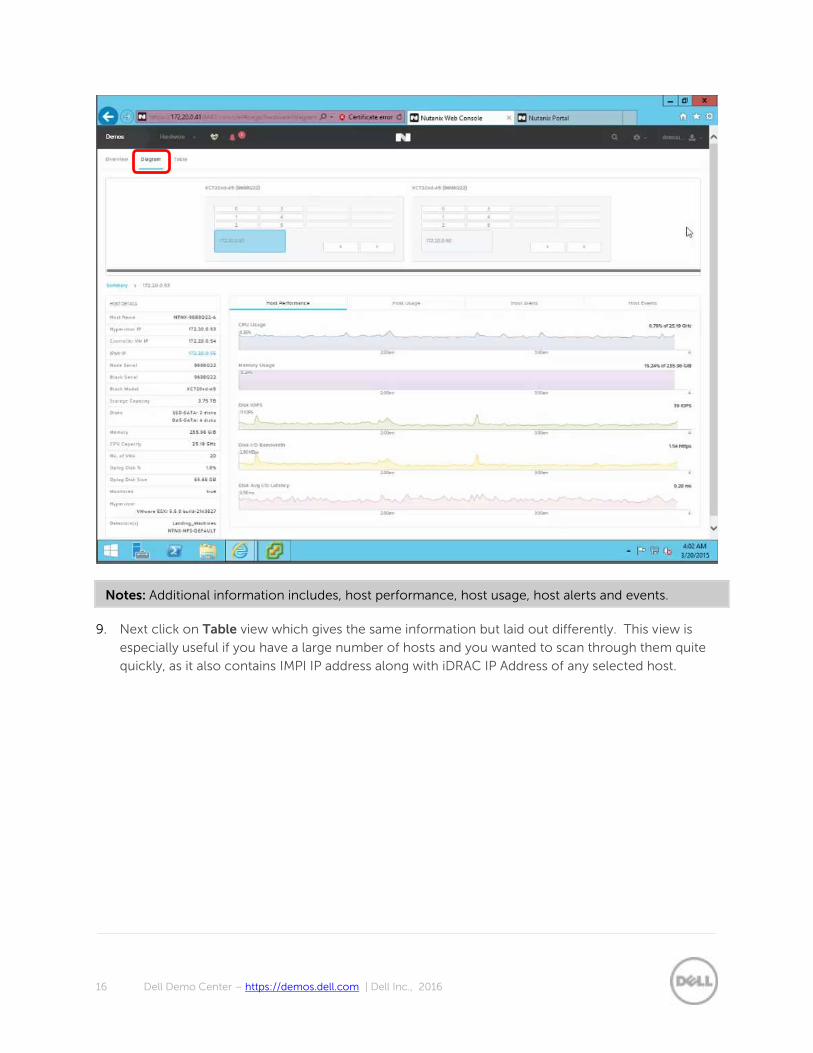
Notes: Additional information includes, host performance, host usage, host alerts and events.
9. Next click on Table view which gives the same information but laid out differently. This view is
especially useful if you have a large number of hosts and you wanted to scan through them quite
quickly, as it also contains IMPI IP address along with iDRAC IP Address of any selected host.
17 Dell Demo Center – https://demos.dell.com | Dell Inc., 2016
Talking points
In the table section of hardware it’s a good time to talk about Nutanix’s Hot Optimized tiering. SSDs
are kept around 75% full before down tiring data to the cold storage which is on HDD. All writes go
to SSDs by default. Data is brought back into the SSD tier based on access patterns.
If you click on the levels you can see that data is evenly distributed on all of the HDDs. This allows
for low impact and fast recover of components.
If you select the disk usage summary graph with your mouse, you can drag this data into the
analysis page.
10. Next click on VM from the pull down list on the far left of the main menu. This is the best place to
view performance on the Dell XC, especially if a user is concerned about performance on an
application or a VM.
Note: The virtual machine (VM) dashboard displays dynamically updated information about virtual
machines in the cluster.
18 Dell Demo Center – https://demos.dell.com | Dell Inc., 2016
From the VM overview you have a nice view of usage, IOPS and latency, as well as viewing any critical
alerts, warning alerts or VM events.
11. Click on the Table view, where you can see all your VM’s listed quite neatly here. You have the
ability to page through them here, with color coded graphs illustrating each VM’s performance.
Additional details here includes, the name, what host its sitting on and the Operating System it is
running on the right hand side of the screen.
19 Dell Demo Center – https://demos.dell.com | Dell Inc., 2016
Highlighting the application layer, use both the Google-like search to find your virtual machine or
navigate through the table view.
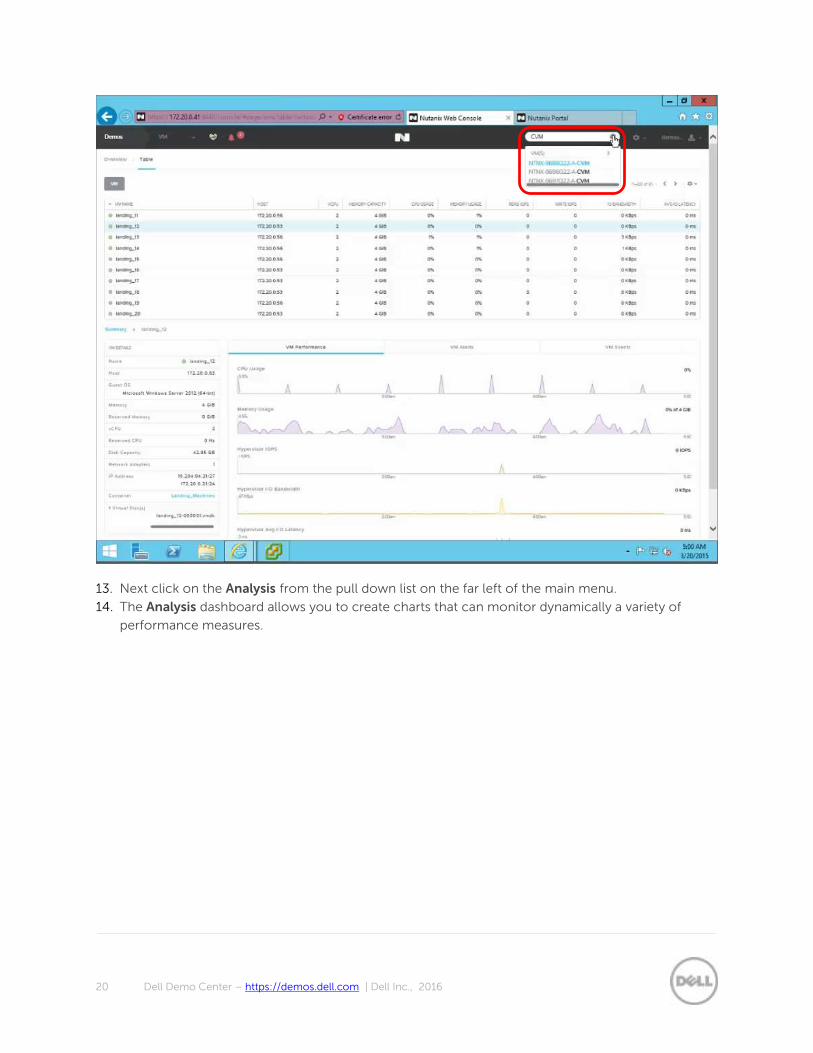
12. Click on the magnifying glass symbol at the top of the screen and type in one of your VM names
(i.e. CVM). Get all of the necessary statistics and the location of your virtual machine whether you
have 20 or 20,000 VMs. Once again all graphs can be brought into the Analysis section. Traditional
storage loses insights into these metrics because of IO blender affect. These metrics are natively
built into Nutanix from the very start from 2009.
20 Dell Demo Center – https://demos.dell.com | Dell Inc., 2016
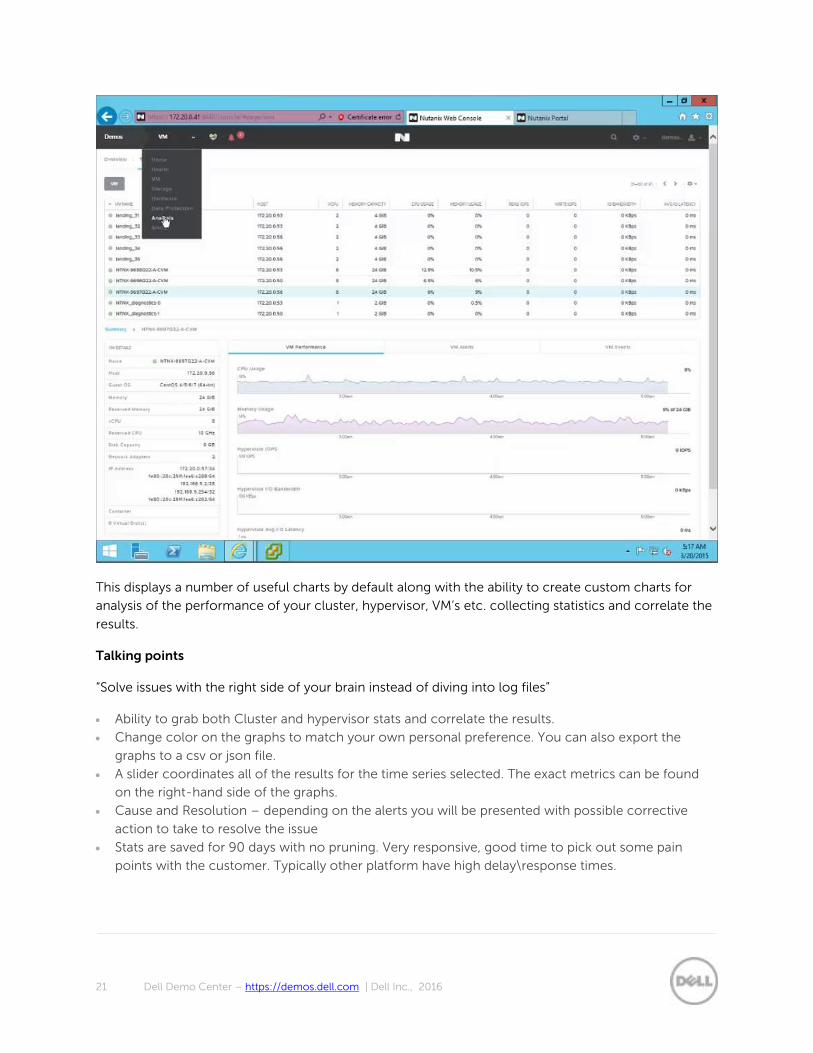
13. Next click on the Analysis from the pull down list on the far left of the main menu.
14. The Analysis dashboard allows you to create charts that can monitor dynamically a variety of
performance measures.
21 Dell Demo Center – https://demos.dell.com | Dell Inc., 2016
This displays a number of useful charts by default along with the ability to create custom charts for
analysis of the performance of your cluster, hypervisor, VM’s etc. collecting statistics and correlate the
results.
Talking points
“Solve issues with the right side of your brain instead of diving into log files”
Ability to grab both Cluster and hypervisor stats and correlate the results.
Change color on the graphs to match your own personal preference. You can also export the
graphs to a csv or json file.
A slider coordinates all of the results for the time series selected. The exact metrics can be found
on the right-hand side of the graphs.
Cause and Resolution – depending on the alerts you will be presented with possible corrective
action to take to resolve the issue
Stats are saved for 90 days with no pruning. Very responsive, good time to pick out some pain
points with the customer. Typically other platform have high delay\response times.
22 Dell Demo Center – https://demos.dell.com | Dell Inc., 2016
Note: You can scroll down the centre pane to view all the charts, along with ability to remove a chart
you may not want to see. Move to the right pane and click on the x button on Cluster CPU Memory.
Click OK to confirm on the pop up message.
23 Dell Demo Center – https://demos.dell.com | Dell Inc., 2016
15. On the right hand pane we have a list of any Alerts, along with a link to the Cause and Resolution.
Note: you have a range picker at the top which allows you to look at a day’s view, a week’s view, or
even a month’s view to assist in isolating any pain points you might be having.
16. Next click on Storage from the pull down list on the far left of the main menu.
The Storage dashboard displays dynamically updated information about the storage configuration in a cluster.
24 Dell Demo Center – https://demos.dell.com | Dell Inc., 2016
This area is really like a stock ticker if you will and allows you to correlates events and alerts with any
performance metrics within the cluster and so regardless of the hypervisor we have the mechanisms
in place to pull the data off the hosts themselves and pick a serious of dates throughout the cluster.
Again a familiar view of Cluster IOPS, Cluster IO Bandwidth, Avg I/O latency. Move between the
Diagram view for storage summary (SSD/SATA Usage). The Table view illustrates a breakdown of
information of both container and storage pool.
Talking points
This is where you can configure your containers for compression and deduplication (note this is
not possible in the read only version of the demo available on demos.dell.com).
There is no limit on the amount of VM’s you can place on a container or how many containers you
can create.
25 Dell Demo Center – https://demos.dell.com | Dell Inc., 2016
3.1.3 Advanced talking points
3.1.3.1 Advanced Settings
Replication Factor
A good time to talk about the pitfalls of RAID:
Write penalties due to Parity
Degradation during rebuilds
RAID Controller being the bottleneck
Today’s large drives could take a week for a rebuild to occur
Compression
Nutanix utilizes algorithm from Google called Snappy. Snappy is a compression/decompression
library. It does not aim for maximum compression, instead, it aims for very high speeds and
reasonable compression so overhead is low.
MapReduce is used to spread out the load across the whole cluster to where there are no hot
spots.
Inline Dedupe for Performance
Fingerprints data on ingestion utilizing code from the Intel SHA extensions from the CPU. Later if
data in written again, Cache from RAM and SSD can hold more data logically for performance.
MapReduce for Dedupe
Leveraging MapReduce like compression, the virtual storage controllers reuse the fingerprints that
have already been calculated and dedupe the data. No data needs to be re-read for this to occur.
Dedupe is container-wide across the cluster.
26 Dell Demo Center – https://demos.dell.com | Dell Inc., 2016
Next click on Data Protection the pull down list on the far left of the main menu.
The Data Protection dashboard displays dynamically updated information about the data protection
configuration in a cluster.
27 Dell Demo Center – https://demos.dell.com | Dell Inc., 2016
In the table view, we can see a number of already created protection domains within the environment.
Talking points
A protection domain is a group of VM’s that you want to be able to protect. This can be done by
scheduling replication on the domain to other clusters or even snapshots for example.
Scheduling is very flexible with Nutanix, it can be done daily, weekly or even hourly if needed, along
with ad hoc.
Utilizing this feature you can have different SLA’s for different VM’s without having to set them up
on different data stores.
28 Dell Demo Center – https://demos.dell.com | Dell Inc., 2016
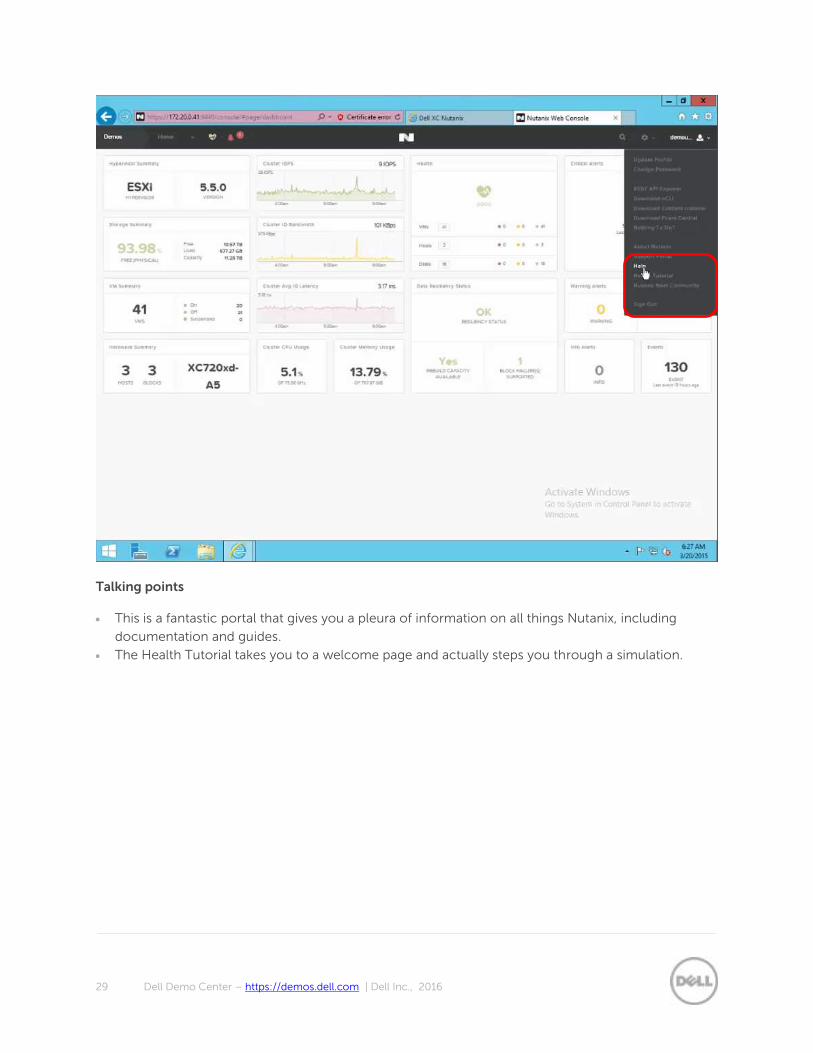
Finally one excellent resource within the Prism menu is the Help or Help Tutorial section. Move you
mouse to the demouser drop down menu and select Help.
29 Dell Demo Center – https://demos.dell.com | Dell Inc., 2016
Talking points
This is a fantastic portal that gives you a pleura of information on all things Nutanix, including
documentation and guides.
The Health Tutorial takes you to a welcome page and actually steps you through a simulation.
30 Dell Demo Center – https://demos.dell.com | Dell Inc., 2016
Since most people will come to Nutanix because of a storage issues, I wouldn’t spend a lot of time on
the remaining configuration options. I would briefly highlight:
Active Directory support via Authentication in this drop down menu gives the customer the ability
to add to an Active Directory farm or create a new directory.
Pulse: The feature is enabled by default and sends cluster status information automatically to
Nutanix customer support through customer-opened ports 80 or 8443. With this information
Nutanix can apply advanced analytics to optimize your implementation and to identify potential
problems. This allows the ability for phone home support and email support directly from Nutanix.
This only sends analytics back to Nutanix and no customer information.
Remote Support
Licensing: A good way to talk about some of the advanced features like VSS support, and Metro
availability.
Metro cluster is already available and can be used on ESXi. Good idea to mention. Some unique
features as synchronization over any L3 link (5ms RTT -> up to 400km). Virtually all other vendors
requires FC (dark fiber) and normally able to sync up to 120km only.
- Dell XC customers can use different Dell models in remote and local datacenter (we don’t
have a requirement to use identical hardware), or use Nutanix hardware in once DC and Dell
appliances in another.
3.1.4 Maintenance
Great time to talk about why operating in the user space is a must. Click on the cog Icon on the top
right hand side of the screen.
31 Dell Demo Center – https://demos.dell.com | Dell Inc., 2016
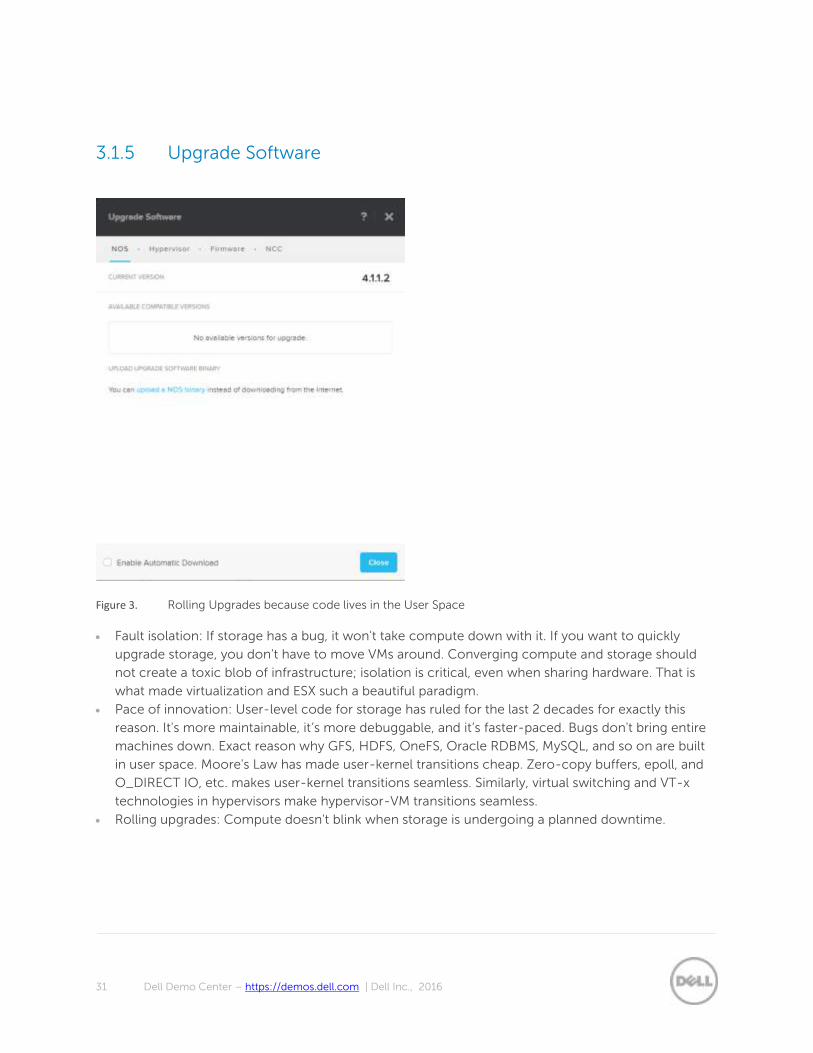
3.1.5 Upgrade Software
Figure 3. Rolling Upgrades because code lives in the User Space
Fault isolation: If storage has a bug, it won't take compute down with it. If you want to quickly
upgrade storage, you don't have to move VMs around. Converging compute and storage should
not create a toxic blob of infrastructure; isolation is critical, even when sharing hardware. That is
what made virtualization and ESX such a beautiful paradigm.
Pace of innovation: User-level code for storage has ruled for the last 2 decades for exactly this
reason. It's more maintainable, it’s more debuggable, and it’s faster-paced. Bugs don't bring entire
machines down. Exact reason why GFS, HDFS, OneFS, Oracle RDBMS, MySQL, and so on are built
in user space. Moore's Law has made user-kernel transitions cheap. Zero-copy buffers, epoll, and
O_DIRECT IO, etc. makes user-kernel transitions seamless. Similarly, virtual switching and VT-x
technologies in hypervisors make hypervisor-VM transitions seamless.
Rolling upgrades: Compute doesn't blink when storage is undergoing a planned downtime.
32 Dell Demo Center – https://demos.dell.com | Dell Inc., 2016
3.1.6 Automation
Anything that can be done in the UI can be automated with:
Nutanix CLI
PowerShell
Rest-API
Show them the Rest-API Explorer under the Admin section.
33 Dell Demo Center – https://demos.dell.com | Dell Inc., 2016
4 Conclusion
Management of most enterprise IT solutions is not simple, and not at all intuitive. Typically, this is a by-
product of management consoles and user interfaces designed with very little regard as to how users
interact with technology in the real world. A fresh approach to IT management is required.
Management tools should be simple and intuitive, yet powerful enough to support advanced feature
sets. Navigation must be tailored to fit the real-world workflows of datacenter managers to maximize
operational efficiency, and the overall user experience should match that of popular consumer products.
Prism is the Key to unlocking Opex inside of the modern datacenter.