Page 1
Democracy and economic crisis in Spain:
support, dissatisfaction, and disaffection*
Alberto Sanz,
Universidad Autónoma de Madrid
([email protected] ),
Rosa M. Navarrete,
Universität Mannheim and
Mannheimer Zentrum für Europäische Sozialforschung (MZES)
([email protected] ),
and
José Ramón Montero
Universidad Autónoma de Madrid
([email protected] )
* We would like to thank Angie Paula Ariza and Amaya Frades for their help in the
data analysis, to the Centro de Investigaciones Sociológicas (CIS) for its grant for
visiting its extraordinary Banco de Datos, to the Spanish Ministry of Economy and
Competitiveness for its financial support through the research project CSO2013-47071-
R, and to its principal investigator, Mariano Torcal, for his active involvement in the
three-wave panel survey CIUPANEL 2014 which we have used in this paper.
Paper presented for delivery at the at the Workshop on
What Citizens Want from Democracy:
Popular Attitudes to Existing Political Processes and Alternatives
Joint Session of Workshops, European Consortium for Political Research
Warsaw (Poland), 29th March-2nd April, 2015
Page 2
2
Abstract
This paper examines the impact of economic crisis on some relevant political attitudes
towards democracy in Spain, and its consequences in terms of support to established and to
new, emerging parties. We have selected three attitudes: democratic legitimacy or support for
democracy, political and economic discontent or dissatisfaction with the way democracy
works, and political disaffection. Our empirical research strategy included both time-series
and cross-section individual-level analyses over representative samples of Spanish citizens.
Over a period of thirty years, democratic legitimacy and satisfaction with the performance of
democracy, contrary to the mainstream literature in the field, showed to be independent
dimensions --the latter being strongly related to the economic conditions and the former
depending more on political factors. At the individual level, these attitudes proved to have an
impact on the citizens’ disaffection from the political system, as unemployment and opinions
on legitimacy, efficacy, and fairness of capitalism also had. Finally, attending to electoral
consequences, the paper illustrates how, in moments of economic and political crises,
dissatisfaction –but not disaffection-- is directly related to the increasing voting intention
enjoyed by Podemos, a populist left-wing new party, and to the probability of a serious
disruption of the Spanish party system.
Page 3
3
This paper explores the consequences of the economic crisis in some attitudes towards
democracy in Spain, one of the debtor countries. In Paul Krugman’s (2008) qualified words,
the crisis that began with the bankruptcy of the global financial firm Lehman Brothers in
2008 has been “a long, nasty, and brutish economic slump, … the worst recession in a quarter
of century”. The Great Recession brought in Spain a number of all-time records in increasing
figures for unemployment and public deficit, or in decreasing rates for GDP and capital
formation. Though Spain was not officially bailed-out by the European Stability Program,
both the incumbent socialist government in 2008 and the conservative government which
succeeded it in 2011 introduced a series of drastic austerity measures which included massive
lay-offs, salary cuts for public-sector employees, major tax increases, and extensive cuts in
every social policy, while at the same time negotiated with the EU generous bail-out
provisions for the financial system. The consequences have been devastating. Judged by their
self-proclaimed standards, austerity policies have been a spectacular failure: annual deficits
in the Spanish state budget increased from 4.5 percent of GDP in 2008 to 10.6 percent in
2012; the standing public debt has soared from 36.3 percent of GDP in 2007 to 84.2 percent
in 2012; and unemployment increase from a 8.3 percent in 2003 to a 25.8 percent in 2012.
Austerity policies have not only failed to restore the Spanish economy to health, but they
have also inflicted horrific social costs on already vulnerable sectors of society –in terms of
increasing poverty, producing inequality, and reducing the social-welfare policies and
economic growth of the previous three decades.
The consequences of austerity policies were also political. In a recently systematic
revision of popular reactions to the economic crisis, Nancy Bermeo and Larry M. Bartels
(2014) did show to some extent their surprise for the limited range of these reactions.
Whereas mainstream literature assumes that economic crises are both dramatic and
consequential in terms of citizens’ reactions, Bermeo and Bartels´ findings seem to be more
limited. As they (2014: 3, italics in the original) summarize them, “Voters did punish
incumbents, as predicted; but contrary to expectations, the cumulative potential of the Great
Recession was realized in only a few of the countries we studied… ; in most countries,
popular reactions to the Great Recession were surprisingly muted and moderate”. In
electoral terms, voters punished incumbents regardless their ideology and on the basis of
economic growth much more than unemployment rates (Bartels 2014). And in broader
political terms, austerity policies were contested by distinctive levels of protest mobilization
in the streets (Kriesi 2014).
Page 4
4
There are, however, other fields of citizen politics that might have received an impact
of the Great Recession and whose consequences are fairly unknown. True, Bermeo and
Bartels (2014: 3) emphasized that none of the cases analyzed in their book “suggests an
ideological sea change or even significant partisan realignments. Nearly all point instead to
impressive continuities with the past”. Yet political attitudes towards democracy were
apparently kept apart from their approach, and, for that matter, from those of many other
contributions that aim to expand the scope of issues potentially affected by the Great
Recession. Besides economic voting and protest mobilization, both political and economic
discontent is to be expected as a natural response to the austerity policies implemented by
governments. And something similar could be said of dissatisfaction with the way democracy
is working or the lack of confidence towards political institutions as the parliament playing a
major role in the economic measures against the recession. But, what if discontent,
dissatisfaction, and distrust reach historically high levels? Do they make any difference for
citizens’ relationships with the political system and more generally with politics? To what
extent could they significantly erode the sources of support for democracy in a given
country? Is there any chance that a profound disaffection with politics could be reinforced
even more by the combination of high levels of dissatisfaction and low doses of democratic
support?
In this paper we will answer these questions through a discussion of democratic
legitimacy, discontent or dissatisfaction with democracy, and political disaffection –three
political orientations that are usually taken as the most relevant attitudes for the relationship
between citizens and their polity or its political institutions. In the next pages we will try to
provide empirical evidence for the relationships between those three political orientations
through two research strategies. The first one consists in a longitudinal analysis of the
dimensions of satisfaction with democracy in Spain and democratic support among citizens.
We have chosen the period 1983-2014. This is justified by the necessity of having a period
long enough to include both wealthy moments and crisis periods, as well as governments
from different political parties with different parliamentary support. The second research
strategy consists in a series of multivariate, cross-section analyses of individual-level survey
data gathered in 2014. This design aims at identifying citizens’ profiles related to democratic
disaffection, lack of legitimacy, and political disaffection in critical moments for both the
Page 5
5
political system and the economic fabric. Our focus is on the relationship between out three
political orientations, and the extent to which they interrelate with attitudes towards
capitalism, on the one hand, and their joint consequences on party competition and the voting
choice.
We will develop our discussion along five sections. In the following one, we will
conceptualize those political attitudes, establish their relations, and include some contextual
data spanning over more than thirty years. In the second, we will examine the longitudinal
evolution of satisfaction and legitimacy, as well as their statistical association to economic,
political, and contextual factors. In the third, we will perform cross-section analyses of
satisfaction, legitimacy, and disaffection with survey data undertaken in 2014 as a function of
several individual characteristics. In the fourth, we will shortly explore the consequences of
those aforementioned attitudinal factors for the electoral support to different parties in
moments in which both most parties and the party system is experiencing major changes. The
sixth section concludes.
Three dimensions of attitudes toward democracy
Over the course of the 20th century a large number of democratic regimes have come into
existence, but many of them were incapable of surviving over the long term, while others
have functioned poorly. From Max Weber to the present day, many scholars have argued that
the legitimacy accorded to political institutions by citizens is an important dimension of
political systems, particularly in democracies, in which the mass public’s compliance with
government policies is not primarily dependent on coercion. And following David Easton’s
(1965) classical analysis of political life, it has often been argued that the stability of new
democratic systems may depend on the development of widespread mass-level support for
regimes, and that even in established democracies a reservoir of popular support may
facilitate governance and encourage popular compliance with government decisions
irrespective of the policy preferences of individual citizens (see also Gamson 1968).
How should popular support for democracy be conceptualized and operationalized in
empirical studies? As M. Stephen Weatherford (1992: 149) has argued, the literature on
democratic support is characterized by a remarkable gap between the relatively high level of
Page 6
6
theoretical development in normative political science, on the one hand, and the poverty of
the many empirical indicators that have been used in research on this subject, on the other.1 In
general, most published studies in this area of research share two characteristics. First, they
tend to assume that attitudes towards the political system constitute one single attitudinal
domain, including such seemingly distinct orientations as belief in the legitimacy of
democracy and satisfaction with the current performance of governmental institutions. Some
scholars (e.g., Fuchs 1993: 235-237) have contended that, although it is possible to
differentiate at the conceptual level between what Easton referred to diffuse and specific
support for the regime,2 it is not possible to operationalize this distinction and examine it
empirically. This is, they argue, for a variety of reasons; for instance, because Easton's
original conceptualization was too vague and confusing (Kaase 1988), because measurement
problems are "insuperable" (Loewenberg 1971), because the distinction is tautological (Craig
1993), or because citizens are simply not capable of distinguishing between them (Muller and
Jukam 1977).3
Second, many of these studies assume a close (if not deterministic) relationship
between citizens' levels of satisfaction with the performance of political institutions or the
economy, and support for the democratic regime per se. This question of whether citizens'
attitudes towards their governments and political regimes can be meaningfully separated into
such categories as specific and diffuse support, on the one hand, or are largely
undifferentiated, on the other, could be regarded as well within the realm of sterile academic
debate were it not for the fact that several scholars have asserted that regime support and its
1 Indeed, some assert that legitimacy is a value-laden concept whose very nature precludes analysis
using conventional indicators, or whose empirical operationalization is virtually impossible (Schaar
1981; O'Kane 1993).
2 As nicely described by Mishler and Rose (1999: 3), “Specific support... is the temporary and
relatively ephemeral acceptance or approval that individuals extend to a political object as a result of
its satisfaction of their specific demands.... Diffuse support, in contrast, is conceived as a deeper,
more enduring, and more generalized political loyalty resulting from early life political socialization.
As such it is conceived as immune to short-term inducements, rewards or performance evaluations."
Also see some recent empirical reformulations in Kornberg and Clarke (1992: ch.1), Norris (1999),
and Klingemann (1999).
3 In our view, this latter claim is patently incorrect. Citizens who have more or less recently
experienced a transition from a dictatorship are able to both distinguish between authoritarian and
democratic rule, and to separate their evaluations of system performance (satisfaction) from their
support for the current democratic regime (legitimacy); see Morlino and Montero (1995), and Rose,
Mishler and Haerpfer (1998: ch. 5).
Page 7
7
stability are highly contingent on popular satisfaction with the performance of governments
and, more broadly, democratic institutions (Weatherford 1987: 13; Fuchs, Guidorossi, and
Svensson 1995: 342). And given the findings of numerous studies that the level of
satisfaction with the performance of democracy is strongly associated with the degree of
satisfaction with the current condition of the economy, they assert that the prospects for
democratic stability and the very survival of these regimes may hinge on their capacity to
solve intractable economic problems (Przeworski 1991: 95).
As students of Spanish politics, we are fairly skeptical about the validity of those two
characteristics. Spanish democracy, after all, became consolidated at about the same time that
the economy was passing through a most severe economic crisis. Despite widespread
discontent resulting from the dislocation associated with economic restructuring, and from
unemployment rates that exceeded 20 percent, by the 1980s support for democracy in Spain
rose to levels comparable to other West European democracies and has remained solid ever
since despite continuing Basque terrorism, political scandals, and subsequent economic
difficulties –including those derived from the Great Recession. On the basis of these
suspicions, in the rest of this paper we undertake a systematic analysis of the nature of the
mass public's attitudes towards democratic politics in Spain over a period spanning three
decades. Our starting point is that these attitudes could not be regarded as constituting one
single dimension. Instead, three distinctly different dimensions could be clearly defined
conceptually and measured empirically: these are what we refer to as democratic legitimacy,
or diffuse system support (using Easton's [1965] terminology); performance satisfaction, or
its antonyms “dissatisfaction” or “discontent”; and a third set of attitudinal orientations that
can be regarded as part of a broad syndrome of political disaffection.
Regime legitimacy pertains to citizens' beliefs that democratic politics and
representative democratic institutions are the most appropriate (indeed, the only acceptable)
framework for government. Such beliefs should focus on the political regime in the
aggregate, and should be expected to be stable over time and immune from the
correspondence between the citizen's partisan preferences and the party of the incumbent
government. Democratic legitimacy is a relative concept; no system should be expected to be
fully legitimate in the eyes of each and every citizen, and the intensity of positive support for
these institutions varies from one person to another. Accordingly, legitimacy may be
considered to be “the belief that, in spite of shortcomings and failures, the political
Page 8
8
institutions are better than any others that might be established” (Linz 1988: 65; 1978a: 16).
This definition is also relative insofar as it refers to the belief that a democratic political
system is the “least bad” of all forms of government. As famously expressed by Winston
Churchill in his speech at the House of Commons, “Many forms of Government have been
tried, and will be tried in this world of sin and woe. No one pretends that democracy is
perfect or all-wise. Indeed, it has been said that democracy is the worst form of Government
except all those other forms that have been tried from time to time”.4 Otherwise said,
democratic legitimacy is ultimately based on “the belief that for that particular country at that
particular juncture, no other type of regime could assure a more successful pursuit of
collective goals” (Linz 1978b: 18).
In contrast, satisfaction with the performance of democracy, like Easton's concept of
specific support, is based on “peoples’ judgments about the day-to-day actions of political
leaders and the operation of governmental institutions and processes” (Kornberg and Clarke
1992: 20). It should thus be expected to fluctuate over time in accord with the government's
performance and the condition of the society and economy. And since it is focused on
partisan political leaders and the governments they lead, it would not be surprising to find
that, other things being equal, citizens supporting the same party as that of the incumbent
government would be more positive in their assessments than those who voted for the
opposition. Its more commonly used antonyms, political dissatisfaction or, to use still a
similar concept, political or economic discontent result from the government’s inability to
deal effectively with problems regarded by citizens as important (Dahl 1971: 144). And they
can be considered as expressions of displeasure resulting from the belief that the performance
of the government or political is falling short of the citizens’ wishes or expectations (Farah,
Barnes, and Heunks 1979); or as reflecting a frustration derived from comparing what one
has with what one hopes or expects to have (Gamson 1968).5
The third cluster of attitudes that we shall explore in this paper, political disaffection,
is conceptually distinct from both democratic legitimacy and political satisfaction, although it
is often indiscriminately lumped together with them. Following Giuseppe DiPalma (1970:
4 In Hansard, The Official Report, House of Commons, 5th Series, vol. 444, 11 November 1947.
5 For other enlightening discussions of satisfaction with the performance of democracy and/or
democratic institutions, see Anderson and Guillory (1997); Newton and Norris (2000), and Nadeau, et
al (2000).
Page 9
9
30), we regard political disaffection as a certain estrangement of members of the polity from
its core political institutions. This syndrome is characterized by a number of specific
symptoms including disinterest in politics, political inefficacy, cynicism and distrust, the
belief that political elites do not care about the welfare of their citizens, and a general sense of
detachment from the political system and/or its most relevant institutions. While this
syndrome shares with the dissatisfaction dimension a negative attitude towards politics, it is
different in one important respect: political dissatisfaction may be regarded as the result of a
discrepancy between generally positive expectations regarding the political system, on the
one hand, and a negative evaluation of the way it is currently functioning, on the other; in
contrast, political disaffection is a reflection of a fundamentally distrusting and suspicious
vision of political life. And unlike dissatisfaction (which should be expected to ebb and flow
in accord with current assessments of the performance of incumbents or democratic
institutions), attitudes of disaffection are likely to have been fixed at some stage of the
socialization process, and should subsequently be more resistant to change. In addition,
while dissatisfaction can be charged with a partisan component (with supporters of opposition
parties generally more critical of the performance of the government and dissatisfied with its
policy outputs than those who identify with the incumbent party), disaffection is more far-
reaching and indiscriminate in its objects of negativity (Torcal and Montero 2006).
In earlier empirical studies of Spain (Montero, Gunther, and Torcal 1997; Gunther,
Montero, and Torcal 2007), we found strong evidence that these three dimensions are
empirically distinct. Analyzing survey data in several different ways, we concluded that the
abstract conceptual distinctions described above are clearly reflected in Spanish citizens’
responses to the relevant questionnaire items over three decades. Table 1 and Figure 1
present two indicators that reflect basic perceptions of democratic legitimacy.6 In both cases,
democracy was overwhelmingly endorsed by citizens from the very beginning, and has
remained constant thereafter: between two thirds and more than three quarters of those
interviewed agreed with the statement affirming the superiority of democracy over any other
political system. The high level of support for democracy in 1978 probably reflects a
honeymoon effect, but from 1982 onwards a very high level of democratic legitimacy is fully
6 These items were, for Table 1, the agreement with the statement that “Democracy is the best form
of government for a country like ours”, and, for Figure 1, the choosing by respondents one option
among the followings: “Democracy is preferable to any other form of government; Under some
circumstances an authoritarian regime, a dictatorship, is preferable to a democratic system; [and] For
people like me, one regime is the same as another”.
Page 10
10
apparent. Figure 1 reveals the same pattern, strengthened now by evidence of the low levels
of support for non-democratic alternatives. The outgoing authoritarian elites played a positive
and constructive role in the transition to a democratic regime, as did prominent political elites
and organizations during the transition period: both did have a major impact on the political
attitudes of their respective sets of followers. The results was that the divide between the new
democracy vs. the old dictatorship did not emerge as a cleavage separating supporters of one
party from another, and a broad interparty consensus in support of democracy emerged.
Indeed, ever since by the 1980s, levels of support for democracy in Spain are
indistinguishable from those of other West European countries (Montero, Gunther, and
Torcal 1997: 129).
[Table 1 and Figure 1]
In contrast to the underlying continuity seen in these indicators of democratic
legitimacy, evaluations of the performance of the political system and its governing elites have
oscillated considerably over time. There are several different measures of performance, and all
were strikingly parallel to one another in their evolution over time regardless of the wording of
the questionnaire item. Whether the face content of the by now classical survey item focused
on satisfaction with “the way democracy is functioning in Spain”, or on a assessment of the
political or economic situation of the country, all measures of satisfaction were quite positive at
the time the new democracy was coming into existence around 1977 (Figures 2 and 3). They
all fell to a very low level in 1981 (which coincided with the depths of Spain's political and
economic crises, particularly evident in the high unemployment levels) (Figure 4); they all rose
to a peak around 1990 following nearly a decade of stable government and strong economic
growth, and declined again as a series of scandals beset the incumbent Socialist government
and the economy slid into recession in 1992 and 1993; they all then rose as the economy
recovered in the mid 1990s and went down once again after 2008 with the arrival of the Great
Recession. On the other hand, those measures on the performance of the economy almost
perfectly co-varied with the assessment of the political conditions. As would be expected,
dissatisfaction with the economic situation was strongest precisely at the worst moments of the
three recessions. But evaluations of the political conditions followed exactly the same pattern.
This convergence is particularly evident in the consequences of the austerity policies
implemented firstly by a socialist government in 2008 and above all by the conservative
government since 2011. Levels of dissatisfaction with the functioning of democracy and the
negative assessments of both the economic and political situations did reach extraordinarily,
Page 11
11
unprecedented high levels. In 2014, and for the first time in the last four decades, around 90
percent of Spaniards showed their discontent towards the economic and the political situation,
and 85 percent reported its dissatisfaction with the working of democracy. The sharp contrast
between the stability over time of attitudes pertaining to democratic legitimacy, on the one
hand, and the considerable fluctuation of satisfaction with the performance of the economy or
the incumbent government, on the other, provided prima facie evidence of the distinctiveness
of these attitudinal dimensions.
[Figures 2, 3, and 4]
Attitudes falling within the disaffection syndrome were also quite stable over this
same time period. In this section we will examine only two indicators of disaffection in
Spain: psychological involvement in politics and confidence in political institutions. Among
the different specific indicators of psychological involvement, the usual indicators are levels
of political interest (defined by the degree to which politics arouse a citizen’s curiosity) (Van
Deth 1990: 281 ff.) and frequency of political discussion (symbolized by the behavioral
expression of interest which crystallizes in informal political participation) (Topf 1995). Both
indicators provide a basic picture of attitudes of affection, perceptions of proximity, and
positive sentiments towards politics. In both cases, the Spanish data suggest the existence of
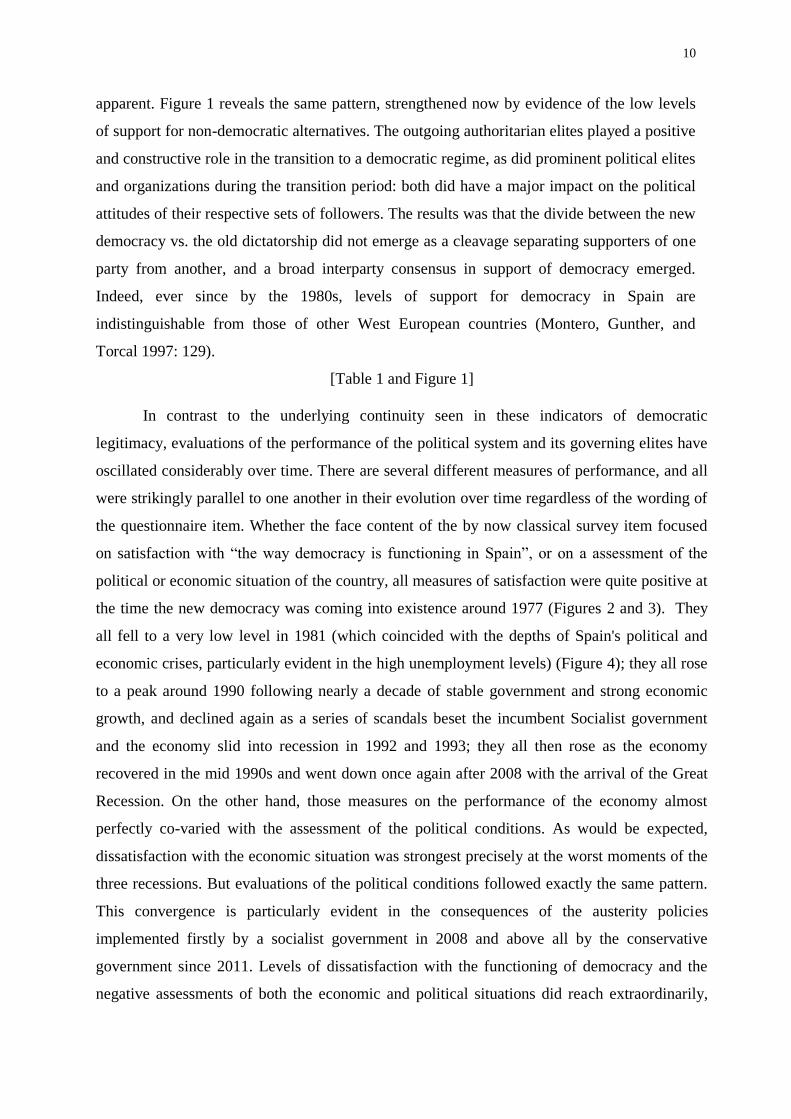
clear disaffection. As can be seen in Figures 5 and 6, levels of political interest and frequency
of political discussion have been extremely low despite the enormous political and
institutional changes witnessed over the last almost four decades. The final indicator is
confidence in political institutions, and more particularly in the Parliament. It follows similar
patterns (Figure 7): its level is also low, and has been decreasing even more during the Great
Recession. In short, the Spaniards’ levels of disaffection appear high. Their estrangement
from politics (expressed in low involvement and a basic distrust of political institutions) is
reinforced by other relevant attitudinal features, as their scant sense of both internal and
external political efficacy. These symptoms have remained stable over the last decades.
Unlike the indicators of dissatisfaction, measures of disaffection have not fluctuated in
parallel with the gigantic changes affecting social, economic, or political conditions of the
new democracy. Clearly, democratic legitimacy, political discontent, and political
disaffection are conceptually and empirically distinct from each other.
[Figures 5, 6, and 7]
Time series analysis, 1983-2014
Page 12
12
Research design, data and hypotheses
Longitudinal or time series analysis allows us to determine if the evolution of a specific
dependent variable is associated to the changes shown by a set of independent variables.
Given the continuous quantitative nature of our dependent variables, our time series models
have been formed using ordinary least squares. This method allows also a qualitative
interpretation of the model residuals7. Residuals express the variations in the studied
phenomena that escape from the theory implicit in the models. That is, atypical residuals
peaks point towards the existence of an exceptional event.
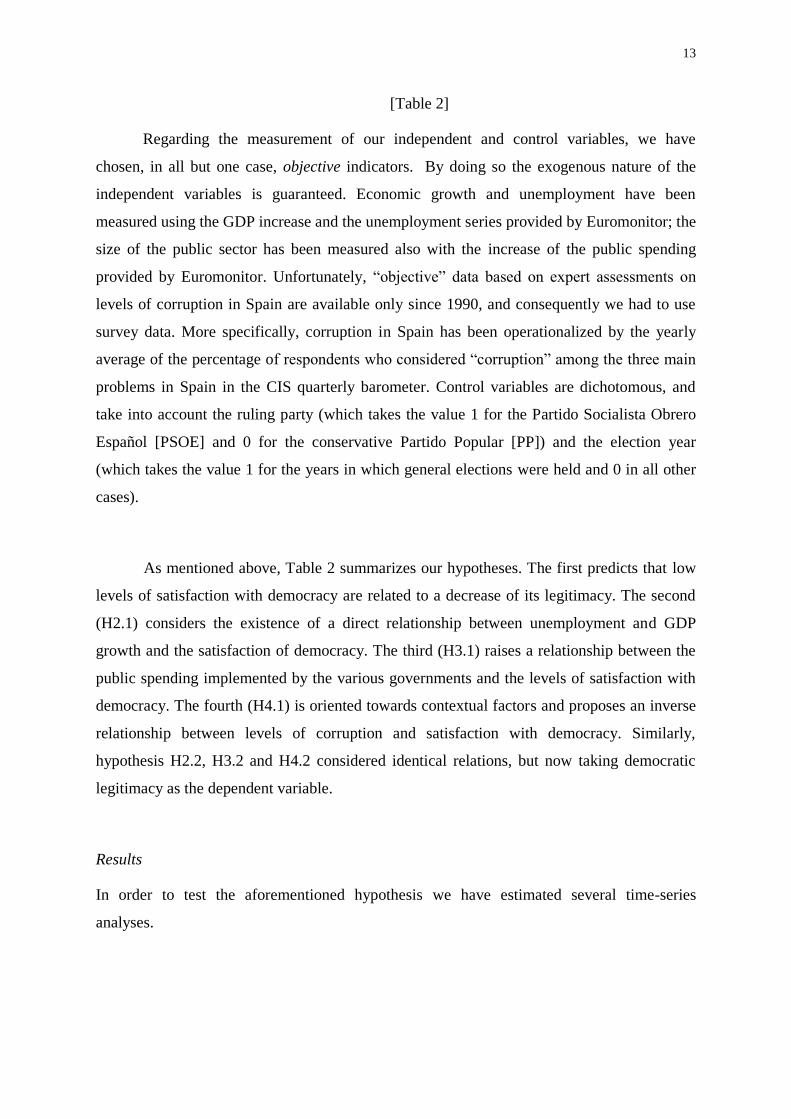
Figures 8, 9, and 10 reflect the evolution of our dependent variables along the period
between 1983 and 2014. Data was obtained from the Spanish Centro de Investigaciones
Sociológicas (CIS).8 Following Leonardo Morlino and Marco Tarchi (2006), we have
measured dissatisfaction with the percentage of those “not at all satisfied” with how
democracy works. Figure 8 shows that, starting from a baseline around 8 percent, levels of
dissatisfaction rose up to 16 per cent during the political and economic crises of the early
1990s, and up to 36 per cent in 2013. On the other hand, our second dependent variable has
been operationalized through the measurement of the percentage of those choosing the item
“in some circumstances, an authoritarian regime, a dictatorship, can be preferable to a
democratic system” against “democracy is preferable to any other form of government” or
“people like me doesn’t care about one or another regime”. As shown in Figure 9, the
eventual support to an authoritarian regime starts from values close to 12 percent in the
1980s, descends to 5 percent at the end of the 1990s and has grown slightly since then,
regaining the level of 8 percent in 2014. Its total variation range was 11 points. Figure 10
shows the covariation of both series. Results show the autonomy of legitimacy vis-à-vis the
fluctuation of dissatisfaction (with a correlation of .14, and a significance of .44): our first
hypothesis (as stated in Table 2) is greatly falsified.
[Figures 8, 9, and 10]
7 Residuals are computed as the difference between the observed (real) values of the dependent
variable and the predicted (or fitted) values by the model, at every time point.
8 Data on legitimacy for 2014 come from the third way of the CIUPANEL survey, directed by
Mariano Torcal and funded by the Spanish Ministry of Economy and Competitiviness (CSO2013-
47071-R).
Page 13
13
[Table 2]
Regarding the measurement of our independent and control variables, we have
chosen, in all but one case, objective indicators. By doing so the exogenous nature of the
independent variables is guaranteed. Economic growth and unemployment have been
measured using the GDP increase and the unemployment series provided by Euromonitor; the
size of the public sector has been measured also with the increase of the public spending
provided by Euromonitor. Unfortunately, “objective” data based on expert assessments on
levels of corruption in Spain are available only since 1990, and consequently we had to use
survey data. More specifically, corruption in Spain has been operationalized by the yearly
average of the percentage of respondents who considered “corruption” among the three main
problems in Spain in the CIS quarterly barometer. Control variables are dichotomous, and
take into account the ruling party (which takes the value 1 for the Partido Socialista Obrero
Español [PSOE] and 0 for the conservative Partido Popular [PP]) and the election year
(which takes the value 1 for the years in which general elections were held and 0 in all other
cases).
As mentioned above, Table 2 summarizes our hypotheses. The first predicts that low
levels of satisfaction with democracy are related to a decrease of its legitimacy. The second
(H2.1) considers the existence of a direct relationship between unemployment and GDP
growth and the satisfaction of democracy. The third (H3.1) raises a relationship between the
public spending implemented by the various governments and the levels of satisfaction with
democracy. The fourth (H4.1) is oriented towards contextual factors and proposes an inverse
relationship between levels of corruption and satisfaction with democracy. Similarly,
hypothesis H2.2, H3.2 and H4.2 considered identical relations, but now taking democratic
legitimacy as the dependent variable.
Results
In order to test the aforementioned hypothesis we have estimated several time-series
analyses.
Page 14
14
On Dissatisfaction. Figure 11 shows the evolution of three series: The actual levels of
dissatisfaction, the predicted (or fitted) values of dissatisfaction from our regression model,
and the residuals (or the differences between the two previous series). As already mentioned,
analysis of these residues can be useful to identify “atypical” oscillations.9 In the case of
dissatisfaction, both the R2 coefficient and the figure of observed and predicted values
confirm the good fit of the data to the model proposed for dissatisfaction.
[Figure 11]
Table 3 shows the regression coefficients for dissatisfaction, in which economic
factors are relevant. Discontent significantly grows whenever unemployment or GDP
decrease. Both findings confirm hypothesis H2.1. In contrast, annual variations in public
spending growth are unrelated to dissatisfaction levels, falsifying hypothesis H3.1 Among
contextual factors, dissatisfaction increases significantly when corruption is perceived as one
of the main problems of Spain, which confirms H4.1. But it was not so with the other control
variables. Neither the color of the party in government nor the celebration of elections in a
given year appear to be associated with variations in the levels of discontent .
[Table 3]
On the preferences for an authoritarian regime. According to models 2, 3, and 5 in
Table 4, higher unemployment increases are associated with increases in the preferences for
an eventual authoritarian regime. This is not the case for GDP growth. This mixed evidence
weakens the relevance of the economic context pointed in H2.2. Attending to the factors
related to public policy, an increase in the public spending is significantly related to an
increase in the support to an authoritarian regime. This –counterintuitive- result contradicts
H3.2. In the same line, the relationships between corruption and legitimacy is also direct but
not robust across different model specifications, and the same is true for the fact of being
governed by PSOE. These mixed results call for a more detailed analysis of legitimacy
within the PP and PSOE voters.
[Table 4]
9 Peaks in the residual series indicate specific moments in which levels of dissatisfaction (later, legitimacy) are
not adequately predicted by the factors considered in the model. Usually these peaks in the residuals coincide
with specific moments with exceptional circumstances.
Page 15
15
On the preferences over an authoritarian regime within the PSOE and PP voters. During
the transition to democracy, levels of democratic support were unevenly distributed among
voters (and also among leaders) for the main political parties. This support was quite high
among left-wing voters for Partido Comunista de España (PCE) and PSOE, and decreased for
Unión de Centro Democrático (UCD) centrists and, specially, for the very conservative voters
of Alianza Popular (AP) (Linz et al. 1981; Morlino and Montero 1995; Gunther and Montero
2001). After 1985, party electorates still hold distinctive patterns (Figure 12). Preferences for
an authoritarian regime were low and constant for PSOE voters (with an average of 5, and a
standard deviation of 1.5), and much higher and particularly more volatile for PP supporters
(average, 17, standard deviation, 10).
[Figure 12]
How to explain these differences? Results for PP voters can be found in Models 5 and
6 of Table 4. For them, economic factors seem to play again a role. Unemployment shows a
direct and significant relationship with support to an authoritarian regime, while GDP growth
is not statistically significant; both variables, however, point in the same direction. Public
expenditure shows a remarkable and robust relationship: the higher the public spending, the
greater the conservative voters’ support to an eventual authoritarian regime. Contextual
factors are interesting. Holding of elections and corruption levels show inconsistent or null
relationships. But, when the PSOE is in government, then a strong and significant increase in
support to authoritarian regime occurs, increasing by an average of 8 percentage points.
Figure 13 shows the observed and predicted values of legitimacy of democracy among PP
voters. The model fit is remarkable, capturing correctly 70 per cent of the variation of the
support to authoritarian regimes among the PP voters.
[Figure 13]
It seems that, following Anderson et al. (2005), conservative voters would condition
their support for democracy to their electoral fortunes and to the economic policies at play.
Their attitudes towards democracy seem to reflect a remarkable instrumental component.
They support democracy when AP and later PP, their parties, are in the government and
public spending is low; and they question democracy if spending increases or PP have to stay
in the opposition.
Page 16
16
Citizens and democracy
In the early 2000s, several cross-section analyses examining the basic perceptions of
democracy in Spain reached the conclusion that satisfaction with democracy, legitimacy, and
disaffection were rather independent among them (Montero, Sanz, and Navarrete
forthcoming). But the political and economic situation has profoundly changed in 2014. As
we already know, political and economic discontent as well as dissatisfaction with the way
democracy works were all-time record for the whole democratic period. Can we expect any
correlative changes in the attitudes towards democracy of Spanish citizens? Paying attention
to some significant changes in the political context –as for instance the entry of two new
parties into the party system and the punishment afflicted to the two major parties--, it is clear
that Spanish democracy is now confronting different challenges.
The slogan “No nos representan” –that can be translated as “They do not represent
us”-- summarizes the feeling of those electors who are switching their preferences to new
political entrepreneurs and their corresponding parties who are taking advantage of the
sustained economic recession and the political discontent. Criticisms against Spanish
democracy have come hand by hand with less disaffection. For instance, the percentage of
those who never or almost never discuss politics has been dramatically reduced. Changes like
this call for an assessment of the determinants of political attitudes towards democracy amid
the Great Recession. To do so, we will test how satisfaction with democracy, democratic
legitimacy and political disaffection interrelate, and how political, social, and economic
factors affect these three attitudinal dimensions. We will use data from the CIUPanel, and
more particularly from its third wave, undertaken in December 2014 and with a sample of
2,563 respondents. By then, Podemos (We Can), a left-wing, populist new party, has made a
surprising entry at the European Elections with eight MEPs and became unexpectedly soon
the very first party in vote intention, leaving behind the conservatives of PP and the socialists
of PSOE.10
Does the emergence of this new party mean a change in the relations between
democratic discontent, legitimacy and disaffection? How does this affect attitudes towards
democracy? Is there any change in the role played by democracy concerning vote choice?
Our expectations are summarized in Table 5. We expect the three dimensions of
attitudes towards democracy to show certain level of autonomy. Concerning the impact of
10
According with the CIS Barometer, survey 3050, January 2015, accessible at
http://www.cis.es/cis/opencm/ES/1_encuestas/estudios/ver.jsp?estudio=14141.
Page 17
17
economic factors on these attitudes, we also expect them to have a higher effect on the most
unstable attitudes, i.e., on satisfaction with democracy, compared to the effect on the other
two (H2). We assume that political participation (conventional or unconventional) would
have a distinctive role to each dimension. Those who participate more actively would be
more satisfied with democracy (H3), would prefer democracy over other regimes (H4), and
would be less disaffected towards politics (H5). As the consequences of the economic crisis
are affecting citizens with different social profiles, we expect younger citizens to be more
discontent with democracy (H6), significantly indifferent to the political regime (H7), and
more disaffected than critical (H8). Finally, those who voted for the incumbent government
would feel better represented and would be significantly satisfied with democracy (H9); they
would also think that democracy is the best political system (H10) and would be less
disaffected and less critical towards democracy (H11). By testing these hypotheses we will be
in condition to define citizens’ individual profiles in the context of an economic crisis that
has contributed to a serious disruption of the Spanish party system.
[Table 5 ]
For testing these hypotheses we have estimated three different models for each of our
dependent variables. For satisfactions with democracy, measured for 2014 as a dichotomous
variable in which 0 means dissatisfied and 1 is satisfied with democracy, we ran binomial
logistic regressions. In the case of legitimacy, we ran multinomial regressions since our
dependent variable had three categories: democracy is best (used as reference category),
sometimes an authoritarian regime, indifferent to regimes. The third dependent variable,
disaffection, was computed as a continuous one, so in this case we ran lineal regression
models. Disaffection is measured as the interaction of political interest and confidence
towards political institutions. In its turn, confidence is the resulting variable of a principal
component analysis of the variables measuring confidence in the Spanish Parliament, in
Spanish politicians and in Spanish political parties. The definition of disaffection used here
follows the typology of citizens described in José Ramón Montero, Alberto Sanz, and Rosa
M. Navarrete (forthcoming). According to their typology, citizens can be classified based on
their political interest and confidence in political institutions. The label of cives is defined as
those who combine high levels of both interest and confidence; on the opposite side, the
disaffected are those with low interest and low confidence. The other two combinations refer
Page 18
18
to critical (high interest and low confidence) and deferent citizens (high confidence and low
interest). In tis section, we will solely focus on critical and disaffected attitudes.
Satisfaction with democracy
Models of satisfaction with democracy can be found in Table 6. The first remarkable result is
that satisfaction seems to be independent from legitimacy, and to some extent related to
disaffection: the more disaffected or the more critical citizens may be, the more chances they
have to be dissatisfied with how democracy works. On the economic side, poor evaluations of
the national economy are related to political discontent. Unconventional participation –but
not turnout- is also related to dissatisfaction with democracy. Regarding other socio-
demographic an attitudinal factors, age and education level are not associated to higher or
lower levels of dissatisfaction as neither is left-right ideology. Finally, a higher degree of
religiosity is associated to greater chances of being satisfied with democratic performance in
Spain.
[Table 6]
Legitimacy
As anticipated by the results in the time-series analyses, support for authoritarian regimes is
independent from satisfaction with democracy and from political disaffection (Table 7). All
other factors constant, the profile of those supporting an authoritarian regime is that of a
person with low social trust, older than those supporting democracy, with low propensity to
participate in demonstrations, with a relative more conservative ideology, higher chances to
vote for PP and maintaining a positive evaluation of the economic situation in Spain. Given
the low variability of legitimacy across Spanish citizens, the model fit for legitimacy is
clearly the lower of the three attitudes considered in this section.
[Table 7]
Disaffection
The results for disaffection can be found in Table 8. The probability of being
a critical or disaffected citizen in Spain is inversely related to both satisfaction with
democracy and democratic legitimacy. And the economy also plays a role: the better the
Page 19
19
assessment on the economy, the higher the probability of being critical or disaffected. On the
other hand, it is remarkable that being unemployed –and to some extent alienated from the
labor market-- is associated also with higher probability of being disaffected from the
political sphere, but not to hold critical attitudes. Religiosity, a conservative ideology, social
trust, age, and unconventional participation are inversely related to both dimensions, while
conventional participation is inversely related only for that of disaffection.
[Table 8]
Citizens, democracy, and the economic system
To what extent political legitimacy is linked to beliefs in the legitimacy of the economic
system? There is not much information about the connections between these two fields, and
the literature is remarkably scarce.11
Obviously, the Spanish case after the Great Recession is
particularly interesting since, given its longstanding consequences in terms of unemployment,
inequality, impoverishment, and drastic reductions in welfare policies, the failure of the
political system could be directly connected by citizens to an extremely negative performance
of the economic system. Can we therefore expect an impact of perceptions on the economic
system on attitudes towards democracy?
In this section we analyze whether attitudes towards capitalism are affecting those
towards democracy. Also, we will check whether assessments on the economic system have
an impact on citizens’ political discontent, democratic legitimacy, and disaffection. The
relevance of this analysis lays on their apparent interdependency. We have repeated our
analysis by using the same dependent variables that were discussed in the previous section,
and adding three more independent variables: capitalist legitimacy12
, capitalist efficacy,13
and
11
Juan J. Linz has been one of the few in analyzing with survey data those relationships; see his
chapter, “Legitimacy of Democracy and the Socioeconomic System”, in Mattei Dogan, ed.,
Comparing Pluralist Democracies: Strains on Legitimacy (Boulder, Colorado: Westview Press,
1988), pp. 65-113. 12
Capitalist legitimacy is a dichotomous variable, in which respondents were asked whether they
agree or not with the statement that “the capitalist economy of free initiative is the best economic
system for our country”.
13
Respondents answered if they agreed with the statement that “the capitalist economy of free
initiative allows citizens of this country to solve their problems”.
Page 20
20
capitalist fairness.14
We have estimated two models. One model includes those attitudes
towards democracy that are not acting as dependent variable and the three variables related to
the economic system; the second model includes these two groups of independent variables,
the assessment of economy –a variable that has confirmed to have a relevant effect on
democratic discontent and disaffection--, and left-right ideology, which has been statistically
significant in the previous analyses of the three political attitudinal dimensions.
In Table 9, attitudes towards capitalism have a significant impact on satisfaction with
democracy. Legitimacy, efficacy, and fairness of the capitalist system have a positive effect,
what leads us to consider there that citizens seem to perceive political and economic systems
as if they were the two sides of the same coin. Comparing the two models, the main
difference is the decrease on the goodness of fit of the second model. Ideology and
assessment of the economic situation made no contribution to the understanding of
satisfaction with democracy when controlling by attitudes towards the capitalist system.
Because the fairness of the capitalist system has five categories and rising one level on the
perceived fairness of capitalism increases satisfaction with democracy more than half a point,
this is clearly the factor with a higher impact. In short, maintaining all other variables
constant, those who consider capitalism as a very fair system will add more than 2 points on
satisfaction with democracy than those who consider capitalism as very unfair. In what
respects to democratic attitudes, results are comparable to those obtained in the previous
section with the preference for political regimes as non significant, and disaffection with a
negative significant effect.
[Table 9]
Results for democratic legitimacy shown in Table 10 are quite different. They
highlight the autonomy of political discontent vis-à-vis preferences for political regimes. On
the contrary, disaffection is a factor tied to indifference towards political regimes. Here,
assessment of economy and ideology play a relevant role, especially for those who sometimes
would prefer an authoritarian regime over a democratic one: the more to the right, the more
authoritarian or indifferent towards regimes. Also, positive assessments of economy are
related to the eventual preference of an authoritarian regime over a democratic one.
[Table 10]
14
Respondents had to answer whether they considered the economic system to be very unfair, rather
unfair, nor unfair neither fair, rather fair, and very fair.
Page 21
21
Finally, critical and disaffected citizens are affected by perceptions over the efficacy
and fairness of the economic system (Table 11). As it could be expected, those who answered
that capitalism can solve citizens’ problems tend to be less disaffected or critical, as is the
case of those who believe on the fairness of the economic system. The legitimacy of
capitalism, however, has no effect on disaffection. Adjustment of models improves slightly
when including assessment of economy and ideology. These variables are also significant and
work similarly to the case of legitimacy: the more to the right and the more optimist an
assessment of the economy, the less disaffected or critical. Concerning attitudes towards
democracy, when compared the models of the previous section to these, the impact of
satisfaction with democracy, support to an eventual authoritarian regime, and indifference
towards regimes decrease when attitudes towards capitalism are included in the model. It has
to be highlighted that the coefficients for “sometimes authoritarian” and “indifferent towards
regimes” increase when ideology and assessment of the economy are included in the model;
they change from 0.722 to 0.895 in the case of the critical citizens, and from 0.560 to 0.711
for the disaffected ones. Thus, attitudes towards capitalism may push the effect of legitimacy
on disaffection.
[Table 11]
In our previous longitudinal analysis we observed that attitudes towards democracy
work in a distinctive manner to PSOE and PP voters. In this section we discussed the extent
to which attitudes towards the existing economic system affects democracy. The European
financial crisis has open a major debate about the way the economic system is interfering
with the sovereignty of the countries and how economic powers are winning the battle to the
political ones. This discussion is much more intense in countries that had to confront a bailout
or had to implement austerity, unpopular measures that, in some cases, directly come from
Brussels. This is the case of Spain. In the next section we analyze to what extent attitudes
towards democracy and capitalism play a role on the voting choice.
Democracy, the economic system, and the voting choice
The decrease on the support for the two major parties in Spain was not just an expression of
protest of those more affected by economic constraints, but also a challenge to the existing
political and economic systems. Is voting intention affected by citizens’ assessments over the
democratic and economic systems? Can we point at some profiles of those voting for each of
Page 22
22
the three most important national parties if attitudes towards democracy and capitalism are
include into the models?
We conducted an exploratory analysis of vote in late 2014 to answer these questions.
We ran linear regressions with the probability to vote for each of four parties selected (PP,
PSOE, Izquierda Unida [IU, a coalition between PCE and some minor left-wing parties], and
Podemos) as dependent variables15
. We did run three models. The first one includes only
attitudes towards democracy; perceptions over the economic system are included in the
second model, and, finally, age and ideology are added in the third model. This way we can
trace the profiles of those who have a major sympathy or a higher propensity to vote to these
parties.
[Table 12]
The results are included in Table 12. The PP is clearly the party with the highest variance
explained by our models; this means that our models are better equipped at predicting the
vote for this party. These models have a worse performance when the dependent variable is
any of the other three parties, perhaps because their potential voters belong all to the left and
therefore have pretty similar attitudes towards the political system and towards capitalism.
Looking more carefully, results for Podemos antagonize with those for PP. Those with a
higher propensity to vote for PP are the most satisfied with democracy, the only ones who
show a significant preference for an eventual authoritarian regime, and a strong support for
capitalism. On the other hand, those who sympathize with Podemos are the most discontented
with democracy and the most critical against capitalism. They are also the youngest and more
leftists. Podemos is the only party in which disaffection has no effect, while on the other three
parties the impact of disaffection is remarkably negative. Instead, this short analysis does not
seem to satisfactorily explain voting for the PSOE. The party is supported by individuals with
a similar profile to that of Podemos sympathizers. Alas, the third model, the one with a better
adjustment, explains only 18 percent of the probability of voting for PSOE, while the
percentage of variance predicted in the case of the PP is higher than 51 percent, and 26
percent in the case of Podemos.
[Table 12]
15
The probability of voting for each party goes from 0 (not at all likely) to 10 (very likely).
Page 23
23
Conclusion
We began this paper by asking the impact of the Great Recession on political attitudes
towards democracy in Spain. In order to answer this question we have firstly discussed the
concepts of support for democracy or democratic legitimacy, political and economic
discontent or dissatisfaction with the way democracy works, and political disaffection. Tough
these three attitudes belong to a broader field that houses many political orientations towards
political systems, at the same time are quite different concepts that, once correctly
operationalized, measure different attitudes. Thus, contrary to mainstream literature in the
field, our analysis has shown that they differ both conceptually and empirically. Among
them, dissatisfaction with democracy is the one showing larger variability in recent Spanish
democratic history. In contrast, legitimacy and disaffection were characterized by their great
stability over the past three decades. When we explored through longitudinal, time-series
analyses the impact of political and economic changes on dissatisfaction and preferences for
an authoritarian regime, each one responded in an idiosyncratic way. On one hand,
dissatisfaction proved to be sensitive to the deterioration of the economic situation; on the
other, support for democracy appeared linked to political factors. More specifically, the
eventual support for an authoritarian regime is more prevalent among PP voters than on those
who vote for the PSOE. Additionally, it seems that to some extent conservative voters
condition their support for democracy to the economic policies implemented and also to the
electoral fortune of their party: in the moments when PSOE is in government they increase
their support for authoritarian regimes in an average of 8 percentage points.
On the second part of our paper we have paid attention to cross-section survey data
gathered in late 2014, in a moment combining huge levels of dissatisfaction and disaffection
with the first signs of a serious party system change after the entry of new parties at the
occasion of the elections to the European Parliament held in May 2014. Current political
situation cannot be understood without looking carefully to what led citizens to distrust the
two major parties. We have examined a number of variables affecting those attitudes toward
democracy what affects attitudes towards democracy; to the usual set of economic, social,
and political factors, we have also included variables related with the economic system. We
found there are interesting –and not very often explored-- relationships between assessments
of capitalism and attitudinal dimensions of democracy. Finally, those relations are also
relevant for explaining some features of party competition and voting choice. While potential
Page 24
24
voters for PP and Podemos exhibit antagonistic profiles, PSOE and Podemos seem to
compete for a very similar electorate in terms of ideology, but much less so in terms of
attitudes towards both the economic and political systems.
References
Anderson, Christopher J., and Christine A. Guillory. 1997. “Political Institutions and
Satisfaction with Democracy: A Cross-National Analysis of Consensus and Majoritarian
Systems”. American Political Science Review 91: 66-81.
Bartels, Larry. 2014. “Ideology and Retrospection in Electoral Responses to the Great
Recession”, in L. Bartels and Nancy Bermeo, eds., Mass Politics in Tough Times. Opinions,
Votes, and Protest in the Great Recession. Oxford: Oxford University Press.
Bermeo, Nancy, and Larry M. Bartels. 2014. “Mass Politics in Tough Times” in L. Bartels
and N. Bermeo, eds., Mass Politics in Tough Times. Opinions, Votes, and Protest in the
Great Recession. Oxford: Oxford University Press.
Craig, Stephen C. 1993. The Malevolent Leaders: Popular Discontent in America. Boulder,
CO: Westview Press.
Dahl, Robert A. 1971. Polyarchy. New Haven: Yale University Press.
Di Palma, Giuseppe. 1970. Apathy and Participation. Mass Politics in Western Societies.
New York: Free Press.
Easton, David. 1965. A Systems Analysis of Political Life. Chicago: University of Chicago
Press.
Farah, Barbara G., Samuel H. Barnes and Felix Heunks. 1979. “Political Dissatisfaction”, en
Samuel H. Barnes, Max Kaase et al., Political Action. Mass Participation in Five Western
Democracies. Beverly Hills: Sage.
Fuchs, Dieter. 1993. “Trends of Political Support in the Federal Republic of Germany”, in D.
Berg-Scholosser and R. Rytlewski, eds., Political Culture in Germany. New York: St.
Martin’s Press.
Fuchs, Dieter, Giovanna Guidorossi, and Palle Svensson. 1995. “Support for the Democratic
System”, in Hans-Dieter Klingemann and Dieter Fuchs, eds., Citizens and the State. Oxford:
Oxford University Press.
Page 25
25
Gamson, William A. 1968. Power and Discontent. Homewood, Ill.: Dorsey Press.
Gunther, Richard, and José Ramón Montero. 2001. “Die Multidimensionalität der
Einstellungen zur Demoktratie: Das Beispiel Spanien”, in Marcus Gräser, Christian Lammert
and Söhnke Schreyer, eds., Staat, Nation, Demokratie. Traditionen und Perspektiven
moderner Gesellschaften. Fetschrift für Hans-Jürgen Puhle. Gotinga: Vandenhoeck &
Ruprecht.
Gunther, Richard, José Ramón Montero, and Mariano Torcal. 2007. “Democracy and
Intermediation: Some Attitudinal and Behavioral Dimensions”, in R. Gunther, J. R. Montero,
and Hans-Jürgen Puhle, eds., Democracy, Intermediation, and Voting on Four Continents.
Oxford: Oxford University Press.
Kaase, Max. 1988. “Political Alienation and Protest” in Mattei Dogan, ed., Comparing
Pluralist Democracies: Strains on Legitimacy. Boulder and London: Westview Press.
Klingemann, Hans-Dieter. 1999. “Mapping Political Support in the 1990s: A Global
Analysis”, in Pippa Norris, ed., Critical Citizens: Global Support for Democratic
Governance. Oxford: Oxford University Press.
Kornberg, Allan, and Harold D. Clarke. 1992. Citizens and Community: Political Support in
a Representative Democracy. Cambridge: Cambridge University Press.
Kriesi, Hanspeter. 2014. “The Political Consequences of the Economic Crises in Europe:
Electoral Punishment and Popular Protest”, in Nancy Bermeo and Larry M. Bartels, eds.,
Mass Politics in Tough Times. Opinions, Votes, and Protest in the Great Recession. Oxford:
Oxford University Press.
Krugman, Paul. 2008. “Let’s Get Fiscal”. The New York Times¸ October 16, 2008.
Linz, Juan J. 1978a. “Crisis, Breakdown and Reequilibration”, in Juan J. Linz and Alfred
Stepan, eds., The Breakdown of Democratic Regimes. Baltimore: Johns Hopkins University
Press.
- 1978b. “Legitimidad y eficacia en la evolución de los regímenes políticos”, in Problemas
del subdesarrollo. Granada: Caja General de Ahorros y Monte de Piedad de Granada.
- 1988. “Legitimacy of Democracy and the Socioeconomic System”, in Mattei Dogan, ed.,
Comparing Pluralist Democracies: Strains on Legitimacy. Boulder and London: Westview
Press.
Page 26
26
Linz, Juan J., Manuel Gómez-Reino, Francisco Andrés Orizo and Darío Vila. 1981. Informe
sociológico sobre el cambio político en España, 1975-1981. Madrid: Fundación FOESSA.
Loewenberg, Gerhard. 1971. “The Influence of Parliamentary Behavior on Regime Stability”.
Comparative Politics 3: 170-95.
Mishler, William, and Richard Rose. 1999. “Learning Democracy: The Dynamics of Popular
Support for Post-Communist Regimes”. Paper presented at the Annual Meeting of the
American Political Science Association, Atlanta, Georgia, September 1999.
Montero, José Ramón, Richard Gunther, and Mariano Torcal. 1997. “Democracy in Spain:
Legitimacy, Discontent and Disaffection”. Studies in Comparative International
Development 32,:124-160.
- 1998. “Actitudes hacia la democracia en España: legitimidad, descontento y desafección”.
Revista Española de Investigaciones Sociológicas 83: 9-49.
Morlino, Leonardo, and José Ramón Montero. 1995. “Legitimacy and Democracy in
Southern Europe”, in Richard Gunther, P. Nikiforos Diamandouros and Hans-Jürgen Puhle,
eds., The Politics of Democratic Consolidation. Southern Europe in Comparative
Perspective. Baltimore: Johns Hopkins University Press.
Morlino, Leonardo, and Marco Tachi (2006). “The Dissatisfied Society: The Roots of
Political Change in Italy”. European Journal of Political Research 30(1): 236-259.
Muller, Edward. W., and Thomas O. Jukam. 1977. “On the Meaning of Political Support”.
American Political Science Review 71: 1561-1595.
Nadeau, Richard, André Blais, Neil Nevitt, and Elisabeth Gidingil. 2000. “Elections and
Satisfaction with Democracy”. Paper presented at the Annual Meeting of the American
Political Science Association, Washington, D.C.
Newton, Kenneth, and Pippa Norris. 2000. “Confidence in Public Institutions: Faith, Culture
or Performance?”, in Susan J. Pharr and Robert D. Putnam, eds., Disaffected Democracies:
What’s Troubling the Trilateral Countries? Princeton: Princeton University Press.
Norris, Pippa, ed. 1999. Critical Citizens: Global Support for Democratic Government.
Oxford: Oxford University Press.
O’Kane, Rosemary M.T. 1993. “Against Legitimacy”. Political Studies 93: 471-487
Page 27
27
Przeworski, Adam. 1991. Democracy and the Market: Political and Economic Reforms in
Eastern Europe and Latin America. Cambridge: Cambridge University Press.
Rose, Richard, William Mishler, and Christian Haerpfer. 1998. Democracy and its
Alternatives: Understanding Post-communist Societies. Baltimore: John Hopkins University
Press.
Schaar, John, ed. 1981. Legitimacy in the Modern State. New Brunswick, NJ: Transaction
Books.
Topf, Richard. 1995. “Beyond Electoral Participation”, in Hans-Dieter Klingemann and
Dieter Fuchs, eds., Citizens and State. Oxford: Oxford University Press.
Torcal, Mariano, and José Ramón Montero. 2006. “Political Disaffection in Comparative
Perspective”, in M. Torcal and J. R. Montero, eds., Political Disaffection in Contemporary
Democracies. Social Capital, Institutions, and Politics. London: Routledge.
Van Deth, Jan W. 1990. “Interest in Politics”, in Karlheinz Reif and Ronald Inglehart, eds.,
Eurobarometer: The Dynamics of European Public Opinion. Londres: Macmillan.
Weatherford, M. Stephen. 1987. “How does Government performance influence political
support?”. Political Behavior. 9:5-28.
- 1992. “Measuring Political Legitimacy”. American Political Science Review 86: 149-166.
Page 28
28
Figure 1. Evolution of democratic legitimacy in Spain, 1979-2013 (in percentages)
Sources: Banco de Datos del Centro de Investigaciones Sociológicas (CIS) and Data for those surveys with asterisks.
0
10
20
30
40
50
60
70
80
90
100
19
79
*
19
80
19
85
19
86
19
87
19
88
19
89
19
90
19
91
19
92
19
93
19
95
19
96
19
97
19
98
20
00
20
01
20
02
20
03
20
04
20
05
20
06
20
07
20
08
20
09
20
10
20
12
20
13
Democracy is preferable to any other kind of government
In some circumstances a non-democratic form of government is preferable
For people like me, it does not matter whether we have a democratic or a non democratic regime
Page 29
29
Figure 2. Dissatisfaction with democracy and negative assessments of the economic situation, 1983-2014 (in percentages)
Source: Banco de Datos, CIS.
0
10
20
30
40
50
60
70
80
90
100
19
83
19
84
19
85
19
86
19
87
19
88
19
89
19
90
19
91
19
92
19
93
19
94
19
95
19
96
19
97
19
98
19
99
20
00
20
01
20
02
20
03
20
04
20
05
20
06
20
07
20
08
20
09
20
10
20
11
20
12
20
13
20
14
Somewhat dissatisfied or very dissatisfied with democracy
Assessment of the economic situation as bad or very bad
Page 30
30
Figure 3. Dissatisfaction with democracy and negative assessments of the political situation, 1983-2014 (in percentages)
Source: Banco de Datos, CIS.
0
10
20
30
40
50
60
70
80
90
19
83
19
84
19
85
19
86
19
87
19
88
19
89
19
90
19
91
19
92
19
93
19
94
19
95
19
96
19
97
19
98
19
99
20
00
20
01
20
02
20
03
20
04
20
05
20
06
20
07
20
08
20
09
20
10
20
11
20
12
20
13
20
14
Somewhat dissatisfied or very dissatisfied with democracy
Assessment of the political situation as bad or very bad
Page 31
31
Figure 4. GDP growth (in percentage points) and unemployment (in percentages) in Spain,
1983-2014
Sources: Eurostat and Euromonitor.
-5
0
5
10
15
20
25
30
1985 1990 1995 2000 2005 2010
GDP growth Unemployment
Page 32
32
Figure 5. Interest in politics (many and a lot), 1983-1911 (in percentages)
Source: Banco de Datos, CIS.
0
5
10
15
20
25
30
35
40 M
ay-8
3
Mar
-85
Feb
-86
May
-86
Dec
-86
Jan
-89
May
-89
May
-90
Jun
-91
Ap
r-9
3
Feb
-94
Mar
-02
Oct
-04
Jan
-06
Jan
-08
Oct
-11
Page 33
33
Figure 6. Political discussion in Spain, 2006-2014 (in percentages)
Source: Banco de Datos, CIS.
0
5
10
15
20
25
30
35
2006 (Jun) 2007 (Jul) 2009 (May) 2010 (Jul) 2013 (Feb) 2014 (Feb)
Everyday 3-4 days per week
1-2 days per week less than 1-2 days per week
Never
Page 34
34
Figure 7. Confidence in the Parliament (0-10), 1994-2014
Source: Banco de Datos, CIS.
0
10
20
30
40
50
60
70
1994 (nov)
1995 (dic)
1996 (Nov)
1996 (Dec)
1998 (Dec)
2003 (Feb)
2010 (Nov)
2011 (Feb)
2013 (Apr)
2014 (Apr)
(0-3) (7-10) Don't Know/No opinion
Page 35
35
Figure 8. Dissatisfaction (“not at all satisfied”) with the way democracy works, 1983-2014 (in percentages)
Source: Banco de Datos, CIS.
0
5
10
15
20
25
30
35
40
1985 1990 1995 2000 2005 2010
Not at all satiesfied on how democracy works (%)
Mean: 10,2S.D.: 7,7
Min: 4 Max: 36,5 Range: 32,5
Page 36
36
Figure 9. Support to an eventual authoritarian regime, 1983-2014 (in percentages)
Sources: Banco de Datos, CIS, and CIUPANEL for 2014.
2
4
6
8
10
12
14
16
1985 1990 1995 2000 2005 2010
Mean: 8,1S.D.: 2,6
Min.: 4
Max. : 15
Range: 11
Page 37
37
Figure 10. Dissatisfaction with the way democracy works and support to an eventual authoritarian regime, 1983-2014 (in percentages)
Source: CIS, and CIUPANEL for legitimacy in 2014.
0
5
10
15
20
25
30
35
40
1985 1990 1995 2000 2005 2010
Not at all satisfied with how democracy works (%)Support for an eventual authoritarian regime (%)
Correlation : 0,14 P. Value : 0,44
Page 38
38
Figure 11. Evolution of dissatisfaction with democracy in Spain, 1983-2014
-12
-8
-4
0
4
8
0
10
20
30
40
1985 1990 1995 2000 2005 2010
Residual
Not at all satisfied with democracy (%)
Model 2 Predicted values
R2: 0,85
Page 39
39
Figure 12. Dissatisfaction with the way democracy works and support to an eventual authoritarian regime, 1983-2014 (in percentages)
Sources: Banco de Datos, CIS, and CIUPANEL for 2014.
0
10
20
30
40
50
1985 1990 1995 2000 2005 2010
Support for an eventual authoritarian regime (% within PP voters)Support for an eventual authoritarian regime (% within PSOE voters)
Page 40
40
Figure 13. Support for an eventual authoritarian regimes in Spain among PP voters, 1983-2014
-10
-5
0
5
10
15
20
0
10
20
30
40
50
1985 1990 1995 2000 2005 2010
Residual
Support to an eventual authoritarian regime (%)
Model 5 predicted values
R2: 0,71
Page 41
41
-
Year % N
1978 77 5.898
1980 69 3.132
1981 81 1.703
1982 74 5.463
1983 73 5.481
1988 87 4.548
1993 79 1.448
1994 82 2.491
Includes answer to the question on whether "Democracy is the best form of
government for a country like ours"
Sources: For 1978-1993, DATA, and Bano de Datois, CIS, for 1994.
Page 42
42
Table 2. Time series analysis: variables, operationalization, and hypotheses
Dependent variables
Independent variables and control variables
Satisfaction Legitimacy
Economic context H 2.1 H 2.2
Unemployment rate
Gross Domestic Product
(growth)
Political factors H 3.1 H3.2
Public expenditure
(growth)
Contextual factors
Corruption perception H 4.1 H 4.2 (% considering corruption among
most important problems in Spain)
Party in government
- - (0 PP, 1 PSOE)
Election year
- - (0 No, 1 Yes)
Page 43
43
Table 3. Time series analysis: dissatisfaction with the way democracy works in
Spain, 1983-2013a
Variables Model 1 Model 2
Constant 2.937 10.391 ***
(2.539) (1.584)
Economic factors
Unemployment rate (t+1) .404 **
(0.148)
GDP growth -1.100 ***
(0.280)
Political factors
Public expenditure growth -.232 .0164
(0.159) (0.140)
Contextual factors
Corruption .36 *** .555 ***
(0.112) (0.065)
PSOE in government -.590 -1.497
(1.685) (1.468)
Election year
-1.425 -1.092
(1.502) (1.345)
.724 .853
Number of observations 31 32
a Entries are least-squares regression coefficients. Standard errors in parenthesis
*p<0.1; **p<0.05; *** p< 0.01.
Sources: CIS, Eurostat and Euromonitor.
^2
Page 44
44
Table 4. Time series analysis: preferences for an eventual authoritarian regime in Spain, -
Entire sample PSOE voters PP voters
Variables Model 1 Model 2 Model 3 Model 4 Model 5 Model 6
Constant .181 4.351 1.350 3.287 -11.690 1.290
(1.209) (1.014) (.841) (.600) (-4.273) (3.493)
Economic factors
Unemployment rate .288 *** .120 ** .967 ***
(.068) -.047 -.242
GDP growth -.021 -.088 .346
(.179) (.106) (.618)
Political factors
Public expenditure growth .243 *** .260 *** .065 -.832 .841 *** .840 **
(.066) (.089) (.046) (.053) (.235) (0.309)
Contextual factors
Corruption .023 .117 *** .016 .053) * .063 .391 **
(.039) (.041) (.027) (.025) -.138 (0.144)
PSOE in government 1.447 ** 1.706 ** .629 .638 6.667 ** 8.065 **
(.707) (.940) (.492) (.556) (2.500) (3.237)
Election year -.428 -.216 -.072 -.005 1.278 2.046
(.666) (.861) (.463) (.509) -2.355 2.965
.691 .481 .404 .477 .707 .532
Number of observations 32 32 32 32 32 32
a Entries are least-squares regression coefficients (standard errors in parenthesis). * p< 0.1 ** p<0.05 *** p< 0.01
Sources: CIS, Eurostat, Euromonitor, and CIUPANEL.
^2
Page 45
45
Table 5. Analysis for 2014 operationalization and hypotheses
Dependent variables
Independent variables
and control variables Satisfaction Legitimacy Disaffection
Attitudes toward
democracy H1
Satisfaction with
democracy
Legitimacy
Disaffection
Economic context H2
Unemployed
Assessment of
economic situation
Political participation H3 H4 H5
Vote
Volunteer labor
Political contact
Participation in boycotts
Participation in
demonstrations
Sociodemographic
Age H6 H7 H8
University
Religiosity
Ideological and
political
Party identity
Right-left ideology
Social trust
Voted for PP H9 H10 H11
Page 46
46
Table 6. Satisfaction with democracy in Spain, 2014a
Variables Model 1 Model 2 Model 3
Sometimes authoritarian 0.003
-0.238
(0.201)
(0.261)
Indifferent towards regimes -1.046***
-0.880**
(0.349)
(0.440)
Disaffection -0.246***
-0.217***
(0.039)
(0.053)
Critical -0.222***
-0.210***
(0.033)
(0.044)
Assessment of economy
0.350*** 0.180***
(0.059) (0.066)
Unemployed
-0.236 -0.121
(0.180) (0.194)
Age
-0.001 -0.008
(0.005) (0.005)
University
-0.054 -0.028
(0.142) (0.154)
Religion
0.236*** 0.224***
(0.046) (0.051)
Turnout
0.384** 0.243
(0.171) (0.185)
Voluntary work
-1.048*** -1.041***
(0.264) (0.284)
Contact with politicians
0.692*** 0.654***
(0.168) (0.188)
Boycott
-0.465*** -0.228
(0.145) (0.157)
Demonstrations
-0.264 -0.442**
(0.164) (0.177)
Ideology
0.118*** 0.061
(0.036) (0.040)
Social trust
0.048* -0.030
(0.029) (0.032)
Voted for PP
0.185 0.066
(0.194) (0.216)
Constant -1.854*** -3.594*** -2.447***
(0.072) (0.347) (0.384)
Observations 2.562 1.833 1.833
Nagelkerke Ps. R2 0.192 0.143 0.258 a Entries are logistic regression coefficients. (Standard errors in parentheses).
*** p<0.01, ** p<0.05, * p<0.1.
Source: CIUPANEL, third wave, 2014.
Page 47
47
Table 7. Legitimacy of democracy in Spain 2014a
Model 1 Model 2 Model 3
Variables
Authoritari
an
Indifferen
t
Authoritari
an
Indifferen
t
Authoritari
an
Indifferen
t
Sat. democracy 0.094 -0.861***
-0.240 -0.904**
(0.195) (0.331)
(0.258) (0.431)
Disaffection 0.032 0.265***
0.081 0.217***
(0.046) (0.048)
(0.063) (0.073)
Critical -0.000 -0.056
0.062 -0.047
(0.042) (0.049)
(0.056) (0.069)
Economic eval.
0.158** -0.152 0.244*** -0.039
(0.079) (0.102) (0.082) (0.105)
Unemployed
0.133 0.101 0.092 -0.015
(0.216) (0.254) (0.217) (0.260)
Age
-0.015** -0.003 -0.014** -0.001
(0.006) (0.008) (0.006) (0.008)
University
-0.135 -0.403 -0.157 -0.369
(0.191) (0.247) (0.193) (0.250)
Religion
0.021 0.141* 0.056 0.186**
(0.066) (0.078) (0.067) (0.078)
Turnout
-0.342 -1.071*** -0.286 -0.935***
(0.230) (0.260) (0.232) (0.264)
Voluntary work
-0.053 0.070 -0.099 0.027
(0.316) (0.365) (0.318) (0.369)
Contact politicians
0.186 -0.483 0.234 -0.440
(0.232) (0.335) (0.235) (0.339)
Boycott
0.081 -0.483** -0.034 -0.525**
(0.186) (0.240) (0.191) (0.245)
Demonstrations
-0.585** -0.189 -0.550** -0.129
(0.239) (0.260) (0.240) (0.262)
Ideology
0.123*** -0.014 0.149*** 0.021
(0.046) (0.056) (0.047) (0.057)
Social trust
-0.139*** -0.118*** -0.112*** -0.090**
(0.038) (0.044) (0.038) (0.045)
Voted for PP
0.662** 0.643* 0.727*** 0.719*
(0.271) (0.365) (0.270) (0.367)
Constant -2.261*** -2.500*** -1.905*** -1.210** -2.441*** -1.969***
(0.080) (0.095) (0.425) (0.483) (0.453) (0.528)
Observations 2.562 2.562 1.833 1.833 1.833 1.833
Nagelkerke Ps. R2 0.0254 0.0254 0.0787 0.0787 0.0992 0.0992
a Entries are multinomial logistic regression coefficients. (Standard errors in parentheses).
*** p<0.01, ** p<0.05. * p<0.1
Source: CIUPANEL, third wave, 2014.
Page 48
48
Table 8. Political disaffection in Spain, 2014a
Model 1 Model 2 Model 3
Variables Critical Disaffected Critical Disaffected Critical Disaffected
Satisfaction with democracy -2.885*** -2.456***
-2.276*** -1.795***
(0.130) (0.119)
(0.156) (0.131)
Sometimes Authoritarian 0.138 0.168
0.605*** 0.546***
(0.175) (0.161)
(0.208) (0.175)
Indifferent towards regimes 0.727*** 1.142***
0.447* 0.796***
(0.190) (0.175)
(0.249) (0.209)
Assessment of economy
-0.543*** -0.428*** -0.432*** -0.337***
(0.056) (0.047) (0.053) (0.045)
Unemployed
0.258* 0.360*** 0.190 0.304**
(0.149) (0.125) (0.141) (0.118)
Age
-0.015*** -0.013*** -0.015*** -0.013***
(0.004) (0.004) (0.004) (0.003)
University
0.004 0.012 -0.012 0.007
(0.129) (0.108) (0.121) (0.102)
Religion
-0.174*** -0.135*** -0.091** -0.073*
(0.047) (0.039) (0.045) (0.037)
Turnout
-0.364** -0.491*** -0.229* -0.359***
(0.144) (0.121) (0.137) (0.115)
Voluntary work
0.283 0.056 0.066 -0.116
(0.182) (0.153) (0.172) (0.145)
Contact with politicians
-0.369** -0.101 -0.165 0.067
(0.157) (0.131) (0.148) (0.125)
Boycott
0.662*** 0.384*** 0.551*** 0.306***
(0.125) (0.105) (0.119) (0.100)
Demonstrations
-0.287** -0.282** -0.320** -0.303***
(0.140) (0.117) (0.132) (0.111)
Ideology
-0.137*** -0.144*** -0.111*** -0.124***
(0.032) (0.027) (0.031) (0.026)
Social trust
-0.202*** -0.150*** -0.182*** -0.131***
(0.025) (0.021) (0.024) (0.020)
Voted for PP
-0.351* -0.147 -0.256 -0.086
(0.195) (0.164) (0.185) (0.155)
Constant 0.318*** 0.480*** 3.643*** 3.366*** 3.326*** 3.044***
(0.060) (0.055) (0.293) (0.245) (0.279) (0.235)
Observations 2.562 2.562 1.833 1.833 1.833 1.833
R2 0.171 0.163 0.199 0.191 0.291 0.280
a Entries are OLS regression coefficients. (Standard errors in parentheses).
*** p<0.01, ** p<0.05, * p<0.1.
Source: CIUPANEL, third wave, 2014.
Page 49
49
Table 9. Satisfaction with democracy in Spain, 2014
a
Variables Model 4 Model 5
Sometimes authoritarian −0.363 −0.441
(0.297) (0.301)
Indifferent towards regimes −0.748 −0.753
(0.478) (0.474)
Critical −0.150*** −0.151***
(0.044) (0.045)
Disaffection −0.267*** −0.255***
(0.058) (0.058)
Assessment of economy 0.051
(0.073)
Ideology 0.050
(0.036)
Capitalist legitimacy 0.566*** 0.519***
(0.196) (0.198)
Capitalist efficacy 0.719*** 0.657***
(0.200) (0.204)
Capitalist fairness 0.511*** 0.461***
(0.097) (0.104)
Constant −2.866*** −3.093***
(0.150) (0.209)
Observations 1.652 1.652
Log Likelihood −566.785 −565.318
Akaike Inf. Crit. 1.149.570 1.150.637 a Entries are logistic regression coefficients.
(Standard errors in parentheses).
*** p<0.01, ** p<0.05, * p<0.1.
Source: CIUPANEL, third wave, 2014.
Page 50
50
Table 10. Legitimacy of democracy in Spain, 2014a
Model 4 Model 5
Variables Authoritarian Indifferent Authoritarian Indifferent
Satisfaction with democracy −0.215 −0.639 −0.319 −0.716
(0.282) (0.467) (0.287) (0.470)
Critical 0.074 −0.085 0.095 −0.076
(0.059) (0.071) (0.060) (0.072)
Disaffection 0.073 0.265*** 0.094 0.268***
(0.071) (0.082) (0.071) (0.082)
Assesment of economy 0.254*** 0.015
(0.089) (0.113)
Ideology 0.234*** 0.190***
(0.043) (0.052)
Capitalist legitimacy 0.237 0.064 −0.049 −0.113
(0.252) (0.313) (0.257) (0.319)
Capitalist efficacy 0.702*** −0.497 0.439 −0.689*
(0.263) (0.412) (0.270) (0.418)
Capitalist fairness 0.170 0.046 −0.028 −0.039
(0.122) (0.159) (0.135) (0.168)
Constant −2.856*** −2.862*** −4.107*** −3.501***
(0.165) (0.187) (0.285) (0.314)
Akaike Inf. Crit. 1,531.177 1,531.177 1,486.421 1,486.421
a Entries are multinomial logistic regression coefficients.
(Standard errors in parentheses).
*** p<0.01, ** p<0.05, * p<0.1.
Source: CIUPANEL, third wave, 2014.
Page 51
51
Table 11. Political disaffection in Spain, 2014a
Model 4 Model 5
Variables Critical Disaffected Critical Disaffected
Satisfaction with democracy −2.231*** −1.754*** −2.120*** −1.663***
(0.175) (0.142) (0.174) (0.142)
Sometimes authoritarian 0.722*** 0.560*** 0.895*** 0.711***
(0.230) (0.187) (0.230) (0.187)
Indifferent towards regimes 0.464* 0.764*** 0.533* 0.834***
(0.280) (0.228) (0.278) (0.226)
Assesment of economy
−0.316*** −0.224***
(0.059) (0.048)
Ideology
−0.069** −0.074***
(0.029) (0.023)
Capitalist legitimacy 0.164 0.028 0.320* 0.160
(0.169) (0.138) (0.170) (0.138)
Capitalist efficacy −0.713*** −0.424*** −0.580*** −0.305**
(0.190) (0.155) (0.190) (0.155)
Capitalist fairness −0.867*** −0.659*** −0.688*** −0.518***
(0.083) (0.067) (0.087) (0.071)
Constant 1.046*** 0.986*** 1.716*** 1.528***
(0.095) (0.078) (0.145) (0.118)
Observations 1,652 1,652 1,652 1,652
R2 0.250 0.234 0.234 0.250
a Entries are OLS regression coefficients. (Standard errors in parentheses).
*** p<0.01, ** p<0.05, * p<0.1.
Source: CIUPANEL, third wave, 2014.
Page 52
52
Table 12. Probability of voting for different parties (PTV) in Spain, 2014a
Variables
Model 1 Model 2
PP PSOE IU Podemos
PP PSOE IU Podemos
Satisfaction 1.873*** -0.121 -1.625*** -2.106*** 0.834*** 0.441** -0.662*** -0.873***
democracy (0.181) (0.206) (0.224) (0.270) (0.153) (0.206) (0.208) (0.252)
Sometimes 1.834*** -0.793*** -0.845*** -0.729** 0.774*** -0.129 0.166 0.399
authoritarian (0.235) (0.268) (0.291) (0.351) (0.194) (0.260) (0.263) (0.318)
Indifferent (regimes) 0.197 -0.665** -0.650* -0.391 -0.197 -0.361 -0.215 0.008
(0.289) (0.329) (0.357) (0.431) (0.235) (0.315) (0.319) (0.385)
Disaffection -0.202*** -0.158** -0.133** 0.020 -0.110*** -0.205*** -0.228*** -0.105*
(0.047) (0.054) (0.058) (0.070) (0.038) (0.051) (0.052) (0.063)
Critical -0.197*** -0.195*** -0.050 0.114** -0.120*** -0.231*** -0.121*** 0.010
(0.038) (0.043) (0.047) (0.057) (0.031) (0.042) (0.042) (0.051)
Capitalist legitimacy 0.124 -0.045 -0.406** -0.439*
(0.143) (0.191) (0.194) (0.234)
Capitalist efficacy 1.107*** -0.381* -0.343 -0.836***
(0.161) (0.216) (0.219) (0.264)
Capitalist fairness 0.270*** -0.102 -0.379*** -0.641***
(0.072) (0.097) (0.098) (0.119)
Age 0.003 0.011** -0.002 -0.021***
(0.004) (0.005) (0.005) (0.006)
Ideology 0.529*** -0.362*** -0.538*** -0.548***
(0.024) (0.032) (0.033) (0.039)
Constant 1.137*** 2.556*** 2.978*** 4.517*** -1.348*** 3.458*** 5.465*** 8.266***
(0.075) (0.086) (0.093) (0.112) (0.197) (0.264) (0.268) (0.324)
Observations 1,652 1,652 1,652 1,652
1,652 1,652 1,652 1,652
R2 0.258 0.091 0.041 0.068 0.517 0.180 0.247 0.264
a Entries are OLS regression coefficients. (Standard errors in parentheses).
*p<0.1, **p<0.05, ***p<0.01.
Source: CIUPANEL, third wave, 2014.