© The Pakistan Development Review
59:2 (2020) pp. 155–178
DOI: 10.30541/v59i2pp.155-178
Demographic Changes and Economic Growth
in Pakistan: The Role of Capital Stock
ZAINAB JEHAN and FAIZA AZHAR KHAN*
Pakistan has experienced a decrease in population growth since the early 1990s leading
to an increase in the ratio of working age population, known as demographic dividend. The
demographic dividend may lead to higher savings and investments, which spurs economic
growth. Given this postulation, the study is the first of its kind to analyse the impact of
demographic variables on economic growth through physical capital for Pakistan from 1960 to
2014. In this regard, the demographic change is captured by taking four alternate measures,
namely population growth, young age dependency ratio, old age dependency ratio and working
age population ratio. In order to examine the channel effect, first the direct impact of
demographic changes on physical capital is estimated. Later, the impact of demographically
induced capital stock on economic growth is estimated. By using the FMOLS technique, the
study concludes that the total negative impact is highest in the case of old age dependency,
which means that higher old age dependency is the most threatening demographic change for
economic growth. The least harmful demographic change is young age dependency. Moreover,
the empirical findings highlight the importance of capital stock as the mediating channel in the
demographic change and economic growth relationship. The study recommends effective long-
term policies to increase youth employment and to enhance savings for maximising the
benefits of demographic dividend.
JEL Classification: J11; O47
Keywords: Direct and Indirect Impact, Demographic Transition, Demographic
Age Structure, Capital Stock, FMOLS
1. INTRODUCTION
Demographic changes are a component vital in explaining the economic growth of
a country. Over the course of time, researchers have debated on the probable impact of
demographic changes on economic/income growth being either negative, positive or
neutral, as explained by the pessimistic, optimistic and neutralism schools, respectively,
with particular emphasis on population change and birth rates as indicators of
demographic change.
The pessimistic view focuses on the capital dilution effect, the dependency effect,
and the savings effect being plausible explanations for the negative relationship between
population growth and income growth. The capital dilution effect, also known as the
solow effect, suggests that increase in population increases the number of labourers and
Zainab Jehan <zainabjehan.fjwu@gmail> is Assistant Professor, Fatima Jinnah Women University
(FJWU), Rawalpindi. Faiza Azhar Khan <[email protected]> is Assistant Professor, Fatima Jinnah
Women University (FJWU), Rawalpindi.
156 Jehan and Khan
consequently reduces the capital per worker. Similarly, the dependency effect and the
savings effect encompass a larger number of dependents and lower savings resulting from
increasing birth rates respectively (Malthus, 1798; Coale and Hoover, 1958; Kelley,
1988; Barro, 1991; Brandner and Dowrick, 1994; Todaro and Smith, 1994; Ahituv, 2001;
Lee and Mason 2010). However, according to Ashraf et al. (2013), the dependency effect
is dominant in the initial decades while the capital dilution effect becomes important in
later years.
In contrast, the optimistic view documents the positive impact of population
growth on economic performance, underlining the importance of economies of scale and
human capital stock due to an increase in population, (Boserup, 1965; Srinivasan, 1988;
Kuznets, 1960; Simon, 1981). According to the optimists’ view, increasing population
can also help reduce the diminishing returns arising from an aging population (Coale and
Hoover, 1958; Meier, 1995). Furthermore, Boserup (1965) suggests that population
growth creates incentives for innovations in technology and institutions.
Finally, the third and most recent view is neutralism, which concludes that
population growth has little or no significant impact on economic growth in the presence
of other control variables (Bloom and Freeman, 1986; Kelley, 2001; Bloom and
Williamson, 1998).
However, the aforementioned literature on the relationship between population
growth and economic growth has ignored an important aspect of the relationship, which
is the changing age structure of the population. Different age structures within similar
population figures can have varying impacts on economic growth (Bloom et al. 2001).
Countries with relatively higher young and old age populations may experience lower
economic growth. The requirement of huge expenditures on this population in the areas
of education and health is a contributing factor. In contrast, countries with a high
proportion of a working age population have better economic performance.
The varying population age structure is a result of changing fertility and mortality
rates over time, which can be linked to the demographic transition of countries. In the
current phase of the demographic transition globally, most developing countries are
experiencing declining mortality and fertility rates that may result in increasing the
working age population as a percentage of the total population (Batini et al. 2006). This
offers an opportunity for demographic dividend, provided these countries focus on the
education and health needs of the younger population, keeping in mind that the labour
market should have the capacity to absorb this population productively (Bloom et al.
2001; Bloom and Finlay, 2009).
Demographic dividends affect the economic performance of a country through
increased labour supply, higher savings, and investments in human capital. All these
factors have a positive impact on economic growth. For example, it is worth noting that
these demographic dividend factors have substantially contributed to the East Asian
growth phenomenon. (Bloom and Williamson, 1998).
As mentioned above, a considerable amount of literature focuses on the direct
impact of various indicators of demographic changes on economic growth. However, the
impact of demographic changes on economic growth is direct, but also conditional on
various channels such as physical capital, employment and human capital. It is important
to analyse how, and to what extent, the impact of demographic changes on economic
growth varies through these channels.
Demographic Changes and Economic Growth 157
Extensive literature on economic growth shows that the various factors necessary
for economic growth. Some of them are physical capital, human capital, inflation rate,
government consumption ratio, trade openness, institutional quality, democracy, and life
expectancy etc. (Sala-i-Martin, 1997; Sala-i-Martin et al. 2004). The Harrod-Domar and
Solow models of economic growth consider physical capital one of the most important
determinants of economic growth for any country. Mankiw et al. (1992) and Barro and
Sala-i-Martin (2004) in their famous studies on empirics of economic growth have
underscored the significance of physical capital for economic growth. Therefore, we have
selected physical capital stock as the mediating factor in the relationship of demographic
change and economic growth.
Interestingly, scholars have pondered on the mechanics of the impact of
demographic variables on physical capital. To begin with, the life cycle model of savings
and investments asserts that household decisions about savings and investments depend
on their age along with their income (Modigliani and Brumberg, 1954). Goyal (2004) is
of the view that decisions about portfolio investment are also a function of age. Bakshi
and Chen (1994) contributed life cycle investment hypothesis, and life cycle risk aversion
hypothesis illustrating the relationship between investments and age. The former explains
that as people get older their equity investment increases; while the latter documents that
an increase in average age results in an increase in risk premium.
A study by Batini et al. (2006) concluded that an increase in population and labour
force results in an increase in investment through changes in marginal product of capital
and consumption, and saving decisions. Using the overlapping generation model (OLG),
d’Albis (2007) corroborated a non-monotonic relationship between demographic changes
and capital accumulation owing to the opposite signs of capital dilution and savings
effects.
Presently Pakistan is going through a demographic transition with an increase in
the ratio of working age population and a decline in dependency ratios (see Figure 1).
Crude birth rates (CBR) were high in the 1970s and early 1980s, but decreased to 30
births per 1000 population by 2006, and 29 births per 1000 population by 2015.
Similarly, the total fertility rate was 6.6 births per woman in 1960, and 5 births per
woman in 1997, declining to 3.5 births per woman in 2015 (World Bank, 2017). The
crude death rate was 15 in 1970 and dropped to 7 in 2015. As a result, the age
dependency ratio as a percentage of working age population has declined from 88 in the
1980s and 1990s, to 65 in 2015 (World Bank, 2017). The annual population growth rate
in Pakistan has been approximately 2 percent for the last decade.
Figure 1 depicts a smoother decline in fertility rate as compared to the age
dependency ratio. The latter, after declining in the early 1980s, started increasing again
but eventually showed a consistent decline from the 1990s onwards. At the same time,
the working age population ratio has shown a continuous increase. Moreover, since the
beginning of the 1980s, the fertility rate has shown a sharp decline. Figure 1 shows the
1990s as the start of the demographic dividend period for Pakistan. According to Nayab
(2008), the duration of demographic dividend in Pakistan is from 1990 to 2045 with its
peak around the year 2000.
It is imperative to mention here the findings of the recent population census
conducted in 2017 that reported a surprisingly high annual average population growth of
2.40 percent over the period 1998-2017 for Pakistan, given the previously reported
158 Jehan and Khan
population growth rate of around 2 percent for this period (Pakistan Bureau of Statistics,
2018). According to the world development indicators, this percentage of population
growth is parallel to the one in 1998. The age dependency ratios and working age
population ratio may be different and thus lead to a lower demographic dividend then
expected according to Figure 1. Therefore, it is important to study the implications of
demographic changes in Pakistan.
This study aims to analyse the impact of demographic indicators on the economic
growth of Pakistan. Some earlier studies have analysed the issue for Pakistan, (e.g.
Hussain, et al. 2009, Choudhry and Elhorst, 2010 and Iqbal et al. 2015). However, the
present study is unique in its attempt to estimate the direct and indirect impact of
demographic variables on economic growth through the channel of physical capital,
given the importance of physical capital in explaining economic growth. The study
utilises the time-series data of Pakistan over the period 1960-2015 and applies FMOLS
technique to estimate various models for measuring the direct and the indirect impact.
Our empirical analysis is comprised of three steps.
Fig. 1. Demographic and Fertility Transition in Pakistan
In the first step, the direct impact of demographic changes on economic growth
uses four indictors: (i) population growth; (ii) old age dependency ratio; (iii) working age
population ratio; and (iv) young age dependency ratio, for estimations.
The second step computes indirect impact. This involves (a) estimating the direct
impact of each demographic indicator on capital stock separately; (b) estimating the
impact of demographically induced capital stock on economic growth; (c) computing the
indirect impact by multiplying the coefficient of demographic change indicator (from a)
with the respective capital stock coefficient (from b). Finally, the total impact is the sum
of the direct and indirect impacts.
34
56
7
50
60
70
80
90
1960 1980 2000 2020Year
Age Dependency Ratio Working Age Population Ratio
Total Fertility Rate
Figure 1: Demographic and Fertility Transition in Pakistan
Demographic Changes and Economic Growth 159
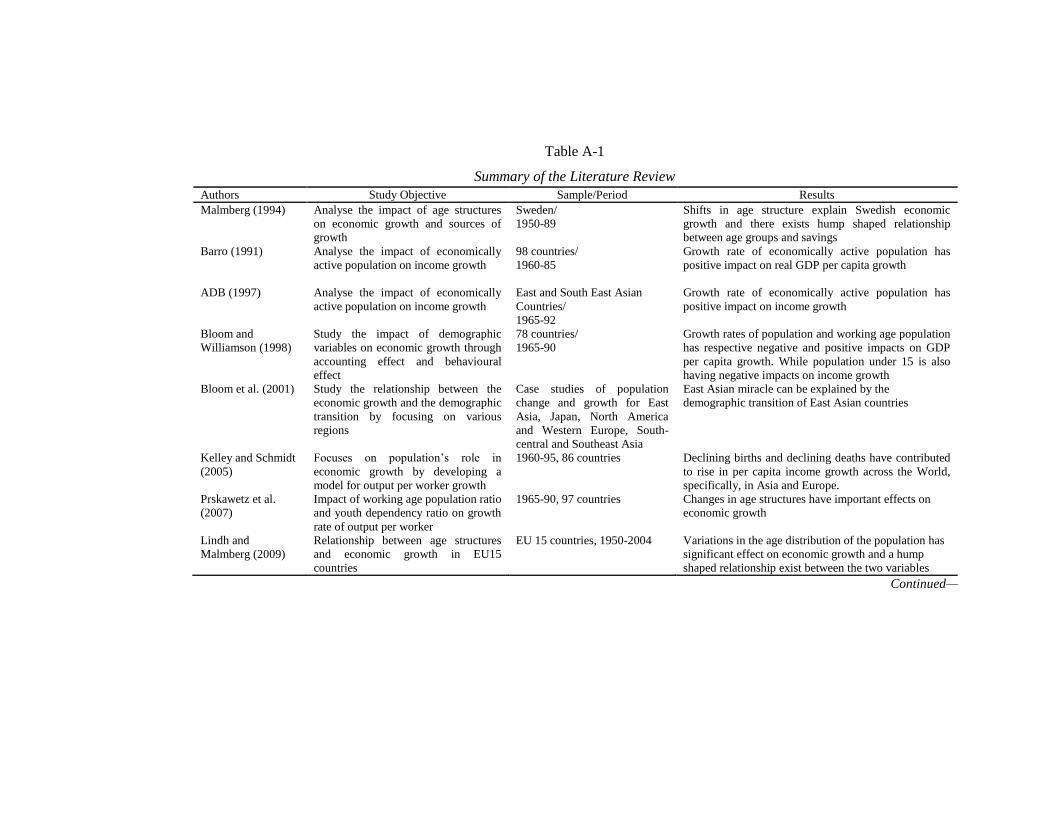
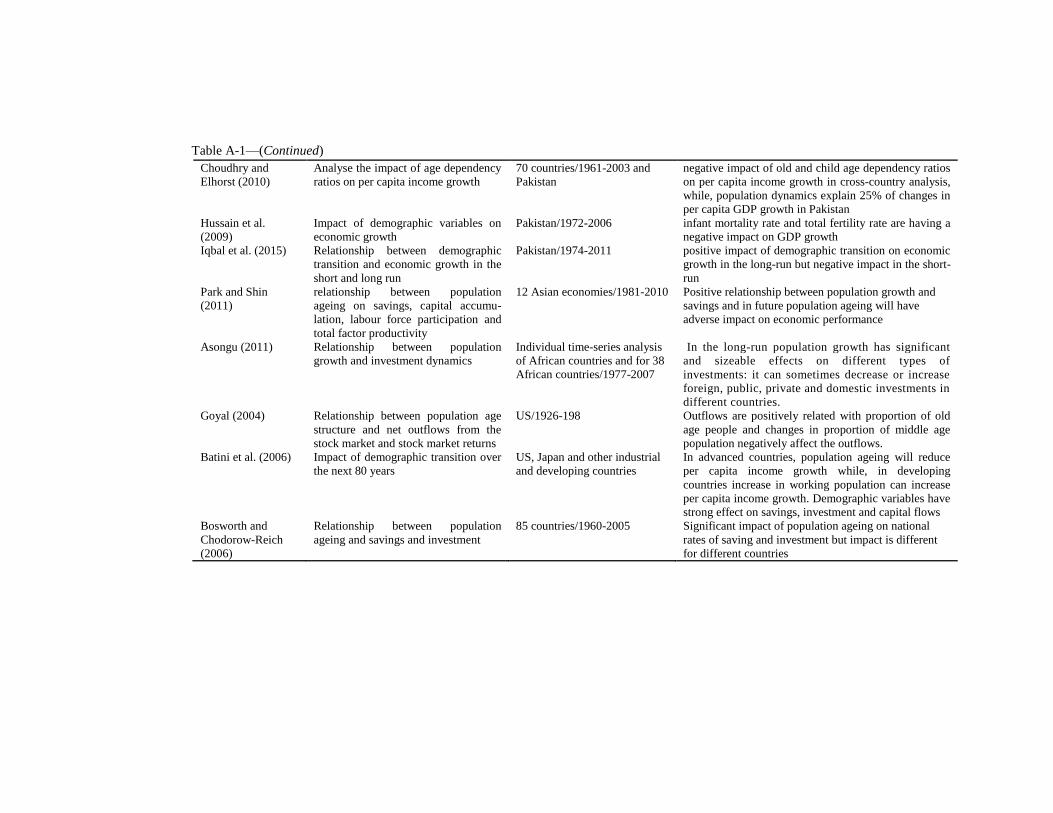
2. LITERATURE REVIEW
Numerous studies have underlined the significance of demographic variables, i.e.
working age ratio, young age dependency ratio, and old age dependency ratio, in
explaining economic growth and development (see Table A-1 for summary of literature
review). Malmberg (1994) analysed the economic growth effects of changing age
structures for the Swedish economy over the period 1950-89 and concluded that there
were significant effects. Barro (1991) and Asian Development Bank (1997) in their cross-
country growth regressions included the growth rate of an economically active population
as an explanatory variable and concluded that it had a positive impact.
Later, Bloom and Williamson (1998) extended the analysis by also analysing the
impact of growth rates of populations of under age 15, and over age 64, together with the
growth rate of the dependent population on GDP per capita growth in separate
regressions. Results have shown that populations under 15 years of age have a negative
and significant impact on income growth; however, the coefficient of populations of over
64 years of age is insignificant. In a study specifically focusing on Asian countries,
Bloom et al. (2001) ascribed most of the East Asian economic miracle to demographic
transition and declining youth dependency ratios in these countries.
In a further study, Kelley and Schmidt (2005) reported a positive impact of a
working age population on growth rates of output per capita and output per worker for a
sample of 86 developing countries over the period 1960-95. Authors have also included
age dependency ratio, and population size and density, as alternative demographic
regressors, and have established that demographic change accounts for 20 percent change
in per capita income growth. In a recent study on implications of age structures for
economic growth, Prskawetz et al. (2007) have corroborated the negative impact of youth
age dependency ratio on economic growth for a large panel of countries spanning the
years 1960-95.
Similarly, Lindh and Malmberg (2009) analysed the relationship between different
age structures and economic growth for EU-15 countries and concluded a hump-shaped
relationship between age groups and GDP growth. In a related study, Choudhry and
Elhorst (2010) concluded that child and old age dependency ratios negatively affected the
per capita income growth, for the period 1961-2003 for seventy countries. Further, per
capita income growth is also a positive function of the difference between the working
age population growth and total population growth.
In studies related to Pakistan, Hussain et al. (2009) have analysed the impact of
demographic variables on economic growth for the period 1972-2006. Both the infant
mortality rate and total fertility rate have negatively affected the GDP growth of the
country, while the growth rate of the labour force had an insignificant impact on
economic growth. In another study, Choudhry and Elhorst (2010) concluded that
population dynamics explain 25 percent of the changes in per capita GDP growth in
Pakistan. Finally, Iqbal et al. (2015) have analysed the impact of demographic transition
on economic growth of Pakistan over the period 1974-2011 and have reported a positive
impact of demographic transition on economic growth in the long run but a negative
impact in the short-run.
Focusing on the relationship between population growth and savings, Park and
Shin (2011) have supported a positive relationship between population and savings and
160 Jehan and Khan
argued that an increase in population implies more workforce and hence more savings.
This positive effect of population on savings is termed the growth effect illustrating that
higher population growth means a higher percentage of young population initially
converting to a higher percentage of working age population later, thus leading to more
savings.
The opposite effect is the dependency effect that showed a negative relationship
between population growth and savings owing to an increased number of dependents
(Prskawetz, 2007). Finally, Asongu (2011) is of the view that an increase in population
may increase production through increases in consumption and labour supply. The
opposite effect may also take place owing to an increase in unemployment creating a
burden on the economy. In this situation, investors decrease their investments thus
reducing economic growth.
Addressing the empirical evidence on the relationship between demographic
changes and physical capital, Malmberg (1994) has analysed the macroeconomic effects
of changing age structure for the Swedish economy over the period 1950-89 and
produced a hump shaped relationship between age group and savings.
Recently, evidence on the relationship between demographic variables and
physical capital was postulated by Goyal (2004), Bosworth and Chodorow-Reich (2006)
and Batini et al. (2006) and Asongu (2011). Goyal (2004) analysed data from the U.S.
and concluded that demographic variables have an important role in explaining aggregate
investment and savings. Forecasting the effect of demographic transition over the next
80 years for USA, Japan and other developing countries, Batini et al. (2006) corroborated
that a strong effect of demographic variables on savings, investment, and capital flows
existed. Using panel data of 85 countries over the period 1960-2005, Bosworth and
Chodorow-Reich (2006) have documented a hump shaped relationship between age
groups and savings. Finally, Asongu (2011) has estimated a significant long-run
relationship between population growth and investments for 38 African countries over
the period 1977-2007. However, the size of the impact varies between public and private
investments for various countries.
3. METHODOLOGY AND DATA
This study empirically examines the mediating role of physical capital stock in the
relationship between demographic changes and economic growth. Alternatively, we
intend to estimate the direct and indirect effects of demographic changes on economic
growth by using the channel of physical capital stock. The empirical analysis, therefore,
involves multiple steps. Firstly, for direct impact, we estimate the effect of demographic
changes on economic growth in the following model.
GDPt = 0 + 1Kt + 2HKt + 3TOt + 4FDIt + 5CPIt + 6DVt + t … (1)
where t = 1960 to 2015
Here, GDPt is log of real gross domestic product. Kt is physical capital stock
measured as log of real gross fixed capital formation. HKt is human capital index based
on years of schooling and returns to education. TOt is trade openness measured as trade
as percentage of GDP. FDIt is foreign direct investment (net inflows) as percentage of
GDP. CPIt is log of consumer price index. DVt is the particular demographic variable i.e.
Demographic Changes and Economic Growth 161
PGt, population growth (annual percentage), working age population as a percentage of
total population i.e. WAPOP, OADRt, old age dependency ratio as percentage of
working-age population and YADRt, young age dependency ratio as percentage of
working age population. The model is applied four times for each of the four different
focused demographic variables.
The dependency ratio is expected to have an adverse impact on economic growth.
Higher population growth puts pressure on economic and financial resources. As a result,
resources are diverted from investment towards consumption (Kogel, 2003). The impact
of population growth on economic growth is viewed as positive by population optimists
while negative by population pessimists. According to pessimists, higher population
growth creates pressure on economic resources, which hampers accumulation of capital,
in turn decreasing economic growth.
On the other hand, optimists posit that higher population growth generates more
labour force, which leads to economies of scale and innovation, and thus contributes
towards economic growth. The working age population accelerates economic growth (An
and Jeon, 2006; Nguyen, 2008; Bloom and Finlay, 2009; Choudhry and Elhorst, 2010)
because it provides labour, reducing the dependency ratio, ultimately contributing to
economic growth (Choudhry and Elhorst, 2010).
Following Halkos and Paizanos (2014), the indirect impact is analysed in two
further steps: Initially, the impact of demographic change on capital stock is estimated
through the model in Equation (2). The estimated value of capital stock from the latter is
labeled “demographic-change-induced capital stock”. Later, the impact of
demographically induced capital stock on economic growth is estimated through the
model given in Equation (3).
Kt = 0 = 1Kt–1 + 2GDPt + 3HKt + 4rt + 5FDt + 6FDIt + 7RERt
+ 8Gt + 9DVt + t … … … … … … (2)
GDPt = 0 = 1KtDV
+ 2HKt + 3TOt + 4FDIt + 5CPIt + 6FDIt + t … (3)
Where FDt is financial development measured through domestic credit to private sector
as percentage of GDP. RERt is log of real exchange rate. Gt is government consumption
expenditures as percentage of GDP, and KtDV
is demographic-change-induced capital
stock estimated through Equation (2).
Demographic variables affect physical capital directly through investment, and
indirectly through the savings channel. In this regard, life cycle theory supports the idea
that saving decisions vary with age. Savings of young and old people are relatively lower
when compared to the working age population. Moreover, a lower dependency ratio
generally leads to higher savings by the working age group (Kogel, 2003). Therefore, the
dependency ratio imposes an adverse impact on savings and investment (Hyung, 2013).
Moreover, as explained by the Solow and endogenous growth models, high population
growth has an adverse impact on economic growth (McMahon, 2001). High population
growth leads to higher consumption, which reduces savings and investment (Park and
Shin, 2011).
Human capital refers to a higher level of education and skills. Therefore, it ensures
higher returns from investment and economies of scale, helping in accumulation of
physical capital stock. Moreover, human capital stock not only helps in generating new
162 Jehan and Khan
capital stock but also improves the absorptive capacity of the economy for new
technology (Lopez-Bazo and Moreno, 2008). The impact of exchange rate changes can
be explained both as favourable as well as harmful. For instance, exchange rate affects
domestic investment and capital accumulation through cost of capital location.
Depreciation in exchange rate accelerates domestic investment as it increases the gains
from exports. In contrast, imports become more expensive, which may hamper domestic
investment due to higher cost of imported raw material. Therefore, the impact of
exchange rate on domestic investment is conditional on the strength of export and import
channels.
Finally, we take the product of the coefficients of demographic change indicators
from Equation (2) and coefficient of estimated capital stock from Equation (3) to identify
the indirect impact of demographic change on economic growth (i.e. 8* 1). The
computation of indirect and total effect is given as follows:
𝑑𝐺𝑡
𝑑𝐷𝑉𝑡=
𝑑𝐺𝑡
𝑑𝐷𝑉𝑡+
𝑑𝐺𝑖𝑡
𝑑KtDV
∗𝑑𝐾𝑡
𝑑𝐷𝑉𝑡 … … … … … (4)
The study covers 1960-2015. All the data is extracted from World Development
Indicators by the World Bank and Penn World Tables (PWT) 9.0. Before carrying out the
empirical analysis for the times series data, it is important to test the selected series for the
stationarity properties. Among various available tests, Augmented Dickey Fuller test (ADF)
developed by Dickey and Fuller (1979) is most widely recommended by existing literature.
Therefore, the ADF test is used to examine the stationarity properties of the data.
For estimation, the present study employs Fully Modified Ordinary Least Squares
(FMOLS) technique to estimate the impact of demographic change on the economic growth
of Pakistan through the channel of physical capital. The FMOLS technique, proposed by
Phillip and Hansen (1990), is a semi-parametric approach to co-integration. It is used to
estimate the single equation co-integration relationship with the combination of variables that
are integrated of order one. FMOLS modifies the conventional least squares to account for the
serial correlation and test for endogeneity among the regressors that may arise due to the
existence of co-integrating relationships (Rukhsana and Shahbaz, 2008).
4. RESULTS AND DISCUSSIONS
The descriptive statistics are presented in Table 1. The statistics show that the
average population growth is 2.6 percent with a minimum value of 2 percent and maximum
of 3.3 percent during the sample period. Among the dependency ratios, average young age
dependency remains significantly higher than old age dependency which may be due to
high population growth in the country. The average working age population is 54.67
percent of the total population. The highest variation is exhibited by YADR while lowest is
observed in OADR. Among macroeconomic variables, GDP shows large variations as
compared to investment. Notably, HK in the country is very low as observed from the mean
value of HK. The average value of interest rate is 7 percent with a minimum of 2 percent
while a maximum of 12 percent. TO and FDI both are considered an important source of
technology diffusion and openness. By looking at the average values, we can observe that
TO, on average, remains higher than FDI in Pakistan.
Demographic Changes and Economic Growth 163
Table 1
Descriptive Statistics
Variable No. of Obs. Mean Std.Dev. Min Max
GSP 54 28.754 0.8029 27.283 29.949
K 54 27.223 0.589 25.757 28.076
GEGDP 55 11.071 1.773 7.781 16.78
HK 54 1.496 0.271 1.166 2.029
PER 54 4.038 0.448 3.312 4.729
TO 47 32.484 4.287 19.932 38.909
FDI 44 0.757 0.832 -0.063 3.668
DC 54 23.559 4.000 11.148 29.786
PG 54 2.616 0.425 2.028 3.344
OADR 54 7.198 0.133 7.075 7.777
YADR 54 76.101 8.179 54.738 83.048
WAPOP 54 54.668 2.592 52.539 61.794
r 55 7.909 2.732 2.140 12.470
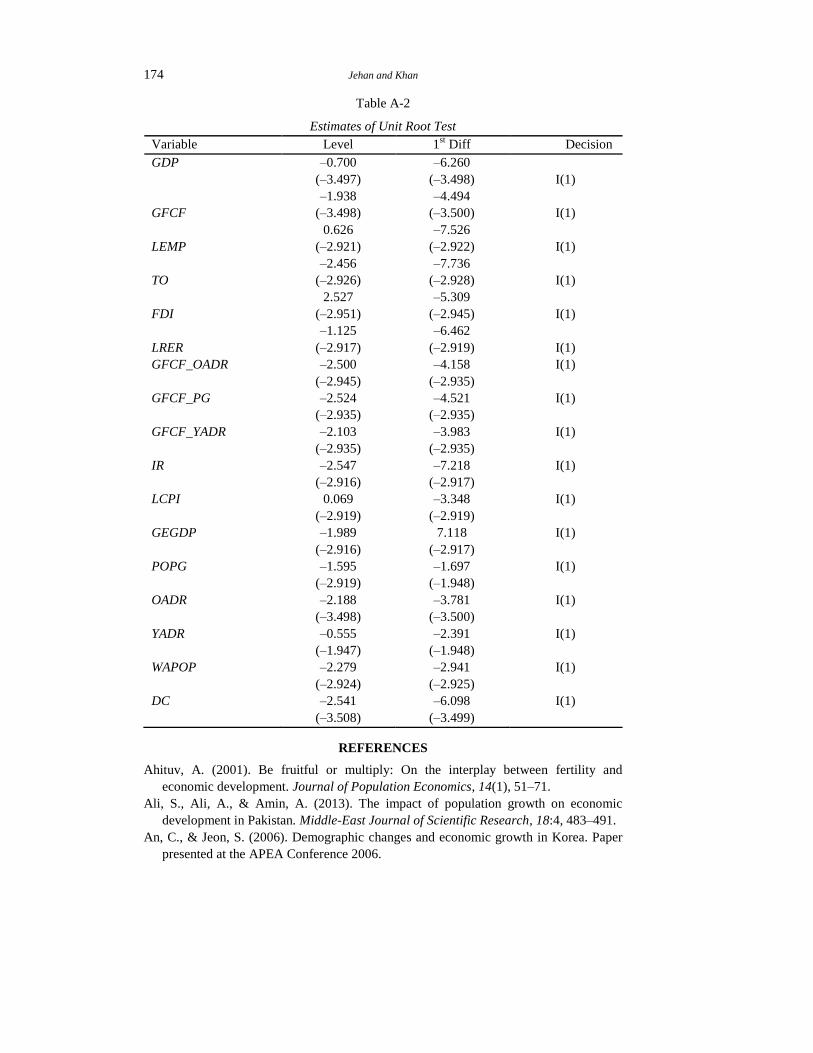
Before estimating the final model, the unit root properties are examined and their
results are reported in Table A-2 in Appendix. These estimates identify that all the
variables are stationary at the first difference and, therefore, are integrated of order one.
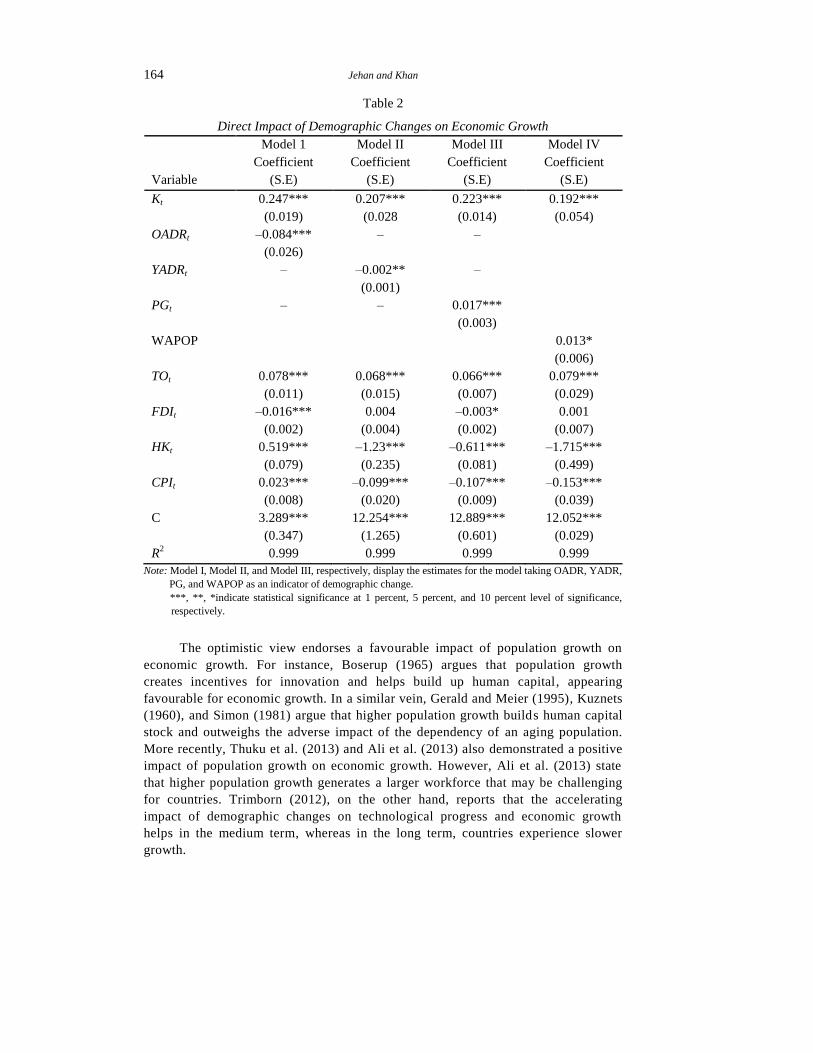
4.1. Direct Impact of Demographic Changes on Economic Growth
The first step of our empirical analysis is to estimate the impact of selected
demographic change indicators on economic growth. In this regard, we estimated
Equation (1) four times with four different demographic variables. The results of this step
are reported in column 2-5 of Table 2.
According to empirical findings, the impact of demographic change indicators
shows that two of the three indicators, namely old age dependency ratio (OADR) and
young age dependency ratio (YADR), affect GDP growth adversely. Notably, the size of
OADR is much higher than YADR. This finding suggests that the old age population is
more burdensome for the economic growth of Pakistan. These findings are appealing as
expenditures on young age populations are mainly on education and help increase the
level of human capital stock, ultimately augmenting the development process of a
country.
Although the increase in young age dependency reduces financial savings, it
increases the spending on human capital. Since younger people spend more on human
capital, the adverse impact of YADR is less as compared to the OADR (Park and Shin,
2011). Prskawetz et al. (2007) support this finding, explaining the negative impact of
young age dependency ratio on economic growth. Similarly, Lindh and Malmberg (2009)
report a negative impact of age group 65 years and above on GDP growth.
The third indicator of demographic change, population growth, however, has a
positive effect. This finding explains the fact that higher population growth leads to a
larger labour force, which in turn leads to higher GDP growth. Notably, this positive
impact of population growth is less than the negative impact of other two indicators.
164 Jehan and Khan
Table 2
Direct Impact of Demographic Changes on Economic Growth
Model 1 Model II Model III Model IV
Variable
Coefficient
(S.E)
Coefficient
(S.E)
Coefficient
(S.E)
Coefficient
(S.E)
Kt 0.247***
(0.019)
0.207***
(0.028
0.223***
(0.014)
0.192***
(0.054)
OADRt –0.084***
(0.026)
– –
YADRt – –0.002**
(0.001)
–
PGt – – 0.017***
(0.003)
WAPOP 0.013*
(0.006)
TOt 0.078***
(0.011)
0.068***
(0.015)
0.066***
(0.007)
0.079***
(0.029)
FDIt –0.016***
(0.002)
0.004
(0.004)
–0.003*
(0.002)
0.001
(0.007)
HKt 0.519***
(0.079)
–1.23***
(0.235)
–0.611***
(0.081)
–1.715***
(0.499)
CPIt 0.023***
(0.008)
–0.099***
(0.020)
–0.107***
(0.009)
–0.153***
(0.039)
C 3.289***
(0.347)
12.254***
(1.265)
12.889***
(0.601)
12.052***
(0.029)
R2 0.999 0.999 0.999 0.999
Note: Model I, Model II, and Model III, respectively, display the estimates for the model taking OADR, YADR,
PG, and WAPOP as an indicator of demographic change.
***, **, *indicate statistical significance at 1 percent, 5 percent, and 10 percent level of significance,
respectively.
The optimistic view endorses a favourable impact of population growth on
economic growth. For instance, Boserup (1965) argues that population growth
creates incentives for innovation and helps build up human capital, appearing
favourable for economic growth. In a similar vein, Gerald and Meier (1995), Kuznets
(1960), and Simon (1981) argue that higher population growth builds human capital
stock and outweighs the adverse impact of the dependency of an aging population.
More recently, Thuku et al. (2013) and Ali et al. (2013) also demonstrated a positive
impact of population growth on economic growth. However, Ali et al. (2013) state
that higher population growth generates a larger workforce that may be challenging
for countries. Trimborn (2012), on the other hand, reports that the accelerating
impact of demographic changes on technological progress and economic growth
helps in the medium term, whereas in the long term, countries experience slower
growth.
Demographic Changes and Economic Growth 165
Finally, the fourth indicator of demographic changes, working age population,
accelerates economic growth (An and Jeon, 2006; Nguyen, 2008; Bloom and Finlay,
2009; Choudhry and Elhorst, 2010) since it provides a labour force while reducing the
dependency ratio, ultimately contributing to economic growth (Choudhry and Elhorst,
2010). Additionally, an increased working age population results in higher productivity
growth. Furthermore, higher growth in the working age population is referred to as the
“large-country” effect, which implies more people involved in productive work
(Isaksson, 2007).
Turning towards the impact of other variables, we observe a statistically
significant impact of all variables on economic growth. In particular, estimates reveal that
trade openness has a significant impact on growth. Trade theories document a positive
impact of trade openness on the economic growth of a country. The Endogenous Growth
Theory developed by Frankel and Romer (1999), and Lucas (1998) implies that trade
leads to competition, technology transfer and efficient allocation of resources ultimately
fostering economic growth. Din et al. (2003) and Umer (2014) document that trade is an
important policy instrument and has a positive and significant impact on output growth of
Pakistan.
In contrast, our findings exhibit a statistically adverse impact of FDI on economic
growth. Literature from Borensztein et al. (1998); Mencinger (2003); Omran and Bolbol
(2003), also provides evidence for the negative impact of FDI on growth. Human capital
signifies a positive impact on economic growth. Empirical studies such as Lucas (1998),
Romer (1990), Barro (1991), Barro and Lee (1993) have considered human capital an
important factor in explaining economic growth. Moreover, inflation rates also exert a
favourable impact on economic growth.
Literature reports both negative and positive impact of inflation on economic growth.
This finding supports the argument that inflation generates profit-earning opportunities for
producers, which increases output level. Hussain and Malik (2011) also support this finding.
However, Ayyoub et al. (2011) document that inflation is favourable to economic growth only
below a certain threshold level and otherwise hurts economic growth.
4.2. Indirect Impact of Demographic Changes on Economic Growth
In order to estimate the indirect impact of demographic changes on economic
growth, we proceed as follows: (i) estimate the impact of each indicator of demographic
change on capital stock separately, and obtain the series of estimated capital stock. (ii)
Use these estimated capital stock series, from the first step, to estimate its impact on
growth. This exercise enables us to estimate the impact of each indicator of demographic
change variable on economic growth through the channel of physical capital stock. In the
following paragraphs, we discuss the findings of both of these steps.
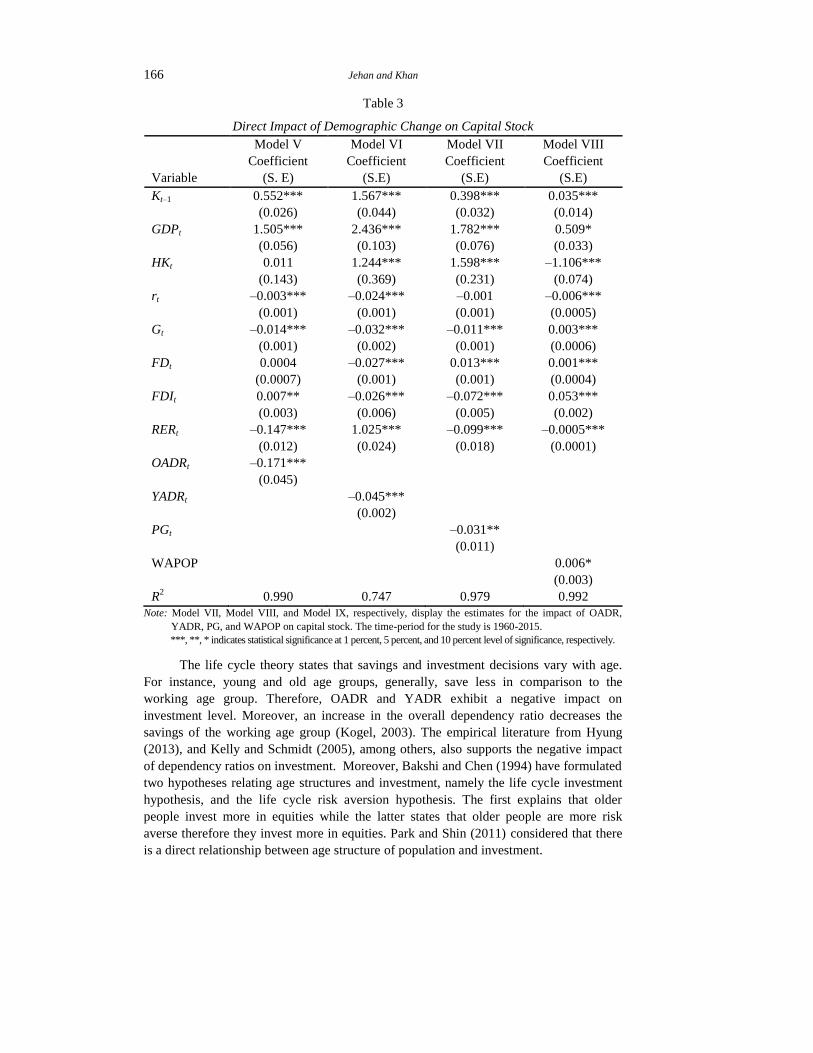
The estimates for the direct impact of each demographic change indicator on
capital stock are presented in Table 3. The selected set of regressors show theoretically
expected signs in relation to the capital stock. In particular, for the demographic change
indicators, Table 3 reports a negative impact of all the indicators of demographic change
on investment. Particularly, the dependency impact measured through OADR and YADR
decreases investment by 0.17 percent and 0.045 percent respectively. Once again, the
adverse impact of OADR is more dominant than YADR.
166 Jehan and Khan
Table 3
Direct Impact of Demographic Change on Capital Stock
Model V Model VI Model VII Model VIII
Variable
Coefficient
(S. E)
Coefficient
(S.E)
Coefficient
(S.E)
Coefficient
(S.E)
Kt–1 0.552***
(0.026)
1.567***
(0.044)
0.398***
(0.032)
0.035***
(0.014)
GDPt 1.505***
(0.056)
2.436***
(0.103)
1.782***
(0.076)
0.509*
(0.033)
HKt 0.011
(0.143)
1.244***
(0.369)
1.598***
(0.231)
–1.106***
(0.074)
rt –0.003***
(0.001)
–0.024***
(0.001)
–0.001
(0.001)
–0.006***
(0.0005)
Gt –0.014***
(0.001)
–0.032***
(0.002)
–0.011***
(0.001)
0.003***
(0.0006)
FDt 0.0004
(0.0007)
–0.027***
(0.001)
0.013***
(0.001)
0.001***
(0.0004)
FDIt 0.007**
(0.003)
–0.026***
(0.006)
–0.072***
(0.005)
0.053***
(0.002)
RERt –0.147***
(0.012)
1.025***
(0.024)
–0.099***
(0.018)
–0.0005***
(0.0001)
OADRt –0.171***
(0.045)
YADRt –0.045***
(0.002)
PGt –0.031**
(0.011)
WAPOP 0.006*
(0.003)
R2 0.990 0.747 0.979 0.992
Note: Model VII, Model VIII, and Model IX, respectively, display the estimates for the impact of OADR,
YADR, PG, and WAPOP on capital stock. The time-period for the study is 1960-2015.
***, **, * indicates statistical significance at 1 percent, 5 percent, and 10 percent level of significance, respectively.
The life cycle theory states that savings and investment decisions vary with age.
For instance, young and old age groups, generally, save less in comparison to the
working age group. Therefore, OADR and YADR exhibit a negative impact on
investment level. Moreover, an increase in the overall dependency ratio decreases the
savings of the working age group (Kogel, 2003). The empirical literature from Hyung
(2013), and Kelly and Schmidt (2005), among others, also supports the negative impact
of dependency ratios on investment. Moreover, Bakshi and Chen (1994) have formulated
two hypotheses relating age structures and investment, namely the life cycle investment
hypothesis, and the life cycle risk aversion hypothesis. The first explains that older
people invest more in equities while the latter states that older people are more risk
averse therefore they invest more in equities. Park and Shin (2011) considered that there
is a direct relationship between age structure of population and investment.
Demographic Changes and Economic Growth 167
The adverse impact of population growth on investment is the lowest (–0.03
percent) amongst three of the demographic change indicators. Theories based on the
Solow growth model, and endogenous growth models, document an inverse impact of
population growth on savings in an economy (McMahon, 2001). These theories argue
that with an increase in population, a larger proportion of income is devoted to
consumption and less is saved, which lowers the rate of investment since less funds are
available. Our finding is in line with these theories and supported by Park and Shin
(2011).
Similarly, the investment-diversion effect explains that public private expenditures
are diverted from growth-oriented investment to social security projects because of high
population growth in a country (Kelly and Schmidt, 2005). Finally, the impact of working
age population on investment is observed as favourable. The working age population
boosts savings and thus investment levels in the country. According to Bloom and
Williamson (1998), a rising growth rate of the working age population leads to a decrease
in the dependency ratio, which increases savings, and thus investment level in the
country.
Focusing on the impact of other variables, GDP growth positively and
significantly affects capital stock. The accelerator theory of investment confirms that an
increase in overall output in a country is an indicator of a better economic performance of
that country, which also attracts more investment (Anwer and Sampath, 1999). Moreover,
human capital signifies a positive impact on physical capital stock. It shows that a higher
level of skill and education of workers allows higher returns from investment. In
addition, stock of human capital helps in generating more stock of physical capital as
well as higher returns from investment and increased absorption of technology (Lopez-
Bazo and Moreno, 2008).
Similarly, FDI helps to increase domestic investment. This implies that foreign
investment provides a competitive environment to domestic investors leading to
higher domestic investments. We also take interest rates as an indicator of the cost of
borrowing to estimate its impact on physical capital stock. The IS-LM framework
explains an inverse relationship between interest rates and investment. Our study
suggests that a higher cost of borrowing leads to lower investment. This finding is
supported by Joshua and Delano (1990) who also explain the adverse impact of
interest rates on investment.
Interestingly, our report finds that government expenditures crowd out private
investment. Pakistan, being a developing country, faces serious resource constraints. As
such, high government expenditures put upward pressure on demand for loanable funds,
which makes them expensive, thus lowering private investment by increasing the cost of
borrowing. On the other hand, financial development appears to improve the channels
through which funds are utilised in an economy. A developed financial system provides
better financing and hedging opportunities, which helps in increasing the investment
level. Reports on Pakistan suggest that financial development has a favourable impact on
investment level. This finding is in line with King and Levine (1993) and Salahuddin et
al. (2009).
In order to estimate the impact of demographically induced capital stock on
economic growth, we re-estimate the economic growth model given in Equation (1) by
168 Jehan and Khan
replacing capital stock with the estimated capital stock while the other regressors are the
same. These estimates are presented in Table 4. The empirical findings for all the selected
regressors are robust, as discussed above. Focusing on the impact of demographically
induced capital stock on growth, the estimated capital stock, in all the models, shows a
statistically significant and positive impact on GDP growth. Particularly, the magnitude
of the impact of capital stock induced by OADR is the highest followed by population
growth, YADR, and WAPOP respectively.
Table 4
Impact of Demographically Induced Capital Stock on Economic Growth
Model IX Model X Model XI Model XII
Variable
Coefficient
(S.E)
Coefficient
(S.E)
Coefficient
(S.E)
Coefficient
(S.E)
GDPt–1 0.321**
(0.157)
0.481***
(0.032)
0.302*
(0.171)
0.351***
(0.113)
𝐾𝑡𝑂𝐴𝐷𝑅 0.178***
(0.065)
𝐾𝑡𝑌𝐴𝐷𝑅 0.063***
(0.014)
𝐾𝑡𝑃𝐺
0.151**
(0.067)
𝐾𝑡𝑊𝐴𝑃𝑂𝑃 0.013*
(0.007)
TOt 0.085**
(0.037)
0.108***
(0.032)
0.109**
(0.043)
0.079**
(0.029)
FDIt 0.008
(0.005)
0.013**
(0.006)
0.009
(0.006)
0.0009
(0.007)
HKt –0.968**
(0.313)
–0.807**
(0.259)
1.077***
(0.364)
–1.715***
(0.499)
CPIt –0.188***
(0.028)
–0.106**
(0.039)
0.138***
(0.046)
–0.253***
(0.039)
C 13.882***
(3.165)
12.371***
(2.193)
14.506***
(3.543)
12.053***
(2.597)
R2 0.995 0.999 0.996 0.999
Note: Model IV, Model V, and Model VI, respectively, display the estimates for the impact of capital stock
induced by the OADR, YADR, PG, and WAPOP on Economic Growth. The time-period for the study is
1960-2015.
***, **, * indicates statistical significance at 1 percent, 5 percent, and 10 percent level of significance,
respectively.
Finally, we compute the indirect impact of demographic change on economic
growth. As explained above, we take a product of the coefficient of the impact of each
measure of demographic change indicator (8) on capital stock with the coefficient of the
estimated capital stock on economic growth (1). These findings are displayed in column
3 of Table 5. This exercise reveals that the indirect impact of demographic change on
GDP growth appears negative in all cases.
Demographic Changes and Economic Growth 169
Interestingly, in accordance with the direct impact, the magnitude of the impact is
highest for OADR while lowest for YADR. These findings suggest that young age
dependency is the least harmful demographic change in Pakistan. Although population
growth appears favourable for investment, it still has an adverse impact on GDP growth.
Notably, the working age population maintains a favourable impact, both direct and
indirect, on economic growth. This indicates that the working age population promotes
economic growth through both direct and indirect channels.
Table 5
Total Impact of Demographic Change on Economic Growth
Variable Direct Impact Indirect Impact Total Impact
OADR –0.084 0.178 * (–0.171) (–0.084) + (–0.030) = –0.114
YADR –0.002 0.063 * (–0.045 ) (–0.002)+ (–0.003) = –0.005
PG 0.017 0.151 * (–0.031) (0.017) + (–0.004) = –0.013
WAPOP 0.013 0.381 *(0.006) (0.013) + (0.002) = 0.015
Having dealt with direct and indirect impacts separately, we now compute the total
impact of demographic change on economic growth in Pakistan. In doing so, we take the
sum of the above two effects i.e. the direct and indirect impact. These estimates are given
in column 4 of Table 5. We observe that the total impact of all the indicators of
demographic change appear negative. The total negative impact is highest in case of old
age dependency, which means that old age dependency is the most threatening
demographic change for economic growth. The least harmful demographic change is the
young age dependency.
By comparing direct and total impacts of demographic change indicators on
economic growth, we may also conclude that the total impact, while considering the
channel of capital stock, is different from simple direct impact. For instance, in the case
of population growth and OADR, while the overall impact is lower than direct impact, it
remains negative. Surprisingly, the overall impact of YADR is slightly higher than simple
direct impact. Finally, the impact of working age population remains positive and the size
of overall impact is substantially higher than direct impact. These findings provide a
cautious conclusion that while discussing the impact of demographic changes on
economic growth, it is important to consider the transmission channels through which
demographic changes affect economic growth. Hence, simple direct impact may be
understated or overstated and may lead to misleading conclusions.
5. CONCLUSIONS AND POLICY IMPLICATIONS
Many studies have established that demographic changes influence the economic
performance of a country, particularly its economic growth. Theoretically, the optimistic,
pessimistic and neutralist views project positive, negative and no-impact effects of
population growth on economic growth respectively. Researchers have also studied
implications of changing age structures for economic development, and linked these
changing age structures with the transition of fertility and mortality rates and hence to
demographic transition. According to these studies, changes in the age composition of a
170 Jehan and Khan
country’s population cause demographic transitions, which ultimately stimulate or
impede economic growth.
During the first two stages of demographic transition, birth rates increase while
death rates decline slowly. The third stage of demographic transition is specifically
important for developing countries because the declining fertility and mortality rates offer
an opportunity of demographic dividend in the form of an increasing ratio of working age
population. Pakistan, like many other developing countries, is currently experiencing an
increase in working age population and has the opportunity to use it to achieve broader
development goals.
Demographic dividend affects the economic performance of a country through
increased labour supply, higher savings, and investment in human capital, all of which
have a positive impact on economic growth. Therefore, economic growth is affected
directly and indirectly by demographic changes. Existing empirical literature mainly
discusses the direct impact of demographic changes on economic growth but few studies
has empirically investigated the indirect effect on it.
This study empirically examines the role of physical capital stock in the
relationship between demographic changes and economic growth for Pakistan over the
period 1960-2015, an indirect effect of demographic changes. Four indicators of
demographic change namely, population growth, old age dependency ratio, working age
population ratio and young age dependency ratio are used.
Our empirical analysis is comprised of four steps:
(i) Direct impact of demographic changes on economic growth is estimated,
(ii) Indirect impact computed by estimating the direct impact of each demographic
indicator on capital stock, and analysing the impact of demographically
induced capital stock on economic growth,
(iii) Computing the indirect impact by multiplying the former and the later
coefficients.
(iv) Total impact is computed by summing the direct and the indirect impacts.
(v) The analysis is based on Fully Modified OLS technique.
Results have shown that the direct impact of each indicator of demographic change
is different from its indirect effect. Among the focused demographic indicators, young
age and old age dependency have an adverse impact on economic growth through the
direct and indirect channels both. It is worth noting that old age dependency has a larger
direct and indirect effect on economic growth. Interestingly, the direct impact of
population growth on economic growth is positive but the indirect impact is negative,
implying that population growth reduces physical capital through a decrease in savings.
However, the working-age population ratio increases economic growth through both the
direct and indirect impacts.
The total impact is higher, compared to direct impact, pointing towards the
importance of studying the mediating role of physical capital in determining the
impact of demographic changes on economic growth, without which the results may
be misleading. The previous works tend to downplay the effect of population growth
on economic development, which does not describe the urgency of the situation in
Pakistan.
Demographic Changes and Economic Growth 171
Firstly, the direct impact of old age dependency is more pronounced when
compared with other indicators of demographic change. This highlights the insufficiency
of publicly provided safety nets for the elderly, putting the burden of their care squarely
on the shoulders of the working age population. As a result, we see that the impact of old
aged dependency is rather high while the coefficient of working age population ratio is
quite small. Further, the time cost of caring for the elderly may render a significant
portion of the working age population unable to participate in the labour market, leading
to reduced impact on economic growth. This signifies the need for government assistance
in the form of pensions and subsidized healthcare provisions. In addition, subsidised at-
home care facilities would enable labour force participation, contributing to economic
growth.
The comparison of direct and indirect impact of population growth signifies that
the direct impact in itself may be misleading, but once assessed through its negative
influence on capital stock, the problem becomes more pronounced. This signifies the
need to cater for the population explosion and its adverse impact through reducing birth
rates. Policies to encourage family planning and birth control should be put in place.
Increasing the opportunity cost of bearing children, instituting compulsory universal
education, facilitating female labour force participation, penalising negligent parenthood
and child marriages are additional methods to discourage large families. Most of these are
already part of the current policy framework of the country but our results demonstrate a
gross implementation gap.
Finally, Pakistan has the opportunity to capitalise on a bulging working age
population that is being squandered for various reasons. Only by allotting due priority to
the issue will the government be able to derive the potential benefits from a fortuitous
situation. Given the results of the study and the 2017 census, the government should
devise effective policies to reduce population growth, which will reduce young age
dependency ratios. Moreover, to reap the benefits of the increasing working age
population ratio in the form of higher economic growth, more employment opportunities
should be created.
Table A-1
Summary of the Literature Review
Authors Study Objective Sample/Period Results
Malmberg (1994) Analyse the impact of age structures
on economic growth and sources of
growth
Sweden/
1950-89
Shifts in age structure explain Swedish economic
growth and there exists hump shaped relationship
between age groups and savings
Barro (1991) Analyse the impact of economically
active population on income growth
98 countries/
1960-85
Growth rate of economically active population has
positive impact on real GDP per capita growth
ADB (1997) Analyse the impact of economically
active population on income growth
East and South East Asian
Countries/
1965-92
Growth rate of economically active population has
positive impact on income growth
Bloom and
Williamson (1998)
Study the impact of demographic
variables on economic growth through
accounting effect and behavioural
effect
78 countries/
1965-90
Growth rates of population and working age population
has respective negative and positive impacts on GDP
per capita growth. While population under 15 is also
having negative impacts on income growth
Bloom et al. (2001) Study the relationship between the
economic growth and the demographic
transition by focusing on various
regions
Case studies of population
change and growth for East
Asia, Japan, North America
and Western Europe, South-
central and Southeast Asia
East Asian miracle can be explained by the
demographic transition of East Asian countries
Kelley and Schmidt
(2005)
Focuses on population’s role in
economic growth by developing a
model for output per worker growth
1960-95, 86 countries Declining births and declining deaths have contributed
to rise in per capita income growth across the World,
specifically, in Asia and Europe.
Prskawetz et al.
(2007)
Impact of working age population ratio
and youth dependency ratio on growth
rate of output per worker
1965-90, 97 countries Changes in age structures have important effects on
economic growth
Lindh and
Malmberg (2009)
Relationship between age structures
and economic growth in EU15
countries
EU 15 countries, 1950-2004 Variations in the age distribution of the population has
significant effect on economic growth and a hump
shaped relationship exist between the two variables
Continued—
Table A-1—(Continued)
Choudhry and
Elhorst (2010)
Analyse the impact of age dependency
ratios on per capita income growth
70 countries/1961-2003 and
Pakistan
negative impact of old and child age dependency ratios
on per capita income growth in cross-country analysis,
while, population dynamics explain 25% of changes in
per capita GDP growth in Pakistan
Hussain et al.
(2009)
Impact of demographic variables on
economic growth
Pakistan/1972-2006 infant mortality rate and total fertility rate are having a
negative impact on GDP growth
Iqbal et al. (2015) Relationship between demographic
transition and economic growth in the
short and long run
Pakistan/1974-2011 positive impact of demographic transition on economic
growth in the long-run but negative impact in the short-
run
Park and Shin
(2011)
relationship between population
ageing on savings, capital accumu-
lation, labour force participation and
total factor productivity
12 Asian economies/1981-2010 Positive relationship between population growth and
savings and in future population ageing will have
adverse impact on economic performance
Asongu (2011) Relationship between population
growth and investment dynamics
Individual time-series analysis
of African countries and for 38
African countries/1977-2007
In the long-run population growth has significant
and sizeable effects on different types of
investments: it can sometimes decrease or increase
foreign, public, private and domestic investments in
different countries.
Goyal (2004) Relationship between population age
structure and net outflows from the
stock market and stock market returns
US/1926-198 Outflows are positively related with proportion of old
age people and changes in proportion of middle age
population negatively affect the outflows.
Batini et al. (2006) Impact of demographic transition over
the next 80 years
US, Japan and other industrial
and developing countries
In advanced countries, population ageing will reduce
per capita income growth while, in developing
countries increase in working population can increase
per capita income growth. Demographic variables have
strong effect on savings, investment and capital flows
Bosworth and
Chodorow-Reich
(2006)
Relationship between population
ageing and savings and investment
85 countries/1960-2005 Significant impact of population ageing on national
rates of saving and investment but impact is different
for different countries
174 Jehan and Khan
Table A-2
Estimates of Unit Root Test
Variable Level 1st Diff Decision
GDP –0.700
(–3.497)
–6.260
(–3.498)
I(1)
GFCF
–1.938
(–3.498)
–4.494
(–3.500)
I(1)
LEMP
0.626
(–2.921)
–7.526
(–2.922)
I(1)
TO
–2.456
(–2.926)
–7.736
(–2.928)
I(1)
FDI
2.527
(–2.951)
–5.309
(–2.945)
I(1)
LRER
–1.125
(–2.917)
–6.462
(–2.919)
I(1)
GFCF_OADR –2.500
(–2.945)
–4.158
(–2.935)
I(1)
GFCF_PG –2.524
(–2.935)
–4.521
(–2.935)
I(1)
GFCF_YADR –2.103
(–2.935)
–3.983
(–2.935)
I(1)
IR –2.547
(–2.916)
–7.218
(–2.917)
I(1)
LCPI 0.069
(–2.919)
–3.348
(–2.919)
I(1)
GEGDP –1.989
(–2.916)
7.118
(–2.917)
I(1)
POPG –1.595
(–2.919)
–1.697
(–1.948)
I(1)
OADR –2.188
(–3.498)
–3.781
(–3.500)
I(1)
YADR –0.555
(–1.947)
–2.391
(–1.948)
I(1)
WAPOP –2.279
(–2.924)
–2.941
(–2.925)
I(1)
DC –2.541
(–3.508)
–6.098
(–3.499)
I(1)
REFERENCES
Ahituv, A. (2001). Be fruitful or multiply: On the interplay between fertility and
economic development. Journal of Population Economics, 14(1), 51–71.
Ali, S., Ali, A., & Amin, A. (2013). The impact of population growth on economic
development in Pakistan. Middle-East Journal of Scientific Research, 18:4, 483–491.
An, C., & Jeon, S. (2006). Demographic changes and economic growth in Korea. Paper
presented at the APEA Conference 2006.
Demographic Changes and Economic Growth 175
Anwer, M. S., & Sampath, R. K. (1999). Investment and economic growth. In Western
Agricultural Economics Association Annual Meeting, July 11-14, 1999, Fargo, ND.
Ashraf, Q. H., Weil, D. N. & Wilde, J. (2013). The effect of fertility reduction on
economic growth. Population and Development Review, 39(1), 97–130.
Asian Development Bank (1997). Emerging Asia: Changes and Challenges. Manila.
Asongu, S. A. (2011). Long-term effects of population growth on aggregate investment
dynamics: Selected country evidence for Africa. African Governance and
Development Institute. (Working Paper No.001).
Ayyoub, M., Chaudhry, I. S., & Farooq, F. (2011). Does inflation affect economic
growth? The case of Pakistan. Pakistan Journal of Social Sciences (PJSS), 31(1), 51-
64.
Bakshi G. S. & Z. Chen (1994). Baby boom, population aging, and capital
markets. Journal of Business, 67(9), 165–202.
Barro, R. J. & Sala-i-Martin X. (2004). Economic Growth. London: MIT Press.
Barro, R. J., & Lee, J. W. (1993). International comparisons of educational attainment.
Journal of Monetary Economics, 32(3), 363–394.
Barro, R. J. (1991). Economic growth in a cross section of countries. The Quarterly
Journal of Economics, 106(2), 407–443.
Batini N., Callen, T. & McKibbin, W. (2006). The global impact of demographic change.
International Monetary Fund. (IMF Working Paper WP/06/9).
Bloom, D. E. & Freeman, R. B. (1986). The effects of rapid population growth on labour
supply and employment in developing countries. Population and Development
Review, 12(3), 81–414.
Bloom, D. E. & Williamson, G. (1998). Demographic transitions and economic miracles
in emerging Asia. World Bank Economic Review, 12(3), 419–55.
Bloom, D. E., & Finlay, J. E. (2009). Demographic change and economic growth in Asia.
Asian Economic Policy Review, 4(1), 45–64.
Bloom, D. E. & Finlay, J. E. (2009). Demographic change and economic growth in
Asia. Asian Economic Policy Review, 4(1), 45–64.
Bloom, D. E., Canning, D. & Sevilla, J. (2001). Economic growth and the demographic
transition. National Bureau of Economic Research. (NBER Working Paper No.
w8685).
Borensztein, E., De Gregorio, J., & Lee, J. W. (1998). How does foreign direct
investment affect economic growth? Journal of International Economics, 45(1), 115–
135.
Boserup, E. (1965). The condition of agricultural growth. The economics of agrarian
change under population pressure. London: Allan and Urwin.
Bosworth, B. & Chodorow-Reich, G. (2006). Saving and demographic change: The
global dimension. Centre for Retirement Research at Boston College. (Working
Papers 2007-02).
Brander, J. A. & Dowrick, S. (1994). The role of fertility and population in economic
growth. Journal of Population Economics, 7(1), 1–25.
Choudhry, M. T. & Elhorst, J. P. (2010). Demographic transition and economic growth in
China, India and Pakistan. Economic Systems, 34(1), 218–236.
176 Jehan and Khan
Choudhry, M. T. and Elhorst, J. P. (2010). Demographic transition and economic growth
in China, India and Pakistan. Economic Systems, 34(3), 218–236.
Coale, A. J. & Hoover, E. M. (1958). Population growth and economic development.
Princeton University Press.
d’Albis, H. (2007). Demographic structure and capital accumulation. Journal of
Economic Theory, 132(1), 411–434.
Dickey, A. & A. Fuller (1979). Distribution of the estimators for autoregressive time
series with a unit root. Journal of the American Statistical Association, 74(366a),
427–431.
Din, M. U., Ghani, E., & Siddique, O. (2003). Openness and economic growth in
Pakistan. The Pakistan Development Review, 42(4 Part II), 795–807.
Durr-e-Nayab (2008). Demographic dividend or demographic threat in Pakistan? The
Pakistan Development Review, 47(1), 1–26.
Frankel, J. A., & Romer, D. (1999). Does trade cause growth? The American Economic
Review, 89(3), 379–399.
Gerald, M. & Meier, M. G. (1995) Leading issues in economic development. New York:
Oxford University Press.
Goyal, A. (2004). Demographics, stock market flows, and stock returns. Journal of
Financial and Quantitative Analysis, 39(1), 115–142.
Halkos, G. & Paizanos, E. (2014). Exploring the effect of economic growth and
government expenditure on the environment. Ecological Economics, 91, 48–56
Hussain, S. & Malik, S. (2011). Inflation and economic growth: Evidence from Pakistan.
International Journal of Economics and Finance, 3(5), 262.
Hussain, S., Malik, S. & Hayat, M. K. (2009). Demographic transition and economic
growth in Pakistan. European Journal of Scientific Research, 31(3), 491–499.
Hyung, J. (2013). An analysis on the effect of old age dependency ratio on domestic
saving rate (Doctoral dissertation, Thesis, Department of Economics, University of
California, Berkely).
Iqbal, K., Yasmin, N. & Yaseen, M. R. (2015). Impact of demographic transition on
economic growth of Pakistan. Journal of Finance and Economics, 3(2), 44–50.
Isaksson A. (2007). Determinants of total factor productivity: A literature
review. Research and Statistics Branch, UNIDO. (Staff Working Paper 02). Retrieved
at https://open.unido.org/api/documents/4812034/download/Determinants%20of%20
total%20factor%20productivity%20-%20a%20literature%20review
Kelley, A. C., & Schmidt, R. M. (2005). Evolution of recent economic-demographic
modelling: A synthesis. Journal of Population Economics, 18(2), 275–300.
Kelley, A. C. (1988). Economic consequences of population change in the third
world. Journal of Economic Literature, 26(4), 1685–1728.
Kelly, A. (2001). The population debate in historical perspective: Revisionism revised. In
Birdsall, N., Kelley, A., & Sinding, S. (eds.) Population matters: Demography,
growth, and poverty in the developing world. pp. 24–54. Oxford University Press.
King, R. G. & Levine, R. (1993). Finance and growth: Schumpeter might be right. The
Quarterly Journal of Economics, 108(3), 717–737.
Kogel, T. (2003). Youth dependency and total factor productivity. Journal of
Development Economics, 76(1),147–173.
Demographic Changes and Economic Growth 177
Krugman, P. R. (1979). Increasing returns, monopolistic competition, and international
trade. Journal of international Economics, 9(4), 469–479.
Kuznets, S., (1960). Population change and aggregate output. In demographic and
economic change in developed countries (pp. 324–351). Columbia University Press.
Lee, R. and Mason, A. (2010). Fertility, human capital, and economic growth over the
demographic transition. European Journal of Population, 26(2),159–182.
Lindh, T. & Malmberg, B. (2009). European union economic growth and the age
structure of the population. Economic Change and Restructuring, 42(3), 159–187.
Lopez-Bazo, E., & Moreno, R. (2008). Does human capital stimulate investment in
physical capital? Evidence from a cost system framework. Economic Modelling,
25(6), 1295.
Lucas, R. E. (1998). On the mechanics of economic development. Journal of Monetary
Economics, 22, 3–42.
Malmberg, B. (1994). Age structure effects on economic growth—Swedish
evidence. Scandinavian Economic History Review, 42(3), 279–295.
Malthus, T. R. (1798). An essay on the principle of population, as it affects the future
improvement of society, with remarks on the speculations of Mr. Godwin, M.
Condorcet, and Other Writers. The Lawbook Exchange, Ltd.
Mankiw, N. G., Romer, D. & Weil, D. N. (1992). A contribution to the empirics of
economic growth. Quarterly Journal of Economics, 107 (2), 407–437.
McMahon, W. W. (2001). The impact of human capital on non-market outcomes and
feedbacks on economic development. The contribution of human and social capital to
sustained economic growth and well-being. Government of Canada, Hull, Quebec.
Meier, G. M. (1995). Leading issues in economic development. (6th ed). New York:
Oxford University Press.
Mencinger, J. (2003). Does foreign direct investment always enhance economic growth?
Kyklos, 56(4), 491–508.
Modigliani, F. & Brumberg, R. (1954). Utility analysis and the consumption function: An
interpretation of cross-section data. In Kenneth K. Kurihara (ed.) Post Keynesian
Economics. New Brunswick, NJ. Rutgers University Press. pp. 388–436.
Nguyen, M. T. (2008). Dynamic demographics and economic growth in Vietnam.
Journal of the Asia Pacific Economy, 14(4), 389–398.
Omran, M., & Bolbol, A. (2003). Foreign direct investment, financial development, and
economic growth: Evidence from the Arab countries. Review of Middle East
Economics and Finance, 1(3), 231–249.
Park, D. & Shin, K. (2011). Impact of population aging on Asia’s future growth.
Philippines: Asian Development Bank. (ADB Economic Working Paper Series No.
281).
Phillips, P. C. & Hansen, B. E. (1990). Statistical inference in instrumental variables
regression with I (1) processes. The Review of Economic Studies, 57(1), 99–125.
Prskawetz, A., Kögel, T., Sanderson, W.C. and Scherbov, S. (2007). The effects of age
structure on economic growth: An application of probabilistic forecasting to
India. International Journal of Forecasting 23(4), 587–602.
Romer, P. M. (1990, March). Human capital and growth: Theory and evidence. In Carnegie-
Rochester conference series on public policy 32, 251–286. North-Holland.
178 Jehan and Khan
Romer, P. M. (1994). The origins of endogenous growth. The Journal of Economic
Perspectives, 8(1), 3–22.
Rukhsana, K. & Shahbaz M. (2008). Remittances and poverty nexus: Evidence from
Pakistan. Oxford Business & Economics Conference Program.
Sala-i-Martin, X. (1997). I just ran two million regressions. The American Economic
Review, 87(2), 178–183.
Sala-i-Martin, X., Doppelhofer, G. and Miller, R. I. (2004). Determinants of Long-term
Growth: A bayesian averaging of classical estimates (BACE) approach. The American
Economic Review, 94(4), 813–835.
Salahuddin, M., R. Islam, & S. Salim (2009). Determinants of investment in Muslims
developing countries: An empirical investigation. Int. Journal of Economics and
Management, 31(1), 100–129.
Simon J. L. (1981). Population: The ultimate resource. Princeton: Princeton University
Press.
Srinivasan, T. N. (1988). Population growth and economic development. Journal of
Policy Modeling, 10(1), 7–28.
Thuku, G. K. Gachanja, P. & Almadi, O. (2013) The impact of population change on
economic growth in Kenya. International Journal of Economics and Management
Science, 2(6), 43–60.
Todaro, M. P. & Smith, S. C. (1994). Economic development. Boston, Pearson Addison
Wesley.
Trimborn, T., & Prettner, K. (2012). Demographic change and R&D-based economic
growth: Reconciling theory and evidence.
Umer, F. (2014). Impact of Trade Openness on Economic Growth of Pakistan: An ARDL
Approach. Journal of Business & Economic Policy, 1(1).