57
DEMOGRAPHIC DIVIDEND IN INDIA:PROBLEMS AND PROSPECTS PROF. G. RAMACHANDRUDU
| Date post: | 14-Jan-2016 |
| Category: |
Documents |
| Upload: | aditiindrani |
| View: | 34 times |
| Download: | 1 times |
DEMOGRAPHIC DIVIDEND IN INDIA:PROBLEMS AND
PROSPECTS
PROF. G. RAMACHANDRUDU
The Demographic dividend is a rise in the rate of economic growth due to a rising share of working age people in a population. This usually occurs late in the demographic transition when the fertility rate falls and the youth dependency rate declines.
WHAT IS DEMOGRAPHIC DIVIDEND?
SOME EARLIER EXPERIENCES• The demographic dividend played a role in the
“economic miracles" of the East Asian Tigers and that the economic boom in Ireland in the 1990s (the Celtic tiger) was in part due to the legalization of contraception in 1979 and subsequent decline in the fertility rate.
• The Chinese economy has achieved 30 years of high growth since the launch of the reform and open-door policy in the late 1970s. Since 2000 in particular, China has established a position for itself as the world’s factory through the rapid expansion of its exports of manufactured goods. China has also attracted attention as the world’s market in recent years. Remittances from NRC’s are phenomenal and they pushed investments and hence growth rate.
CONDITIONALITY OF DEMOGRAPHIC DIVIDEND
The magnitude of the demographic dividend appears to be dependent on the ability of the economy to absorb and productively employ the extra workers , rather than be a pure demographic gift.
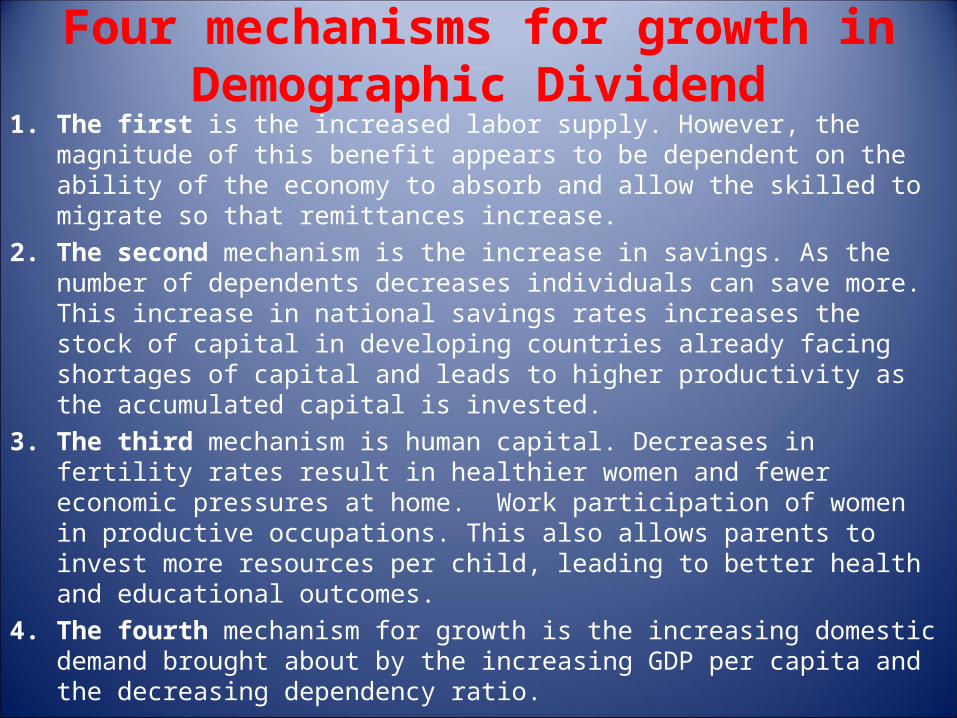
Four mechanisms for growth in Demographic Dividend
1. The first is the increased labor supply. However, the magnitude of this benefit appears to be dependent on the ability of the economy to absorb and allow the skilled to migrate so that remittances increase.
2. The second mechanism is the increase in savings. As the number of dependents decreases individuals can save more. This increase in national savings rates increases the stock of capital in developing countries already facing shortages of capital and leads to higher productivity as the accumulated capital is invested.
3. The third mechanism is human capital. Decreases in fertility rates result in healthier women and fewer economic pressures at home. Work participation of women in productive occupations. This also allows parents to invest more resources per child, leading to better health and educational outcomes.
4. The fourth mechanism for growth is the increasing domestic demand brought about by the increasing GDP per capita and the decreasing dependency ratio.

POPULATION TRENDS
POPULATION TRENDS
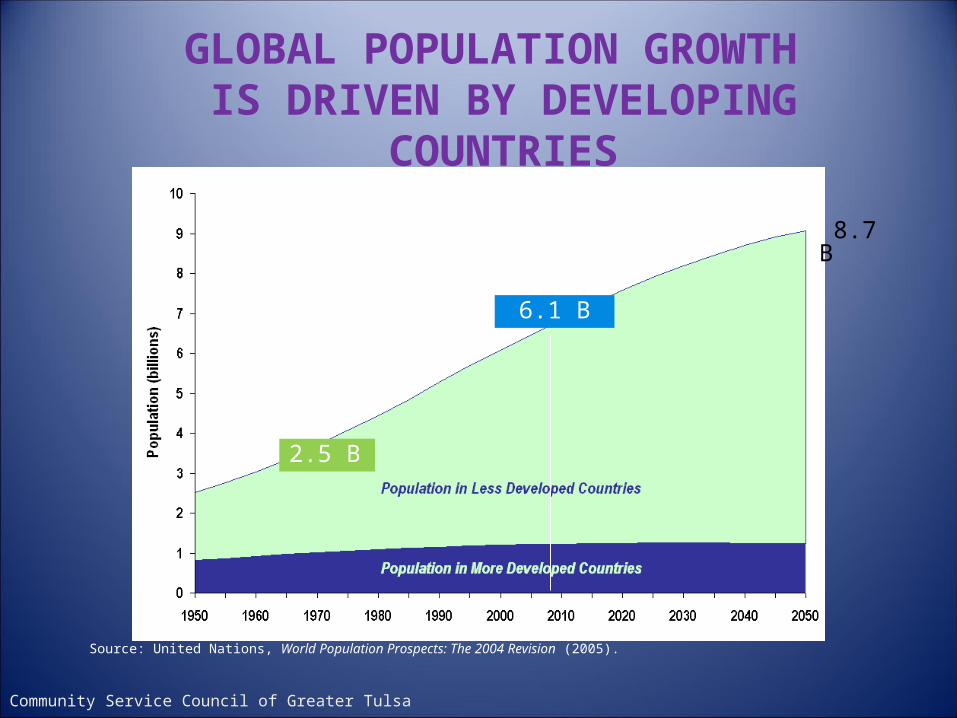
GLOBAL POPULATION GROWTH IS DRIVEN BY DEVELOPING
COUNTRIES
World Population 1950-2050.
Source: United Nations, World Population Prospects: The 2004 Revision (2005).
6.1 B
8.7 B
2.5 B
Community Service Council of Greater Tulsa
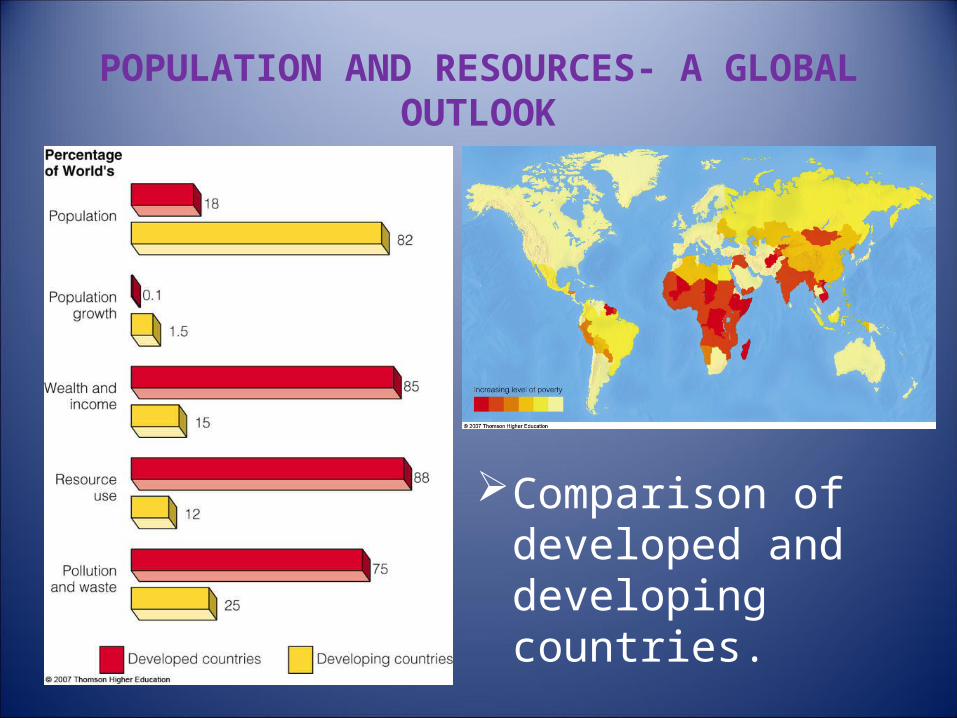
POPULATION AND RESOURCES- A GLOBAL OUTLOOK
Comparison of developed and developing countries.
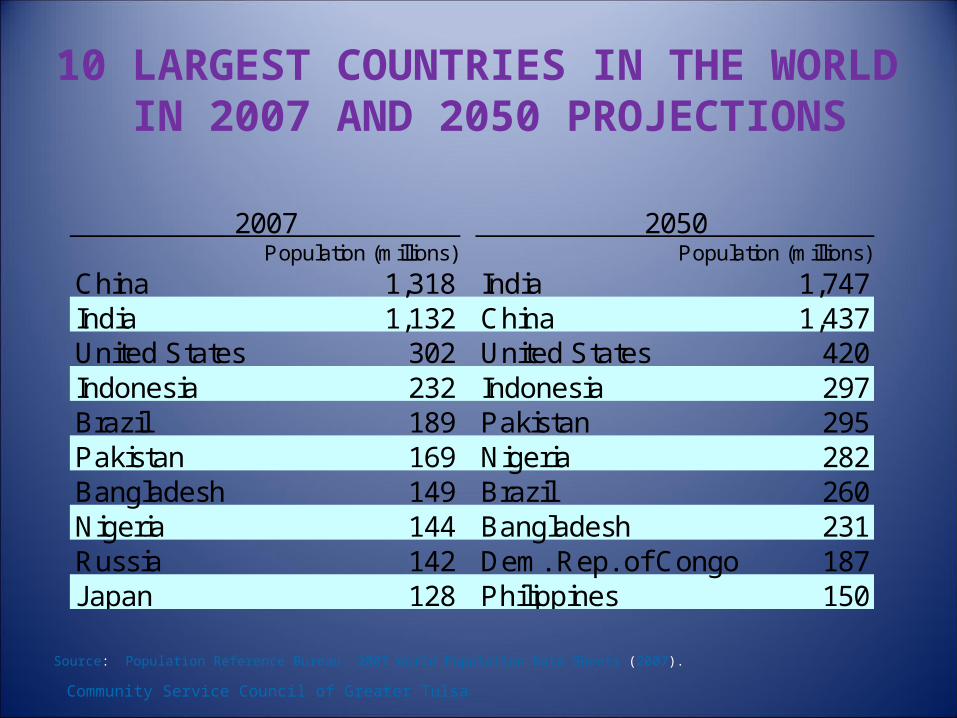
10 LARGEST COUNTRIES IN THE WORLD
IN 2007 AND 2050 PROJECTIONS
Population (millions) Population (millions)
China 1,318 India 1,747India 1,132 China 1,437United States 302 United States 420Indonesia 232 Indonesia 297Brazil 189 Pakistan 295Pakistan 169 Nigeria 282Bangladesh 149 Brazil 260Nigeria 144 Bangladesh 231Russia 142 Dem. Rep. of Congo 187Japan 128 Philippines 150
2007 2050
Source: Population Reference Bureau. 2007 World Population Data Sheets (2007).
Community Service Council of Greater Tulsa
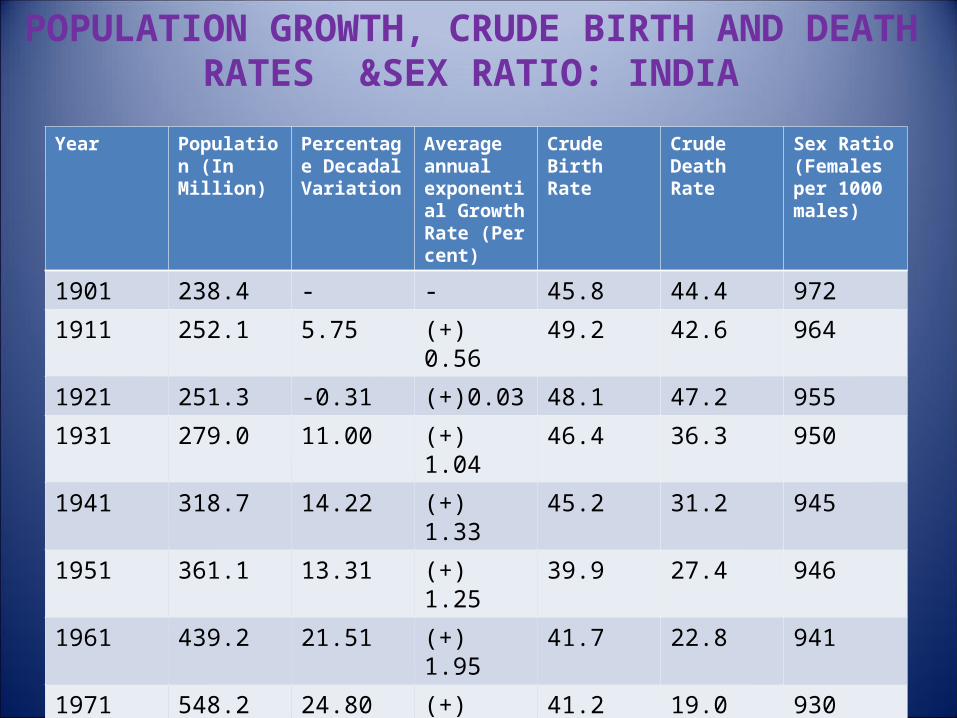
POPULATION GROWTH, CRUDE BIRTH AND DEATH RATES &SEX RATIO: INDIA
Year Population (In Million)
Percentage Decadal Variation
Average annual exponential Growth Rate (Per cent)
Crude Birth Rate
Crude Death Rate
Sex Ratio(Females per 1000 males)
1901 238.4 - - 45.8 44.4 972
1911 252.1 5.75 (+) 0.56 49.2 42.6 964
1921 251.3 -0.31 (+)0.03 48.1 47.2 955
1931 279.0 11.00 (+) 1.04 46.4 36.3 950
1941 318.7 14.22 (+) 1.33 45.2 31.2 945
1951 361.1 13.31 (+) 1.25 39.9 27.4 946
1961 439.2 21.51 (+) 1.95 41.7 22.8 941
1971 548.2 24.80 (+) 2.20 41.2 19.0 930
1981 683.3 24.66 (+) 2.22 37.2 15.0 934
1991 846.4 23.87 (+) 2.14 32.5 11.4 927
2001 1028.6 21.54 (+) 1.93 24.8 8.9 933
2011 1210.2 17.64 (+) 1.43 20.5 7.5 940
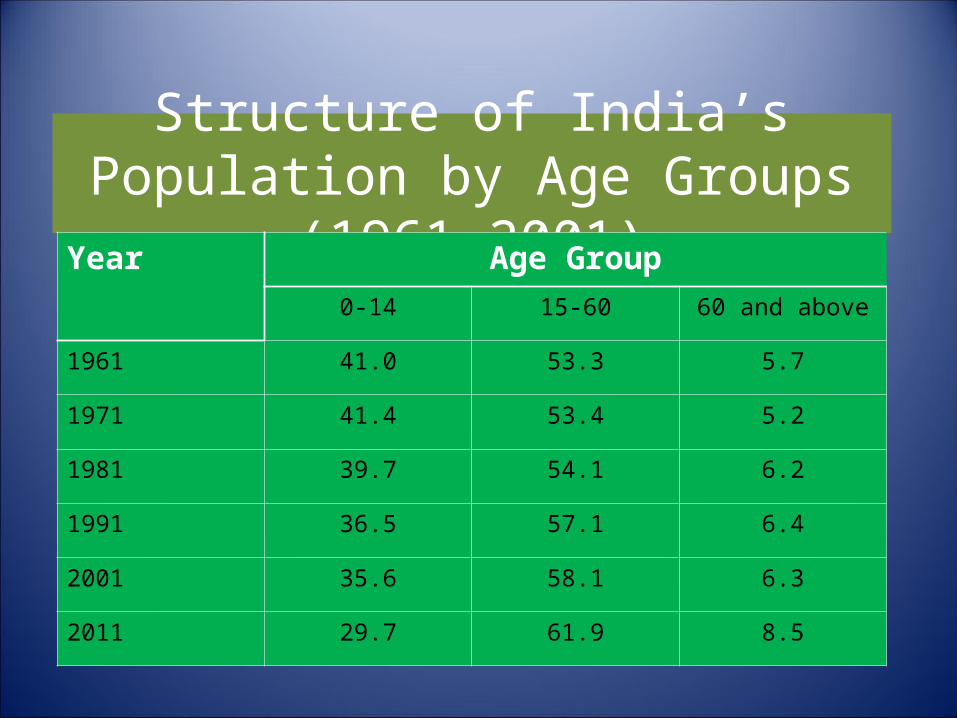
Structure of India’s Population by Age Groups (1961-2001)
Year Age Group0-14 15-60 60 and above
1961 41.0 53.3 5.7
1971 41.4 53.4 5.2
1981 39.7 54.1 6.2
1991 36.5 57.1 6.4
2001 35.6 58.1 6.3
2011 29.7 61.9 8.5
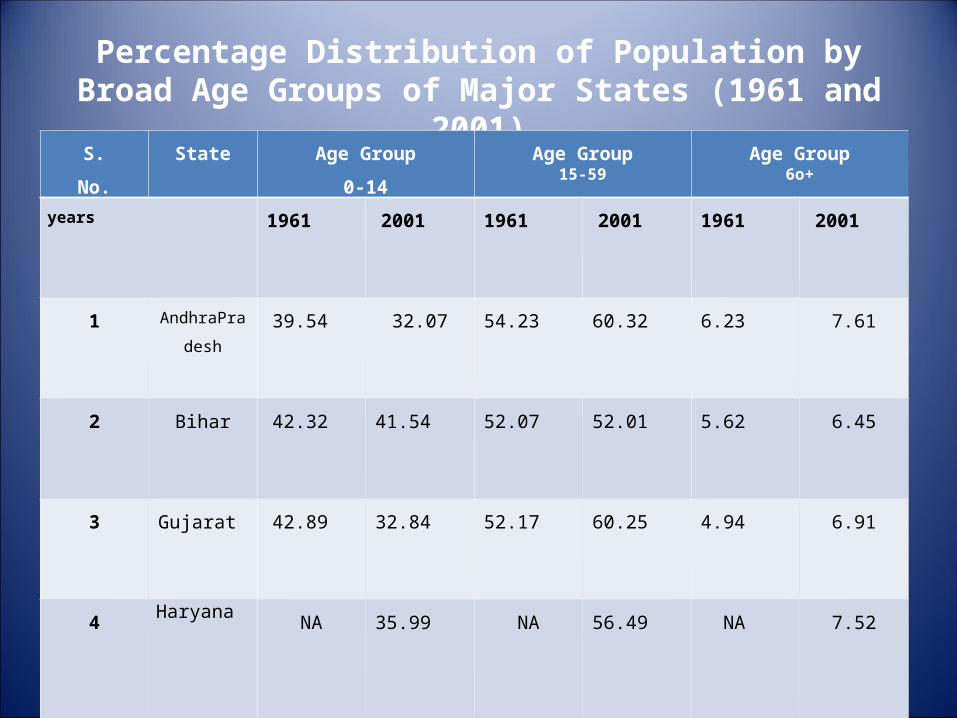
Percentage Distribution of Population by Broad Age Groups of Major States (1961 and 2001)
S.
No.
State Age Group
0-14
Age Group15-59
Age Group6o+
years 1961
2001 1961
2001 1961
2001
1 AndhraPrades
h
39.54 32.07 54.23 60.32
6.23 7.61
2 Bihar 42.32 41.54
52.07 52.01
5.62 6.45
3 Gujarat
42.89 32.84
52.17 60.25
4.94 6.91
4Haryana
NA 35.99
NA 56.49 NA 7.52
5Karnataka
42.16 31.91
52.11 60.45
7.3 7.69
6Kerala
42.64 26.08
51.53 63.44
5.84 10.48
7Madhya Pradesh
40.82 38.21
54.02 54.66
5.16 7.14
8Maharashtra
40.67 32.14
54.07 59.12
5.27 8.74
9Orissa
39.10 33.23
55.23 58.5
5.67 8.27
10Punjab
43.57 31.39
49.87 59.57
6.56 9.03
11Rajasthan
42.66 40.10 52.19 53.12 5.14 6.78
12Tamil Nadu
37.61 26.96 56.79 64.15
5.60 8.89
13Uttar Pradesh
40.50 40.83 53.22 52.1
6.29 7.07
14West Bengal
40.93 33.28 54.06 59.6
5.01 7.12
India
41.0 35.6 53.3 58.1
5.7 6.3

WHY POPULATION CONTROL?
POPULATION THEORIES
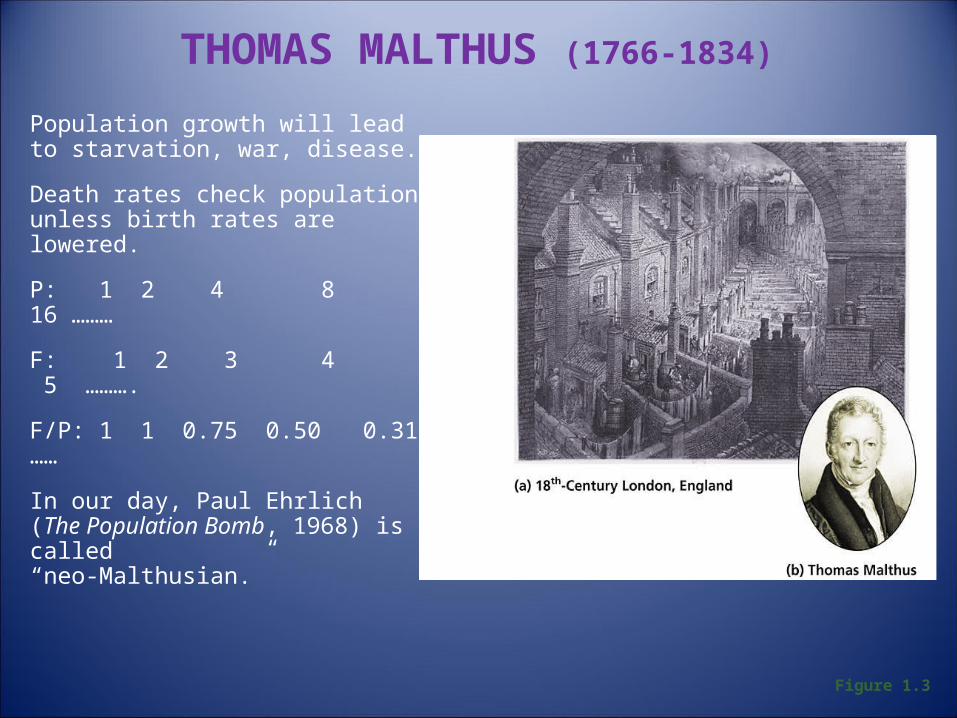
THOMAS MALTHUS (1766-1834)
Population growth will lead to starvation, war, disease.
Death rates check population unless birth rates are lowered.
P: 1 2 4 8 16 ………
F: 1 2 3 4 5 ……….
F/P: 1 1 0.75 0.50 0.31 ……
In our day, Paul Ehrlich (The Population Bomb, 1968) is called “neo-Malthusian.”
Figure 1.3
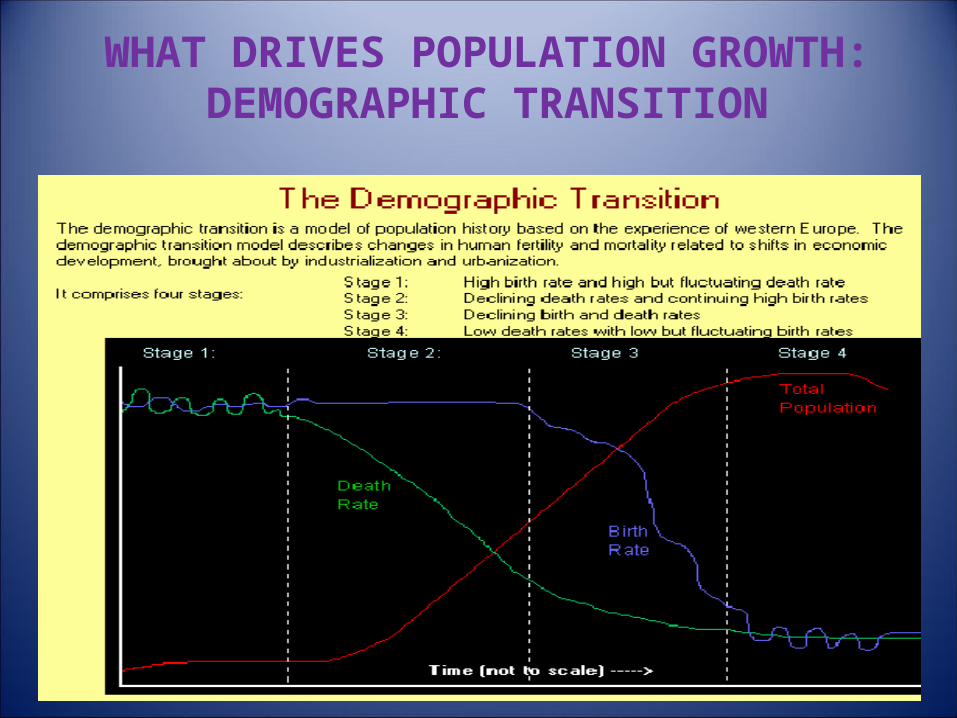
WHAT DRIVES POPULATION GROWTH:
DEMOGRAPHIC TRANSITION
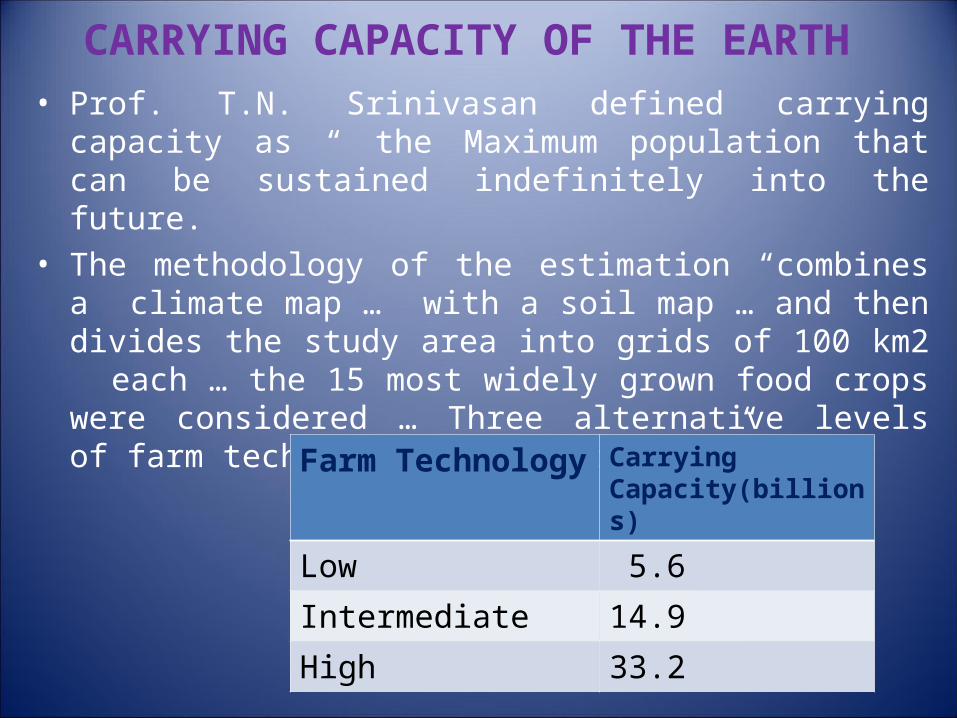
CARRYING CAPACITY OF THE EARTH• Prof. T.N. Srinivasan defined carrying capacity as “
the Maximum population that can be sustained indefinitely into the future.
• The methodology of the estimation “combines a climate map … with a soil map … and then divides the study area into grids of 100 km2 each … the 15 most widely grown food crops were considered … Three alternative levels of farm technology were postulated”.
Farm Technology
Carrying Capacity(billions)
Low 5.6
Intermediate 14.9
High 33.2
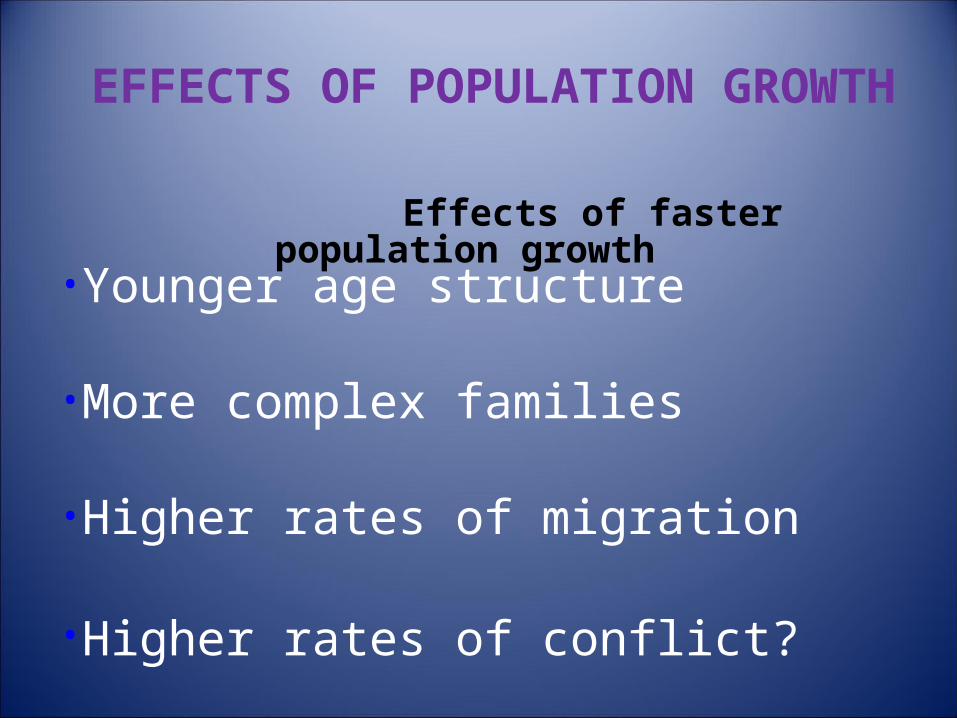
EFFECTS OF POPULATION GROWTH
Effects of faster population growth
•Younger age structure
•More complex families
•Higher rates of migration
•Higher rates of conflict?
DEMOGRAPHIC DIVIDEND IN INDIAPROBLEMS AND PROSPECTS OF
Demographic Dividend in India
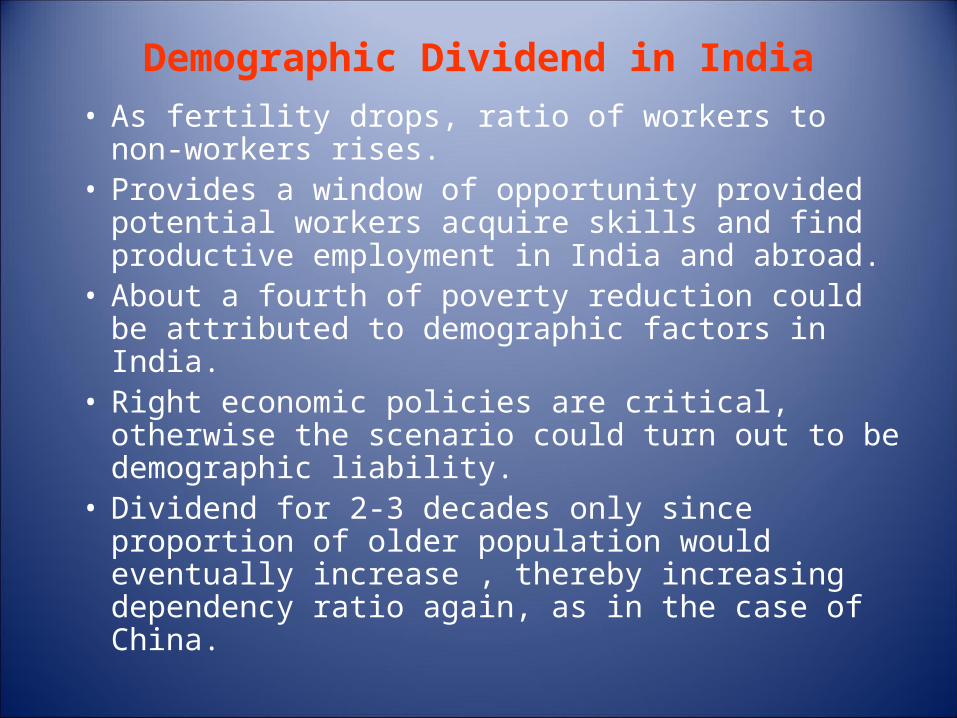
• As fertility drops, ratio of workers to non-workers rises.
• Provides a window of opportunity provided potential workers acquire skills and find productive employment in India and abroad.
• About a fourth of poverty reduction could be attributed to demographic factors in India.
• Right economic policies are critical, otherwise the scenario could turn out to be demographic liability.
• Dividend for 2-3 decades only since proportion of older population would eventually increase , thereby increasing dependency ratio again, as in the case of China.
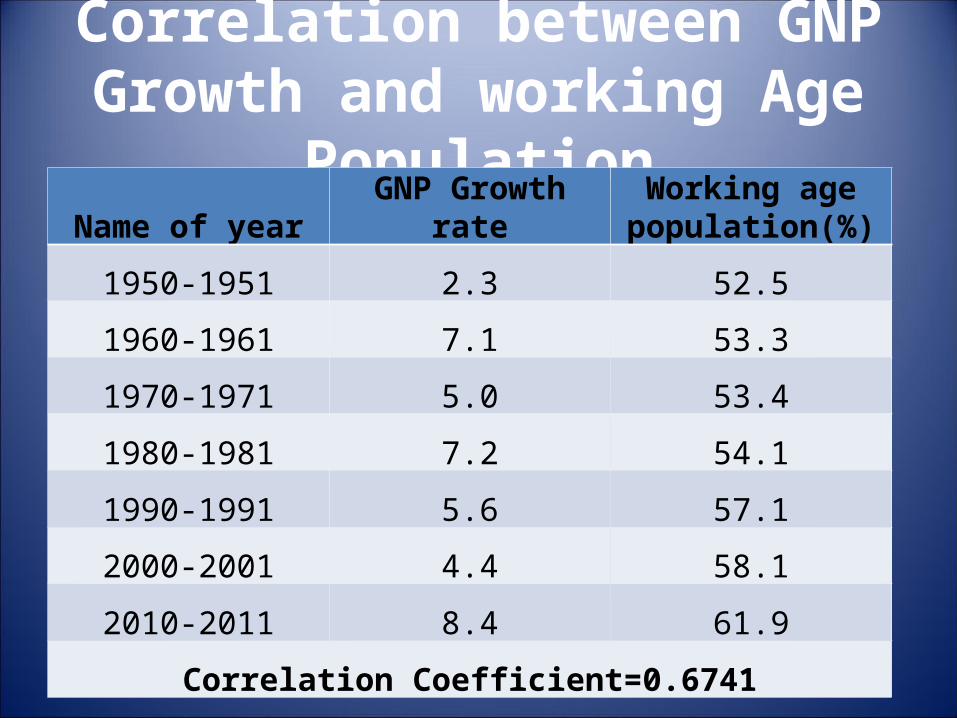
Correlation between GNP Growth and working Age Population
Name of year GNP Growth rateWorking age
population(%)
1950-1951 2.3 52.5
1960-1961 7.1 53.3
1970-1971 5.0 53.4
1980-1981 7.2 54.1
1990-1991 5.6 57.1
2000-2001 4.4 58.1
2010-2011 8.4 61.9
Correlation Coefficient=0.6741
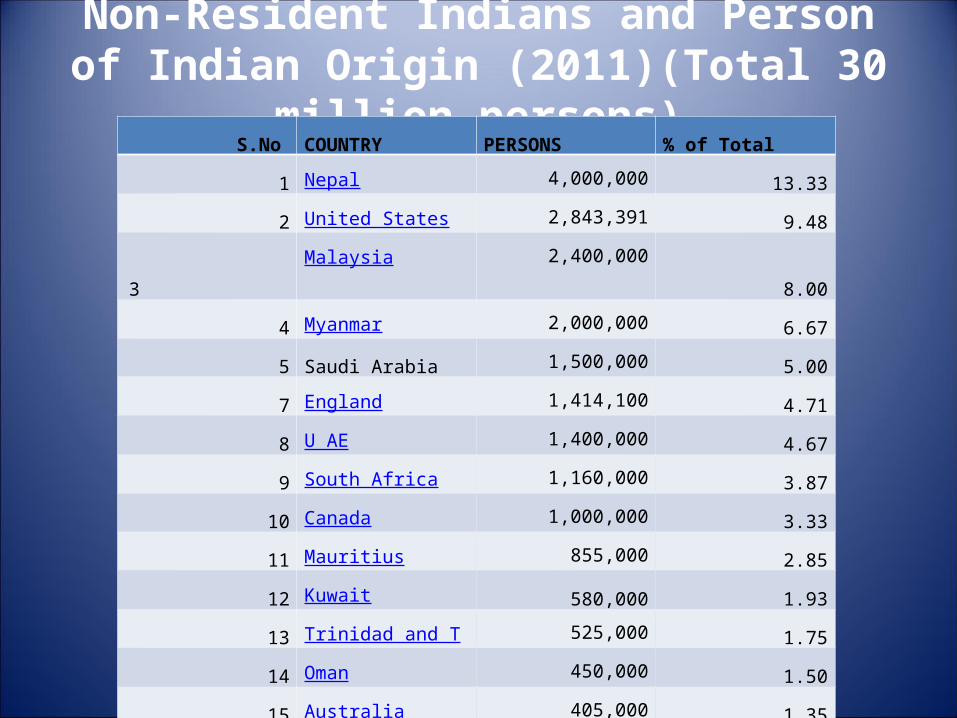
Non-Resident Indians and Person of Indian Origin (2011)(Total 30 million persons)
S.No COUNTRY PERSONS % of Total
1 Nepal 4,000,000 13.33
2 United States 2,843,391 9.48
3 Malaysia 2,400,000 8.00
4 Myanmar 2,000,000 6.67
5 Saudi Arabia 1,500,000 5.00
7 England 1,414,100 4.71
8 U AE 1,400,000 4.67
9 South Africa 1,160,000 3.87
10 Canada 1,000,000 3.33
11 Mauritius 855,000 2.85
12 Kuwait 580,000 1.93
13 Trinidad and Tobago 525,000 1.75
14 Oman 450,000 1.50
15 Australia 405,000 1.35
16 Singapore 400,000 1.33
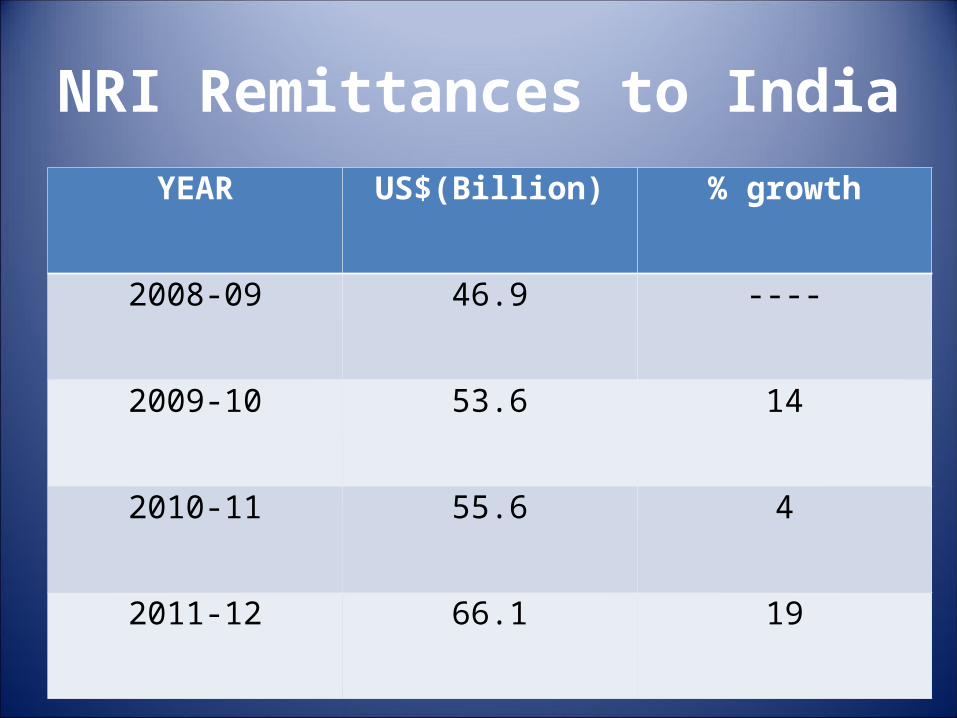
NRI Remittances to IndiaYEAR US$(Billion) % growth
2008-09 46.9 ----
2009-10 53.6 14
2010-11 55.6 4
2011-12 66.1 19
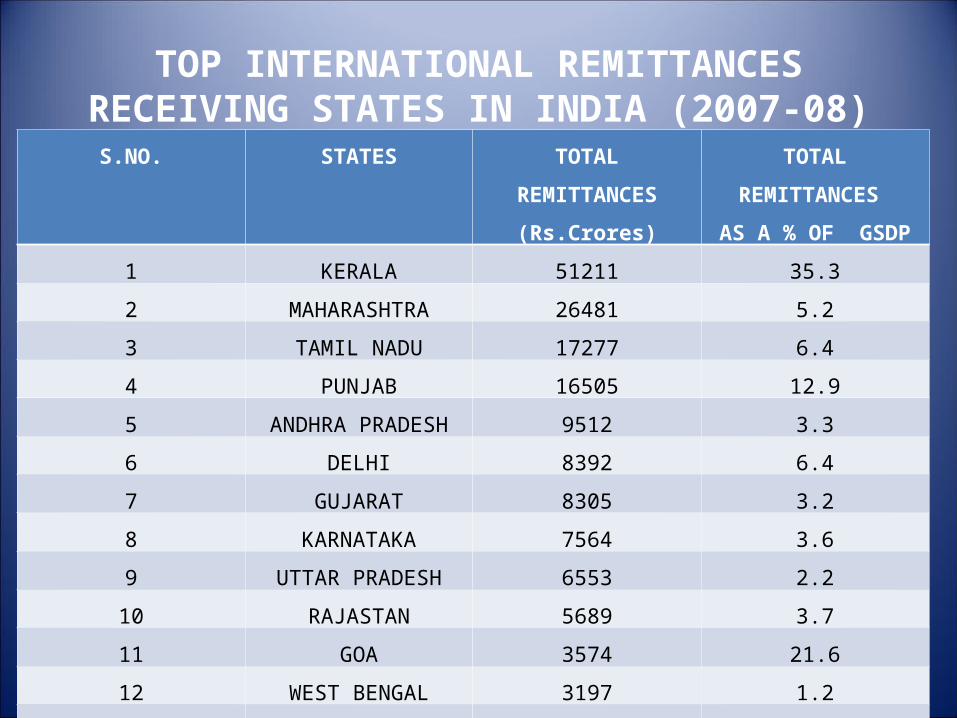
TOP INTERNATIONAL REMITTANCES RECEIVING STATES IN INDIA (2007-08)
S.NO. STATES TOTAL
REMITTANCES
(Rs.Crores)
TOTAL
REMITTANCES
AS A % OF GSDP
1 KERALA 51211 35.3
2 MAHARASHTRA 26481 5.2
3 TAMIL NADU 17277 6.4
4 PUNJAB 16505 12.9
5 ANDHRA PRADESH 9512 3.3
6 DELHI 8392 6.4
7 GUJARAT 8305 3.2
8 KARNATAKA 7564 3.6
9 UTTAR PRADESH 6553 2.2
10 RAJASTAN 5689 3.7
11 GOA 3574 21.6
12 WEST BENGAL 3197 1.2
ALL INDIA 174000 4.3
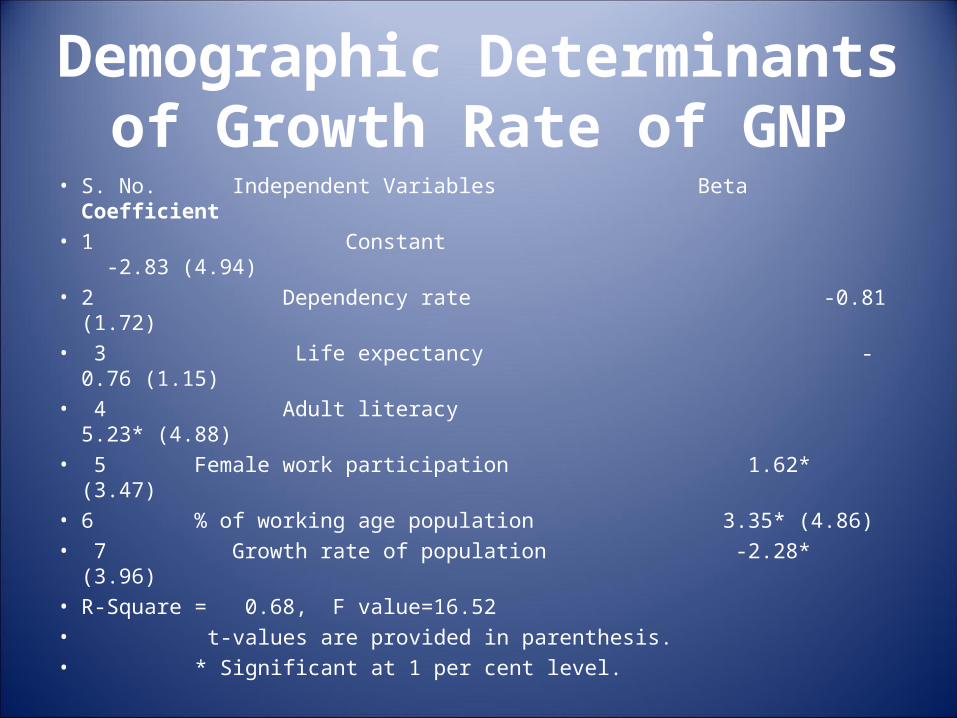
Demographic Determinants of Growth Rate of GNP
• S. No. Independent Variables Beta Coefficient• 1 Constant -2.83 (4.94)• 2 Dependency rate -0.81 (1.72)• 3 Life expectancy -0.76 (1.15)• 4 Adult literacy 5.23* (4.88)• 5 Female work participation 1.62* (3.47)• 6 % of working age population 3.35* (4.86)• 7 Growth rate of population -2.28* (3.96)• R-Square = 0.68, F value=16.52• t-values are provided in parenthesis. • * Significant at 1 per cent level.

INDIA’s FUTURE
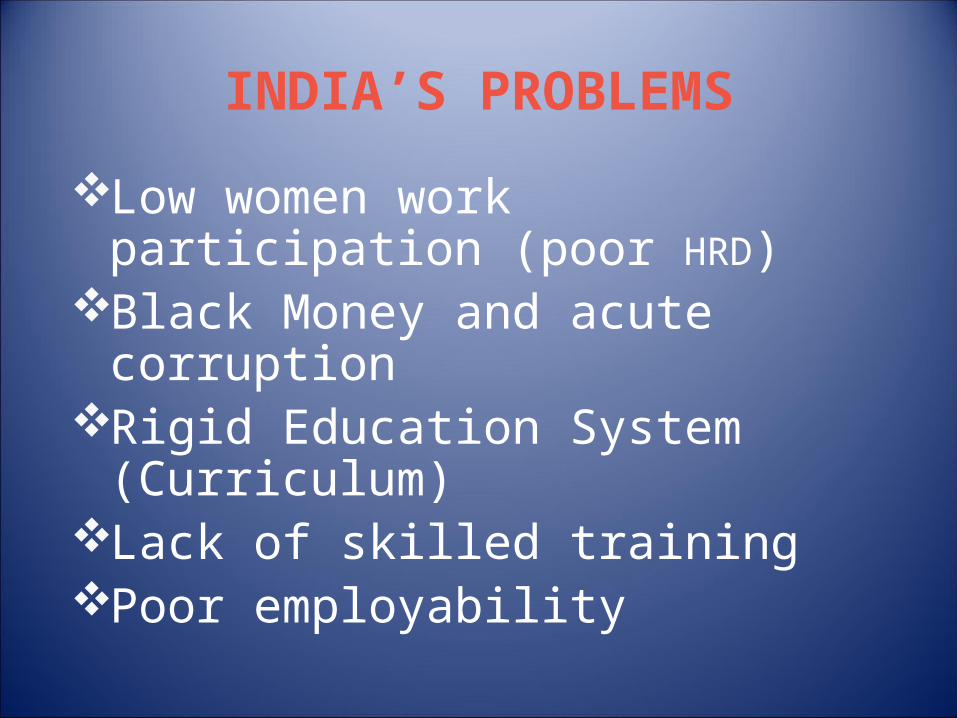
INDIA’S PROBLEMS
Low women work participation (poor HRD)
Black Money and acute corruptionRigid Education System
(Curriculum) Lack of skilled trainingPoor employability
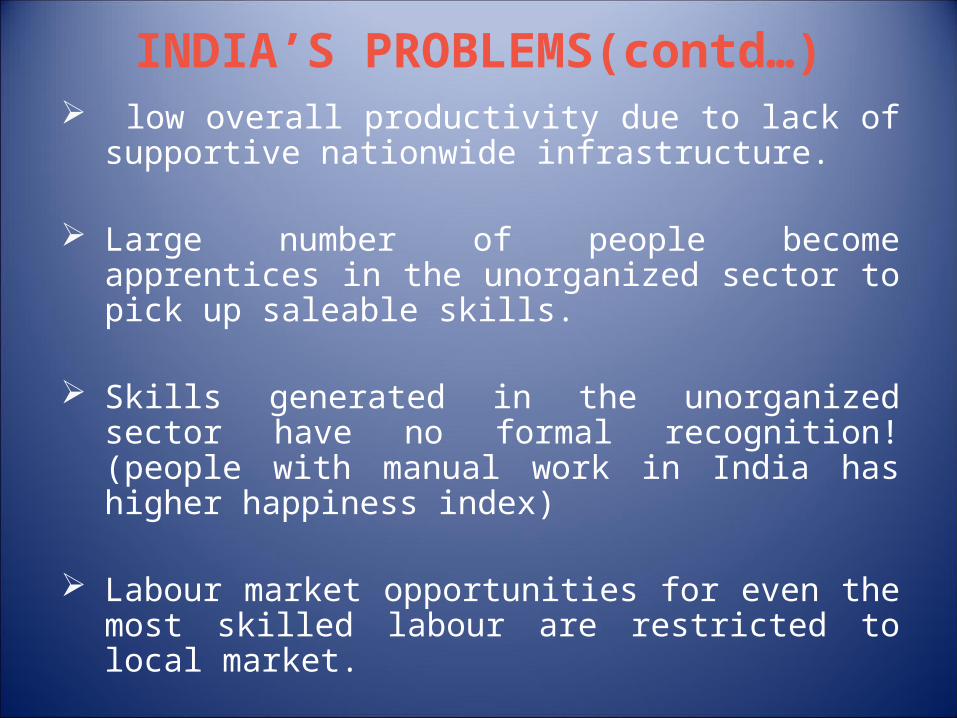
INDIA’S PROBLEMS(contd…) low overall productivity due to lack of
supportive nationwide infrastructure.
Large number of people become apprentices in the unorganized sector to pick up saleable skills.
Skills generated in the unorganized sector have no formal recognition! (people with manual work in India has higher happiness index)
Labour market opportunities for even the most skilled labour are restricted to local market.

INDIA'S ADVANTAGEDemographic and geographic Societal Building Block (family as an institution)English Language (largest number of English
speaking population)Affinity to mathematics and science subjectsCredible IT image (India is world leader)Steady Growth TrajectoryStrong will, enthusiasm and spirituality that gives
honesty & commitment to workforce.
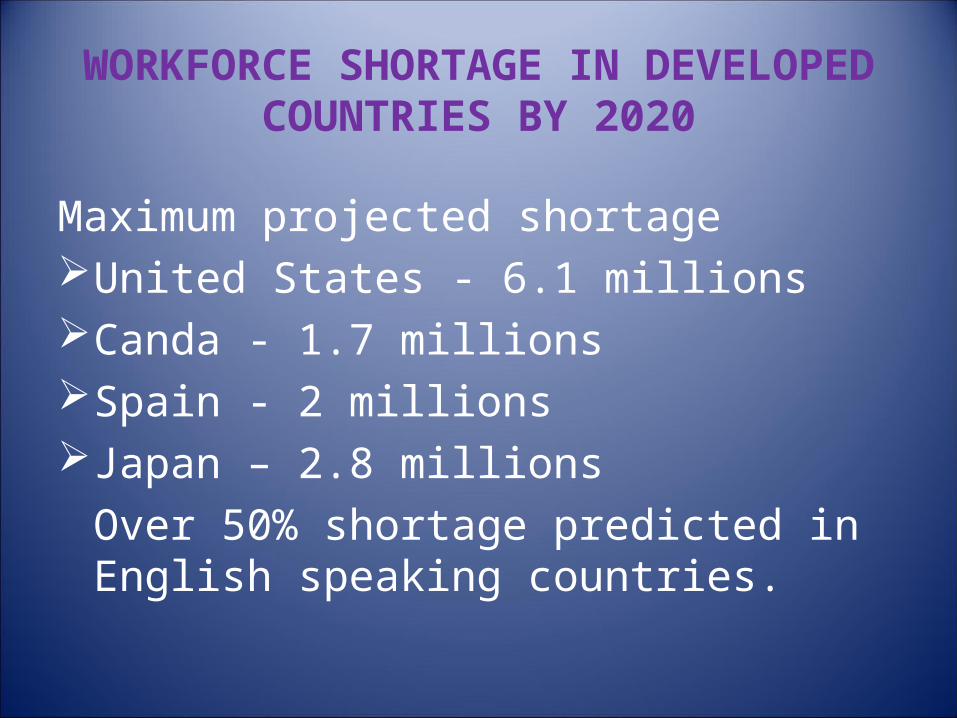
WORKFORCE SHORTAGE IN DEVELOPED COUNTRIES BY 2020
Maximum projected shortageUnited States - 6.1 millions Canda - 1.7 millionsSpain - 2 millionsJapan – 2.8 millions
Over 50% shortage predicted in English speaking countries.
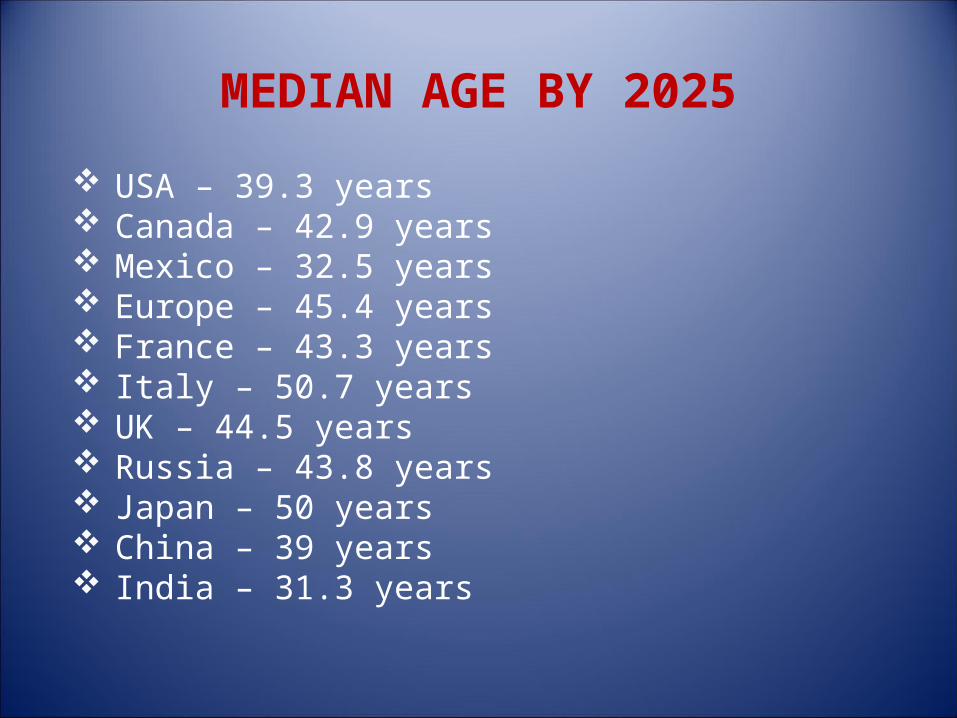
MEDIAN AGE BY 2025
USA – 39.3 years Canada – 42.9 years Mexico – 32.5 years Europe – 45.4 years France – 43.3 years Italy – 50.7 years UK – 44.5 years Russia – 43.8 years Japan – 50 years China – 39 years India – 31.3 years
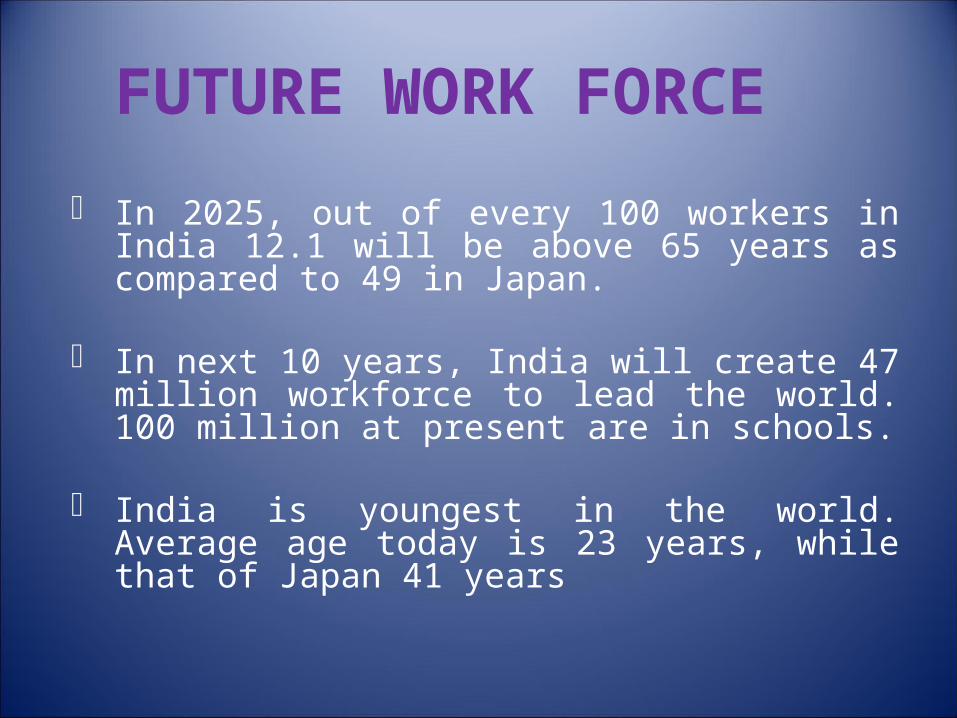
FUTURE WORK FORCE
In 2025, out of every 100 workers in India 12.1 will be above 65 years as compared to 49 in Japan.
In next 10 years, India will create 47 million workforce to lead the world. 100 million at present are in schools.
India is youngest in the world. Average age today is 23 years, while that of Japan 41 years
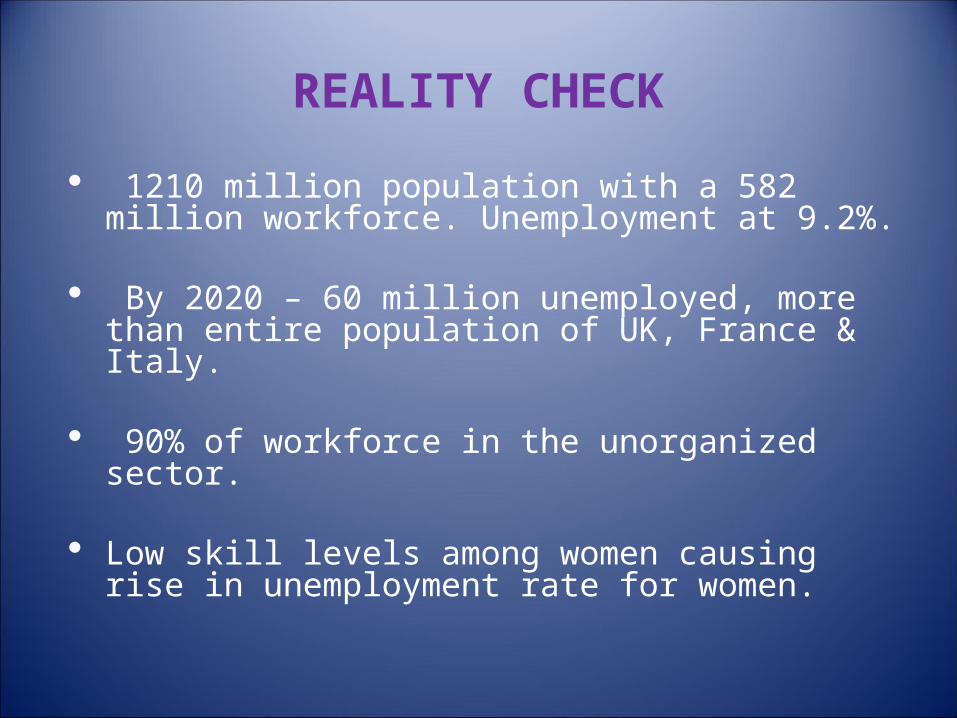
REALITY CHECK
1210 million population with a 582 million workforce. Unemployment at 9.2%.
By 2020 – 60 million unemployed, more than entire population of UK, France & Italy.
90% of workforce in the unorganized sector.
Low skill levels among women causing rise in unemployment rate for women.
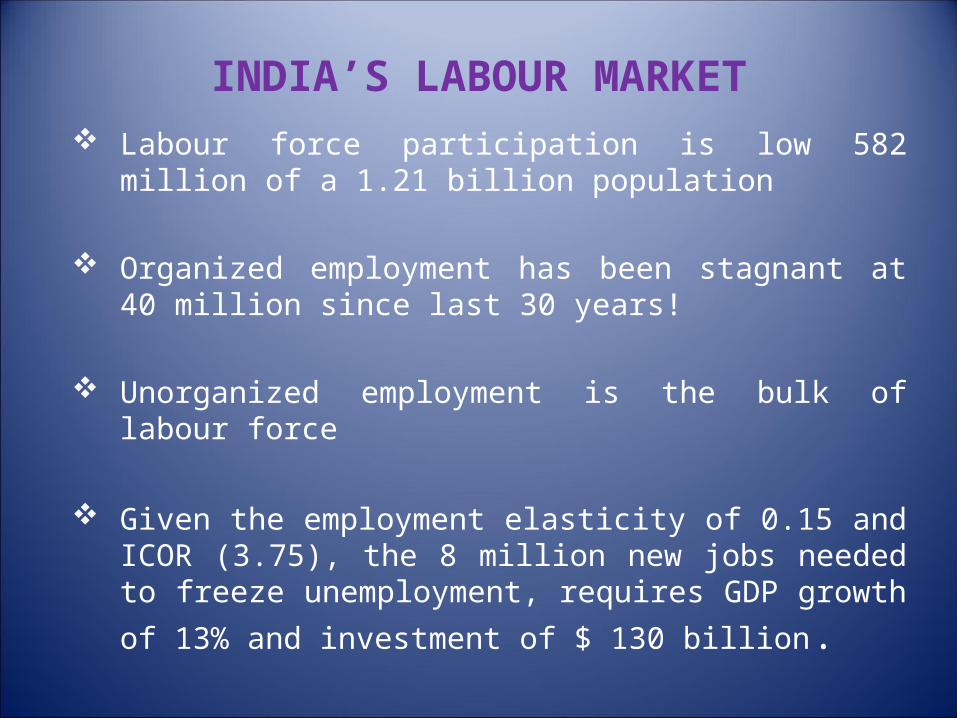
INDIA’S LABOUR MARKET Labour force participation is low 582 million of a 1.21 billion
population
Organized employment has been stagnant at 40 million since last 30 years!
Unorganized employment is the bulk of labour force
Given the employment elasticity of 0.15 and ICOR (3.75), the 8 million new jobs needed to freeze unemployment, requires GDP growth of 13% and investment of $ 130
billion.

What is the India story?
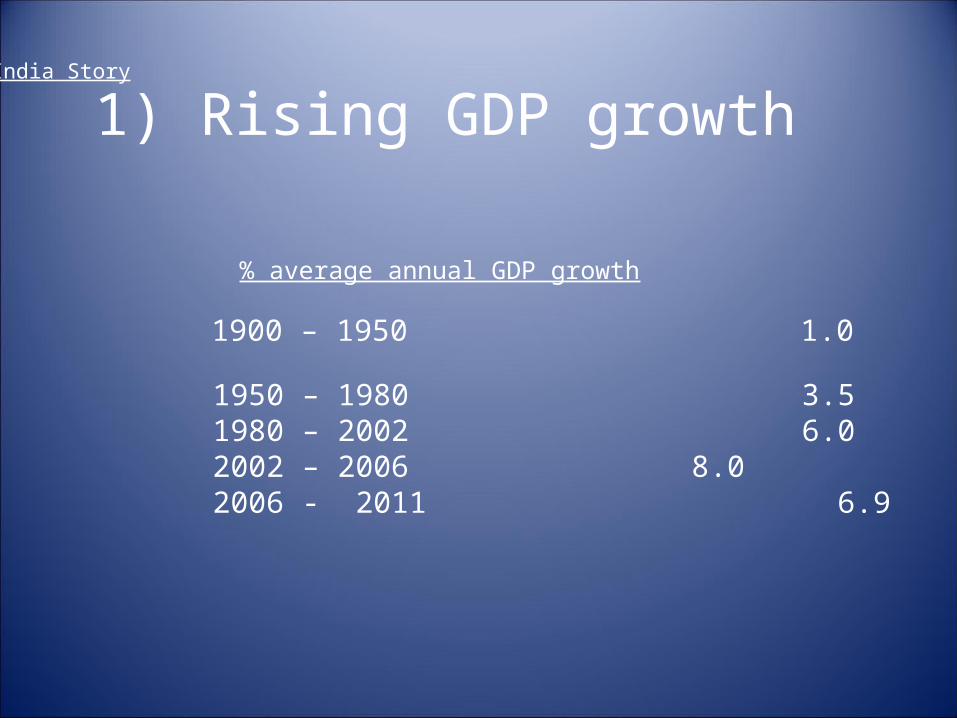
1) Rising GDP growth
% average annual GDP growth
1900 – 1950 1.0 1950 – 1980 3.5 1980 – 2002 6.0 2002 – 2006 8.0 2006 - 2011 6.9
India Story
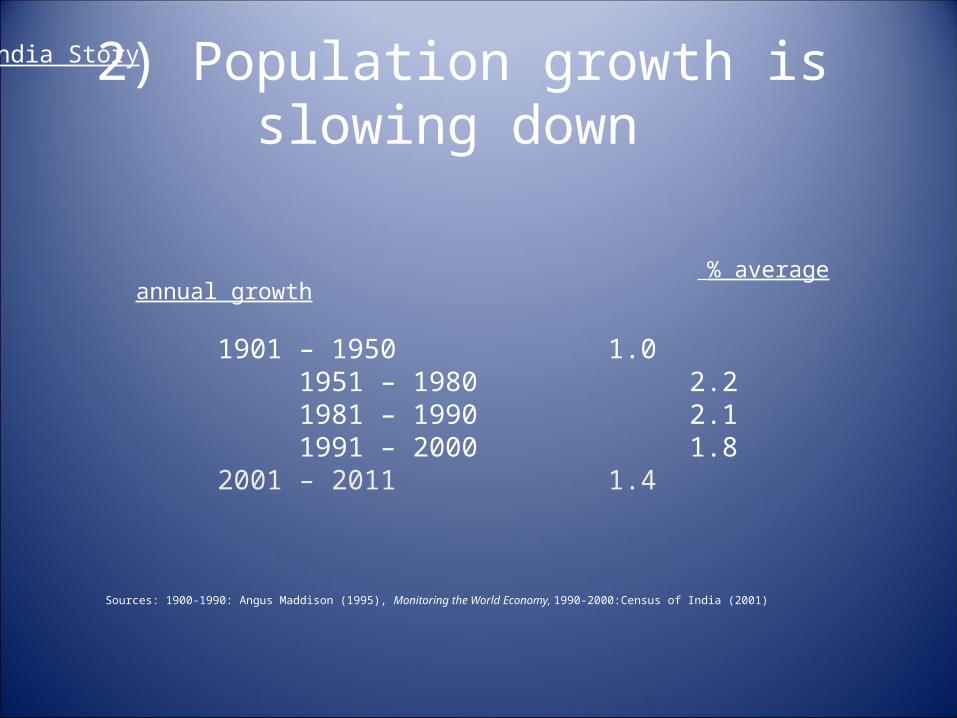
2) Population growth is slowing down
% average annual growth
1901 – 1950 1.0 1951 – 1980 2.2 1981 – 1990 2.1 1991 – 2000 1.8
2001 – 2011 1.4
Sources: 1900-1990: Angus Maddison (1995), Monitoring the World Economy, 1990-2000:Census of India (2001)
India Story
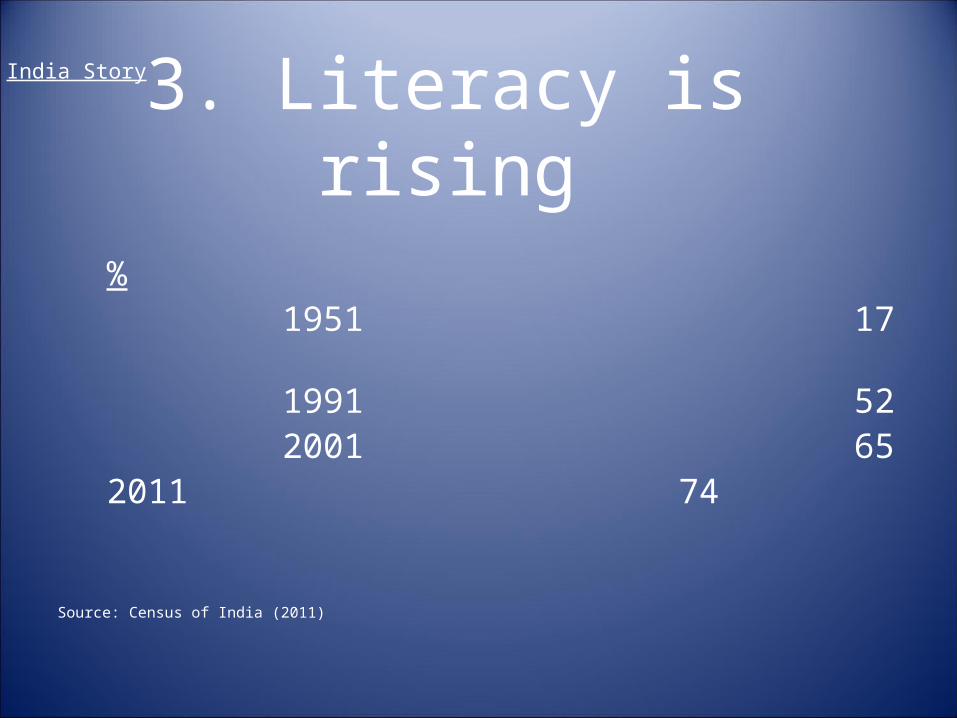
% 1951 17 1991 52 2001 65
2011 74
Source: Census of India (2011)
3. Literacy is risingIndia Story
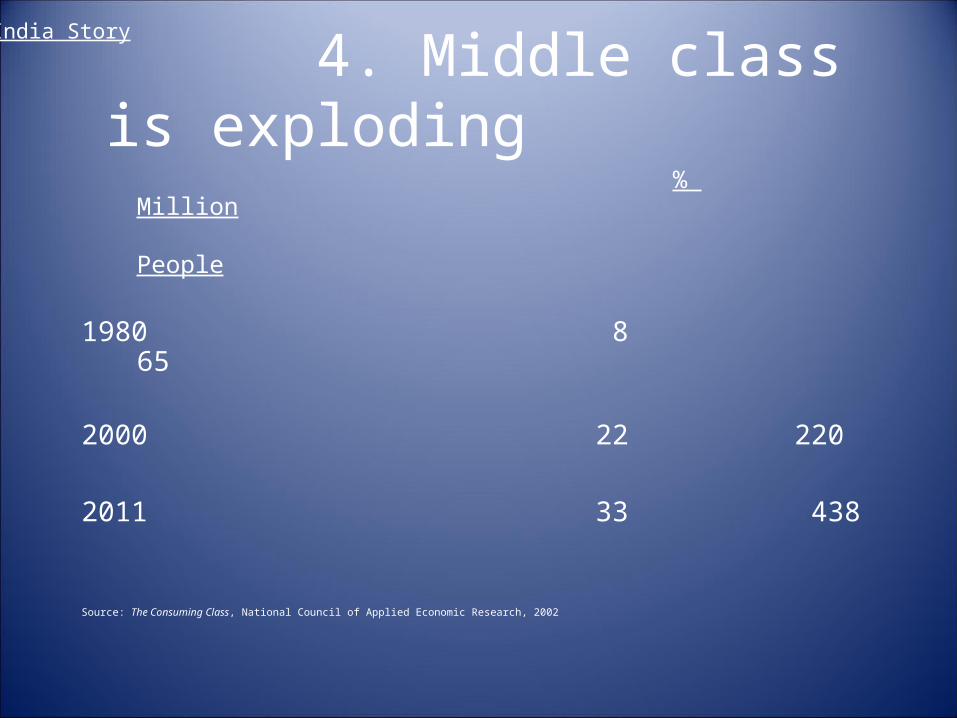
% Million People
1980 8 65
2000 22 220
2011 33 438 Source: The Consuming Class, National Council of Applied Economic Research, 2002
4. Middle class is exploding India Story
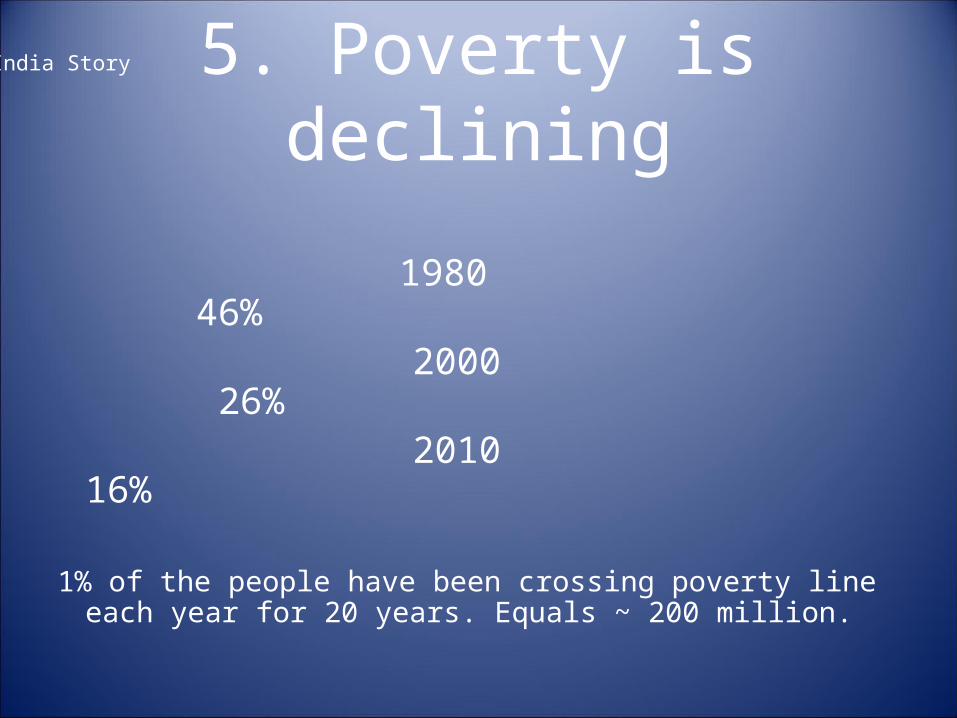
1980 46% 2000 26% 2010 16%
1% of the people have been crossing poverty line each year for 20 years. Equals ~ 200 million.
5. Poverty is decliningIndia Story
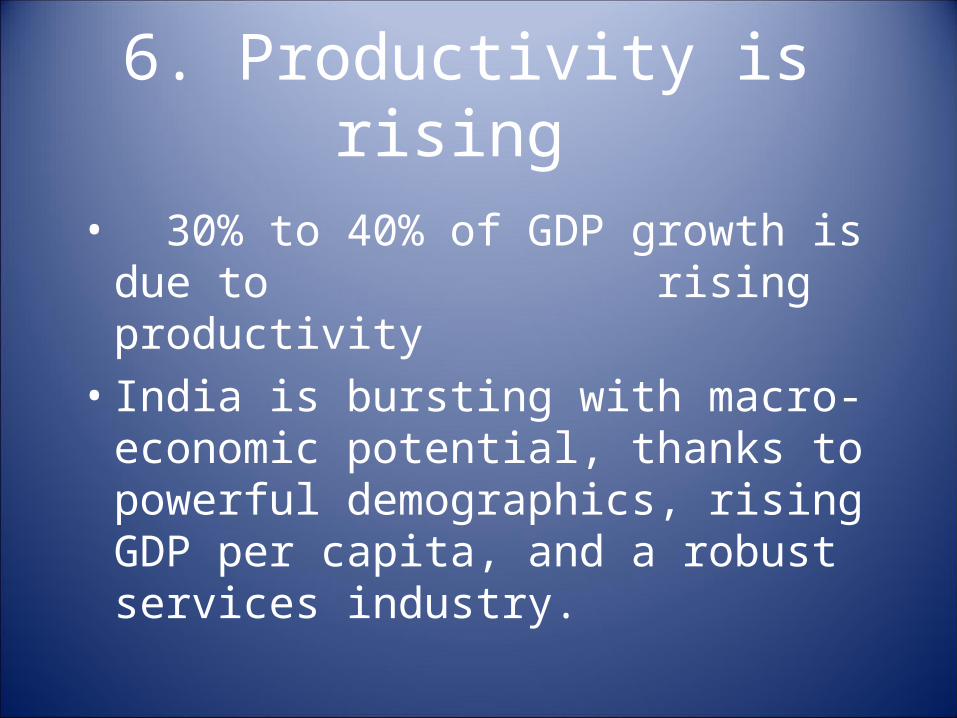
6. Productivity is rising • 30% to 40% of GDP growth is due to
rising productivity• India is bursting with macro-economic
potential, thanks to powerful demographics, rising GDP per capita, and a robust services industry.
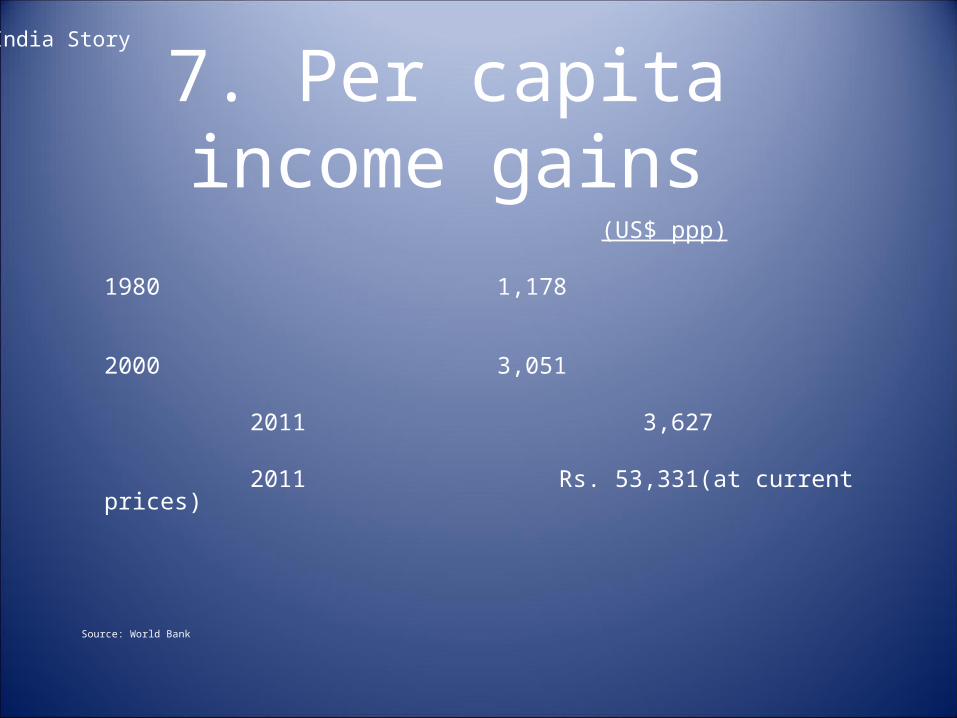
(US$ ppp)
1980 1,178
2000 3,051
2011 3,627
2011 Rs. 53,331(at current prices)
Source: World Bank
7. Per capita income gainsIndia Story
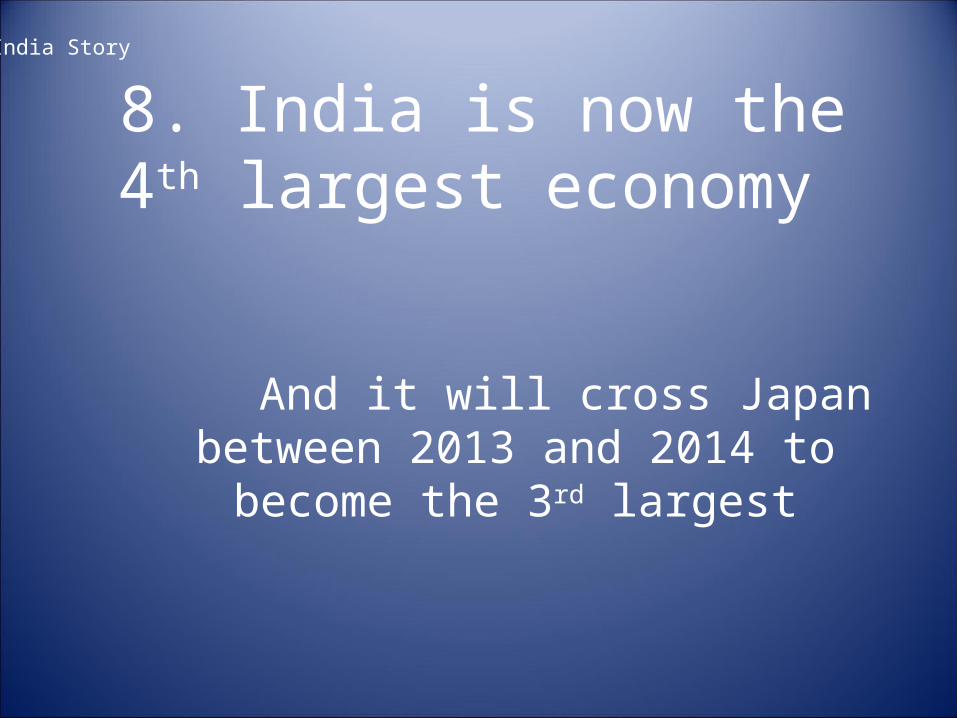
8. India is now the 4th largest economy
India Story
And it will cross Japan between 2013
and 2014 to become the 3rd largest

THE INDIA MODEL IS UNIQUE
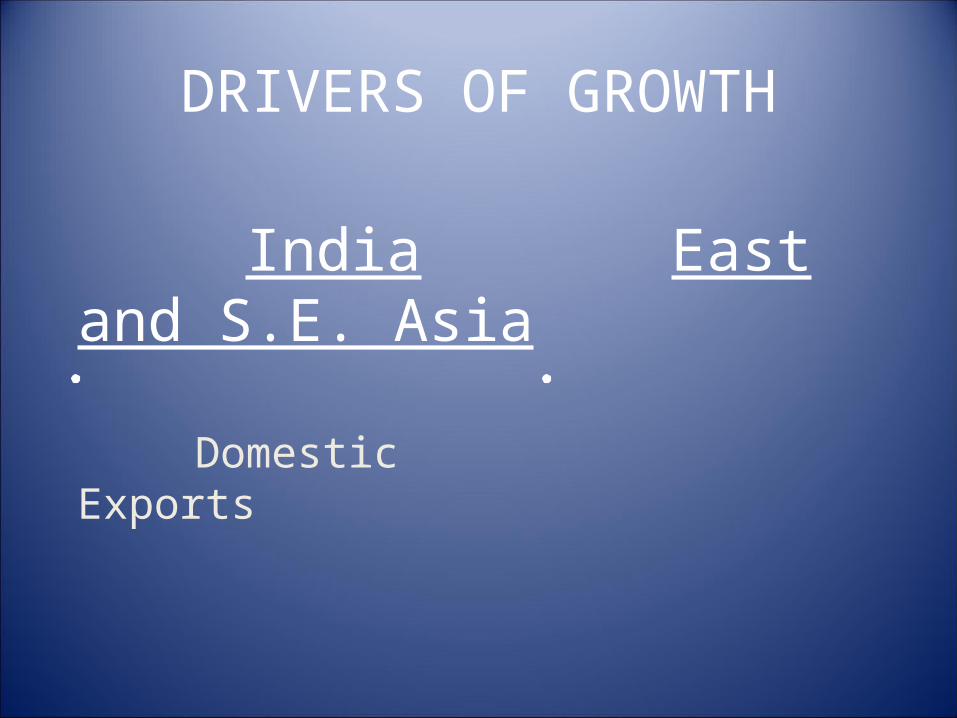
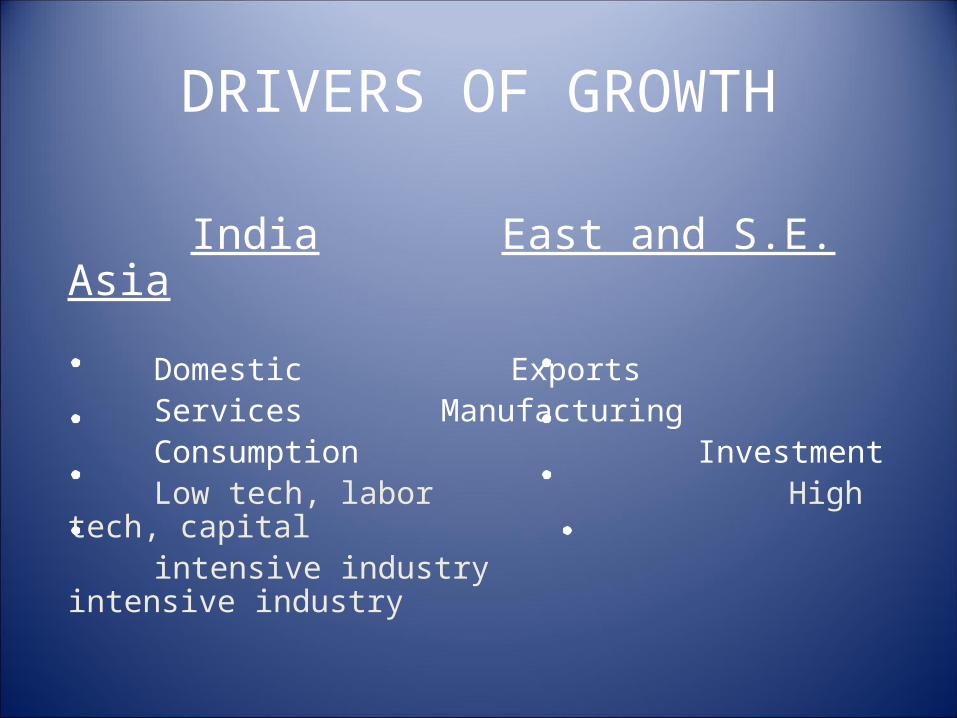
DRIVERS OF GROWTH
India East and S.E. Asia
Domestic Exports
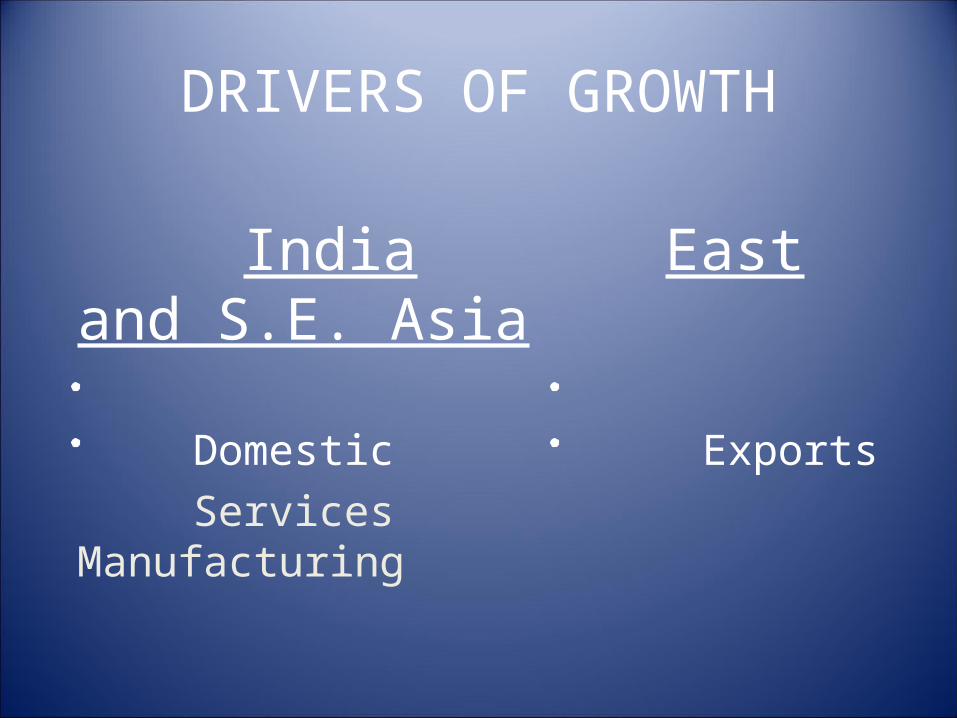
DRIVERS OF GROWTH
India East and S.E. Asia
Domestic Exports Services Manufacturing
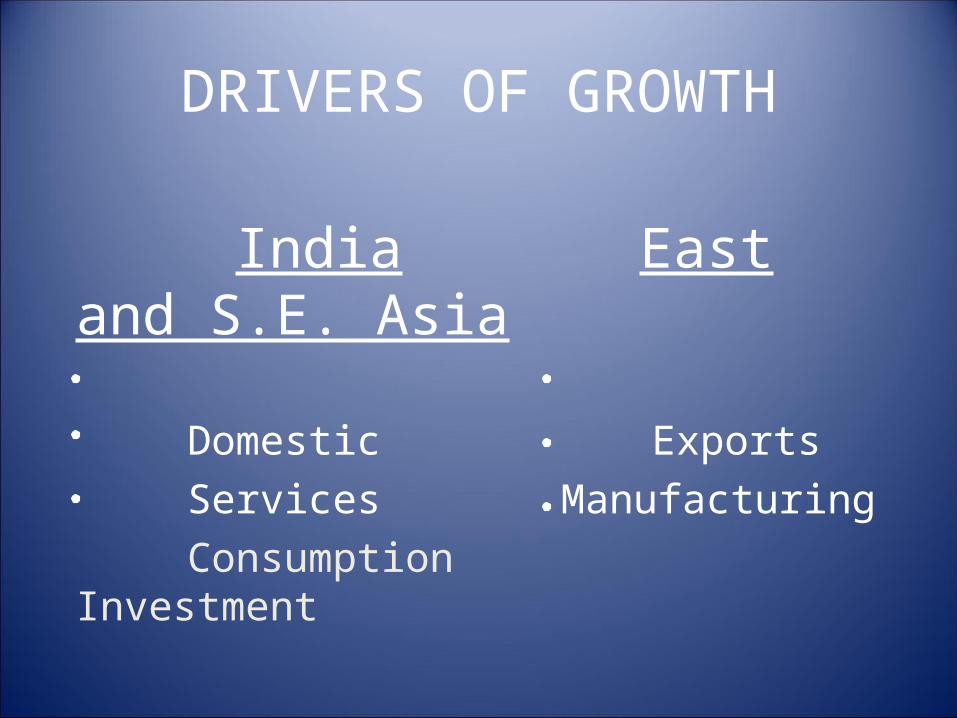
DRIVERS OF GROWTH
India East and S.E. Asia
Domestic Exports Services Manufacturing Consumption Investment
DRIVERS OF GROWTH
India East and S.E. Asia
Domestic Exports Services Manufacturing Consumption Investment Low tech, labor High tech, capital intensive industry intensive industry
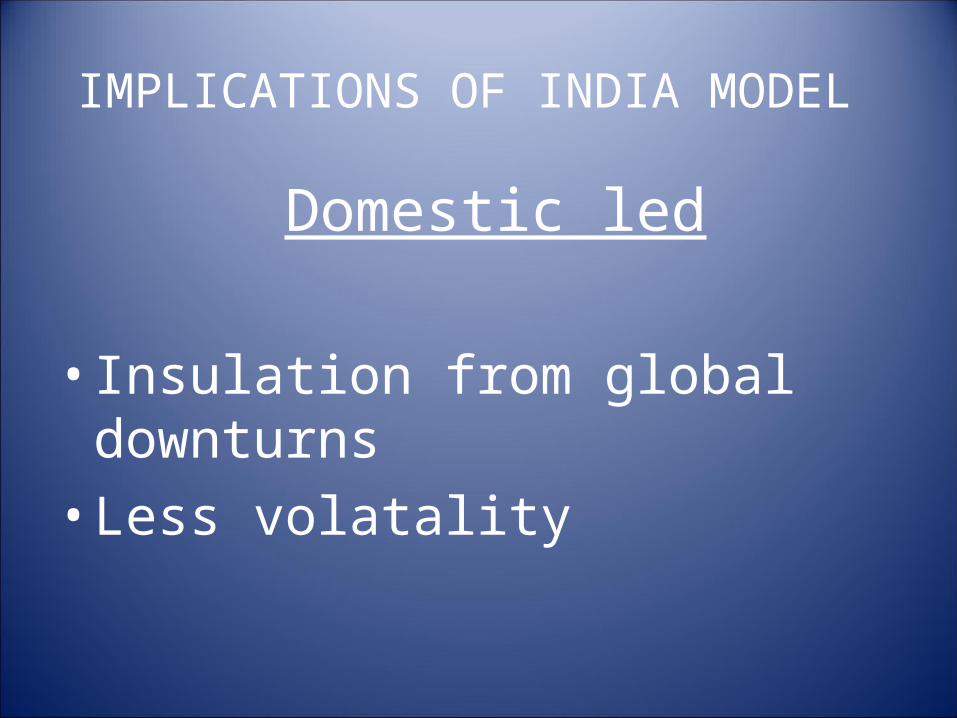
IMPLICATIONS OF INDIA MODEL
Domestic led
• Insulation from global downturns• Less volatality
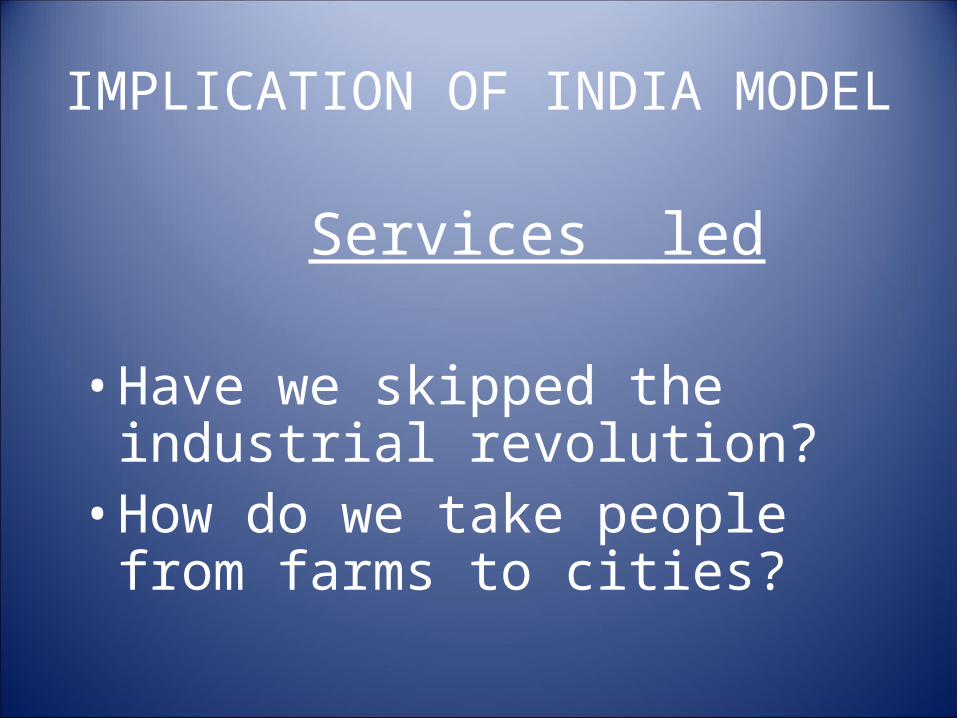
IMPLICATION OF INDIA MODEL
Services led
• Have we skipped the industrial revolution?
• How do we take people from farms to cities?
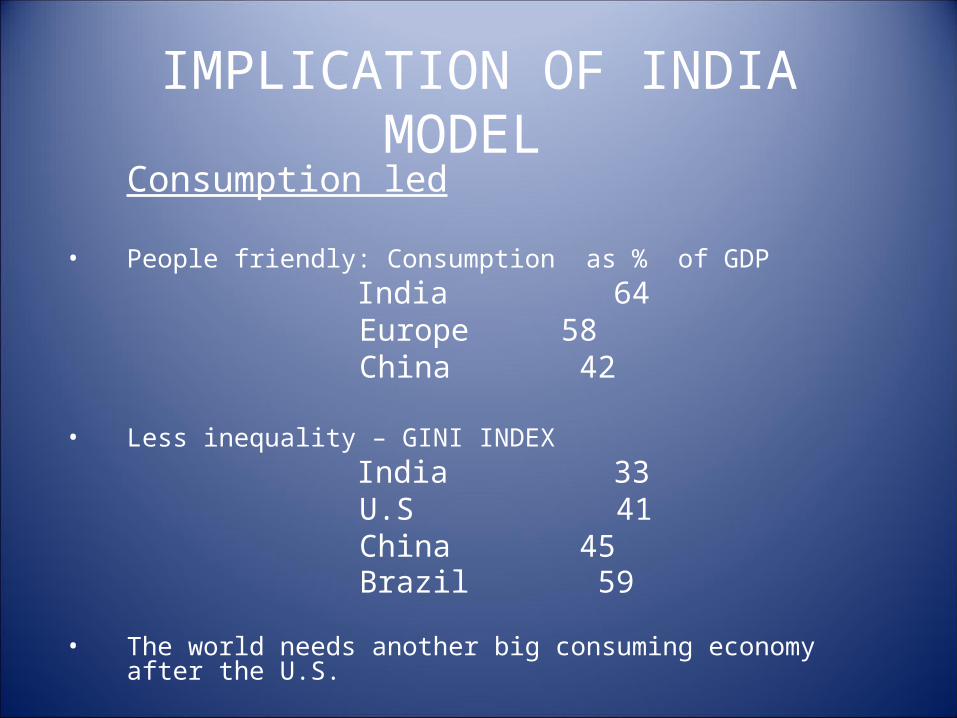
IMPLICATION OF INDIA MODEL Consumption led
• People friendly: Consumption as % of GDP India 64 Europe 58 China 42
• Less inequality – GINI INDEX India 33 U.S 41 China 45 Brazil 59 • The world needs another big consuming economy after the U.S.
Reasons for Success
India’s success is market led whereas China’s is state induced. The entrepreneur is at centre of
the Indian model
Rise of Globally CompetitiveIndian Companies
Reliance, Jet Airways, Infosys, Wipro, Ranbaxy, Bharat Forge, Tata Motors, TCS, Bharati, ICICI and HDFC Banks
MOMENTUM
• India has the potential to become the skill capital of the world .
• Labour force is skilling fast with vast and rapid increase of education opportunities.
• Lack of infrastructure investment, high deficits, and government dysfunction all have tainted India’s standing and its performance.
• Many things need to be done for India’s rapid transition out of poverty and under –development specially in rural India.

INDIA NEEDS THOUGHT SHIFT Education system should be given a global air, from
employment to employability (By rapidly making the provision of “industry oriented practical skill education “ rather than current focus on traditional academic degrees)
An attractive package must be prepared for those NRI’s who want to return to India and Invest. Also Government must be pro-active in facilitating skilled Indian workers who have demand in other countries.
There is an urgent need for genuine focus and clear strategies for providing social and economic infrastructure in rural and semi-urban areas through private - public participation.

THANK YOUTHANK YOU
By By
PROF.G.RAMACHANDRUDUPROF.G.RAMACHANDRUDU