17
Cisco Live Australia’s Demographic Change Predictions and How They Will Affect Business Through the 2020s Bernard Salt 17 March 2015
Cisco LiveAustralia’s Demographic Change
Predictions and How They Will Affect Business Through the 2020s
Bernard Salt
17 March 2015

© 2014 KPMG, an Australian partnership and a member firm of the KPMG network of independent member firms affiliated with KPMGInternational Cooperative (“KPMG International”), a Swiss entity. All rights reserved.
The KPMG name, logo and "cutting through complexity" are registered trademarks or trademarks of KPMG International Cooperative ("KPMG International"). Liability limited by a scheme approved under Professional Standards Legislation.
Disclaimer
These slides are not for commercial use or redistribution. The information contained herein is of a generalnature and is not intended to address the circumstances of any particular individual or entity. No one should acton such information without appropriate professional advice after a thorough examination of the particularsituation. KPMG have indicated within this presentation the sources of the information provided. KPMG has notsought to independently verify those sources unless otherwise noted within the presentation. No relianceshould be placed on additional oral remarks provided during the presentation, unless these are confirmed inwriting by KPMG. KPMG is under no obligation in any circumstance to update this presentation, in either oral orwritten form, for events occurring after the presentation has been issued in final form. The findings in thispresentation have been formed on the above basis.
Forecasts are based on a number of assumptions and estimates and are subject to contingencies anduncertainties. Forecasts should not be regarded as a representation or warranty by or on behalf of KPMG orany other person that such forecasts will be met. Forecasts constitute judgment and are subject to changewithout notice, as are statements about market trends, which are based on current market conditions.
Neither KPMG nor any member or employee of KPMG undertakes responsibility arising in any way fromreliance placed by a third party on this presentation. Any reliance placed is that party’s sole responsibility. Thepresentation (and the accompanying slide pack) is provided solely for the benefit of the conference attendeesand is not to be copied, quoted or referred to in whole or in part without KPMG’s prior written consent. KPMGaccepts no responsibility to anyone other than the conference attendees for the information contained in thispresentation.

Sydney
Melbourne
Hobart
Adelaide
Perth
Darwin
Brisbane
Canberra
Source: Based on Australian Bureau of Statistics data; KPMG Demographics
Australians have always been driven by lifestyle
Areas of high population growth (>2% pa) and loss (<-1% pa) between 1992 and 2013
WINNERS
LOSERS

© 2014 KPMG, an Australian partnership and a member firm of the KPMG network of independent member firms affiliated with KPMGInternational Cooperative (“KPMG International”), a Swiss entity. All rights reserved.
The KPMG name, logo and "cutting through complexity" are registered trademarks or trademarks of KPMG International Cooperative ("KPMG International"). Liability limited by a scheme approved under Professional Standards Legislation.
Strong population growth is driving household formation
Actual and projected net annual population growth for Australia between 1950 and 2050
221,000
0
50,000
100,000
150,000
200,000
250,000
300,000
350,000
400,000
450,000
500,000
1950
1952
1954
1956
1958
1960
1962
1964
1966
1968
1970
1972
1974
1976
1978
1980
1982
1984
1986
1988
1990
1992
1994
1996
1998
2000
2002
2004
2006
2008
2010
2012
2014
2016
2018
2020
2022
2024
2026
2028
2030
2032
2034
2036
2038
2040
2042
2044
2046
2048
2050
Natural Increase Net Overseas Migration
368,000
354,000
Source: based on medium ABS 2013 NOM projections, ABS 2013 NI projections and ABS Financial Year 2014 actual data projected to Calendar Year 2014

© 2014 KPMG, an Australian partnership and a member firm of the KPMG network of independent member firms affiliated with KPMGInternational Cooperative (“KPMG International”), a Swiss entity. All rights reserved.
The KPMG name, logo and "cutting through complexity" are registered trademarks or trademarks of KPMG International Cooperative ("KPMG International"). Liability limited by a scheme approved under Professional Standards Legislation.
Australia is now an Anglo-Mediterranean-Asian-Indian fusion culture
Source: Based on Australian Bureau of Statistics data; KPMG Demographics
1.2 millionUnited Kingdom1
New Zealand609,0002
China428,0003
India370,0004
Vietnam215,0005
211,000Philippines6
Italy199,0007
South Africa174,0008
Malaysia149,0009
Germany128,00010
Top 10 population by country of birth in Australia 2013

© 2014 KPMG, an Australian partnership and a member firm of the KPMG network of independent member firms affiliated with KPMGInternational Cooperative (“KPMG International”), a Swiss entity. All rights reserved.
The KPMG name, logo and "cutting through complexity" are registered trademarks or trademarks of KPMG International Cooperative ("KPMG International"). Liability limited by a scheme approved under Professional Standards Legislation.
Recent migrants are in the household formation stage of the lifecycle
Source: Based on Australian Bureau of Statistics data; KPMG Demographics
Age of population by country of birth 2011
0%
1%
2%
3%
4%
5%
1 3 5 7 9 11 13 15 17 19 21 23 25 27 29 31 33 35 37 39 41 43 45 47 49 51 53 55 57 59 61 63 65 67 69 71 73 75 77 79 81 83 85 87 89 91 93 95 97 99 101
Australia China India England Italy Greece New Zealand
China
India
England
Greece
Italy
NZ

© 2014 KPMG, an Australian partnership and a member firm of the KPMG network of independent member firms affiliated with KPMGInternational Cooperative (“KPMG International”), a Swiss entity. All rights reserved.
The KPMG name, logo and "cutting through complexity" are registered trademarks or trademarks of KPMG International Cooperative ("KPMG International"). Liability limited by a scheme approved under Professional Standards Legislation.
New acronyms for our newest tribes
PUMCINS …→ Professional Urban Middle Class In Nice Suburbs
…NETTELs ←Not Enough Time To Enjoy Life
KIPPERS …→ Kids In Parents Pockets Eroding Retirement Savings
…LOMBARDS←Lots Of Money But A Real Dickhead
Source: KPMG Demographics

© 2014 KPMG, an Australian partnership and a member firm of the KPMG network of independent member firms affiliated with KPMGInternational Cooperative (“KPMG International”), a Swiss entity. All rights reserved.
The KPMG name, logo and "cutting through complexity" are registered trademarks or trademarks of KPMG International Cooperative ("KPMG International"). Liability limited by a scheme approved under Professional Standards Legislation.
Most growth takes place in the middle Australia of middle suburbia
Source: Based on Australian Bureau of Statistics data; KPMG Demographics
Hipster Middle Australia McMansion
<5km 5-15km 15-25km >25km Total Growth
Sydney 8,000 22,500 22,300 28,200 81,000Melbourne 17,300 19,900 28,800 29,500 95,500Brisbane 5,800 10,700 13,400 15,200 45,100Perth 5,100 21,800 18,600 22,000 67,500Adelaide 1,500 6,400 1,100 4,100 13,100
Big Capitals 37,700 81,300 84,200 99,000 302,200Balance - - - - 104,800Total Australia - - - - 407,000• Net population growth in concentric zones around the CBD of our largest cities over the year end June 2013

© 2014 KPMG, an Australian partnership and a member firm of the KPMG network of independent member firms affiliated with KPMGInternational Cooperative (“KPMG International”), a Swiss entity. All rights reserved.
The KPMG name, logo and "cutting through complexity" are registered trademarks or trademarks of KPMG International Cooperative ("KPMG International"). Liability limited by a scheme approved under Professional Standards Legislation.
Net change in Australian population by 5-year age group over 10 years to 2013 and 10 years to 2023Source: Based on Australian Bureau of Statistics data; KPMG Demographics
New business opportunities are being shaped by changes in the Australian demographic profile
-
50,000
100,000
150,000
200,000
250,000
300,000
350,000
400,000
450,000
500,000
0-4 5-9 10-14 15-19 20-24 25-29 30-34 35-39 40-44 45-49 50-54 55-59 60-64 65-69 70-74 75-79 80-84 85+
2003-2013: 3.4 million (19.7m to 23.1m) 2013-2023: 4.2 million (23.1m to 27.3m)
Mature adults
Premium products
Active retirees
Travel & wellness
Kids & teenagers
Suburbia & school
Young adults
Social media & connectivity

© 2014 KPMG, an Australian partnership and a member firm of the KPMG network of independent member firms affiliated with KPMGInternational Cooperative (“KPMG International”), a Swiss entity. All rights reserved.
The KPMG name, logo and "cutting through complexity" are registered trademarks or trademarks of KPMG International Cooperative ("KPMG International"). Liability limited by a scheme approved under Professional Standards Legislation.
Australians are dividing the lifecycle into ‘thirds’
Source: Based on Australian Bureau of Statistics data; KPMG Demographics
0 9010 20 30 40 50 60 70 80
Child Adult Old1934
Child Teen OldAdult1974 71
Child Adolescence Lifestyle OldRetired2014
Adult82
63
Change in life expectancy over 80 years in Australia

© 2014 KPMG, an Australian partnership and a member firm of the KPMG network of independent member firms affiliated with KPMGInternational Cooperative (“KPMG International”), a Swiss entity. All rights reserved.
The KPMG name, logo and "cutting through complexity" are registered trademarks or trademarks of KPMG International Cooperative ("KPMG International"). Liability limited by a scheme approved under Professional Standards Legislation.
From Boomers to Xers and Ys … and finally to Zeds
Source: KPMG Demographics
Forgotten generationWrong place … wrong timeNo workplace guiltAngsty about Ys
XGENERATION
■ Born 1965 – 1982■ Today 32 – 49
HierarchicalIndulged their kidsDepression era parentsSandwich generation
BABYBOOMERS
■ Born 1946 – 1964■ Today 50 – 68
YGENERATION
Special … bubble-wrapChaotic connectionEntrepreneurialsDisappointed generation?
■ Born 1983 – 2000■ Today 14 – 31
Parents results-orientedYouth in straitened timesHighly educated, globalPragmatists … fixers
ZGENERATION
■ Born 2001 – 2019■ Today 0 – 13

© 2014 KPMG, an Australian partnership and a member firm of the KPMG network of independent member firms affiliated with KPMGInternational Cooperative (“KPMG International”), a Swiss entity. All rights reserved.
The KPMG name, logo and "cutting through complexity" are registered trademarks or trademarks of KPMG International Cooperative ("KPMG International"). Liability limited by a scheme approved under Professional Standards Legislation.
2014-20153.0%4.6%0.7%3.4%7.4%-3.3%0.1%8.6%11.6%6.3%
13.6%1.4%
-12.7%4.0%
Sometimes business just isn’t fair … who’s doing well and who isn’t?
Per cent change in retail sales in Australia for 13 categories over ten and five years and over 12 months to Jan-2015
Source: Based on Australian Bureau of Statistics data; KPMG Demographics
2010-201521.1%49.9%26.8%24.5%16.9%16.1%21.1%36.6%4.0%
16.7%8.2%0.1%
-26.3%20.5%
2005-2015121.0%100.7%89.6%75.8%73.2%50.9%47.1%44.4%39.1%37.3%31.1%18.0%-23.5%58.3%
IndustryLiquorCafes, restaurants & catering Pharmaceutical, cosmetic & toiletriesSupermarket & grocery storesTakeaway foodRecreational goodsClothingHardware, building & garden suppliesElectrical & electronic goodsFurniture, floor coverings, housewares, textilesFootwear & other personal accessoriesDepartment storesNewspapers & booksTotal (incl other)

© 2014 KPMG, an Australian partnership and a member firm of the KPMG network of independent member firms affiliated with KPMGInternational Cooperative (“KPMG International”), a Swiss entity. All rights reserved.
The KPMG name, logo and "cutting through complexity" are registered trademarks or trademarks of KPMG International Cooperative ("KPMG International"). Liability limited by a scheme approved under Professional Standards Legislation.
There has been a shift in the Australian economy towards knowledge workers
Hea
lthca
re&
Soc
ial A
ssis
t.
Prof
essi
onal
/Sc
ient
ific/
Tech
.
Publ
ic A
dmin
&
Saf
ety
Adm
in &
Sup
port
Acco
m &
Foo
d
Ret
ail T
rade
Con
stru
ctio
n
Educ
atio
n &
Trai
ning
Arts
& R
ecre
atio
n
Fina
ncia
l &In
sura
nce
Min
ing
Oth
er s
ervi
ces
Who
lesa
le T
rade
Ren
tal/h
iring
&R
eal E
stat
e
Info
Med
ia &
Te
leco
ms
Man
ufac
turin
g
6 years November 2008 – up 1.5m (9.3m – 10.8m)
Source: Based on Australian Bureau of Statistics data; KPMG Demographics
Elec
tric
ity/G
as/
Wat
er &
Was
te
Agric
ultu
re/F
ores
try
& F
ishi
ng
Tran
spor
t/Pos
tal/
War
ehou
se
-100,000
-50,000
0
50,000
100,000
150,000
200,000
250,000
300,000 6 years November 2014 – up 0.9m (10.8m – 11.6m)Healthcare &
Social Assistance
Professionals & Sciences
EducationAccommodation& Food
© 2014 KPMG, an Australian partnership and a member firm of the KPMG network of independent member firms affiliated with KPMGInternational Cooperative (“KPMG International”), a Swiss entity. All rights reserved.
The KPMG name, logo and "cutting through complexity" are registered trademarks or trademarks of KPMG International Cooperative ("KPMG International"). Liability limited by a scheme approved under Professional Standards Legislation.
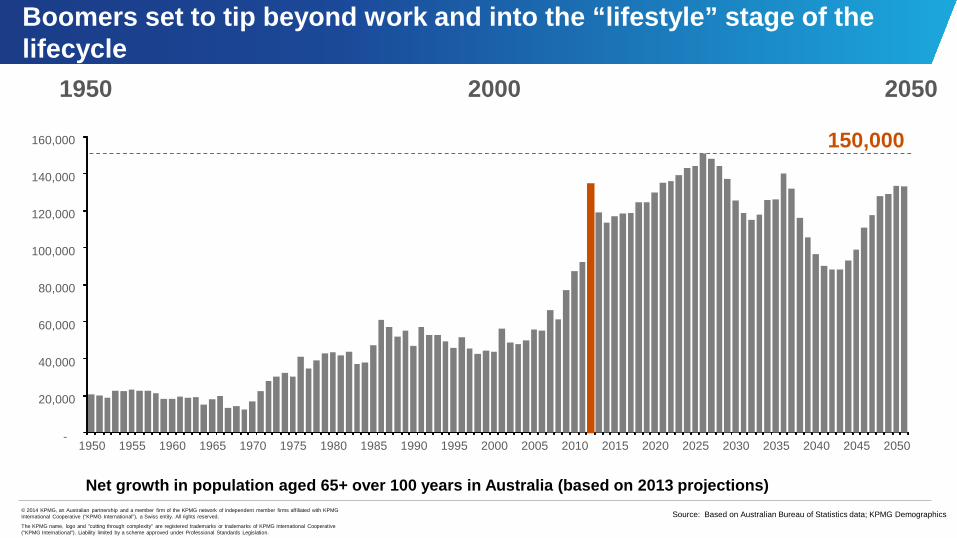
Boomers set to tip beyond work and into the “lifestyle” stage of the lifecycle
Net growth in population aged 65+ over 100 years in Australia (based on 2013 projections)
150,000
1950 20502000
Source: Based on Australian Bureau of Statistics data; KPMG Demographics
-
20,000
40,000
60,000
80,000
100,000
120,000
140,000
160,000
1950 1955 1960 1965 1970 1975 1980 1985 1990 1995 2000 2005 2010 2015 2020 2025 2030 2035 2040 2045 2050

© 2014 KPMG, an Australian partnership and a member firm of the KPMG network of independent member firms affiliated with KPMGInternational Cooperative (“KPMG International”), a Swiss entity. All rights reserved.
The KPMG name, logo and "cutting through complexity" are registered trademarks or trademarks of KPMG International Cooperative ("KPMG International"). Liability limited by a scheme approved under Professional Standards Legislation.
Source: KPMG Demographics
Where are the opportunities in 2015
Population growth at close to record levels … business opportunities in household formation and infrastructure means tradies doing well
The consumer and lifestyle models are changing … new retail and housing formats evolving and especially in the inner city
Reasons to be positive … low interest rates, low dollar, low petrol prices, no natural disasters … time to move on from the GFC
Specific opportunities in healthcare, education, building & construction, retirement financial planning and succession planning services
Cultural shifts in Australia are resulting in an Anglo-Mediterranean-Asian fusion culture … look to more Asian influences in the future especially China
Australians are optimistic about the future … but they will want to protect wealthand mitigate risk

© 2014 KPMG, an Australian partnership and a member firm of the KPMG network of independent member firms affiliated with KPMGInternational Cooperative (“KPMG International”), a Swiss entity. All rights reserved.
The KPMG name, logo and "cutting through complexity" are registered trademarks or trademarks of KPMG International Cooperative ("KPMG International"). Liability limited by a scheme approved under Professional Standards Legislation.
Introducing Melbourne’s bachelor hotspot …
Source: Based on Australian Bureau of Statistics data; KPMG Demographics
Hotspot suburbs for single men and women aged 25-34 at the 2011 Census
“Racecourse of Love”Flemington Racecourse
West Footscray2.08:1
Flemington1.41:1

© 2014 KPMG, an Australian partnership and a member firm of the KPMG network of independent member firms affiliated with KPMGInternational Cooperative (“KPMG International”), a Swiss entity. All rights reserved.
The KPMG name, logo and "cutting through complexity" are registered trademarks or trademarks of KPMG International Cooperative ("KPMG International"). Liability limited by a scheme approved under Professional Standards Legislation.
@bernardsalt
Bernard Salt Demographer
linkedin.com/in/bernardsalt
+61 3 9288 5047
www.bernardsalt.com.au
@bernardsalt
Connect


![FY16 Presentation FINAL (002) [Read-Only]presentation. Such forecasts, prospects, statement or returns are by their nature subject to significant uncertainties and contingencies. Actual](https://static.documents.pub/doc/80x56/5f238304d4d9a60b02570ce8/fy16-presentation-final-002-read-only-presentation-such-forecasts-prospects.jpg)


