41
Demographic Profile Demographic Profile Faculty, Staff, Students
| Date post: | 02-Jan-2016 |
| Category: |
Documents |
| Upload: | armand-fowler |
| View: | 31 times |
| Download: | 1 times |
Demographic ProfileDemographic Profile
Faculty, Staff, Students
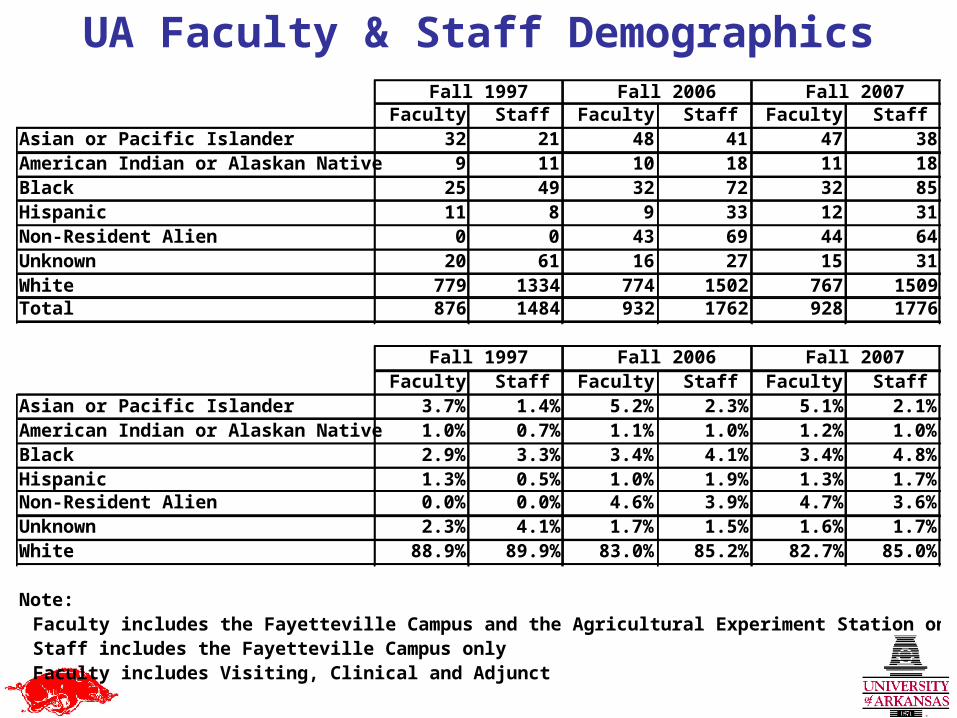
UA Faculty & Staff DemographicsFall 1997 Fall 2006 Fall 2007
Faculty Staff Faculty Staff Faculty StaffAsian or Pacific Islander 32 21 48 41 47 38American Indian or Alaskan Native 9 11 10 18 11 18Black 25 49 32 72 32 85Hispanic 11 8 9 33 12 31Non-Resident Alien 0 0 43 69 44 64Unknown 20 61 16 27 15 31White 779 1334 774 1502 767 1509Total 876 1484 932 1762 928 1776
Fall 1997 Fall 2006 Fall 2007Faculty Staff Faculty Staff Faculty Staff
Asian or Pacific Islander 3.7% 1.4% 5.2% 2.3% 5.1% 2.1%American Indian or Alaskan Native 1.0% 0.7% 1.1% 1.0% 1.2% 1.0%Black 2.9% 3.3% 3.4% 4.1% 3.4% 4.8%Hispanic 1.3% 0.5% 1.0% 1.9% 1.3% 1.7%Non-Resident Alien 0.0% 0.0% 4.6% 3.9% 4.7% 3.6%Unknown 2.3% 4.1% 1.7% 1.5% 1.6% 1.7%White 88.9% 89.9% 83.0% 85.2% 82.7% 85.0%
Note:Faculty includes the Fayetteville Campus and the Agricultural Experiment Station onlyStaff includes the Fayetteville Campus onlyFaculty includes Visiting, Clinical and Adjunct
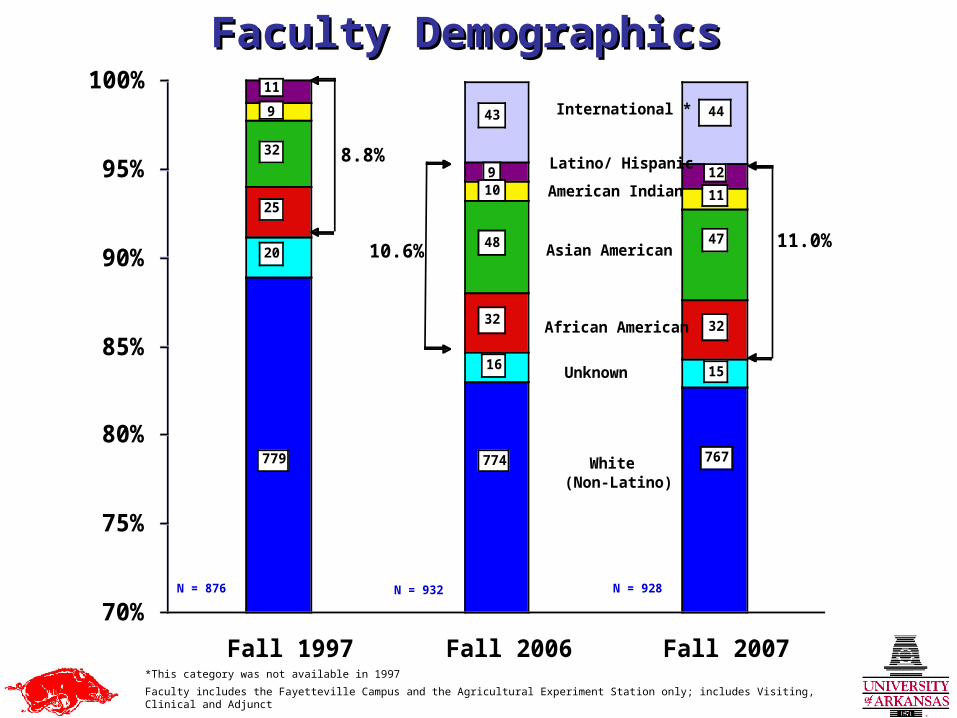
Faculty Demographics Faculty Demographics
Faculty includes the Fayetteville Campus and the Agricultural Experiment Station only; includes Visiting, Clinical and Adjunct
*This category was not available in 1997
70%
75%
80%
85%
90%
95%
100%
Fall 1997 Fall 2006 Fall 2007
Percent of Faculty
11.0%
779
20
32
25
9
774
43
9
32
48
16
10
11
International *
767
44
12
32
47
15
11
White (Non-Latino)
African American
Asian American
American Indian
Latino/ Hispanic
Unknown
10.6%
8.8%
N = 928N = 932N = 876
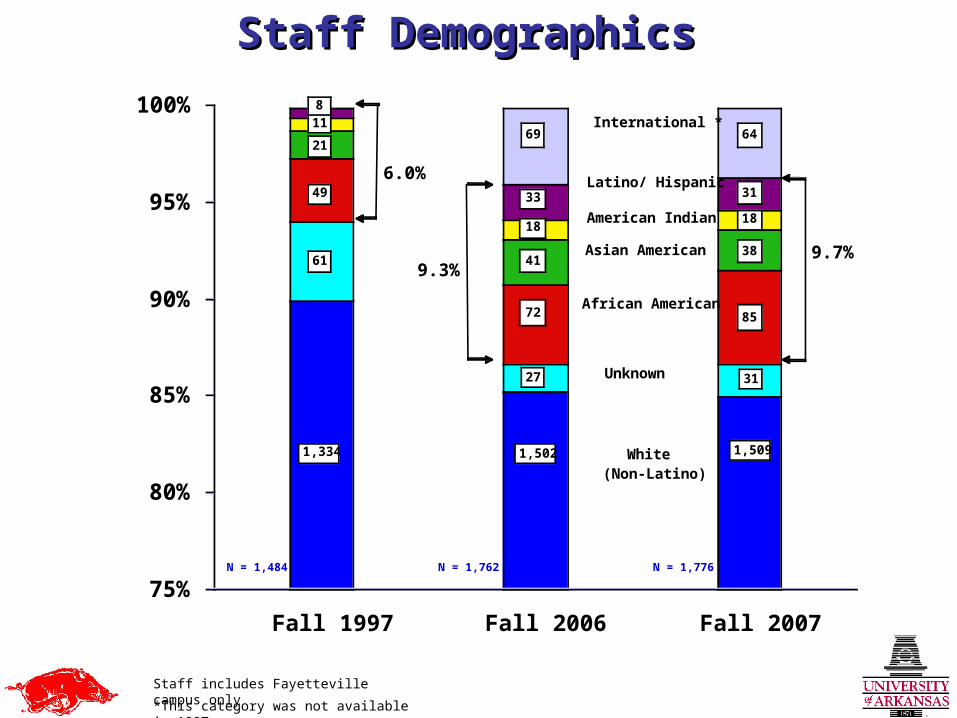
Staff DemographicsStaff Demographics
Staff includes Fayetteville campus only
*This category was not available in 1997
75%
80%
85%
90%
95%
100%
Fall 1997 Fall 2006 Fall 2007
Percent of Staff
9.7%
1,334
61
21
49
1,502
69
72
41
27
18
8International *
1,509
64
85
38
31
18
White (Non-Latino)
African American
Asian American
American Indian
Latino/ Hispanic
Unknown
9.3%
6.0%
11
33 31
N = 1,484 N = 1,776N = 1,762
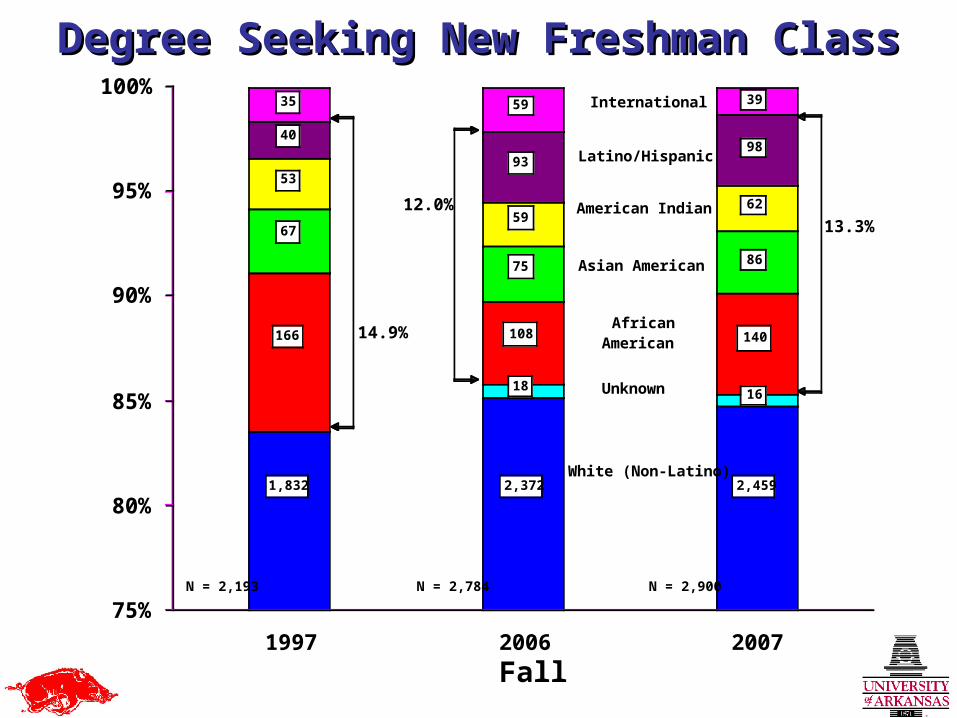
Degree Seeking New Freshman ClassDegree Seeking New Freshman Class
75%
80%
85%
90%
95%
100%
1997 2006 2007
Fall
Percent of ClassWhite (Non-Latino)
AfricanAmerican
Asian American
American Indian
Latino/Hispanic
Unknown
13.3%
14.9%
1,832
166
67
53
40
2,372
108
75
59
93
18
5935 International
62
98
39
16
86
140
2,459
12.0%
N = 2,193 N = 2,900N = 2,784

75%
80%
85%
90%
95%
100%
1997 2006 2007
Fall
Percent of Class
White (Non-Latino)
AfricanAmerican
Asian American
American Indian
Latino/Hispanic
Unknown
12.8%
11.7%
12,374
25
877
365
300
14,346
946
446
328
447
462
951
186
International
361
527
958
387
472
1023
14,920
12.1%
N = 14,740 N = 18,648N = 17,926
618
Total EnrollmentTotal Enrollment
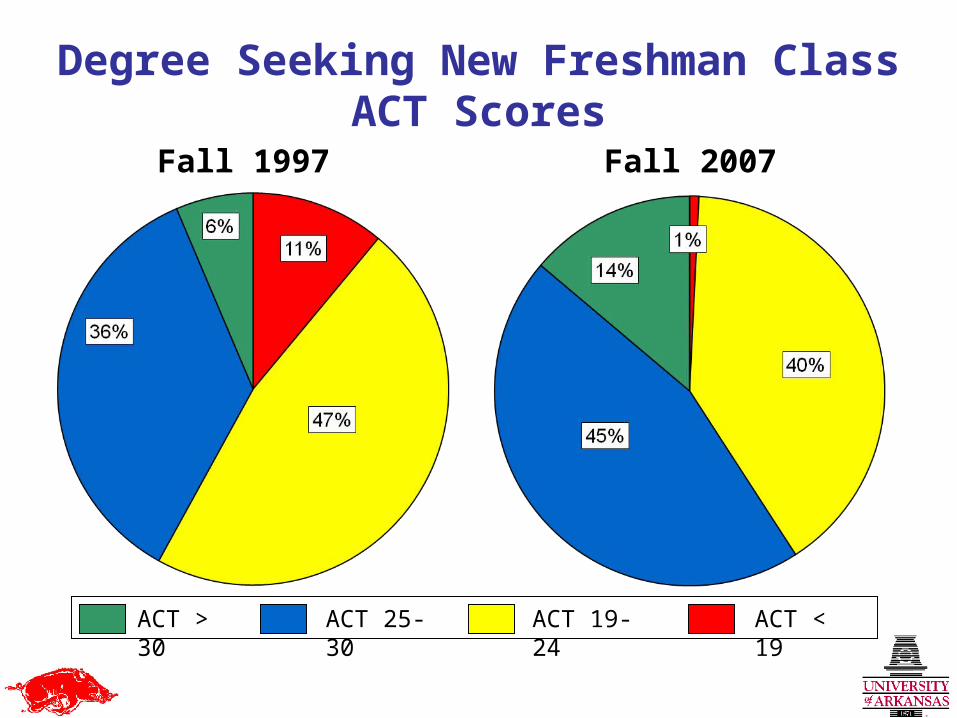
Degree Seeking New Freshman ClassACT Scores
ACT > 30 ACT 25-30 ACT 19-24 ACT < 19
Fall 1997 Fall 2007
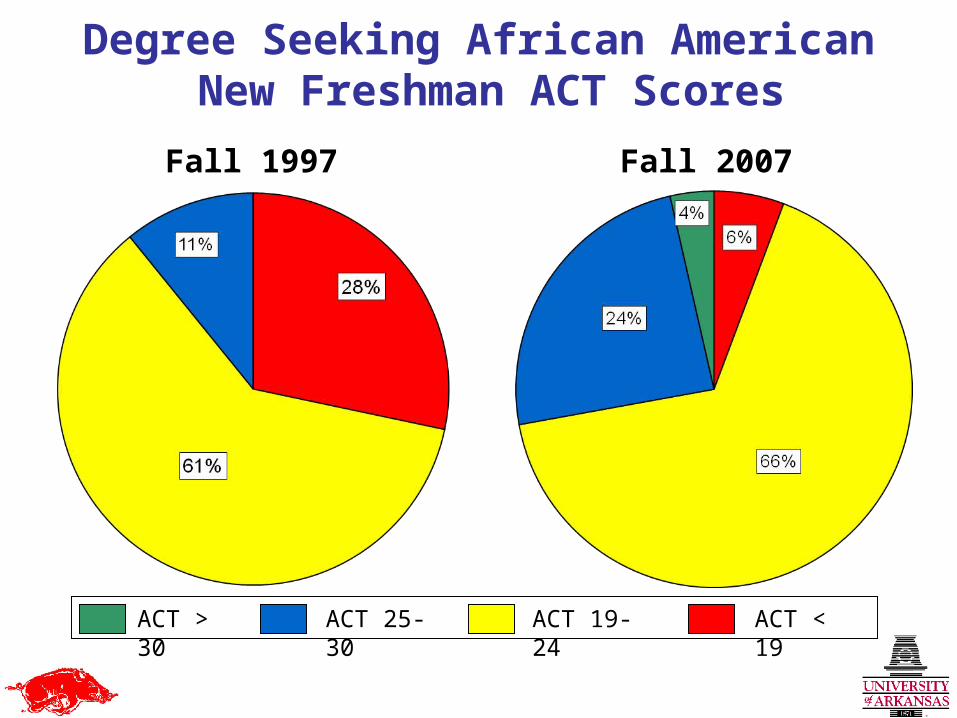
Degree Seeking African American New Freshman ACT Scores
ACT > 30 ACT 25-30 ACT 19-24 ACT < 19
Fall 2007Fall 1997

Degree Seeking New Freshman ClassACT Scores
ACT > 30 ACT 25-30 ACT 19-24 ACT < 19
Fall 2006 Fall 2007
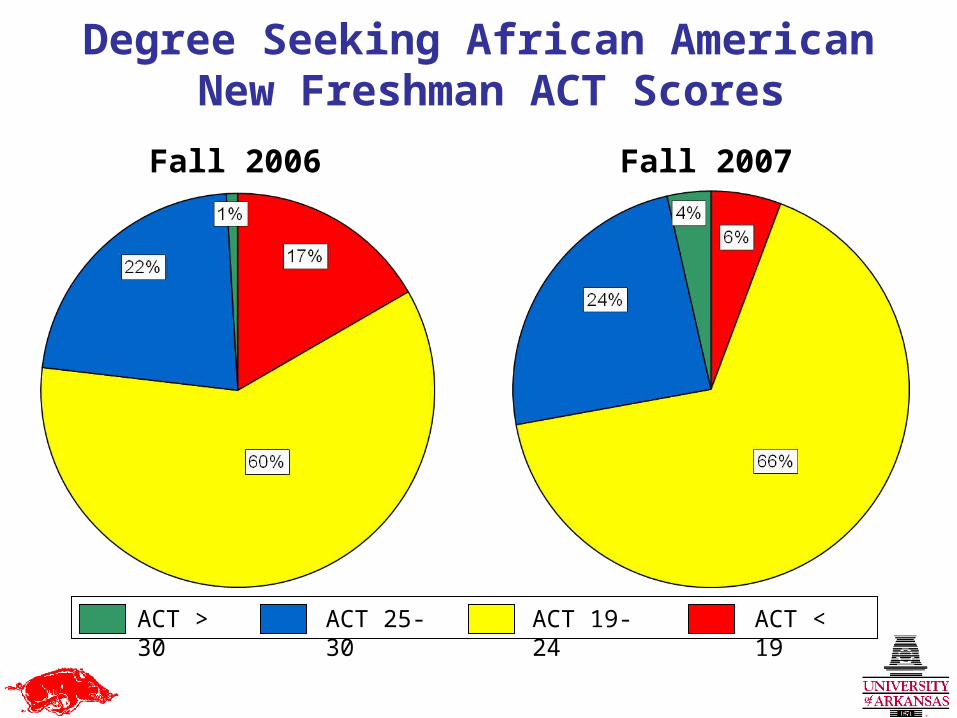
Degree Seeking African American New Freshman ACT Scores
ACT > 30 ACT 25-30 ACT 19-24 ACT < 19
Fall 2007Fall 2006
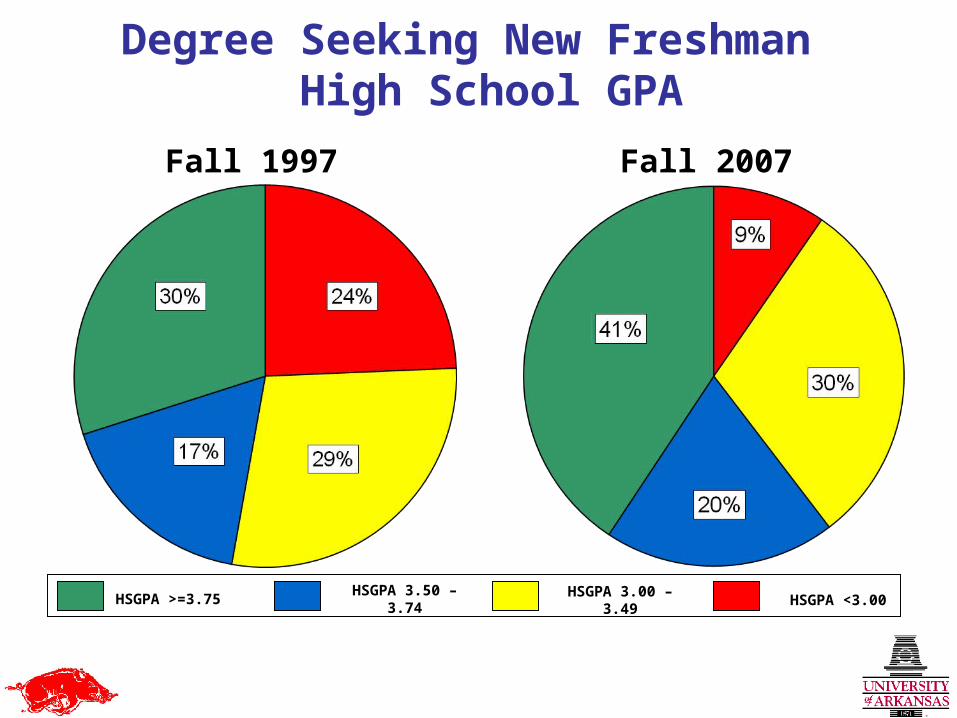
Degree Seeking New Freshman High School GPA
Fall 2007Fall 1997
HSGPA >=3.75 HSGPA 3.50 – 3.74 HSGPA 3.00 – 3.49 HSGPA <3.00
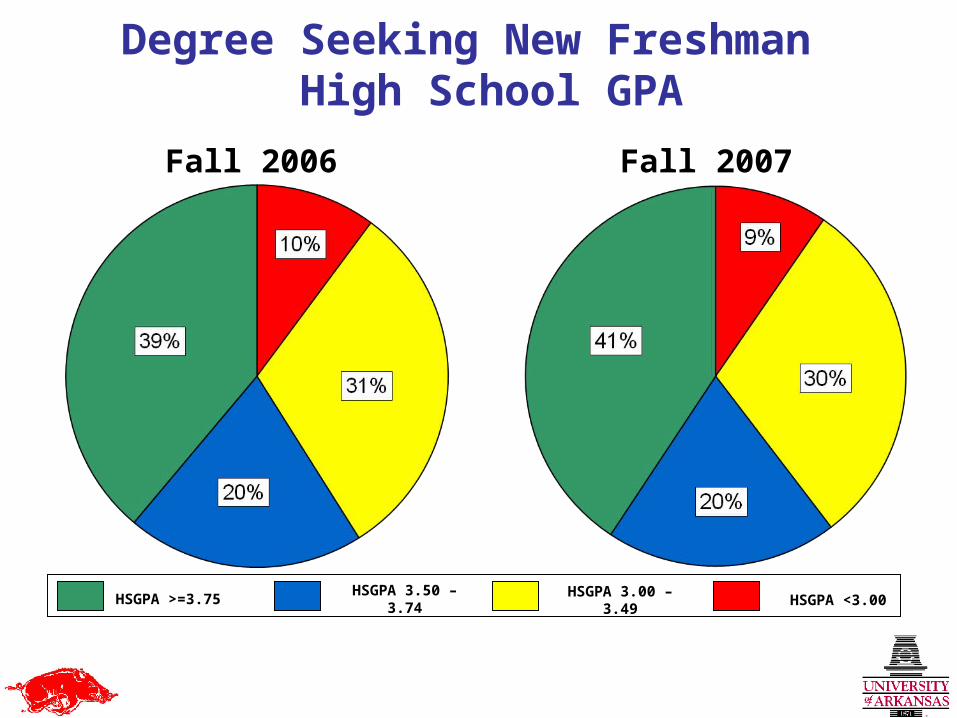
Degree Seeking New Freshman High School GPA
Fall 2007Fall 2006
HSGPA >=3.75 HSGPA 3.50 – 3.74 HSGPA 3.00 – 3.49 HSGPA <3.00
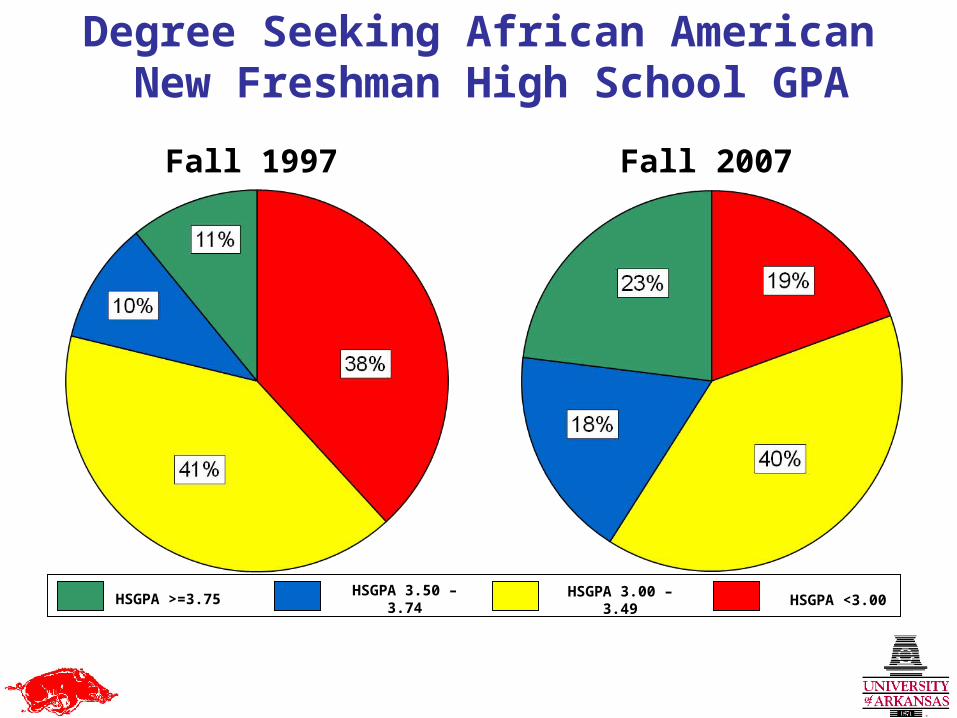
Degree Seeking African American New Freshman High School GPA
Fall 2007Fall 1997
HSGPA >=3.75 HSGPA 3.50 – 3.74 HSGPA 3.00 – 3.49 HSGPA <3.00
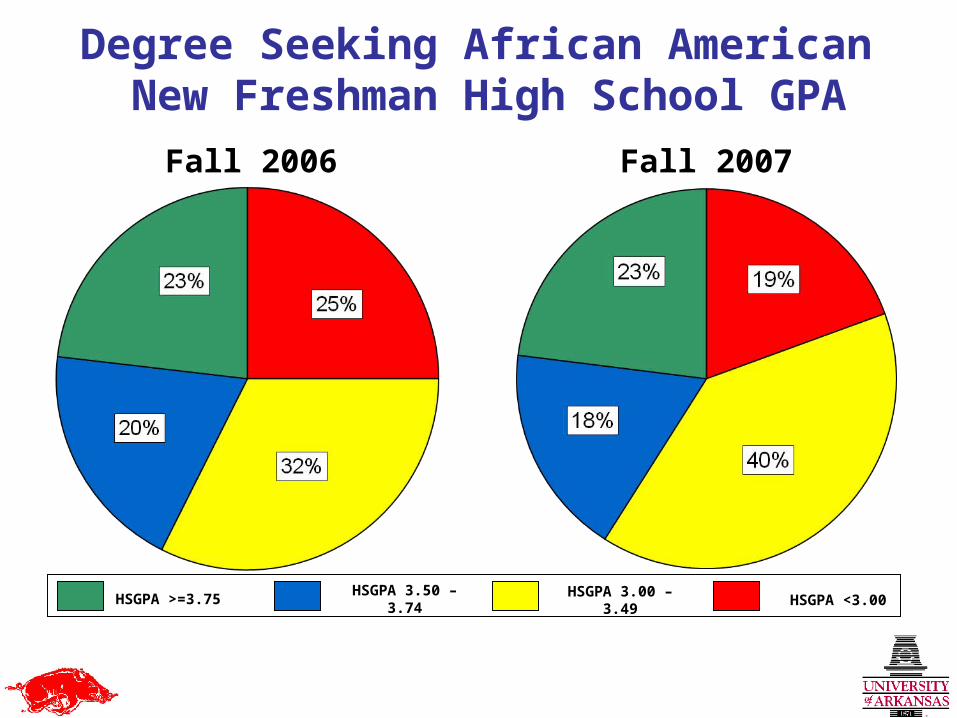
Degree Seeking African American New Freshman High School GPA
Fall 2007Fall 2006
HSGPA >=3.75 HSGPA 3.50 – 3.74 HSGPA 3.00 – 3.49 HSGPA <3.00
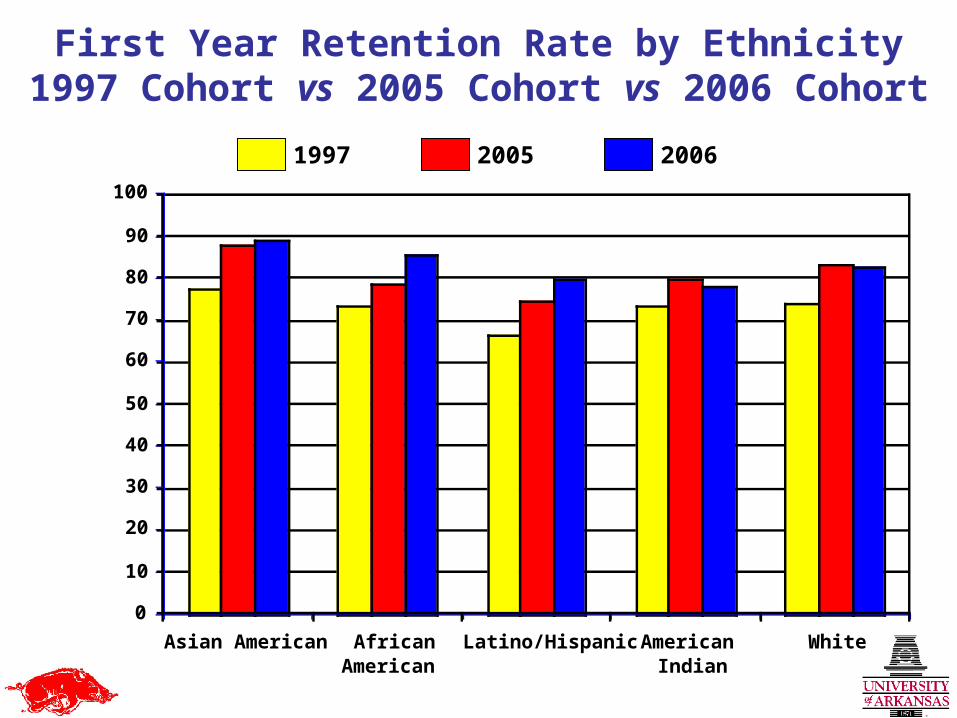
First Year Retention Rate by Ethnicity1997 Cohort vs 2005 Cohort vs 2006 Cohort
0
10
20
30
40
50
60
70
80
90
100
Asian American AfricanAmerican
Latino/Hispanic AmericanIndian
White
1st Year Retention Rate (%)
1997 2005 2006
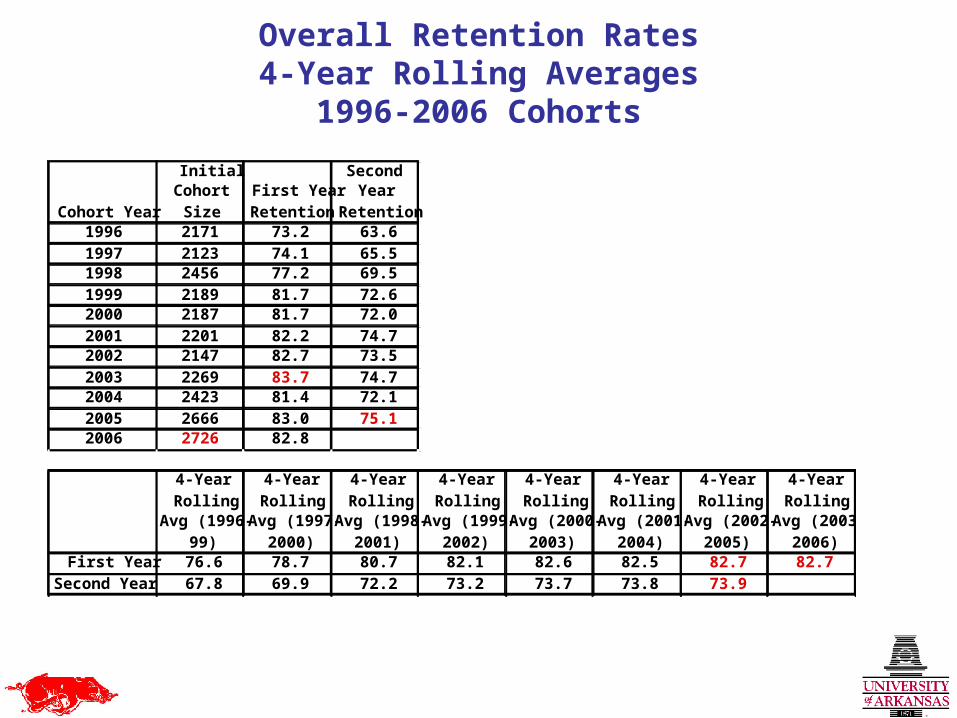
Overall Retention Rates4-Year Rolling Averages
1996-2006 Cohorts
Cohort Year
Initial Cohort
SizeFirst Year Retention
Second Year
Retention1996 2171 73.2 63.61997 2123 74.1 65.51998 2456 77.2 69.51999 2189 81.7 72.62000 2187 81.7 72.02001 2201 82.2 74.72002 2147 82.7 73.52003 2269 83.7 74.72004 2423 81.4 72.12005 2666 83.0 75.12006 2726 82.8
4-Year Rolling
Avg (1996-99)
4-Year Rolling
Avg (1997-2000)
4-Year Rolling
Avg (1998-2001)
4-Year Rolling
Avg (1999-2002)
4-Year Rolling
Avg (2000-2003)
4-Year Rolling
Avg (2001-2004)
4-Year Rolling
Avg (2002-2005)
4-Year Rolling
Avg (2003-2006)
First Year 76.6 78.7 80.7 82.1 82.6 82.5 82.7 82.7Second Year 67.8 69.9 72.2 73.2 73.7 73.8 73.9
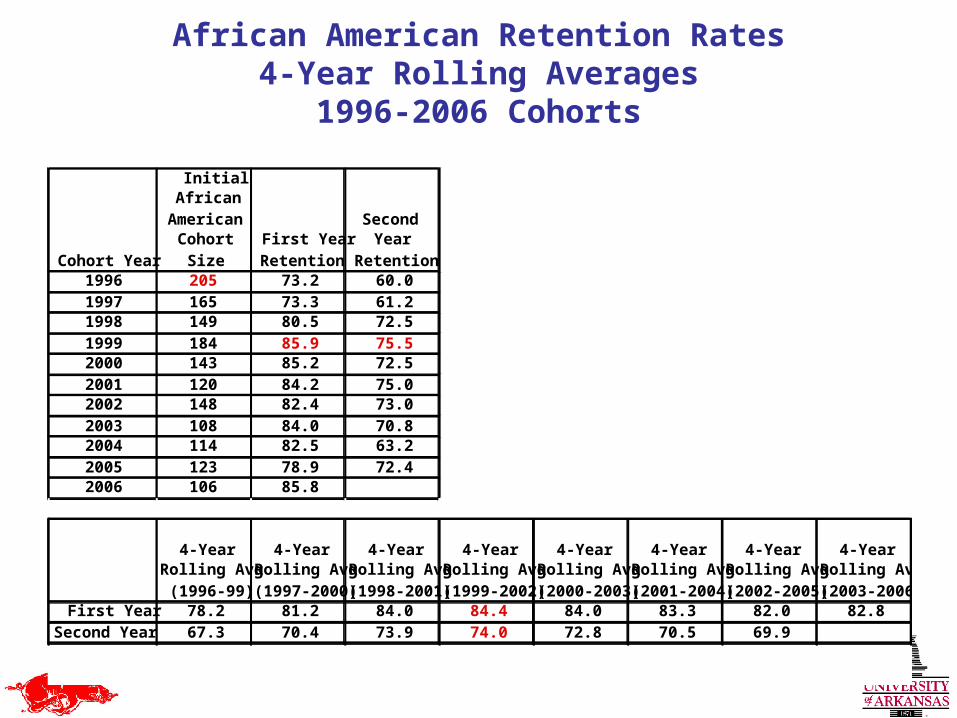
African American Retention Rates4-Year Rolling Averages
1996-2006 Cohorts
Cohort Year
Initial African
American Cohort
SizeFirst Year Retention
Second Year
Retention1996 205 73.2 60.01997 165 73.3 61.21998 149 80.5 72.51999 184 85.9 75.52000 143 85.2 72.52001 120 84.2 75.02002 148 82.4 73.02003 108 84.0 70.82004 114 82.5 63.22005 123 78.9 72.42006 106 85.8
4-Year Rolling Avg
(1996-99)
4-Year Rolling Avg (1997-2000)
4-Year Rolling Avg (1998-2001)
4-Year Rolling Avg (1999-2002)
4-Year Rolling Avg (2000-2003)
4-Year Rolling Avg (2001-2004)
4-Year Rolling Avg (2002-2005)
4-Year Rolling Avg (2003-2006)
First Year 78.2 81.2 84.0 84.4 84.0 83.3 82.0 82.8Second Year 67.3 70.4 73.9 74.0 72.8 70.5 69.9
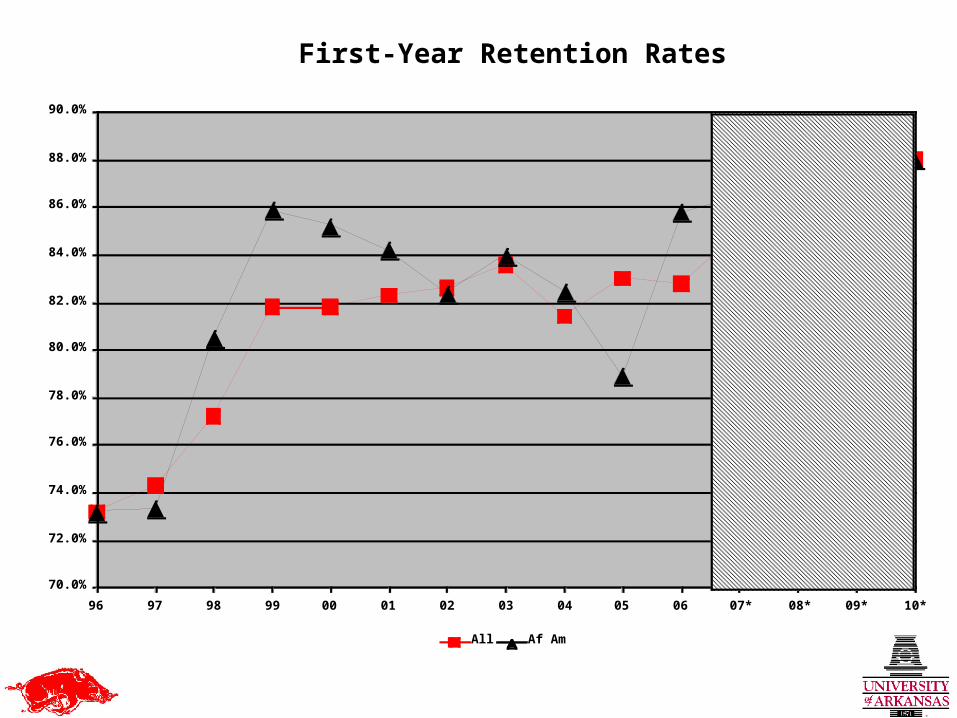
First-Year Retention Rates
70.0%
72.0%
74.0%
76.0%
78.0%
80.0%
82.0%
84.0%
86.0%
88.0%
90.0%
96 97 98 99 00 01 02 03 04 05 06 07* 08* 09* 10*
Cohort First-Year Retention Rate
All Af Am

Second-Year Retention Rates
60.0%
65.0%
70.0%
75.0%
80.0%
85.0%
96 97 98 99 0 1 2 3 4 5 6 07* 08* 09*
Cohort Second-Year Retention Rate
All Af Am
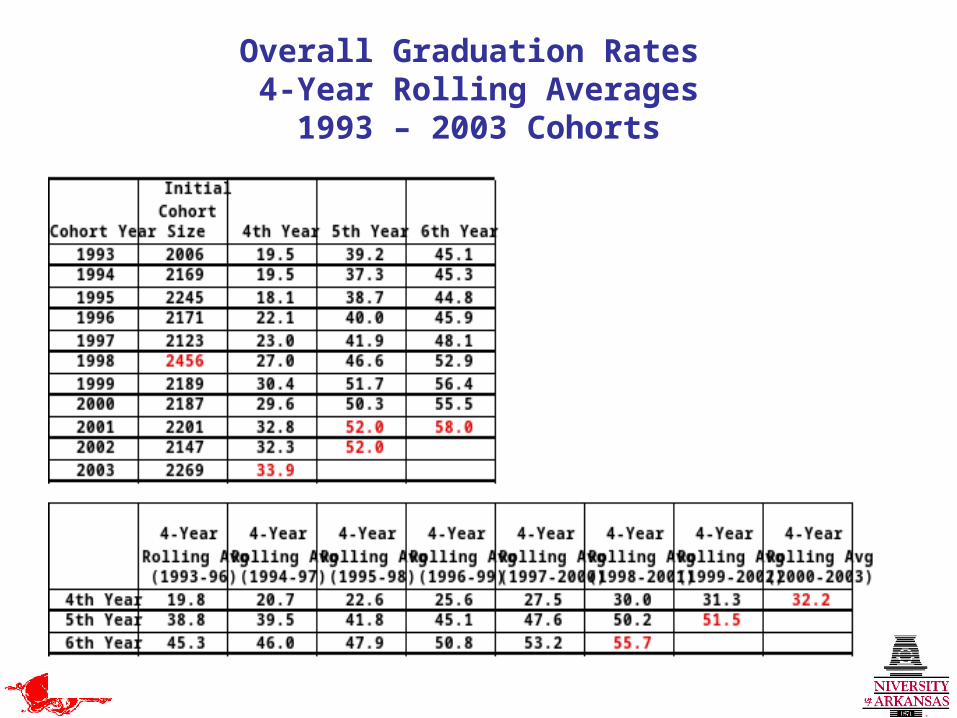
Overall Graduation Rates 4-Year Rolling Averages
1993 – 2003 Cohorts
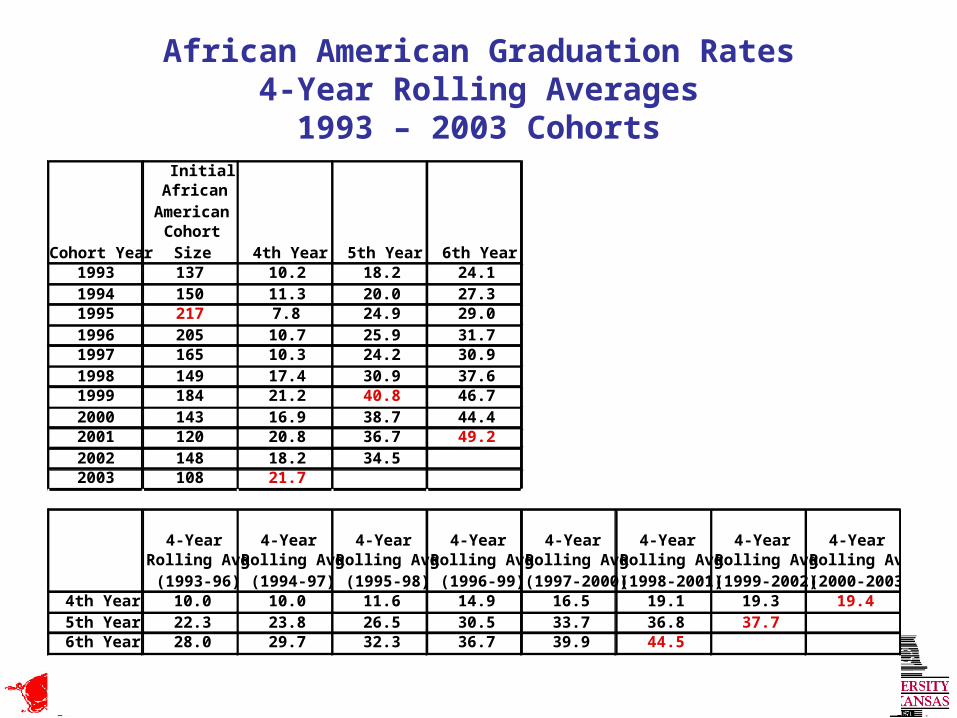
African American Graduation Rates4-Year Rolling Averages
1993 – 2003 Cohorts
Cohort Year
Initial African
American Cohort
Size 4th Year 5th Year 6th Year1993 137 10.2 18.2 24.11994 150 11.3 20.0 27.31995 217 7.8 24.9 29.01996 205 10.7 25.9 31.71997 165 10.3 24.2 30.91998 149 17.4 30.9 37.61999 184 21.2 40.8 46.72000 143 16.9 38.7 44.42001 120 20.8 36.7 49.22002 148 18.2 34.52003 108 21.7
4-Year Rolling Avg
(1993-96)
4-Year Rolling Avg
(1994-97)
4-Year Rolling Avg
(1995-98)
4-Year Rolling Avg
(1996-99)
4-Year Rolling Avg (1997-2000)
4-Year Rolling Avg (1998-2001)
4-Year Rolling Avg (1999-2002)
4-Year Rolling Avg (2000-2003)
4th Year 10.0 10.0 11.6 14.9 16.5 19.1 19.3 19.45th Year 22.3 23.8 26.5 30.5 33.7 36.8 37.76th Year 28.0 29.7 32.3 36.7 39.9 44.5
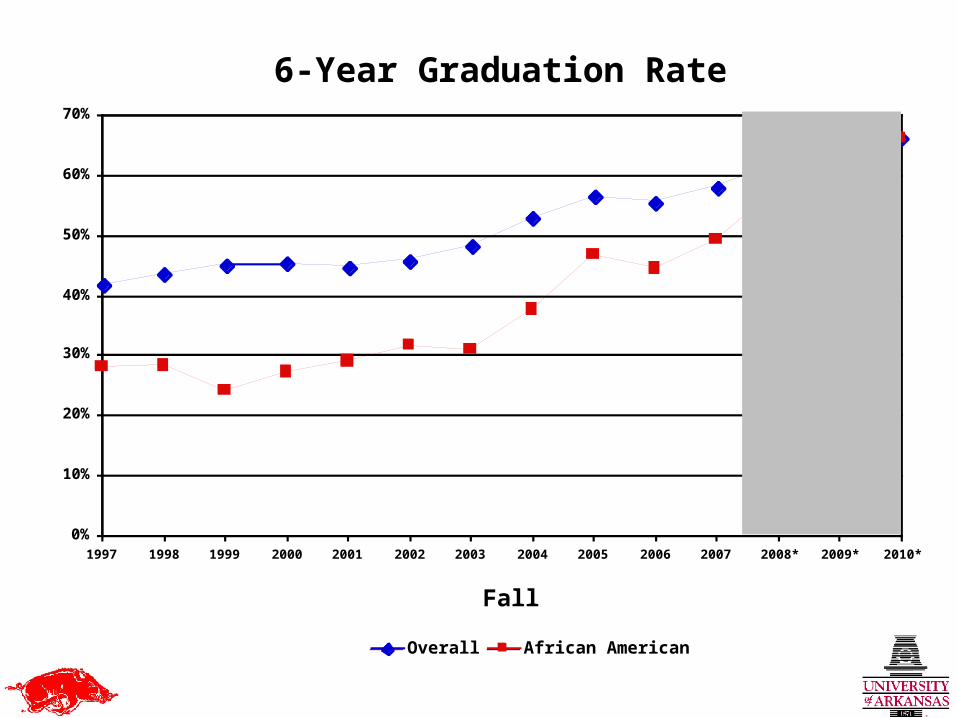
6-Year Graduation Rate
0%
10%
20%
30%
40%
50%
60%
70%
1997 1998 1999 2000 2001 2002 2003 2004 2005 2006 2007 2008* 2009* 2010*
Fall
Cohort Graduation Rate
Overall African American
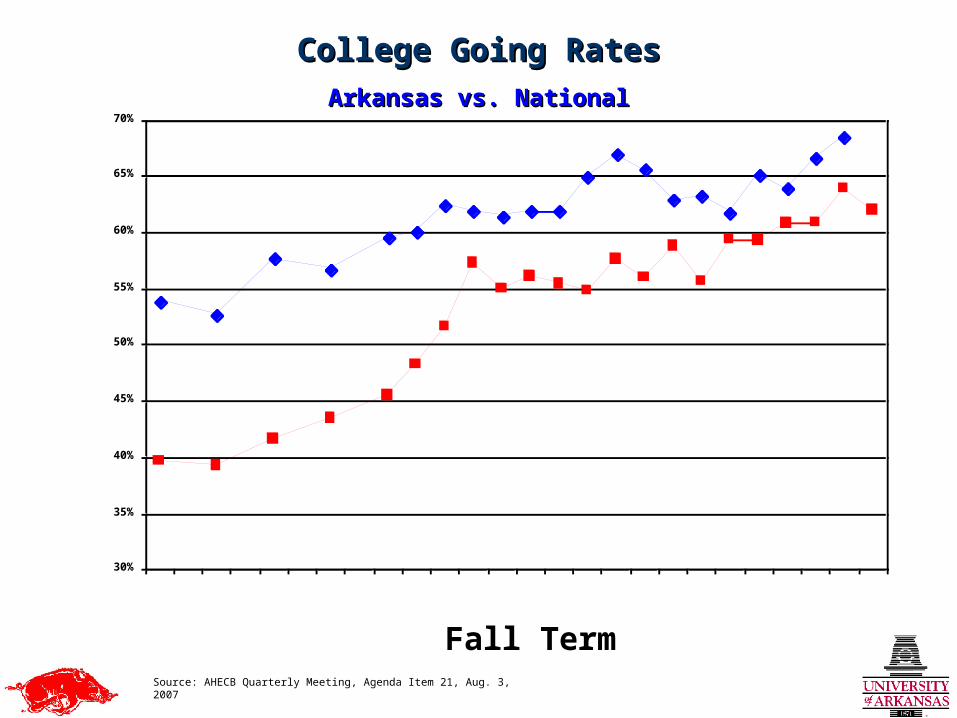
30%
35%
40%
45%
50%
55%
60%
65%
70%
1981 1982 1983 1984 1985 1986 1987 1988 1989 1990 1991 1992 1993 1994 1995 1996 1997 1998 1999 2000 2001 2002 2003 2004 2005 2006
Fall Term
College Going Rate (%)
College Going RatesCollege Going Rates
Arkansas vs. NationalArkansas vs. National
Source: AHECB Quarterly Meeting, Agenda Item 21, Aug. 3, 2007

UA Enrollment
14,000
14,500
15,000
15,500
16,000
16,500
17,000
17,500
18,000
18,500
19,000
89 90 91 92 93 94 95 96 97 98 99 00 01 02 03 04 05 06 07
Fall
Headcount Enrollment
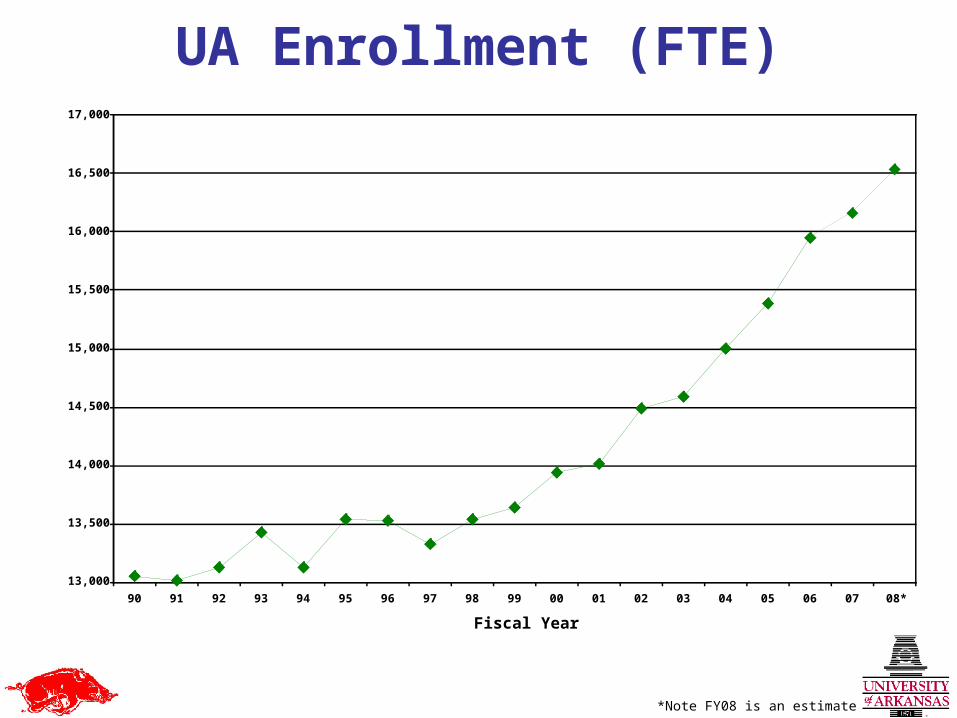
13,000
13,500
14,000
14,500
15,000
15,500
16,000
16,500
17,000
90 91 92 93 94 95 96 97 98 99 00 01 02 03 04 05 06 07 08*
Fiscal Year
FTE Enrollment
UA Enrollment (FTE)
*Note FY08 is an estimate
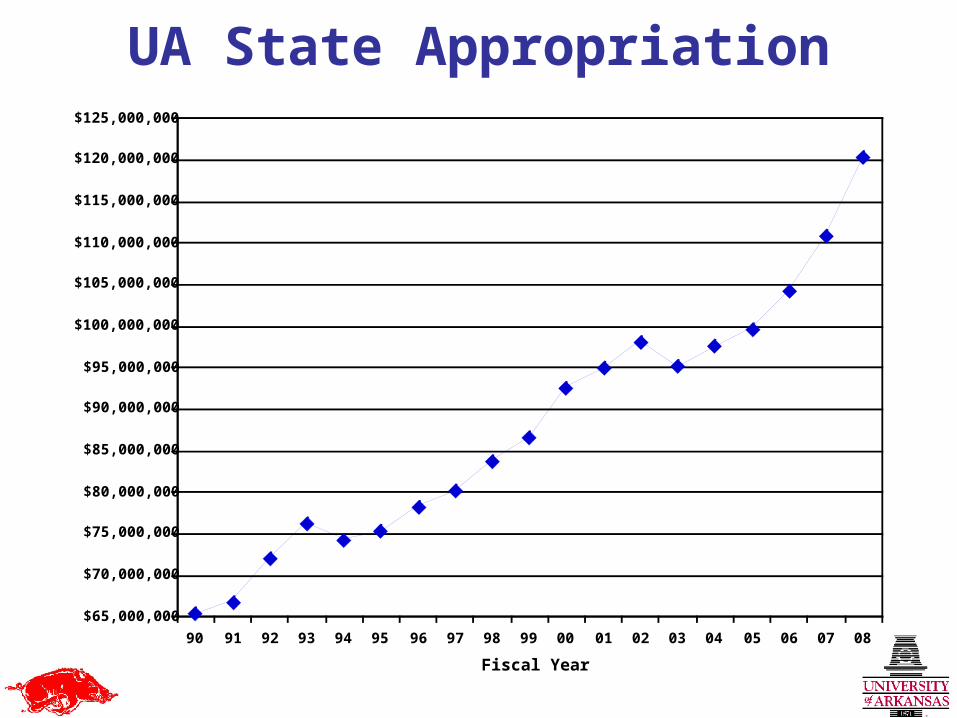
UA State Appropriation
$65,000,000
$70,000,000
$75,000,000
$80,000,000
$85,000,000
$90,000,000
$95,000,000
$100,000,000
$105,000,000
$110,000,000
$115,000,000
$120,000,000
$125,000,000
90 91 92 93 94 95 96 97 98 99 00 01 02 03 04 05 06 07 08
Fiscal Year
UA Appropriation
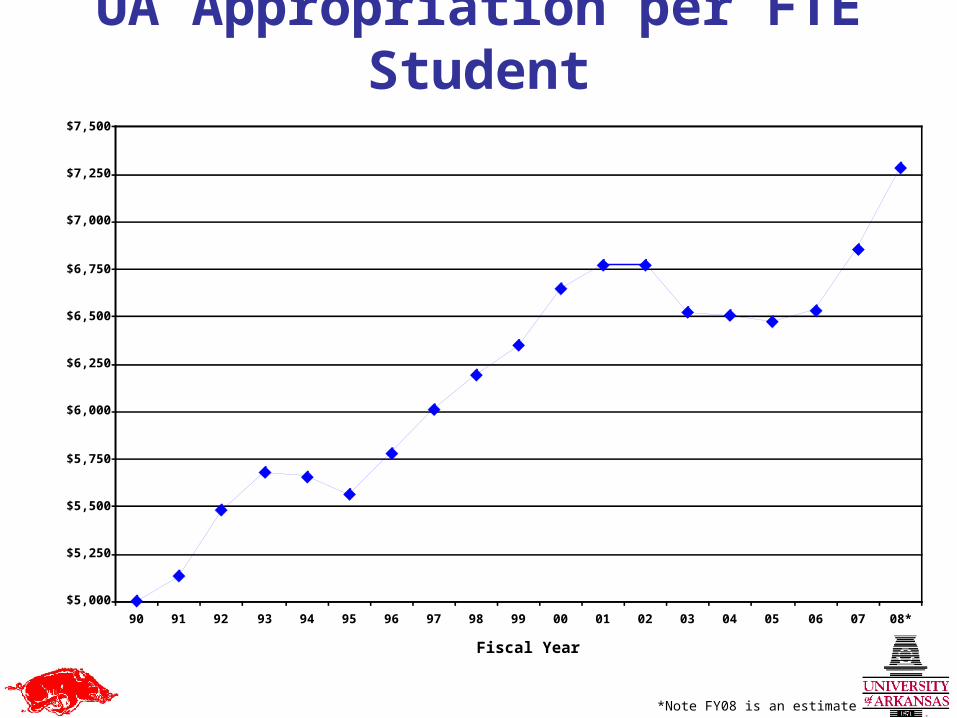
UA Appropriation per FTE Student
$5,000
$5,250
$5,500
$5,750
$6,000
$6,250
$6,500
$6,750
$7,000
$7,250
$7,500
90 91 92 93 94 95 96 97 98 99 00 01 02 03 04 05 06 07 08*
Fiscal Year
Annual Appropriation/FTE Student
*Note FY08 is an estimate
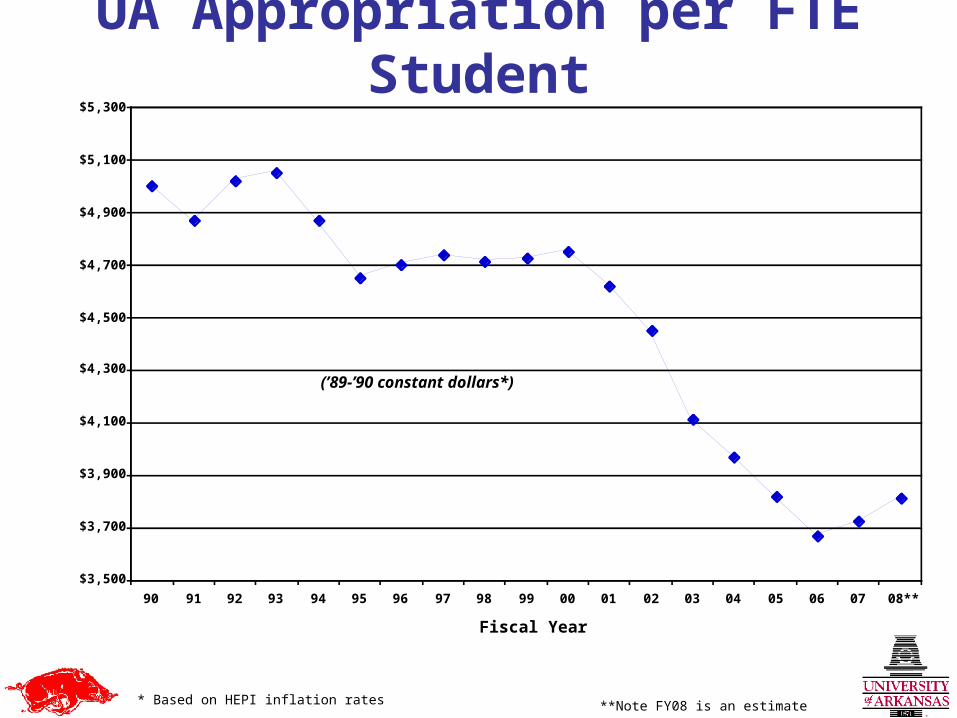
$3,500
$3,700
$3,900
$4,100
$4,300
$4,500
$4,700
$4,900
$5,100
$5,300
90 91 92 93 94 95 96 97 98 99 00 01 02 03 04 05 06 07 08**
Fiscal Year
Annual Appropriation/FTE Student
UA Appropriation per FTE Student
(’89-’90 constant dollars*)
* Based on HEPI inflation rates **Note FY08 is an estimate
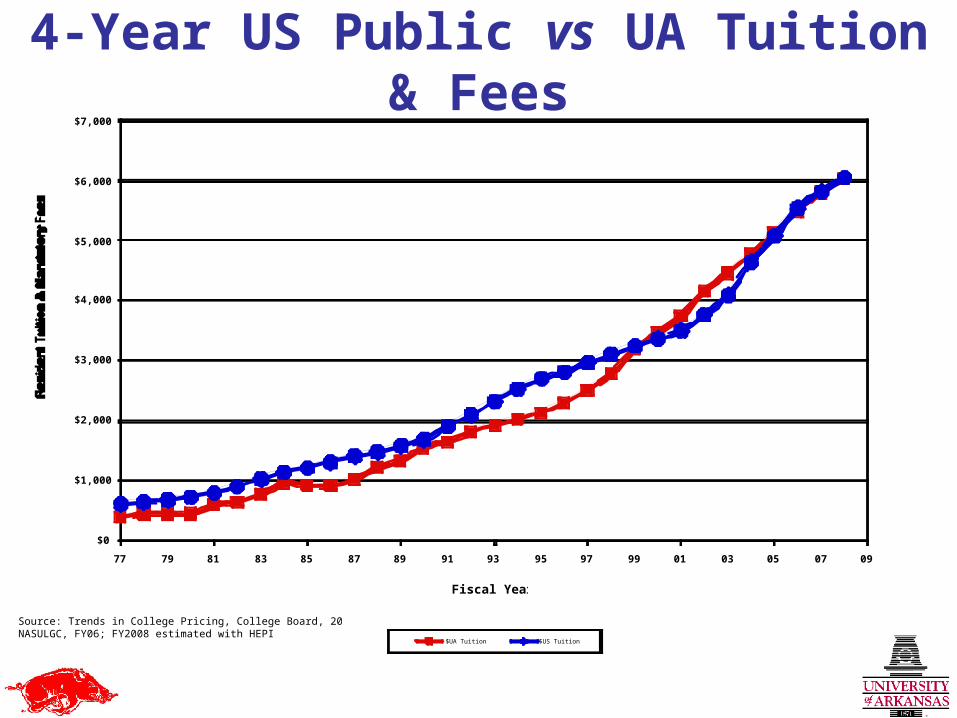
4-Year US Public vs UA Tuition & Fees
$0
$1,000
$2,000
$3,000
$4,000
$5,000
$6,000
$7,000
77 79 81 83 85 87 89 91 93 95 97 99 01 03 05 07 09
Fiscal Year
$UA Tuition $US Tuition
Source: Trends in College Pricing, College Board, 2004, 2007; NASULGC, FY06; FY2008 estimated with HEPI
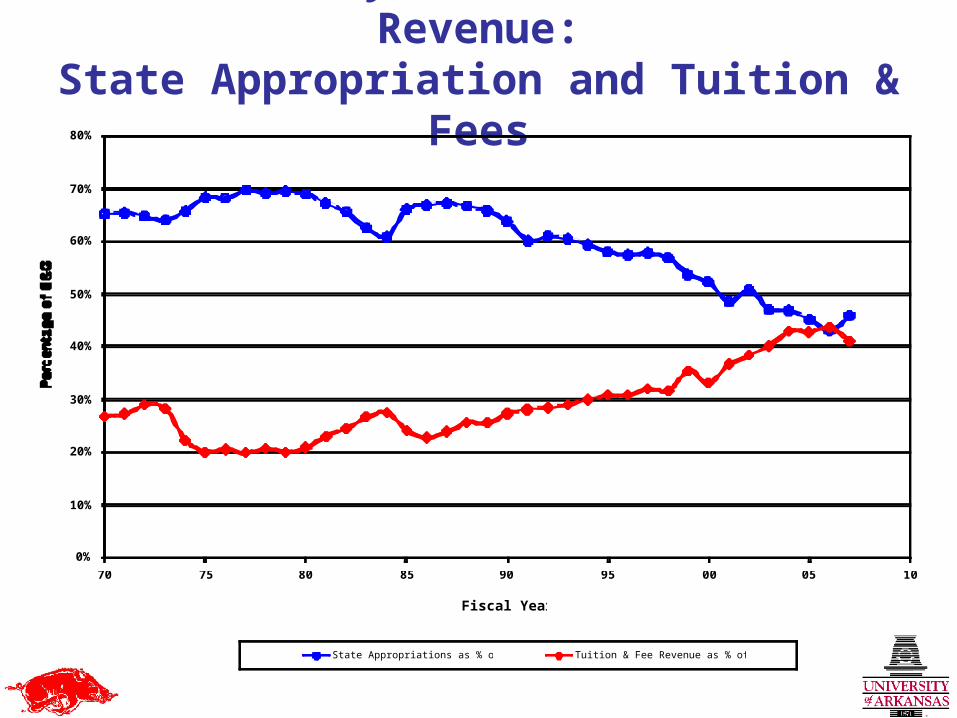
Two Primary Sources of UA E&G Revenue:State Appropriation and Tuition & Fees
0%
10%
20%
30%
40%
50%
60%
70%
80%
70 75 80 85 90 95 00 05 10
Fiscal Year
State Appropriations as % of E&G Tuition & Fee Revenue as % of E&G

How Was State Funding Determined?How Was State Funding Determined?

Discipline Conversions for the Need -Based Model*Discipline CIP
Cost Category Code Discipline Description
23 English Language and Literature/Letters
24 Liberal Arts, General Studies 27 Mathematics
30 Multi/Interdisciplinary Studies34 Health-Related Knowledge & Sk
35 Interpersonal Skills36 Leisure And Recreational Acts
37 Personal Awareness/Self Improvement
38 Philosophy & Religion 42 Psychology
43 Philosophy & Religion 44 Public Administration And Services
45 Social Sciences & History
5 Area, Ethnic, & Cultural Studies
8 Marketing And Distribution 9 Communications
12 Cons. Per. & Misc. Ser. 13 Education
16 Foreign Languages and Literature 19 Home Economics
20 Vocational Home Economics22 Law And Legal Studies
26 Biological Sci/Life Sciences 31 Parks,Recreation & Leisure Studies
32 Basic Skills
46 Construction Trades 47 Mechanics And Repairers
48 Precision Production Trades 49 Transprtation & Material Moving
52 Business Management & Administration
1 Agricultural Business and Production
2 Agricultural Sciences 3 Conservation and Renewable Natural Resources
4 Architecture & Related Program10 Communications Tech
11 Computer & Informational Sciences. 25 Library Science
40 Physical Sciences 41 Sciences Tech.
50 Visual & Performing Arts 51 Health Professions & Related Science
14 Engineering
15 Engineering-Related Technology
*Based upon a multi-year study of expenditures of 175 Institutions by the University of Delaware
Cost Category I
Cost Category II
Cost Category III
Cost Category IV
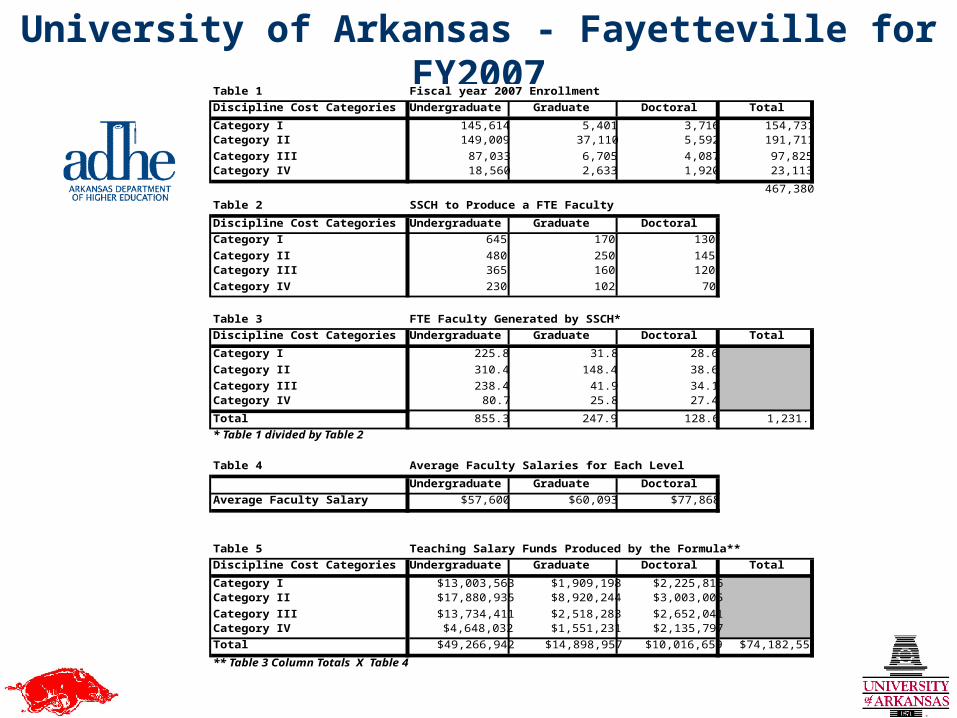
University of Arkansas - Fayetteville for FY2007Table 1 Fiscal year 2007 Enrollment
Discipline Cost Categories Undergraduate Graduate Doctoral Total
Category I 145,614 5,401 3,716 154,731Category II 149,009 37,110 5,592 191,711
Category III 87,033 6,705 4,087 97,825Category IV 18,560 2,633 1,920 23,113
467,380
Table 2 SSCH to Produce a FTE Faculty
Discipline Cost Categories Undergraduate Graduate Doctoral
Category I 645 170 130
Category II 480 250 145Category III 365 160 120
Category IV 230 102 70
Table 3 FTE Faculty Generated by SSCH*
Discipline Cost Categories Undergraduate Graduate Doctoral Total
Category I 225.8 31.8 28.6
Category II 310.4 148.4 38.6
Category III 238.4 41.9 34.1Category IV 80.7 25.8 27.4
Total 855.3 247.9 128.6 1,231.9
* Table 1 divided by Table 2
Table 4 Average Faculty Salaries for Each Level
Undergraduate Graduate Doctoral
Average Faculty Salary $57,600 $60,093 $77,868
Table 5 Teaching Salary Funds Produced by the Formula**
Discipline Cost Categories Undergraduate Graduate Doctoral Total
Category I $13,003,563 $1,909,198 $2,225,816Category II $17,880,935 $8,920,244 $3,003,005
Category III $13,734,411 $2,518,283 $2,652,041Category IV $4,648,032 $1,551,231 $2,135,797
Total $49,266,942 $14,898,957 $10,016,659 $74,182,558
** Table 3 Column Totals X Table 4
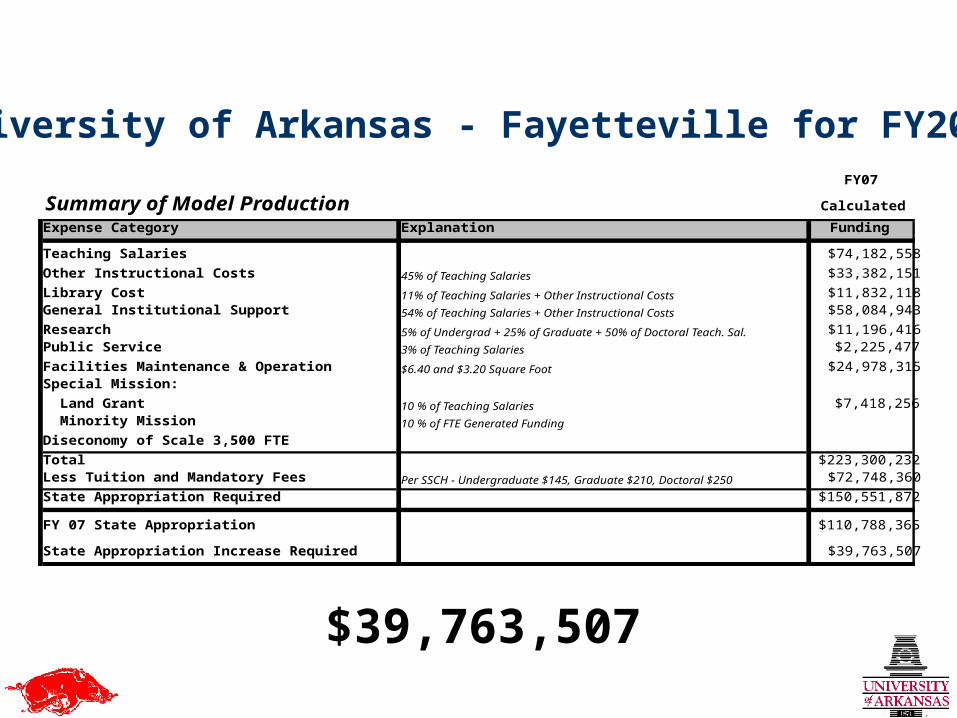
University of Arkansas - Fayetteville for FY2007
$39,763,507
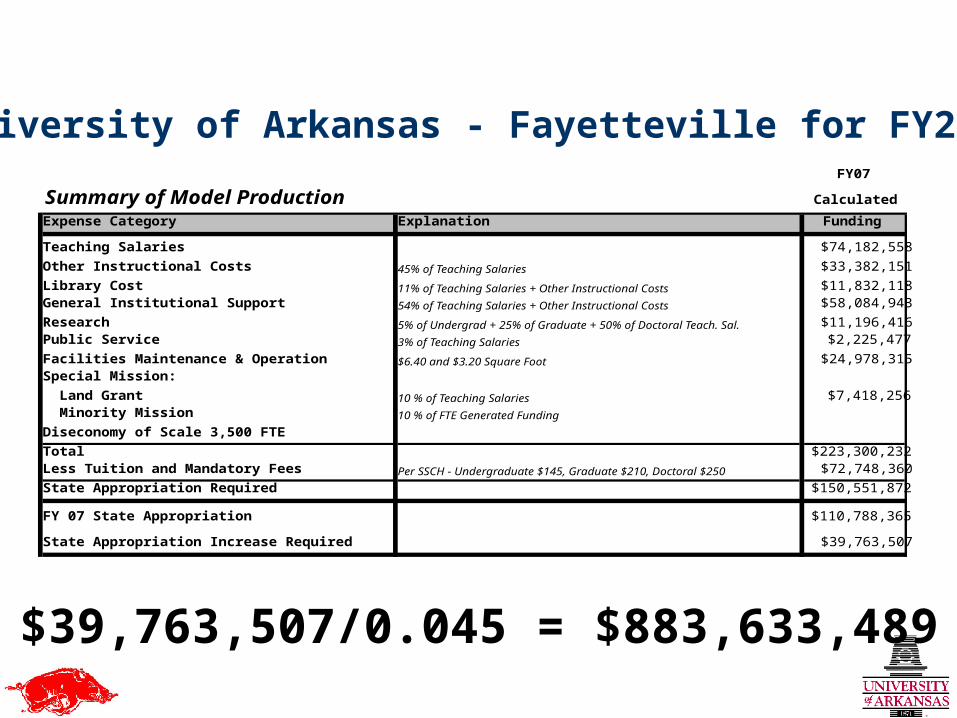
University of Arkansas - Fayetteville for FY2007
$39,763,507/0.045 = $883,633,489
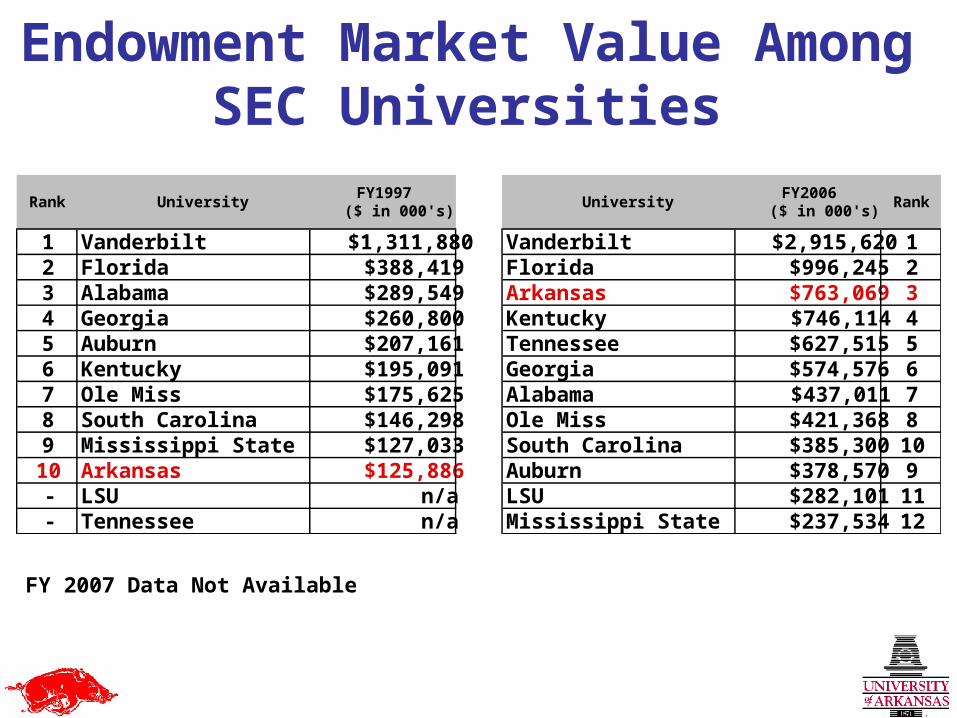
Endowment Market Value Among SEC Universities
FY 2007 Data Not Available
Rank UniversityFY1997
($ in 000's)University
FY2006($ in 000's)
Rank
1 Vanderbilt $1,311,880 Vanderbilt $2,915,620 12 Florida $388,419 Florida $996,245 23 Alabama $289,549 Arkansas $763,069 34 Georgia $260,800 Kentucky $746,114 45 Auburn $207,161 Tennessee $627,515 56 Kentucky $195,091 Georgia $574,576 67 Ole Miss $175,625 Alabama $437,011 78 South Carolina $146,298 Ole Miss $421,368 89 Mississippi State $127,033 South Carolina $385,300 1010 Arkansas $125,886 Auburn $378,570 9- LSU n/a LSU $282,101 11- Tennessee n/a Mississippi State $237,534 12
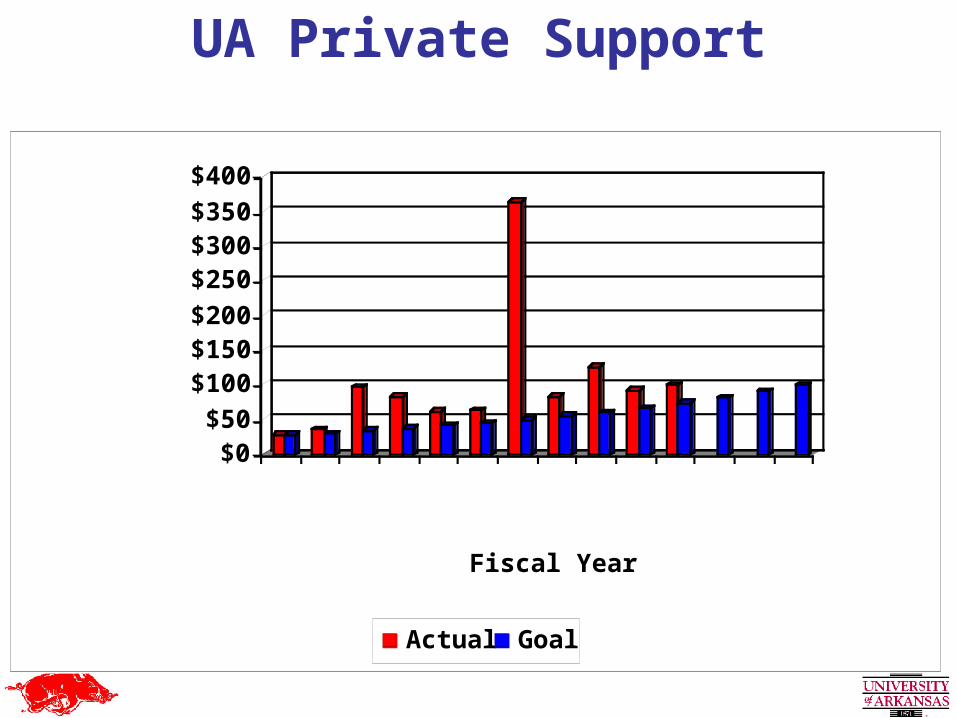
UA Private Support
$0$50
$100$150$200
$250$300$350
$400
$ Millions
1997 1999 2001 2003 2005 2007 2009
Fiscal Year
Actual Goal
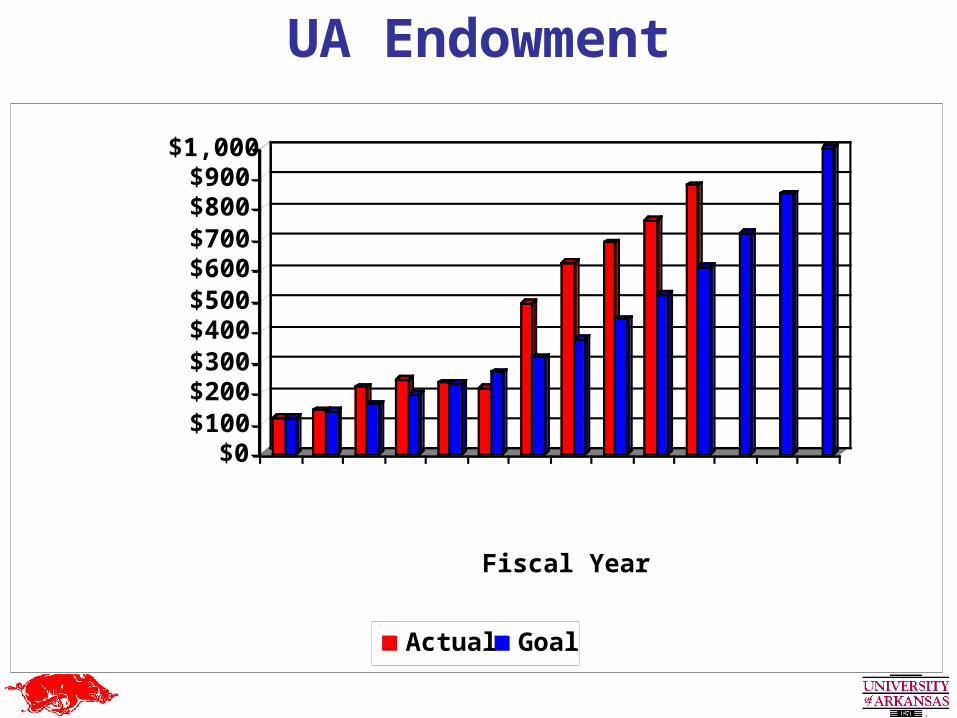
UA Endowment
$0$100$200$300$400$500$600$700$800$900
$1,000
$ Millions
1997 1999 2001 2003 2005 2007 2009
Fiscal Year
Actual Goal
Priorities & ChallengesPriorities & Challenges
Diversity #1 Strengthening the Graduate
Research Program New Funding Formula Sustainability Strengthening the Base –
the Undergraduate Program Delivering THE MESSAGE!

There are many reasons to feel very good about what has been accomplished
However, we dare not rest on our laurels
Much remains to be done We must “stay the course” in
our pursuit of the 2010 goals We must be more attentive
and responsive to new and emerging opportunities
Closing ThoughtsClosing Thoughts

???????????????????????????????????????????????????????????? ??????????????????????????????????????????????????????????
??


