22
August 2014 Technical Brief Demographic profile Using secondary data
August 2014
Technical Brief
Demographic profile Using secondary data
Technical Brief Demographic Profile
2
Contents
1. Introduction .................................................................................................................................... 3
2. What are demographic data? ......................................................................................................... 4
3. Guidance Sheets – if you have a few days ...................................................................................... 4
4. Quick-start - if you have one hour ................................................................................................. 17
5. Abbreviations, Definitions and Formulas ...................................................................................... 18
6. Sample calculations....................................................................................................................... 20
7. References .................................................................................................................................... 20
Acknowledgements
ACAPS wishes to express its gratitude to the author of the document, Siri Tellier
(Copenhagen University School of Global Health), as well as to the reviewer, Mathias Lerch
(University of Geneva), Richard Garfield (CDC) and Xavier de Radigues (WHO).
Technical Brief Demographic Profile
3
1. Introduction
Data on births, deaths, location, age and sex
structure of the affected populations are
essential resources and tools in emergencies,
both natural disasters and complex
emergencies. They guide operational and
strategic response, and facilitate reporting to
decision makers, political leaders and the
general public1.
Humanitarian operational standards and
guidelines contain numerous references to such
data as a basis for action (e.g. the guideline
may be to vaccinate all children aged <5, and
for that you need to know how many children
are in that age group). They are also seen as
important to establish what the pre-disaster
baseline was, in order to estimate the severity
of the change (e.g. the level of excess mortality,
displacement, etc.).
However, in the initial days and weeks following
a disaster, detailed primary data are difficult to
assemble due to several constraints, including
time pressure, security, access, and population
displacement. To assist in that situation, there
is widespread use of ‘standard populations’
(e.g. UNHCR 2007, SPHERE 2011, JH and
IFRC 2008). Such standards rely on averages
(e.g. that children aged <5 constitute an
average of 9.32% of the global total population).
However, standard populations vary among
guidelines and sources. At times they are
decades out of date, yet are presented with
misleading precision. In reality, populations are
demographically very diverse, and may differ
markedly from standard populations For
example, children aged <5 constitute 4%, 7.5%
and 22% of the population in Japan, Brazil and
Niger respectively. Also, terminologies are
inconsistent (e.g. the term ‘children’ may not be
well defined in terms of age, and the same
applies to other age groups such as ‘older
people’).
1 For a basic introduction to demography, see the 2011 Population Reference Bureau Handbook and 2009 (Haub) for an analysis of demographic trends and their humanitarian impact.
Yet, context specific and up-to-date secondary
data, at least at the national level, are easy to
estimate or access, giving a better baseline
than standard populations. A basic
interpretation of secondary data can provide a
better understanding of trends, including the
highly political estimates of mortality and
displacement.
Therefore, the purpose of this technical brief is
to assist humanitarian workers in using
secondary demographic data in emergencies. It
recommends building a context specific
demographic profile based on available
information. It proposes some rule-of-thumb
standards, which can be adapted to the local
context, tailoring to the purpose and the time
available. The document provides:
Long term guidance sheets (if you have a
few days): identifying demographic ‘mega
trends’, and possible interactions with
disaster risk, impact and response. This
broader perspective is essential for
interpreting data in emergencies, and as
input for longer term strategy (e.g. CAP or
SRP)2.
Short term quick start (if you have an hour):
accessing demographic data for immediate
operational needs in a specific emergency,
such as input in a flash appeal (e.g. within
24-48 hours).
Clearly, this supplements, rather than replaces,
the need for primary data, but is intended to be
helpful in preparing for large scale primary data
collection, and in triangulating the results3.
This brief attempts only to sketch the overall
dimensions. There is a large body of evidence
especially on mortality in disasters, but little on
other aspects, e.g. fertility (UN 2011). This is
despite the fact that demography is particularly
interactive – change one dimension and all the
other dimensions are also likely to change.
2 Consolidated Appeals Process or Strategic Response Plan 3 For guidance on how to collect primary demographic data in emergencies, see the ACAPS 2012: Estimation of affected population figures. See also Reed, 2002 and UN 2011.
Technical Brief Demographic Profile
4
2. What are demographic data?
Demography is the quantitative study of
populations. Demographic data, in their
simplest form, refer to six interacting
dimensions:
Births, deaths, migration (and resulting
population growth)
Age, sex, spatial distribution (and resulting
population structure).
The following chapters give guidance sheets on
each of those dimensions. In addition, we have
added details on a few issues of special
concern to humanitarians: households and
disability.
Even in non-emergency situations, accurate
demographic data are often difficult to gather.
For example, globally about one third of births
and two thirds of deaths are not accurately
recorded (Setel 2007). Apart from the problems
this poses for protection of rights (e.g. if
children have no birth certificate), this means
that many people do not know their precise age
or that death, or its cause, is not recorded. The
existing secondary data are therefore the result
of several decades of demographic analysis
and consultations among a wide range of
experts, using demographic modeling. ‘Raw
data’ are often of questionable use: they need
assessment and interpretation.
In emergencies, it is even more challenging to
collect and analyze demographic data.
Furthermore, some data may change radically
in emergencies (e.g. mortality, displacement),
while others remain relatively stable in the short
term (e.g. age, fertility).
Demography is quantitative, and precise use of
metrics is important. Imprecise definitions are
major causes of confusion and disagreement in
the utilization of demographic data. Therefore,
definitions and formulas are provided
throughout this technical brief. We have taken
the liberty of sometimes expressing e.g. birth
rates in % rather than per 1,000, because it is
our experience that they are easier to
remember that way.
The main source used throughout this
document is UN Population Prospects,
produced by the UN Department of Economic
and Social Affairs. It is not the only good
source, but it is helpful to use sources
consistently to facilitate comparisons, and to
provide a simple procedure, with easily
accessible, high quality and widely accepted
data. Other sources are also listed, many of
them building on the same (imperfect) data
sources, e.g.:
UNData (http://data.un.org),
Gapminder (http://www.gapminder.org)
DHS/measure (http://www.dhsprogram.com)
In-depth ( http://www.indepth-network.org/)
3. Guidance Sheets – if you have a few days
a. Fertility (Births)
Metrics and terminology
Fertility denotes the number of births, whereas
fecundity refers to the ability to become
pregnant (or to impregnate); terminology differs
across languages and cultures. The most
commonly used metrics for fertility are:
Number of births, e.g. per year
Crude Birth Rate (CBR): the number of live
births per 1,000 mid-year population per
year. It can also be expressed as percent
Age-specific fertility: the annual number of
births to women of a certain age group, per
1,000 women of that age group.
Total Fertility Rate (TFR): the average
number of children a woman would be
expected to have during her lifetime
In emergencies, the first two metrics are useful
for operational planning, for example, to project
how many birthing kits will be needed. The TFR
is a synthetic metric, based on age specific
rates. Age specific rates are essential in order
to understand demographic trends, but they are
rarely possible or useful to calculate in
emergencies. However, it is helpful in
establishing the baseline demographic profile,
since fertility is the single most important driver
of other demographic metrics. Once you know
the TFR, you can make a rough estimate of the
rest.
Technical Brief Demographic Profile
5
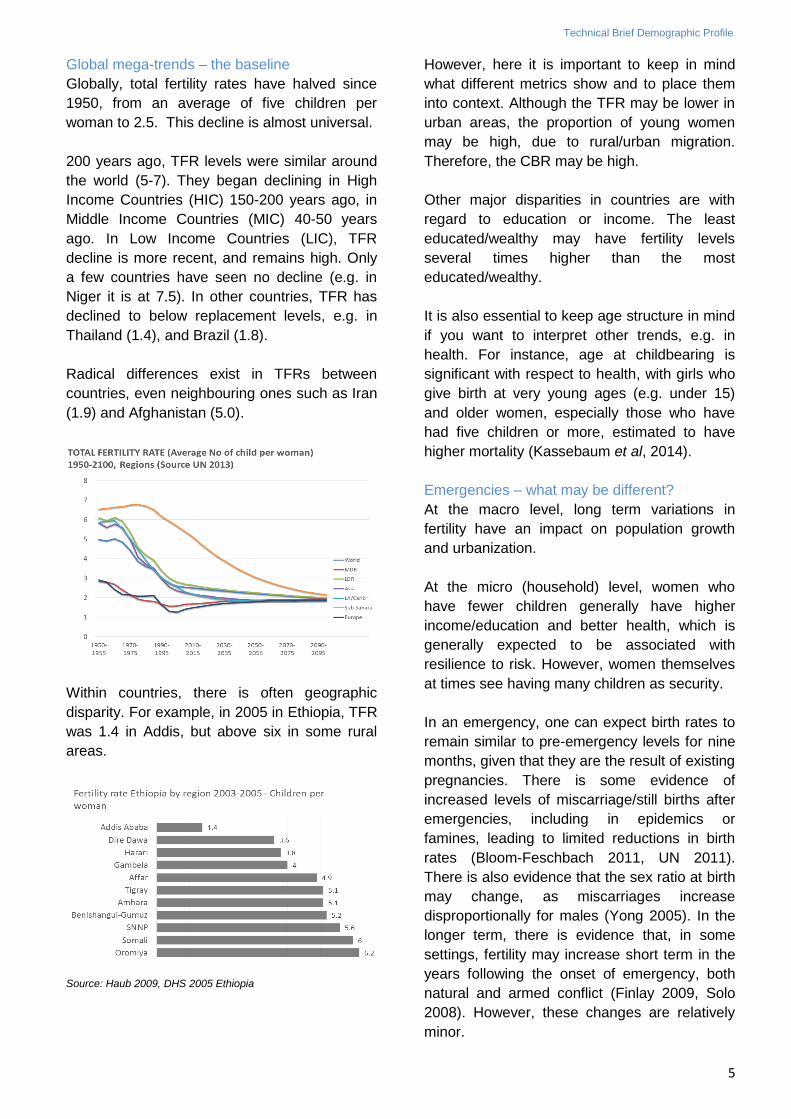
Global mega-trends – the baseline
Globally, total fertility rates have halved since
1950, from an average of five children per
woman to 2.5. This decline is almost universal.
200 years ago, TFR levels were similar around
the world (5-7). They began declining in High
Income Countries (HIC) 150-200 years ago, in
Middle Income Countries (MIC) 40-50 years
ago. In Low Income Countries (LIC), TFR
decline is more recent, and remains high. Only
a few countries have seen no decline (e.g. in
Niger it is at 7.5). In other countries, TFR has
declined to below replacement levels, e.g. in
Thailand (1.4), and Brazil (1.8).
Radical differences exist in TFRs between
countries, even neighbouring ones such as Iran
(1.9) and Afghanistan (5.0).
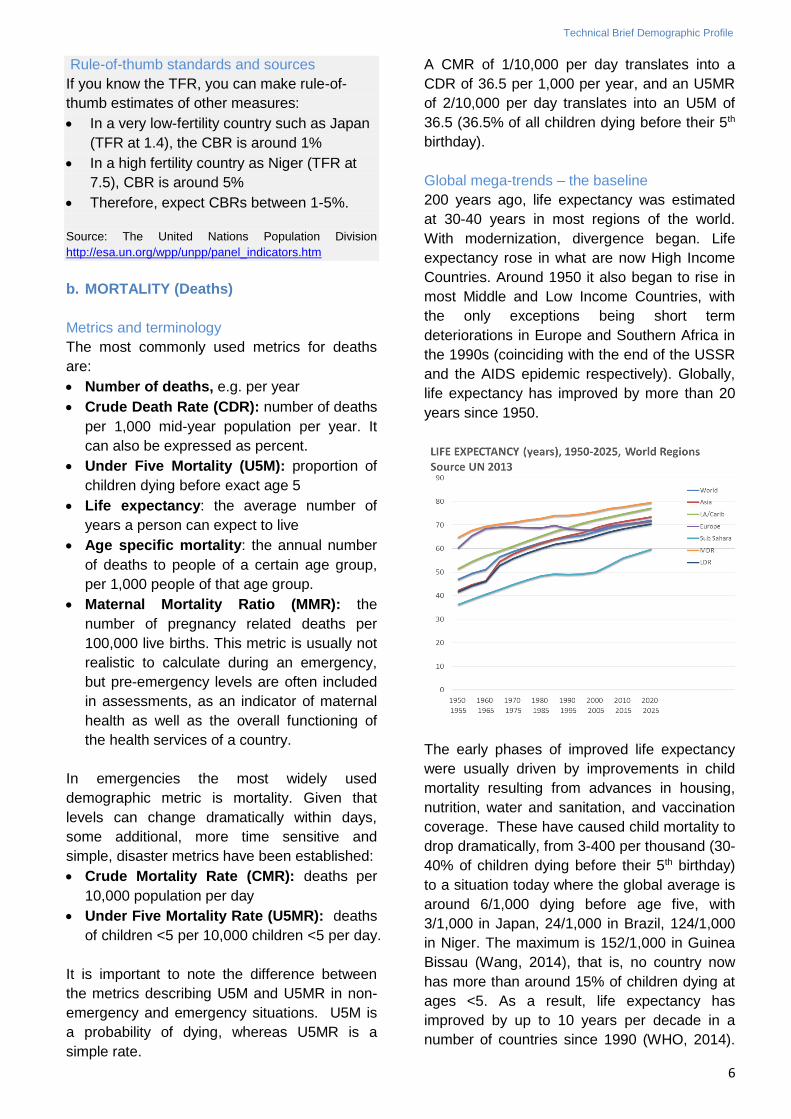
Within countries, there is often geographic
disparity. For example, in 2005 in Ethiopia, TFR
was 1.4 in Addis, but above six in some rural
areas.
Source: Haub 2009, DHS 2005 Ethiopia
However, here it is important to keep in mind
what different metrics show and to place them
into context. Although the TFR may be lower in
urban areas, the proportion of young women
may be high, due to rural/urban migration.
Therefore, the CBR may be high.
Other major disparities in countries are with
regard to education or income. The least
educated/wealthy may have fertility levels
several times higher than the most
educated/wealthy.
It is also essential to keep age structure in mind
if you want to interpret other trends, e.g. in
health. For instance, age at childbearing is
significant with respect to health, with girls who
give birth at very young ages (e.g. under 15)
and older women, especially those who have
had five children or more, estimated to have
higher mortality (Kassebaum et al, 2014).
Emergencies – what may be different?
At the macro level, long term variations in
fertility have an impact on population growth
and urbanization.
At the micro (household) level, women who
have fewer children generally have higher
income/education and better health, which is
generally expected to be associated with
resilience to risk. However, women themselves
at times see having many children as security.
In an emergency, one can expect birth rates to
remain similar to pre-emergency levels for nine
months, given that they are the result of existing
pregnancies. There is some evidence of
increased levels of miscarriage/still births after
emergencies, including in epidemics or
famines, leading to limited reductions in birth
rates (Bloom-Feschbach 2011, UN 2011).
There is also evidence that the sex ratio at birth
may change, as miscarriages increase
disproportionally for males (Yong 2005). In the
longer term, there is evidence that, in some
settings, fertility may increase short term in the
years following the onset of emergency, both
natural and armed conflict (Finlay 2009, Solo
2008). However, these changes are relatively
minor.
Technical Brief Demographic Profile
6
Rule-of-thumb standards and sources
If you know the TFR, you can make rule-of-
thumb estimates of other measures:
In a very low-fertility country such as Japan
(TFR at 1.4), the CBR is around 1%
In a high fertility country as Niger (TFR at
7.5), CBR is around 5%
Therefore, expect CBRs between 1-5%.
Source: The United Nations Population Division
http://esa.un.org/wpp/unpp/panel_indicators.htm
b. MORTALITY (Deaths)
Metrics and terminology
The most commonly used metrics for deaths
are:
Number of deaths, e.g. per year
Crude Death Rate (CDR): number of deaths
per 1,000 mid-year population per year. It
can also be expressed as percent.
Under Five Mortality (U5M): proportion of
children dying before exact age 5
Life expectancy: the average number of
years a person can expect to live
Age specific mortality: the annual number
of deaths to people of a certain age group,
per 1,000 people of that age group.
Maternal Mortality Ratio (MMR): the
number of pregnancy related deaths per
100,000 live births. This metric is usually not
realistic to calculate during an emergency,
but pre-emergency levels are often included
in assessments, as an indicator of maternal
health as well as the overall functioning of
the health services of a country.
In emergencies the most widely used
demographic metric is mortality. Given that
levels can change dramatically within days,
some additional, more time sensitive and
simple, disaster metrics have been established:
Crude Mortality Rate (CMR): deaths per
10,000 population per day
Under Five Mortality Rate (U5MR): deaths
of children <5 per 10,000 children <5 per day.
It is important to note the difference between
the metrics describing U5M and U5MR in non-
emergency and emergency situations. U5M is
a probability of dying, whereas U5MR is a
simple rate.
A CMR of 1/10,000 per day translates into a
CDR of 36.5 per 1,000 per year, and an U5MR
of 2/10,000 per day translates into an U5M of
36.5 (36.5% of all children dying before their 5th
birthday).
Global mega-trends – the baseline
200 years ago, life expectancy was estimated
at 30-40 years in most regions of the world.
With modernization, divergence began. Life
expectancy rose in what are now High Income
Countries. Around 1950 it also began to rise in
most Middle and Low Income Countries, with
the only exceptions being short term
deteriorations in Europe and Southern Africa in
the 1990s (coinciding with the end of the USSR
and the AIDS epidemic respectively). Globally,
life expectancy has improved by more than 20
years since 1950.
The early phases of improved life expectancy
were usually driven by improvements in child
mortality resulting from advances in housing,
nutrition, water and sanitation, and vaccination
coverage. These have caused child mortality to
drop dramatically, from 3-400 per thousand (30-
40% of children dying before their 5th birthday)
to a situation today where the global average is
around 6/1,000 dying before age five, with
3/1,000 in Japan, 24/1,000 in Brazil, 124/1,000
in Niger. The maximum is 152/1,000 in Guinea
Bissau (Wang, 2014), that is, no country now
has more than around 15% of children dying at
ages <5. As a result, life expectancy has
improved by up to 10 years per decade in a
number of countries since 1990 (WHO, 2014).
Technical Brief Demographic Profile
7
MMR has also declined dramatically. For
example, the estimated MMR for Niger a few
decades ago was around 2,000/100,000, today
it is estimated at around 600.
This improvement was part of the so-called
epidemiologic transition. This refers to a shift
from a situation where communicable diseases
and malnutrition (particularly affecting children),
and maternal deaths (affecting young women)
were the main cause of death, to the present
situation, where non-communicable diseases
(particularly affecting older people) are the main
cause. This dramatic shift has sometimes
happened in a few decades
As noted, mortality patterns are closely related
to the age and sex of the population concerned.
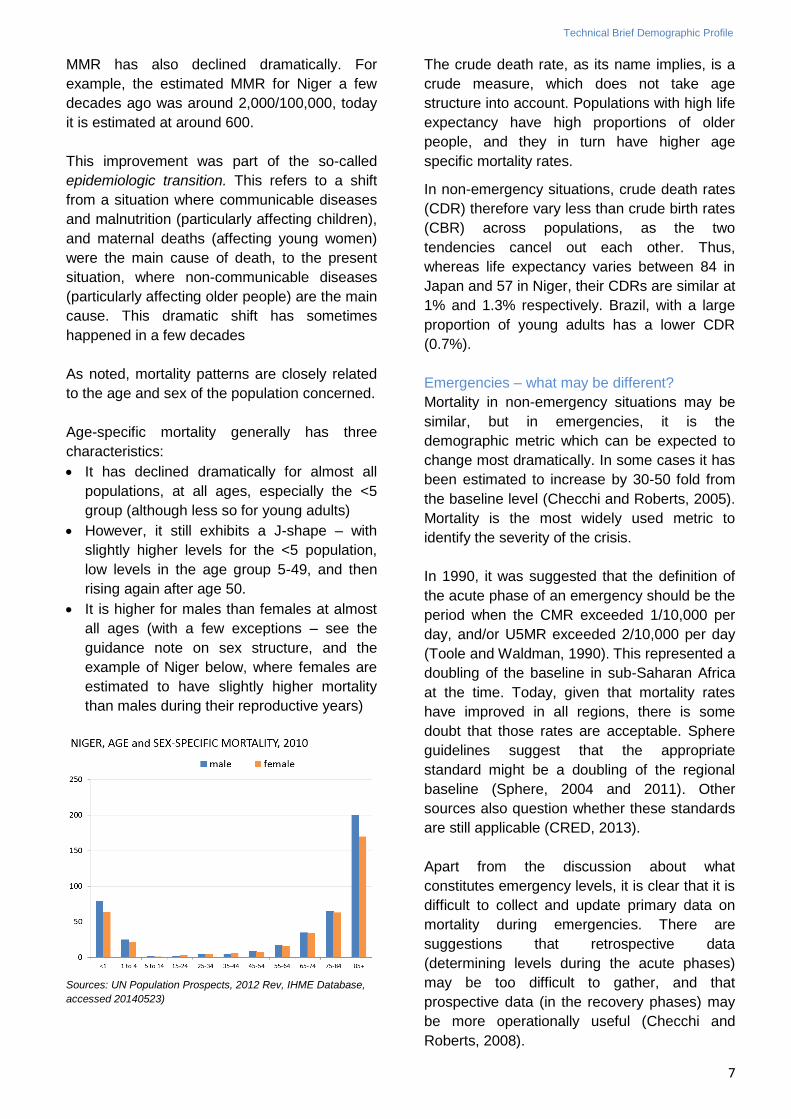
Age-specific mortality generally has three
characteristics:
It has declined dramatically for almost all
populations, at all ages, especially the <5
group (although less so for young adults)
However, it still exhibits a J-shape – with
slightly higher levels for the <5 population,
low levels in the age group 5-49, and then
rising again after age 50.
It is higher for males than females at almost
all ages (with a few exceptions – see the
guidance note on sex structure, and the
example of Niger below, where females are
estimated to have slightly higher mortality
than males during their reproductive years)
Sources: UN Population Prospects, 2012 Rev, IHME Database,
accessed 20140523)
The crude death rate, as its name implies, is a
crude measure, which does not take age
structure into account. Populations with high life
expectancy have high proportions of older
people, and they in turn have higher age
specific mortality rates.
In non-emergency situations, crude death rates
(CDR) therefore vary less than crude birth rates
(CBR) across populations, as the two
tendencies cancel out each other. Thus,
whereas life expectancy varies between 84 in
Japan and 57 in Niger, their CDRs are similar at
1% and 1.3% respectively. Brazil, with a large
proportion of young adults has a lower CDR
(0.7%).
Emergencies – what may be different?
Mortality in non-emergency situations may be
similar, but in emergencies, it is the
demographic metric which can be expected to
change most dramatically. In some cases it has
been estimated to increase by 30-50 fold from
the baseline level (Checchi and Roberts, 2005).
Mortality is the most widely used metric to
identify the severity of the crisis.
In 1990, it was suggested that the definition of
the acute phase of an emergency should be the
period when the CMR exceeded 1/10,000 per
day, and/or U5MR exceeded 2/10,000 per day
(Toole and Waldman, 1990). This represented a
doubling of the baseline in sub-Saharan Africa
at the time. Today, given that mortality rates
have improved in all regions, there is some
doubt that those rates are acceptable. Sphere
guidelines suggest that the appropriate
standard might be a doubling of the regional
baseline (Sphere, 2004 and 2011). Other
sources also question whether these standards
are still applicable (CRED, 2013).
Apart from the discussion about what
constitutes emergency levels, it is clear that it is
difficult to collect and update primary data on
mortality during emergencies. There are
suggestions that retrospective data
(determining levels during the acute phases)
may be too difficult to gather, and that
prospective data (in the recovery phases) may
be more operationally useful (Checchi and
Roberts, 2008).
Technical Brief Demographic Profile
8
As always in epidemiology, it is useful to
identify to whom, when, and where deaths
occur to identify why and therefore to reduce
the risk and prevent excess mortality. This
includes sex and age disaggregating data
(usually referred to by the acronym SADD). A
prime example is the focus on children under
five. In emergencies, the above mentioned
epidemiologic transition is reversed. Water and
sanitation, nutrition, vaccination coverage, and
shelter all may deteriorate, and those most
vulnerable to this reversal are children under
five, with the result that deaths due to
communicable diseases and malnutrition may
skyrocket. Operationally, this is one reason
those response domains are relief priorities.
The pattern may not hold for sudden onset
natural disasters, where systems do not erode
to the same degree (Sphere 2011, Nishikiori
2006). Increasingly, it is recognized that other
groups also may be particularly vulnerable, and
a situation may develop with a double burden of
communicable and non-communicable disease
(Demaio 2013).
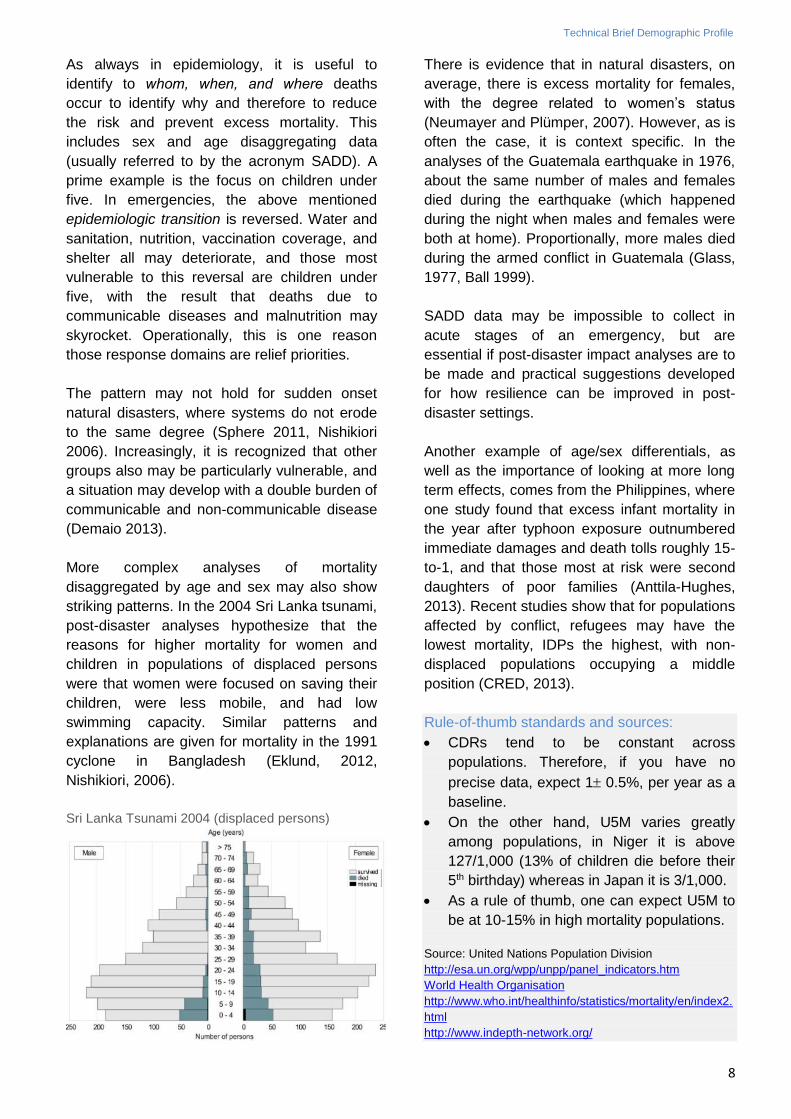
More complex analyses of mortality
disaggregated by age and sex may also show
striking patterns. In the 2004 Sri Lanka tsunami,
post-disaster analyses hypothesize that the
reasons for higher mortality for women and
children in populations of displaced persons
were that women were focused on saving their
children, were less mobile, and had low
swimming capacity. Similar patterns and
explanations are given for mortality in the 1991
cyclone in Bangladesh (Eklund, 2012,
Nishikiori, 2006).
Sri Lanka Tsunami 2004 (displaced persons)
There is evidence that in natural disasters, on
average, there is excess mortality for females,
with the degree related to women’s status
(Neumayer and Plümper, 2007). However, as is
often the case, it is context specific. In the
analyses of the Guatemala earthquake in 1976,
about the same number of males and females
died during the earthquake (which happened
during the night when males and females were
both at home). Proportionally, more males died
during the armed conflict in Guatemala (Glass,
1977, Ball 1999).
SADD data may be impossible to collect in
acute stages of an emergency, but are
essential if post-disaster impact analyses are to
be made and practical suggestions developed
for how resilience can be improved in post-
disaster settings.
Another example of age/sex differentials, as
well as the importance of looking at more long
term effects, comes from the Philippines, where
one study found that excess infant mortality in
the year after typhoon exposure outnumbered
immediate damages and death tolls roughly 15-
to-1, and that those most at risk were second
daughters of poor families (Anttila-Hughes,
2013). Recent studies show that for populations
affected by conflict, refugees may have the
lowest mortality, IDPs the highest, with non-
displaced populations occupying a middle
position (CRED, 2013).
Rule-of-thumb standards and sources:
CDRs tend to be constant across
populations. Therefore, if you have no
precise data, expect 1 0.5%, per year as a
baseline.
On the other hand, U5M varies greatly
among populations, in Niger it is above
127/1,000 (13% of children die before their
5th birthday) whereas in Japan it is 3/1,000.
As a rule of thumb, one can expect U5M to
be at 10-15% in high mortality populations.
Source: United Nations Population Division
http://esa.un.org/wpp/unpp/panel_indicators.htm World Health Organisation
http://www.who.int/healthinfo/statistics/mortality/en/index2.
html http://www.indepth-network.org/
Technical Brief Demographic Profile
9
c. MIGRATION
Metrics and terminology
Migration refers to diverse groups. Some of the
most commonly used metrics for migration are:
International migrants or persons residing
in a country other than that of their birth
Urban/rural population, referring to the
number of persons residing in urban or rural
areas.
Population in slums: The definition of
‘slum’ was only adopted in 2002, referring to
urban areas with limited access to e.g.
potable water (UNHabitat, 2008)
Refugees: “Persons who owing to a well-
founded fear of being persecuted for
reasons of race, religion, nationality,
membership of a particular social group or
political opinion, is outside the country of his
nationality, and is unable to or, owing to
such fear, is unwilling to avail himself of the
protection of that country or return there
because there is a fear of persecution..."
(UN, 1951)
Internally Displaced Persons (IDPs):
“Persons who have been forced to flee their
homes suddenly or unexpectedly in large
numbers, as a result of armed conflict,
internal strife, systematic violations of
human rights or natural or made-man
disasters; and who are within the territory of
their own country" (UN 1992).
The metrics for migration are less standardized
than for other aspects of demography, and the
trends less predictable, even in non-emergency
situations:
Definitions are often inconsistent, e.g. the
period of residence, what an urban area is,
etc.
Displacement is often difficult to measure
and track: how do you aggregate figures of
people who have been displaced several
times (i.e. D.R.C., Somalia, Colombia, etc.)?
When do you stop being displaced (i.e.
Colombia)?
How do you categorize the causes of
displacement and distinguish from
‘voluntary’ migration – conflict, sudden
onset and slow onset disasters?
Data collection mandates and
methodologies have been weak. It is only in
the last decade that especially the Internal
Displacement Monitoring Centre/NRC,
(established in 1998 at the request of the
IASC) has established global estimates for
various types of IDPs, including weather
related displacement. Many organizations
are working to improve methods for
identifying IDPs (e.g. JIPS).
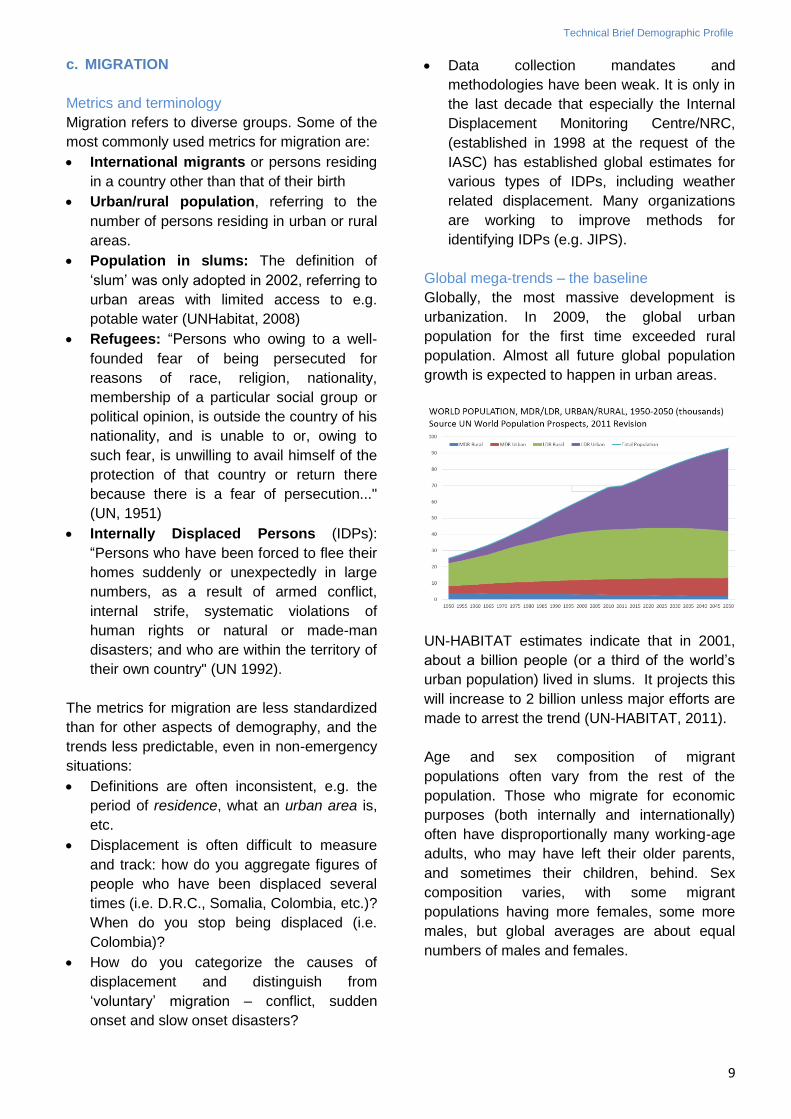
Global mega-trends – the baseline
Globally, the most massive development is
urbanization. In 2009, the global urban
population for the first time exceeded rural
population. Almost all future global population
growth is expected to happen in urban areas.
UN-HABITAT estimates indicate that in 2001,
about a billion people (or a third of the world’s
urban population) lived in slums. It projects this
will increase to 2 billion unless major efforts are
made to arrest the trend (UN-HABITAT, 2011).
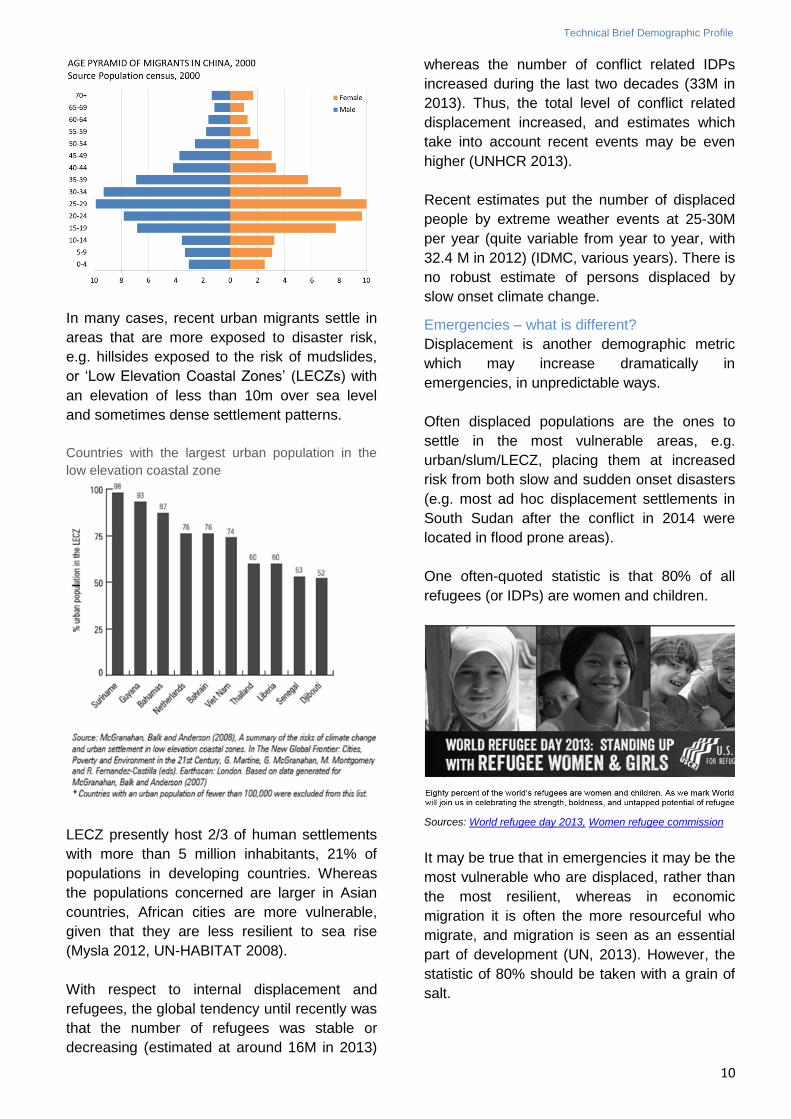
Age and sex composition of migrant
populations often vary from the rest of the
population. Those who migrate for economic
purposes (both internally and internationally)
often have disproportionally many working-age
adults, who may have left their older parents,
and sometimes their children, behind. Sex
composition varies, with some migrant
populations having more females, some more
males, but global averages are about equal
numbers of males and females.
Technical Brief Demographic Profile
10
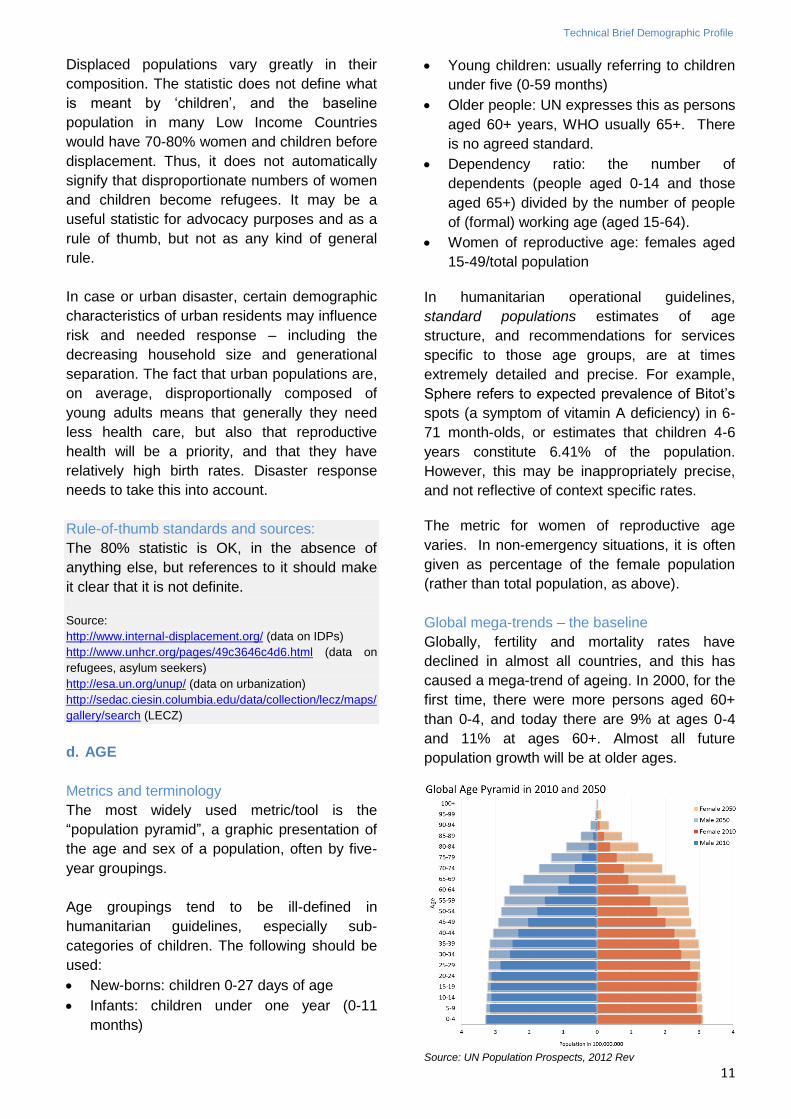
In many cases, recent urban migrants settle in
areas that are more exposed to disaster risk,
e.g. hillsides exposed to the risk of mudslides,
or ‘Low Elevation Coastal Zones’ (LECZs) with
an elevation of less than 10m over sea level
and sometimes dense settlement patterns.
Countries with the largest urban population in the
low elevation coastal zone
LECZ presently host 2/3 of human settlements
with more than 5 million inhabitants, 21% of
populations in developing countries. Whereas
the populations concerned are larger in Asian
countries, African cities are more vulnerable,
given that they are less resilient to sea rise
(Mysla 2012, UN-HABITAT 2008).
With respect to internal displacement and
refugees, the global tendency until recently was
that the number of refugees was stable or
decreasing (estimated at around 16M in 2013)
whereas the number of conflict related IDPs
increased during the last two decades (33M in
2013). Thus, the total level of conflict related
displacement increased, and estimates which
take into account recent events may be even
higher (UNHCR 2013).
Recent estimates put the number of displaced
people by extreme weather events at 25-30M
per year (quite variable from year to year, with
32.4 M in 2012) (IDMC, various years). There is
no robust estimate of persons displaced by
slow onset climate change.
Emergencies – what is different?
Displacement is another demographic metric
which may increase dramatically in
emergencies, in unpredictable ways.
Often displaced populations are the ones to
settle in the most vulnerable areas, e.g.
urban/slum/LECZ, placing them at increased
risk from both slow and sudden onset disasters
(e.g. most ad hoc displacement settlements in
South Sudan after the conflict in 2014 were
located in flood prone areas).
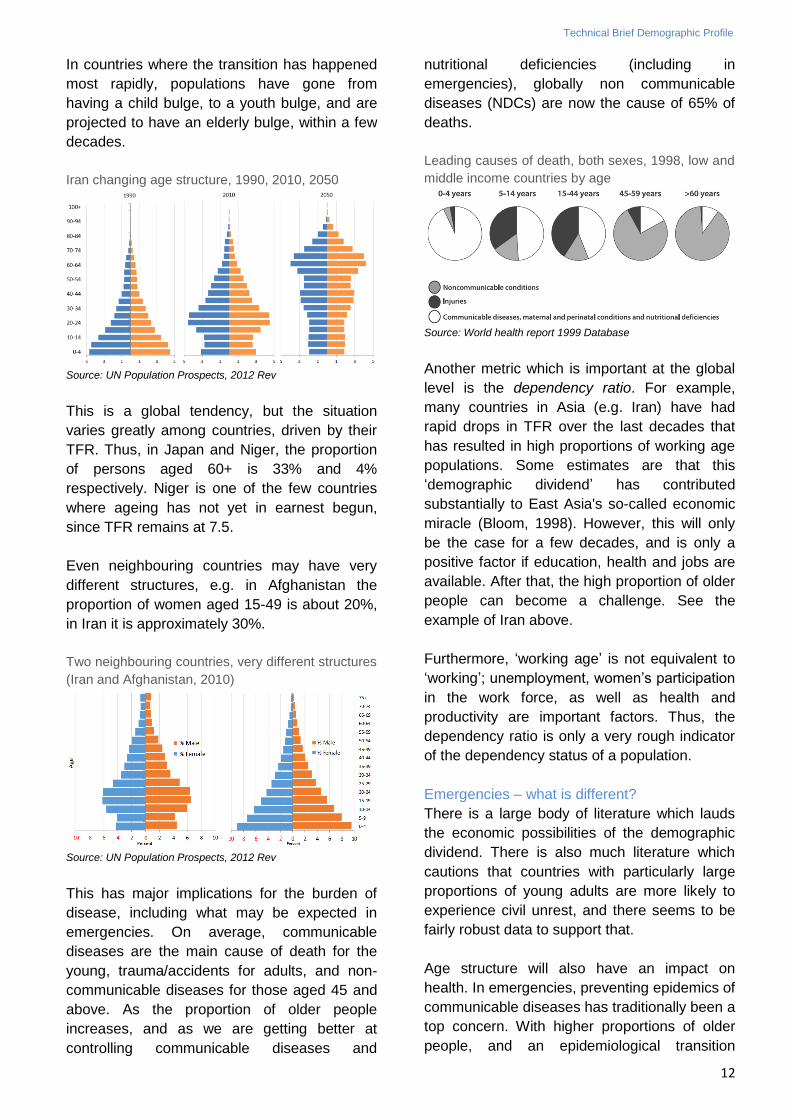
One often-quoted statistic is that 80% of all
refugees (or IDPs) are women and children.
Sources: World refugee day 2013, Women refugee commission
It may be true that in emergencies it may be the
most vulnerable who are displaced, rather than
the most resilient, whereas in economic
migration it is often the more resourceful who
migrate, and migration is seen as an essential
part of development (UN, 2013). However, the
statistic of 80% should be taken with a grain of
salt.
Technical Brief Demographic Profile
11
Displaced populations vary greatly in their
composition. The statistic does not define what
is meant by ‘children’, and the baseline
population in many Low Income Countries
would have 70-80% women and children before
displacement. Thus, it does not automatically
signify that disproportionate numbers of women
and children become refugees. It may be a
useful statistic for advocacy purposes and as a
rule of thumb, but not as any kind of general
rule.
In case or urban disaster, certain demographic
characteristics of urban residents may influence
risk and needed response – including the
decreasing household size and generational
separation. The fact that urban populations are,
on average, disproportionally composed of
young adults means that generally they need
less health care, but also that reproductive
health will be a priority, and that they have
relatively high birth rates. Disaster response
needs to take this into account.
Rule-of-thumb standards and sources:
The 80% statistic is OK, in the absence of
anything else, but references to it should make
it clear that it is not definite.
Source:
http://www.internal-displacement.org/ (data on IDPs)
http://www.unhcr.org/pages/49c3646c4d6.html (data on
refugees, asylum seekers)
http://esa.un.org/unup/ (data on urbanization)
http://sedac.ciesin.columbia.edu/data/collection/lecz/maps/
gallery/search (LECZ)
d. AGE
Metrics and terminology
The most widely used metric/tool is the
“population pyramid”, a graphic presentation of
the age and sex of a population, often by five-
year groupings.
Age groupings tend to be ill-defined in
humanitarian guidelines, especially sub-
categories of children. The following should be
used:
New-borns: children 0-27 days of age
Infants: children under one year (0-11
months)
Young children: usually referring to children
under five (0-59 months)
Older people: UN expresses this as persons
aged 60+ years, WHO usually 65+. There
is no agreed standard.
Dependency ratio: the number of
dependents (people aged 0-14 and those
aged 65+) divided by the number of people
of (formal) working age (aged 15-64).
Women of reproductive age: females aged
15-49/total population
In humanitarian operational guidelines,
standard populations estimates of age
structure, and recommendations for services
specific to those age groups, are at times
extremely detailed and precise. For example,
Sphere refers to expected prevalence of Bitot’s
spots (a symptom of vitamin A deficiency) in 6-
71 month-olds, or estimates that children 4-6
years constitute 6.41% of the population.
However, this may be inappropriately precise,
and not reflective of context specific rates.
The metric for women of reproductive age
varies. In non-emergency situations, it is often
given as percentage of the female population
(rather than total population, as above).
Global mega-trends – the baseline
Globally, fertility and mortality rates have
declined in almost all countries, and this has
caused a mega-trend of ageing. In 2000, for the
first time, there were more persons aged 60+
than 0-4, and today there are 9% at ages 0-4
and 11% at ages 60+. Almost all future
population growth will be at older ages.
Source: UN Population Prospects, 2012 Rev
Technical Brief Demographic Profile
12
In countries where the transition has happened
most rapidly, populations have gone from
having a child bulge, to a youth bulge, and are
projected to have an elderly bulge, within a few
decades.
Iran changing age structure, 1990, 2010, 2050
Source: UN Population Prospects, 2012 Rev
This is a global tendency, but the situation
varies greatly among countries, driven by their
TFR. Thus, in Japan and Niger, the proportion
of persons aged 60+ is 33% and 4%
respectively. Niger is one of the few countries
where ageing has not yet in earnest begun,
since TFR remains at 7.5.
Even neighbouring countries may have very
different structures, e.g. in Afghanistan the
proportion of women aged 15-49 is about 20%,
in Iran it is approximately 30%.
Two neighbouring countries, very different structures
(Iran and Afghanistan, 2010)
Source: UN Population Prospects, 2012 Rev
This has major implications for the burden of
disease, including what may be expected in
emergencies. On average, communicable
diseases are the main cause of death for the
young, trauma/accidents for adults, and non-
communicable diseases for those aged 45 and
above. As the proportion of older people
increases, and as we are getting better at
controlling communicable diseases and
nutritional deficiencies (including in
emergencies), globally non communicable
diseases (NDCs) are now the cause of 65% of
deaths.
Leading causes of death, both sexes, 1998, low and
middle income countries by age
Source: World health report 1999 Database
Another metric which is important at the global
level is the dependency ratio. For example,
many countries in Asia (e.g. Iran) have had
rapid drops in TFR over the last decades that
has resulted in high proportions of working age
populations. Some estimates are that this
‘demographic dividend’ has contributed
substantially to East Asia's so-called economic
miracle (Bloom, 1998). However, this will only
be the case for a few decades, and is only a
positive factor if education, health and jobs are
available. After that, the high proportion of older
people can become a challenge. See the
example of Iran above.
Furthermore, ‘working age’ is not equivalent to
‘working’; unemployment, women’s participation
in the work force, as well as health and
productivity are important factors. Thus, the
dependency ratio is only a very rough indicator
of the dependency status of a population.
Emergencies – what is different?
There is a large body of literature which lauds
the economic possibilities of the demographic
dividend. There is also much literature which
cautions that countries with particularly large
proportions of young adults are more likely to
experience civil unrest, and there seems to be
fairly robust data to support that.
Age structure will also have an impact on
health. In emergencies, preventing epidemics of
communicable diseases has traditionally been a
top concern. With higher proportions of older
people, and an epidemiological transition
Technical Brief Demographic Profile
13
toward NCDs, health concerns may shift. Older
people may also have different exposures,
vulnerabilities, and capacities (slower at getting
out of harm’s way, more fragile, but also as
repositories of knowledge of past emergencies).
Reproductive health services are especially
relevant for women aged 15-49, and therefore it
is important to know what proportion of women
are in those age groups. Especially in
protracted emergencies, it may become
increasingly important to look at the
dependency ratio, to supplement the ‘women
and children’ metric, perhaps developing a
more intelligent metric which reflects human
capital and resilience.
Rule-of-thumb standards and sources:
Children under five on average constitute 5-
22% of the population, depending on the
TFR.
One quick estimate of children 0-4 years is
to multiply the CBR by five (e.g. in Japan, if
the CBR is around 1%, then you can
estimate the proportion 0-4 years as around
5%). In Niger, where CBR is 5%, children
aged 0-4 are 22% (given 13% child
mortality).
To establish other age groupings, you can
interpolate (e.g. if you want the proportion 4-
6 year olds in Japan, you can estimate 3%).
Women of reproductive age can be
assumed to be 20-30% of the total
population, unless the population structure
is skewed due to migration/displacement.
Persons aged 60+ years constitute
anywhere from over 30% to less than 5% -
the mirror image of how many are aged 0-4
years.
Source: United Nations Population Division
http://esa.un.org/wpp/unpp/panel_indicators.htm
e. SEX
Metrics and terminology
The most commonly used metrics are:
Sex ratio at birth, the number of males
born per 100 females.
Sex ratio of age specific mortality, the
number of deaths to males per death to
females by age group.
Sex ratio in the total population, the
number of males per 100 females in the
total population.
Some countries, such as India, routinely publish
data on sex ratio for 0-6 year olds, rather than
at birth. That means both sex ratio at birth and
subsequent sex differentiated mortality have
contributed to the result. India inverts the metric
and cites number of females per 1,000 males.
Global mega-trends – the baseline
Globally, in most populations, the sex ratio at
birth is between 102-107, with 105 being the
average.
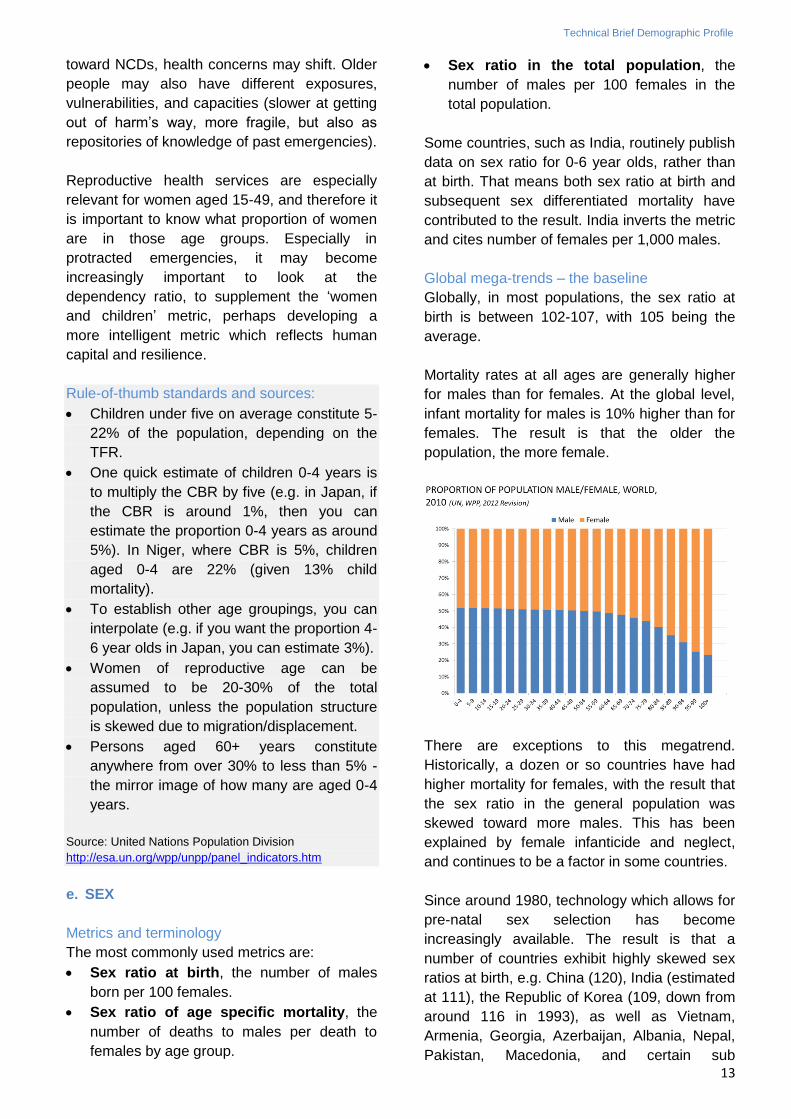
Mortality rates at all ages are generally higher
for males than for females. At the global level,
infant mortality for males is 10% higher than for
females. The result is that the older the
population, the more female.
There are exceptions to this megatrend.
Historically, a dozen or so countries have had
higher mortality for females, with the result that
the sex ratio in the general population was
skewed toward more males. This has been
explained by female infanticide and neglect,
and continues to be a factor in some countries.
Since around 1980, technology which allows for
pre-natal sex selection has become
increasingly available. The result is that a
number of countries exhibit highly skewed sex
ratios at birth, e.g. China (120), India (estimated
at 111), the Republic of Korea (109, down from
around 116 in 1993), as well as Vietnam,
Armenia, Georgia, Azerbaijan, Albania, Nepal,
Pakistan, Macedonia, and certain sub
Technical Brief Demographic Profile
14
populations in the US and UK. On the other
hand, it seems that post-natal sex selection has
declined, along with child mortality in general.
Emergencies – what is different?
Parallel to the literature on a youth bulge, there
is also a body of literature which postulates that
when the cohorts of young people with skewed
sex ratios reach marriageable age, this will lead
to a marriage squeeze and subsequent civil
unrest. However, the evidence on this is as yet
contested.
Older women may be particularly vulnerable in
emergencies. Given that they have higher rates
of morbidity but also the fact that they often
constitute the poorest segments of society, they
may have less access to pensions, and may
live alone (given that they outlive their
husbands).
Rule-of-thumb standards and sources:
Expect sex ratios at birth at around 105, and
male mortality rates 10% higher than for
females at ages 0-11 months. Exceptions
should be noted and addressed (Checchi
and Roberts, 2008).
Expect higher proportions of males at young
ages, and higher proportions of females at
older ages.
Source http://esa.un.org/wpp/unpp/panel_indicators.htm
f. POPULATION GROWTH
Metrics and terminology
The metrics often used in describing population
growth include:
Absolute number of growth which is the
number of births less the number of deaths
plus net migration.
Growth rate, calculated at the CBR less the
CDR plus the net migration rate.
Replacement level which is usually given
as TFR of 2.1, the level of fertility which in
the long run would give stable population
size, in most populations.
Population denominator: Rates are often
stated as a number of events divided by the
total population at risk for the event.
Usually, the mid-period population size is
used as an approximation. In emergencies,
population size may change radically in a
short time, therefore, it becomes even more
important to judge whether mid-period
population is the correct denominator
(Checchi, 2005)
There are no special metrics for population
growth in emergencies. However, change is at
times very rapid and uneven (due to
displacement and mortality). As one of the
purposes for estimating overall population
growth is to serve as the denominator for other
rates, methods for calculation can be important,
especially when collecting primary data.
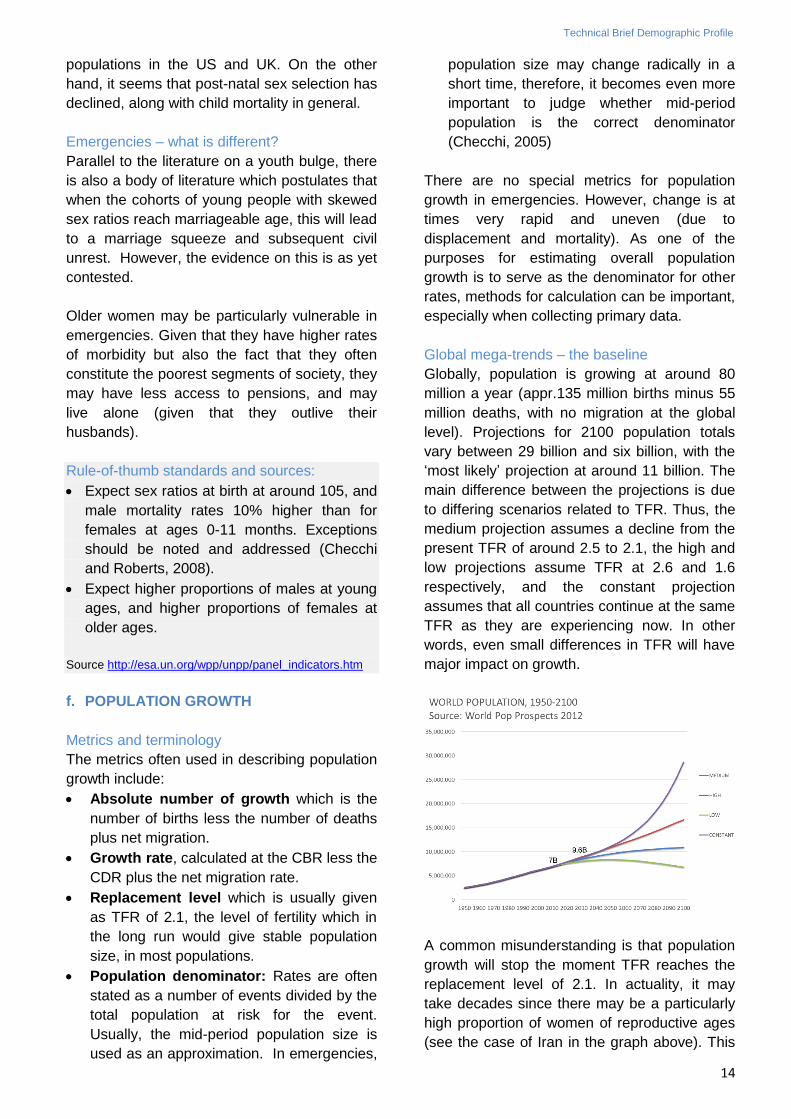
Global mega-trends – the baseline
Globally, population is growing at around 80
million a year (appr.135 million births minus 55
million deaths, with no migration at the global
level). Projections for 2100 population totals
vary between 29 billion and six billion, with the
‘most likely’ projection at around 11 billion. The
main difference between the projections is due
to differing scenarios related to TFR. Thus, the
medium projection assumes a decline from the
present TFR of around 2.5 to 2.1, the high and
low projections assume TFR at 2.6 and 1.6
respectively, and the constant projection
assumes that all countries continue at the same
TFR as they are experiencing now. In other
words, even small differences in TFR will have
major impact on growth.
A common misunderstanding is that population
growth will stop the moment TFR reaches the
replacement level of 2.1. In actuality, it may
take decades since there may be a particularly
high proportion of women of reproductive ages
(see the case of Iran in the graph above). This
Technical Brief Demographic Profile
15
is referred to as population momentum. Thus,
the population of the European Union still is
experiencing a birth surplus, even though TFR
is only 1.6. Also, replacement levels are higher
than 2.1 in populations with high mortality or
skewed sex ratio at birth.
Emergencies – what is different?
Long-term, global population increase is leading
to higher population density, increasingly
located in potentially high risk locations (e.g.
LECZ).
Some authors relate this to risks associated
with climate change, using the formula:
I = P x A x T
Where environmental impact depends on
population size, affluence/consumption per
person, and the available technology (Ehrlich,
1971). Whereas other writings by Ehrlich may
be considered controversial, this formula is
often quoted.
By this logic, population growth may contribute
to future extreme weather events, albeit by all
estimates much less so than consumption
patterns. This is also the implication in the
outcomes of the Stockholm Conference in
1972, the ‘Brundtland report’ in 1987, the Rio
Conference in 1992, and the Cairo Conference
in 1994.
In emergencies, if you wish to calculate
population growth for operational purposes, you
may need to calculate the baseline population
size at the onset of the emergency, by sub-
national (say district) region. This is important in
its own right, but also as the denominator for
other rates.
Data at sub-national level are usually not
available from global databases. However,
census data are often available online from
most countries, often at ten year intervals.
Statistical offices may also have data on births,
deaths and migration through civil registration
systems, although the majority do not (see box
below).
There are two main methods to calculate sub-
national pre-emergency population size and
growth rate:
1. If you need data for the present (i.e. 2012)
and have estimates from two censuses (for
2002 and 1992), then you can compare the
estimates from the 2002 and 1992 censuses,
calculate the percent growth between those
two years, and then use that percentage to
project 2002-2012 very roughly.
2. If you have yearly civil registration estimates
for the period since the last census, then you
can calculate the present level by taking the
level in 2002, and then adding the births,
subtracting the deaths, and adding net
migration in the period 2002-2012, through
the basic population growth formula:
P1 = Po + births - deaths -/+ migration.
However, that may be troublesome, as civil
registration systems are even less complete
than censuses. In this case, demographic
projections using more complex methodologies
are necessary, which are beyond the scope of
this brief.
Rule-of-thumb standards and sources:
For national data, use
http://esa.un.org/wpp/unpp/panel_indicators
.htm
For sub-national data, you may need the
national statistics office, linked for example
at http://data.un.org
Other data banks with sub-national data
include the DHS http://www.measuredhs.com
and http://dhsprogram.com/What-We-
Do/survey-
search.cfm?pgtype=main&SrvyTp=countryo
and MICS data
http://www.unicef.org/statistics/index_step1.
php, http://www.indepth-network.org/,
http://www.childinfo.org/mics_available.html
For more information on calculating mortality
and population size in emergency situations,
see Checchi and Roberts, 2005.
In addition to the six basic dimensions of
demography as mentioned above, the following
may be of particular interest: disability and
household size.
Technical Brief Demographic Profile
16
g. DISABILITY
Metrics and terminology
In 2001, WHO adopted the International
Classification of Functioning, Disability and
Health (ICF), which has been endorsed by 191
Member States. The ICF uses a definition of
disability based on activity limitation and
participation restrictions (social, environmental,
attitudinal, etc.) rather than only on physical
attributes. It is the revision of the International
Classification of Impairments, Disabilities, and
Handicaps (ICIDH), first published by WHO for
trial purposes in 1980.
However, even with global guidance, definitions
are not comparable across countries. Rates of
disability found in household surveys and
censuses therefore varies dramatically. This
variation results from differing measures of
disability, different data collection techniques,
and different reactions to survey questions by
respondents.
Even countries which include issues on
disability in their census are presumably greatly
under-estimating levels (e.g. India census 2011
estimated a prevalence of 3-4%). The type of
disability may be more interesting than the
absolute number, e.g. countries with high levels
of unexploded ordnance may have higher
prevalence of amputations.
Global mega-trends – the baseline:
There is no global database or repository with
robust data per country, so much must be
roughly estimated:
In 2011, WHO estimated that 15% of the
global population is living with some type of
disability (WHO/World Bank, 2011)
The older the population, the higher the
prevalence of disability. Thus, with ageing
populations, the estimates are that the
proportion is increasing. This is not always
true - some countries have experienced
decreasing rates of age-adjusted disability,
as a result of, inter alia, better health
care/technology.
Rates in L/MICs are likely to be higher than
in HICs, e.g. WHO estimated the rates of
disability for 65+ year olds in Africa to be
double those of HICs (WHO, 2004).
Emergencies – what is different?
Several small scale or localized studies have
been conducted, but little conclusive and
generalizable empirical evidence has been
produced. Yet, there is consensus among
researchers and practitioners that there is a
correlation between living with a disability and
being vulnerable to hazards or having specific
needs. Given that the Convention on the Rights
of Persons with Disabilities was adopted
recently, its implementation is still at early
stages, and data are limited. The evaluation of
the Haiti health response is one of the first to
address the issue, but does not contain
estimates of rates (PAHO (2010).
Rule-of-thumb standard and sources
Probably the best estimate is that 15% can
be expected to have some type of functional
disability, but the precise type must be
estimated locally.
The type of disaster will influence the
proportion and type of injury and disability
(i.e. Earthquake, conflict, cyclone, etc.)
To obtain more precise numbers, and to
estimate the type of disability, consult a
collection of surveys which have been
conducted at:
http://documents.worldbank.org/curated/en/
2011/01/14440066/world-report-disability
The best source may be to contact a
disabled people’s organization such as
Handicap International or local organization
operating in the affected area.
h. Households, Female Headed Households
Metrics and terminology:
A household is defined as a group of one or
more persons living together who make
common provision for food or other essentials
for living (UN, 2004).
A female headed household is one where
there is no male adult acting as decision maker.
In many censuses, the designation as head of
household is automatically given to any male
who indicates himself as such, in others any
household member is accepted, no matter what
sex.
Technical Brief Demographic Profile
17
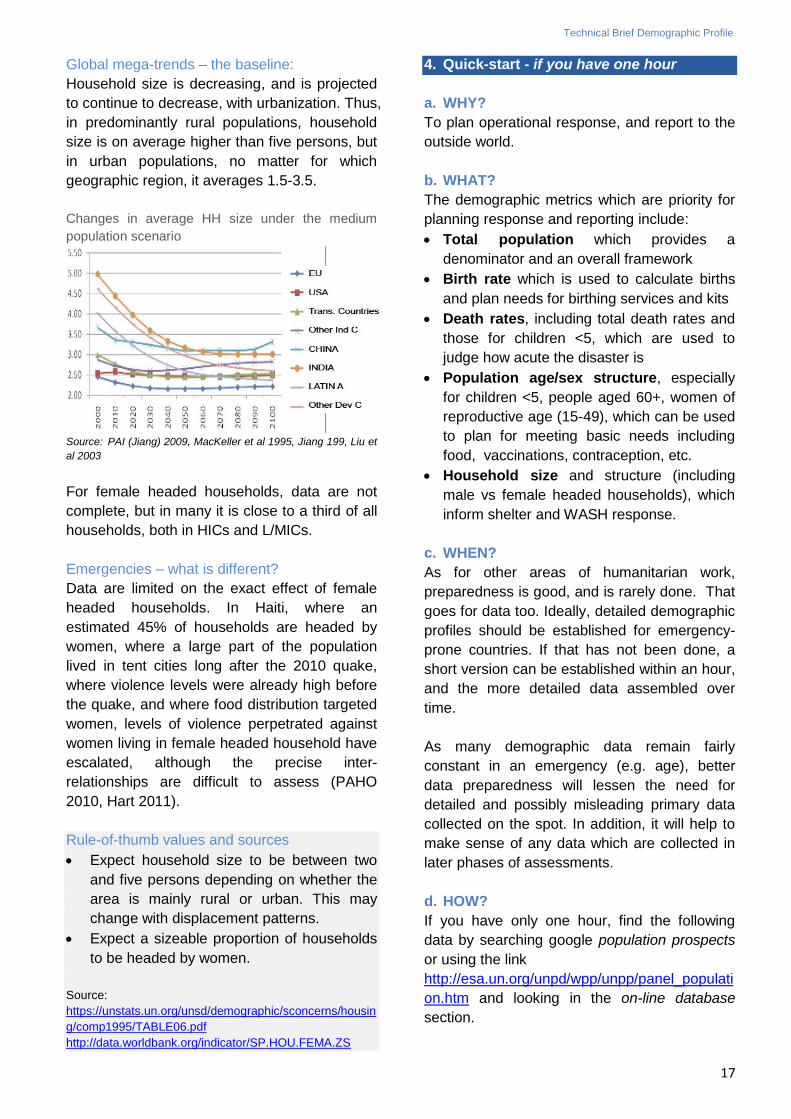
Global mega-trends – the baseline:
Household size is decreasing, and is projected
to continue to decrease, with urbanization. Thus,
in predominantly rural populations, household
size is on average higher than five persons, but
in urban populations, no matter for which
geographic region, it averages 1.5-3.5.
Changes in average HH size under the medium
population scenario
Source: PAI (Jiang) 2009, MacKeller et al 1995, Jiang 199, Liu et
al 2003
For female headed households, data are not
complete, but in many it is close to a third of all
households, both in HICs and L/MICs.
Emergencies – what is different?
Data are limited on the exact effect of female
headed households. In Haiti, where an
estimated 45% of households are headed by
women, where a large part of the population
lived in tent cities long after the 2010 quake,
where violence levels were already high before
the quake, and where food distribution targeted
women, levels of violence perpetrated against
women living in female headed household have
escalated, although the precise inter-
relationships are difficult to assess (PAHO
2010, Hart 2011).
Rule-of-thumb values and sources
Expect household size to be between two
and five persons depending on whether the
area is mainly rural or urban. This may
change with displacement patterns.
Expect a sizeable proportion of households
to be headed by women.
Source:
https://unstats.un.org/unsd/demographic/sconcerns/housin
g/comp1995/TABLE06.pdf
http://data.worldbank.org/indicator/SP.HOU.FEMA.ZS
4. Quick-start - if you have one hour
a. WHY?
To plan operational response, and report to the
outside world.
b. WHAT?
The demographic metrics which are priority for
planning response and reporting include:
Total population which provides a
denominator and an overall framework
Birth rate which is used to calculate births
and plan needs for birthing services and kits
Death rates, including total death rates and
those for children <5, which are used to
judge how acute the disaster is
Population age/sex structure, especially
for children <5, people aged 60+, women of
reproductive age (15-49), which can be used
to plan for meeting basic needs including
food, vaccinations, contraception, etc.
Household size and structure (including
male vs female headed households), which
inform shelter and WASH response.
c. WHEN?
As for other areas of humanitarian work,
preparedness is good, and is rarely done. That
goes for data too. Ideally, detailed demographic
profiles should be established for emergency-
prone countries. If that has not been done, a
short version can be established within an hour,
and the more detailed data assembled over
time.
As many demographic data remain fairly
constant in an emergency (e.g. age), better
data preparedness will lessen the need for
detailed and possibly misleading primary data
collected on the spot. In addition, it will help to
make sense of any data which are collected in
later phases of assessments.
d. HOW?
If you have only one hour, find the following
data by searching google population prospects
or using the link
http://esa.un.org/unpd/wpp/unpp/panel_populati
on.htm and looking in the on-line database
section.
Technical Brief Demographic Profile
18
For MMR (or other mortality, use UNdata
(http://data.un.org/CountryProfile.aspx#Social)
or WHO Global Health Observatory
http://apps.who.int/gho/data/?theme=main.
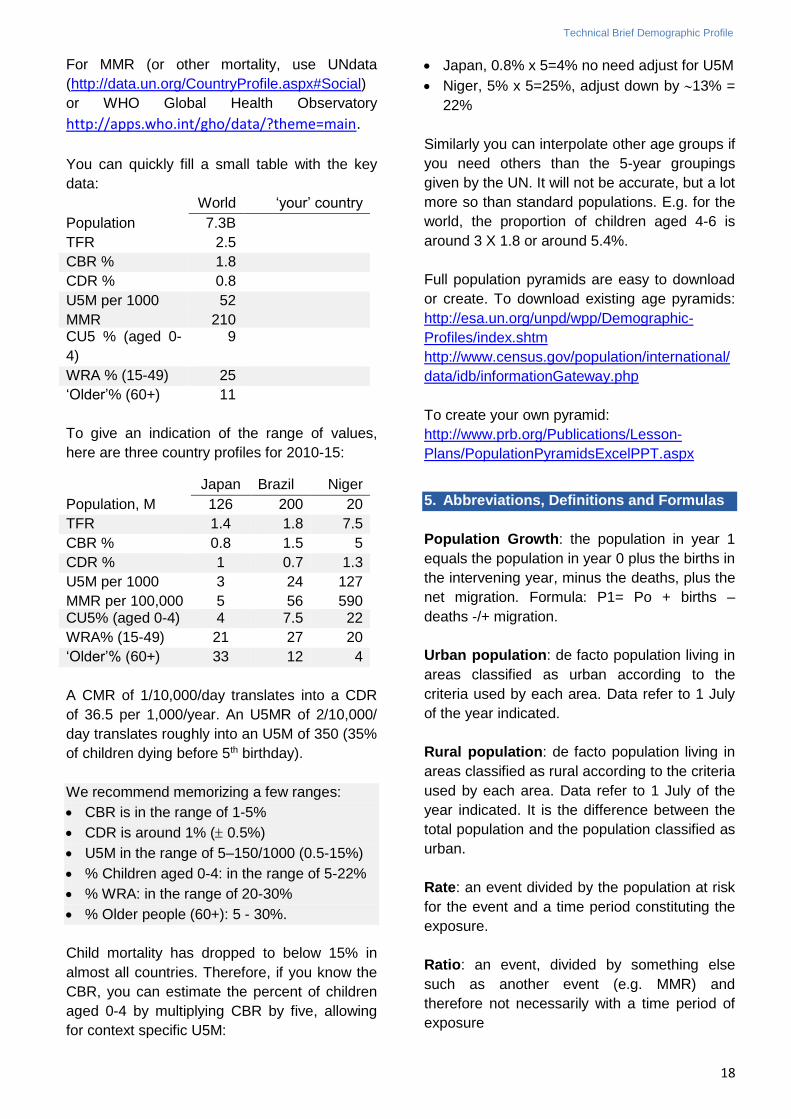
You can quickly fill a small table with the key
data:
World ‘your’ country
Population 7.3B
TFR 2.5
CBR % 1.8
CDR % 0.8
U5M per 1000 52
MMR 210 CU5 % (aged 0-
4)
9
WRA % (15-49) 25
‘Older’% (60+) 11
To give an indication of the range of values,
here are three country profiles for 2010-15:
Japan Brazil Niger
Population, M 126 200 20
TFR 1.4 1.8 7.5
CBR % 0.8 1.5 5
CDR % 1 0.7 1.3
U5M per 1000 3 24 127
MMR per 100,000 5 56 590 CU5% (aged 0-4) 4 7.5 22
WRA% (15-49) 21 27 20
‘Older’% (60+) 33 12 4
A CMR of 1/10,000/day translates into a CDR
of 36.5 per 1,000/year. An U5MR of 2/10,000/
day translates roughly into an U5M of 350 (35%
of children dying before 5th birthday).
We recommend memorizing a few ranges:
CBR is in the range of 1-5%
CDR is around 1% ( 0.5%)
U5M in the range of 5–150/1000 (0.5-15%)
% Children aged 0-4: in the range of 5-22%
% WRA: in the range of 20-30%
% Older people (60+): 5 - 30%.
Child mortality has dropped to below 15% in
almost all countries. Therefore, if you know the
CBR, you can estimate the percent of children
aged 0-4 by multiplying CBR by five, allowing
for context specific U5M:
Japan, 0.8% x 5=4% no need adjust for U5M
Niger, 5% x 5=25%, adjust down by 13% =
22%
Similarly you can interpolate other age groups if
you need others than the 5-year groupings
given by the UN. It will not be accurate, but a lot
more so than standard populations. E.g. for the
world, the proportion of children aged 4-6 is
around 3 X 1.8 or around 5.4%.
Full population pyramids are easy to download
or create. To download existing age pyramids:
http://esa.un.org/unpd/wpp/Demographic-
Profiles/index.shtm
http://www.census.gov/population/international/
data/idb/informationGateway.php
To create your own pyramid:
http://www.prb.org/Publications/Lesson-
Plans/PopulationPyramidsExcelPPT.aspx
5. Abbreviations, Definitions and Formulas
Population Growth: the population in year 1
equals the population in year 0 plus the births in
the intervening year, minus the deaths, plus the
net migration. Formula: P1= Po + births –
deaths -/+ migration.
Urban population: de facto population living in
areas classified as urban according to the
criteria used by each area. Data refer to 1 July
of the year indicated.
Rural population: de facto population living in
areas classified as rural according to the criteria
used by each area. Data refer to 1 July of the
year indicated. It is the difference between the
total population and the population classified as
urban.
Rate: an event divided by the population at risk
for the event and a time period constituting the
exposure.
Ratio: an event, divided by something else
such as another event (e.g. MMR) and
therefore not necessarily with a time period of
exposure
Technical Brief Demographic Profile
19
TFR – Total Fertility Rate, expressed as
children per women. The average number of
children a hypothetical cohort of women would
have at the end of their reproductive period if
they were subject during their whole lives to the
fertility rates of a given period and not subject to
mortality. TFR is not a true rate. This, and other
age-specific metrics, are usually not realistic to
collect/use during an emergency, but can be
useful to quickly establish a population profile
CBR - Crude Birth Rate. The number of live
births per 1,000 population per year,
determined by calculating the number of births
over the period/population at mid period x
1,000. E.g. births during 2013 divided by
population at 1 July 2013 x 1,000. If you know
the pre-emergency CBR, you can calculate the
number of births expected over a shorter
period. If the CBR is 5% for a year, the number
of births expected in a population of 10,000 in
three months will be approximately 167.
CDR - Crude Death Rate. Number of deaths
per 1,000 population per year. Usually the CDR
is approximated as the population at mid-year
(1 July). If you know the CDR, you can
calculate the number of deaths expected over a
shorter period. If the CDR is 1% for a year,
then the number of deaths expected in a
population of 10,000 per day is approximately
0.3.
U5M – Under Five Mortality which is the
proportion (probability) of children dying
between birth and exact age five. It is
expressed as deaths per 1,000 live births.
NB: this differs from the U5MR, Under Five
Mortality Rate, which estimates the rate at
which children below the age of 5 have died
over a defined period of time.
In emergency situations, the most commonly
used population denominator and time period
for U5MR is per 10,000 under-5 population per
day (i.e. number of deaths/10,000/day).
However, it can also be per 1,000 <5 population
per year, or per 1,000 <5 population per month.
CMR – Crude Mortality Rate which estimates
the rate at which members of a population have
died over a defined period of time. A CMR is
applicable to an entire population, including
both sexes and all age groups. In emergency
situations, the most commonly used population
denominator and time period for CMR is per
10,000 population per day (i.e. number of
deaths/10,000/day). However, it can also be per
1,000 population per year, or per 1,000
population per month
WRA – women of reproductive age refers to the
number of females aged 15-49 divided by the
total population. Sometimes it refers to females
aged 15-49 divided by the total number of
females.
MMR – maternal mortality ratio: The death of
a woman while pregnant or within 42 days of
termination of pregnancy, irrespective of the
duration and site of the pregnancy, from any
cause related to or aggravated by the
pregnancy or its management but not from
accidental or incidental causes (WHO ICD10).
This metric is usually not realistic to calculate
during an emergency, but the pre-emergency
level can be useful as an indicator of maternal
health as well as the overall functioning of the
health services of a country.
Fertility - The term ‘fertility’ in English is used
to denote number of births, whereas the term
‘fecundity’ is used to denote the ability to
become pregnant (or to impregnate). Please
note that the terminology differs in different
languages (e.g. in French it is the opposite for
fertilité and fécondité).
Dependency ratio: the population aged 0-14 +
65+/population aged 15-64 x 1,000
Household:
a) A one-person household, defined as an
arrangement in which one person makes
provision for his or her food or other essentials
for living without combining with any other
person to form part of a multi-person household
Or,
b) A multi-person household, defined as a
group of two or more persons living together
who make common provision for food or other
essentials for living (UN 2004).
For more demographic terms/definition, refer to:
http://esa.un.org/unpd/wpp/Documentation/glos
sary.htm
Technical Brief Demographic Profile
20
6. Sample calculations
1. An earthquake has just occurred in a West
African country whose demographic
characteristics resemble those of Niger. You
have been deployed to act as health
coordinator for the peaceful city of Urbana,
with a population of around 100,000 people
and where houses have been completely
destroyed. The local health regional hospital
and clinics have also been destroyed. Your
first duty is to inform the Flash Appeal and
your report is expected within the next 48
hours, giving a rough estimate of needed
relief items. It is hopeless to gather sex and
age disaggregated data in such a short time
frame. How many birthing kits may you need
over the next three months? Doses of
measles vaccination? Tents?
Contraceptives?
2. The estimate of 100,000 people came from
the government. You are not sure how it
was calculated, since the last census was 10
years ago, and the one before that 20 years
ago. In those censuses, the population was
given as 90,000 and 80,000 respectively.
What would you have projected the
population to be today?
Answers 1:
Tents: 100,000/5 or 20,000 tents.
Birthing kits: crude birth rate of 5%,
meaning 5% of 100,000 or 5,000 births per
year, or 1,200 for the next three months.
Measles vaccination doses: first you
estimate the proportion of children aged <5
(0-59 months, 0-4, under five, whatever
definition you want to use.) That is 22%, or
22,000.
If you want one vaccination of every child
aged <5, you would need one dose for
each, or 22,000 doses. You can reduce by
those 0-5 months old (around 10%) but
given wastage, that is probably immaterial.
Also you may need to vaccinate twice and
include children 5-14 years old. Finally, you
may look up vaccination levels to help you
determine whether there is a need.
Contraceptive supplies: look up the WRA
and the contraceptive mix and CPR. You
may just wish to order the standard
emergency kit, but later on you may wish to
review, since baseline CPR may be much
lower than world averages, and you would
wish to make allowances for modern vs.
traditional methods.
Answers 2:
1. Accept the previous census results, which
indicate an annual growth of around 1.2%
per year, meaning indeed that today’s
population would be around 100,000.
2. Alternatively, work out your own estimate.
You could for example choose the last
census, note that with a crude birth rate of
5% and crude death rate of around 1%, you
would expect 4% growth per year, barring
major migration. On that basis you would
expect 90,000 + (rough estimate) 40-50%
increase, or around 130,000. That is quite
different, so for the time being you may just
need to note that you have a range of
estimates, and you need to triangulate with
other data sources.
7. References
ACAPS, 2012. Estimation of affected population
figures.
Anttila-Hughes, J. K. and S. M. Hsiang (2013,
February 18). Destruction, Disinvestment, and
Death: Economic and Human Losses Following
Environmental Disaster. 86.
Ball, P., P. Kobrak, et al. (1999). "State violence
in Guatemala 1960-1996: a quantitative
reflection." American Association for the
Advancement of Science, Center for Human
Rights Research.
Bloom, D. E. and J. G. Williamson (1998).
"Demographic transitions and economic
miracles in emerging Asia." World Bank
Economic Review 12(3): 419-455.
Bloom-Feschbach, K., L. Soimonsen, et al.
(2011). "Natality decline and miscarriages
associated with the 1918 influenza pandemic:
the Scandinavian d United Sates experience."
Journal of Infectious Diseases (204): 1157-
1164.
Technical Brief Demographic Profile
21
Checchi, F. and L. Roberts, 2005. Interpreting
and using mortality data in humanitarian
emergencies: A primer for non-epidemiologists.
Humanitarian Practice Network: 38.
Checchi, F. and L. Roberts (2008).
Documenting mortality in crises: what keeps us
from doing better. PLoS Med 5(7): e146.
CRED, 2013. People Affected by Conflict 2013
– Humanitarian needs in numbers.
Demaio, A., J. Jamieson, et al. (2013). "Non-
communicable diseases in emergencies: a call
to action." PLOS Currents Disasters.
Ehrlich, P. R. and J. P. Holdren (1971). "Impact
of Population Growth." Science (American
Association for the Advancement of Science)
171(3977): 1212–1217.
Eklund, L. and S. Tellier (2012). Gender and
international crisis response: do we have the
data, and does it matter? Disasters 22 Feb
2012.
Finlay, J. (2009). Fertility response to natural
disasters: the case of three high mortality
earthquakes. World Bank. Washington, D.C.
Glass, R. I., J. J. Urrutia, et al. (1977).
"Earthquake injuries related to housing in a
guatemalan village." Science 197(4304): 638-
643.
Hart, S. U. (2011). Women only: violence and
gendered entitlements in post-quake food
distribution in Port-au-Prince, Haiti. Du grain à
moudre. Genre, développement rural et
alimentation, Berne, IHEID, Actes des
colloques genre et développement.
IDMC/Norwegian Refugee Council
http://www.internal-displacement.org
(accessed 20140502)
Jiang, L. and B. C. O’Neill (2009). Household
Projections for Rural and Urban Areas of Major
Regions of the World Vienna, IIASA.
Johns Hopkins and IFRC, 2008. Public Health
Guide in Emergencies.
Kassebaum, N. J., A. Bertozzi-Villa, etal. (2014).
"Global, regional, and national levels and
causes of maternal mortality during 1990–2013:
a systematic analysis for the Global Burden of
Disease Study 2013" www.thelancet.com
Published online May 2, 2014
Mysla, J. (March, 2012). Climate change,
extreme events and coastal zones protection.
Building cities resilience to disasters. Venice,
Italy.
Neumayer, E. and T. Plümper (2007). The
Gendered Nature of Natural Disasters: The
Impact of Catastrophic Events on the Gender
Gap in Life Expectancy, 1981–2002. Annals of
the Association of American Geographers 97(3):
551–566.
Nishikiori, N., T. Abe, et al. (2006). "Who died
as a result of the tsunami? Risk factors of
mortality among internally displaced persons in
Sri Lanka: a retrospective cohort analysis."
BMC Public Health 6: 73.
Pan American Health Organization (PAHO),
2010. Health Response to the earthquake in
Haiti, January 2010 - lessons to be learned for
the next massive sudden-onset disaster.
PRB, Haub 2009. Demographic trends and their
humanitarian impacts.
PRB, 2011. Population Reference Bureau:
Population Handbook.
Reed, Holly 2002. Demographic Assessment
Techniques in Complex Humanitarian
Emergencies. Summary of a Workshop,
National Academies Press: 36.
Setel, P. W., S. B. Macfarlane, et al. (2007). "A
scandal of invisibility: making everyone count
by counting everyone." Lancet 370(9598):
1569-1577.
Solo, J. (2008). Family Planning in Rwanda:
How a Taboo Topic became Priority Number
One, IntraHealth International: 35.
Sphere Project, 2004 and revised 2011
versions. Sphere Handbook – Humanitarian
charter and minimum standards for disaster
response.
Technical Brief Demographic Profile
22
Toole, M. and R. J. Waldman, 1990. Prevention
of Excess Mortality in Refugee and Displaced
Populations in Developing Countries. JAMA
263 (24): 3296-3302.
UN, 2011. UN Expert Group Meeting on
Mortality Crises: Conflicts, Violence, Famine,
Natural Disasters and the Growing Burden of
Non-communicable Diseases. New York, 14-15
November 2011.
UN-HABITAT (2008). "State of the world's cities,
2008-2009: harmonious cities."
UN-Habitat (2013),
http://ww2.unhabitat.org/mdg/ (accessed
20140503)
UNHCR (2007). Handbook for Emergencies.
UNHCR (2013). Mid-year trends 2013.
UN (2004). UN Demographic Yearbook review.
National reporting of household characteristics,
living arrangements and homeless households.
Implications for international recommendations
ESA/STAT/2004/6.
UN (2012). ‘World Urbanization Prospects: the
2011 Revision’. http://esa.un.org/unup/
UN. (2013). "World Population Prospects, the
2012 Revision." http://esa.un.org/wpp/.
UN (3-4 October 2013). High-level meetings of
the 68th Session of the General Assembly,
High-level Dialogue on International Migration
and Development: "Making Migration Work"
UN Statistical Division
https://unstats.un.org/unsd/demographic/sconc
erns/housing/ (accessed 20140413)
Wang, Haidong et al (2014) Global, regional,
and national levels of neonatal, infant and
under-5 mortality 1990-2013: a systematic
analysis www.thelancet.com Published online
May 2, 2014 http://dx.doi.org/10.1016/S0140-
6736(14)60497-9
World Bank
http://data.worldbank.org/indicator/SP.HOU.FE
MA.ZS (accessed 20140413)
WHO (1990). "International classification of
disease, version 10"
WHO, Global Burden of Disease, 2004 Update
(2008)
WHO and World Bank (2011). World report on
disability 2011. Geneva.
WHO (2014). World Health Statistics 2014
http://www.who.int/mediacentre/news/releases/
2014/world-health-statistics-2014/en/ (accessed
20140522).
Yong, C. and F. Wang (2005). "Famine, social
disruption and involuntary fetal loss: evidence
from Chinese survey data." Demography 42(2):
301-322.


