As Raman spectroscopy continues to evolve, questions arise as to the portability of Raman data: dispersive versus Fouriertransform, wavelength calibration, intensity calibration, and in particular the frequency of the excitation laser. While concernsabout fluorescence arise in the visible or ultraviolet, most modern (portable) systems use near-infrared excitation lasers, andmany of these are relatively close in wavelength. We have investigated the possibility of porting reference data sets from one NIRwavelength system to another: We have constructed a reference library consisting of 145 spectra, including 20 explosives, as wellas sundry other compounds and materials using a 1064 nm spectrometer. These data were used as a reference library to evaluatethe same 145 compounds whose experimental spectra were recorded using a second 785 nm spectrometer. In 128 cases of 145 (or88.3% including 20/20 for the explosives), the compounds were correctly identified with a mean “hit score” of 954 of 1000. Addingin criteria for when to declare a correct match versus when to declare uncertainty, the approach was able to correctly categorize134 out of 145 spectra, giving a 92.4% accuracy. For the few that were incorrectly identified, either the matched spectra werespectroscopically similar to the target or the 785 nm signal was degraded due to fluorescence. The results indicate that importeddata recorded at a different NIR wavelength can be successfully used as reference libraries, but key issues must be addressed:the reference data must be of equal or higher resolution than the resolution of the current sensor, the systems require rigorouswavelength calibration, and wavelength-dependent intensity response should be accounted for in the different systems.
1. Introduction
There are many spectroscopic methods that have decreasedthe size and cost of the instruments and simultaneouslyincreased their detection potential so as to become routinemethods for chemical detection: infrared spectroscopy [1–3], visible-NIR reflectance [4], terahertz methods [5, 6],and others. Recently Raman spectroscopy has followed thistrend and evolved from a cumbersome method of chemicalphysics to a common forensic technique [7]. There arecurrently tens of thousands of deployed spectrometers, manyon-line or at-line, and in recent years there has been anadvent of portable, even handheld, systems [8, 9], as wellas remote sensing devices [10, 11]. Such capabilities makeRaman an especially attractive method in the security arena,
where substances such as radioactive materials, explosives,and chemical-/biological-warfare agents are a danger notonly on the battlefield, but now also to civilian targets.For explosives, detection at several tens of meters has nowbeen demonstrated [12–17] as has Raman chemical imagingof trace explosives, for example, in fingerprints [18]. Oneimplementation of the technique that has really stood outin recent years is Raman spectroscopy using near-infraredlasers [19, 20]. Such systems have become less cumbersome,inexpensive and still retain the specificity of Raman orIR spectroscopy; namely, they have the ability to detectthousands of different chemicals and substances [21–23].
Contemporary red and near-infrared lasers, particularlythe diode lasers, offer great advantages in terms of economy,size, and ruggedness. Should more laser systems be realized at
2 International Journal of Spectroscopy
wavelengths longer than ca. 1400 nm, enormous advantagescould also be realized in terms of eye safety, as the humancornea blocks wavelengths longer than 1400 nm [24]. Atthe near-infrared (NIR) wavelengths used in most modernportable systems, most species do not undergo an electronictransition, and thus, empirically, most molecules do notfluoresce or undergo resonance enhancement. The possi-bility thus exists to port reference data with good success,especially if one considers only NIR excitation wavelengths.But questions arise as to the transferability of Raman data:dispersive versus Fourier transform, wavelength calibration,intensity calibration, and in particular the frequency ofthe excitation laser [25–27]. Developing such databases isresource-intensive and typically the generated data are nottransferred to other instruments. If the reference data weretruly portable; however, it obviates the time-consumingand expensive process of re-recording instrument-specificspectral libraries. It may be that data will not be portableto all systems, for example, surface-probing systems or thosewhich use ultraviolet lasers, since different Raman modescan be enhanced differently. However, with red or near-infrared excitation there is a greatly reduced likelihood ofenhancement, fluorescence, or other perturbing phenomena;we have therefore investigated the possibility of portingreference data from one NIR system to another.
While not all aspects can be addressed, this paperconsiders the possibility of porting an entire database ofspectra (i.e., a spectral library of a wide range of substances)recorded at one wavelength (1064 nm) and employing themfor analysis at another wavelength (785 nm). A companionpaper has been submitted [8] that discusses the specificsof adapting such high-resolution spectra to a modernhandheld dispersive Raman system. We assume that such ademonstrated portability would be reflected amongst othersystems such as those that use extant near-IR lasers (e.g.,633, 785, 830, 980, 1047, and 1064 nm), but could also bepotentially useful for still other systems that may arise inthe future, particularly those with laser wavelengths longerthan 1400 nm, such as the lasers used in telecommunications(e.g., 1550 nm). At these longer wavelengths not only isthere greater eye safety, but also less dispersion fromatmospheric particles (aerosol Mie scattering), resulting inbetter transmission for obvious standoff applications suchas explosives [13, 28]. We demonstrate this portability bytesting a Raman spectra database of 145 chemicals, including20 known explosives. To accomplish this, key efforts are madeto calibrate on both the wavelength- and intensity-axes suchthat, in theory, the spectra from any one system will simplyoverlay those from another.
2. Experimental and Calibration
2.1. General Experimental. For these experiments, the spec-tra were measured using two different Fourier-transform(FT) Raman spectrometers, one using 1064 nm excitation,the other using 785 nm excitation. In many instancesresearchers wish to port data between systems, includ-ing between FT and dispersive systems. The merits ofFT-spectrometers versus dispersive-instruments for specific
applications can be deliberated elsewhere; this paper focusesonly on the portability of the data. For both FT instru-ments [29] and for the dispersive instruments (especiallysmaller units) frequent and accurate wavelength calibrationis paramount [30, 31]. For this study, it is important tonote that while both are FT instruments from the samemanufacturer, the instruments are of different wavelength(785 and 1064 nm) and have different etendues (numericalaperture), different interferometers (linear air-bearing versusmechanical flex-pivot), different detectors (though both areof the same type, power detection as opposed to photoncounting), and differing optical components [7, 22]. Bothinstruments have a dedicated sample compartment, witheither 90- or 180-degree backscatter spectral light collection;for the present work, the 180◦ configuration was usedincluding a mirror behind the quartz cuvette for liquidsamples. For solids, typically ∼5 mg of samples was pressedinto an Al sample cup for use with the 180◦ collectiongeometry. While wavelength calibration is critical for anyRaman system, the absolute calibration in general can followmore easily for an FT instrument (the Connes advantage)[32]. The intensity calibration for most Raman systems,including the present ones, is not an absolute photometriccalibration, but only removes the wavelength-dependentresponse of the optical system, which arises largely from thedetector.
For the 1064 nm data, the spectra of the neat liquidsand solids were recorded using a Bruker FRA 106 Ramanmodule coupled to the interferometer of a Bruker IFS 66v/Svacuum Fourier infrared spectrometer used in purged mode[33, 34]. The 66v interferometer [35] used a germaniumon calcium fluoride beamsplitter and a white light sourcefor initial interferometer alignment. The FRA 106 Ramanaccessory consists of a CW 1064 nm Nd:YAG laser witha focused or unfocused laser spot [19, 36] and a notchfilter after the F/1 collection lens that removes the Rayleighscattered light. A 6.0 mm manual aperture [37, 38] was addedbefore the interferometer to achieve the specified 2.0 cm−1
spectral resolution [37, 39]. The Raman-scattered light ismodulated by the FTIR interferometer and focused onto aliquid-nitrogen cooled Ge detector inside the 106 accessory.
For the 785 nm data, a dual wavelength dedicated FT-Raman instrument, the Bruker MultiRam 27, was used inthe 785 nm configuration. The MultiRam is a dedicatedFT-Raman instrument, but instead of a linear air-bearinginterferometer, it has a flex-pivot mechanical bearing system.The MultiRam 27 interferometer is a faster optic f/2.9versus the f/4.5 of the IFS 66v, so the MultiRam was usedwith an internal aperture setting of 3.5 mm. The MultiRambeamsplitter is silicon coated onto quartz, and the Ramandetector for the 785 channel is a thermo-electrically cooledavalanche pin-diode detector. The MultiRam also uses aproprietary notch filter to remove the Rayleigh line before theinterferometer [36]. Both the 1064 and the 785 nm systemswere equipped with a (custom) Stokes/anti-Stokes filter thatpasses light on both the low- and high-frequency side of thenotch frequency.
All data were recorded at 2.0 cm−1 resolution, collectingthe 180◦-backscattered light. The excitation laser power
International Journal of Spectroscopy 3
was varied as needed, but seldom exceeded 500 mW. Typi-cally between 300 and 2000 interferograms were averaged,depending on signal quality. Data were collected usingforward-backward double-sided interferograms and (due tothe broad interferograms) phase-corrected using the powermethod. To achieve the data portability it is clear thatthe data must be calibrated in two dimensions, namely(1) the wavelength and (2) the intensity axes. For anygiven sample, the spectrally corrected plots should overlayone another if done correctly and in absence of anywavelength-dependent phenomena. Extensive calibration forwavelength and intensity proceeded as described below. Mostchemicals were purchased as the highest purity availablefrom common chemical suppliers, mostly Sigma-Aldrich.The mineral specimens were from the “Rocks and Mineralsof Canada collection” from American Educational Products.The data were only collected after the instrument waswavelength calibrated. The intensity calibration scales therelative response on the y-axis as a function of wavelength(described below) and arbitrarily sets the strongest peak to avalue of 2.0 with the minimum set to 0.0.
2.2. Wavelength Calibration. For a Fourier-transform Ramansystem, frequency calibration is not trivial as it requires anabsolute calibration of both (1) the scattered light recordingsystem and (2) the instantaneous (e.g., shot to shot) or aver-aged frequency of the Raman excitation laser, typically aftersome stabilization period. To calibrate the interferometerthere are several options such as using the narrow absorptionlines of a gas such as CO or N2O at low pressure [34,37]. For both the present spectrometers the interferometer’swavelengths are referenced to those of the HeNe laser, as iscommon in commercial FT systems. Originally these werecalibrated in the near-IR by using a white light source inthe sample compartment and observing the 2← 0 overtonetransition of neat carbon monoxide [34, 40] in a 10 cmcell. The transition frequencies were fit by adjusting theHeNe reference frequency. Using unapodized spectra, a seriesof CO lines near 4300 cm−1 in the first overtone bandwere used to match the reported frequencies of Maki andWells [40]. This proved to be somewhat cumbersome as towhere to locate the gas cell, as the interferometer path hasfew unobstructed beam paths > 10 cm. Recognizing otheralternatives, such as an atomic lamp calibration standard,[29] it was found more expedient for reliable calibration ofthe interferometer to use an array of Hg lines [41] by bleedingin small amounts of light from the overhead fluorescentlamps. A typical emission spectrum of such lines can be seenin Figure 1. The method is preferred to the CO absorptiontechnique as the lamp emission light follows exactly thesame optical train as the Raman scattered light, and becausethe Hg-lines method is easier to implement. Using the fiveHg lines depicted in Figure 1 along with the NIST (air)frequencies, the interferometer frequency is calibrated suchthat the sum of the deviations (obs.-ref.) for all five lines is ≤0.1 cm−1 on a daily basis. Typically, the average deviation forany given line is < ±0.1 cm−1.
For an FT-Raman system, calibration of the interfer-ometer frequencies alone is not sufficient. The absolute
8
6
4
2
010000 9500 9000 8500 8000
86420
6540
6530
6520
7500 7000 6500
6560
6550
FWHM∼ 2.8 cm−1
Absolute wavenumber
Figure 1: Hg-line spectrum used for interferometer calibration.Several lines are used to calibrate the absolute wavelength responseof the interferometer. The Raman laser frequency ∼9397 cm−1 isbracketed by the Hg lines. The inset shows the linewidth (FWHM)of one of the Hg lines.
wavelength of the continuous wave excitation laser must alsobe set. There are methods to achieve this including usingabsolute Raman wavelength standards such as cyclohexaneC6H12 frequency shifts [25, 31, 42–44]. If using just one ortwo such transitions, however, it is possible as a happenstancethat a small frequency offset of the Raman laser could beequally offset by a small miscalibration of the interferometerfrequency in the opposite direction. This can be especiallytrue for certain NIR solid state lasers with strong roomtemperature frequency fluctuation. In the present system wehave opted to use a laser line notch filter that passes both theStokes and anti-Stokes lines. In this method the calibrationof the excitation laser is accomplished by setting the softwarevalue of the Raman laser frequency such that the absolutevalues of the Stokes and anti-Stokes frequency shifts for agiven vibrational mode are made equivalent. If the inputvalue of the excitation laser frequency were incorrect, thenominal Raman “zero” frequency position would be shifted,resulting in differing Stokes and anti-Stokes frequencies. Forthe Raman Nd:YAG 1064 nm laser systems, a daily Stokesversus anti-Stokes calibration is performed using a strongscatterer, typically elemental sulfur [19, 38]. Low frequencymodes are advantageous here as the detector responsivityis limited to approximately −1,000 cm−1 anti-Stokes shift(detector’s bandgap or work function cutoff). The 785 nmlaser wavelength was calibrated using 785 nm KClO3 Ramanspectra against the KClO3 spectra obtained from Stokes andanti-Stokes calibrated 1064 nm system. For most species,however, the sample itself can be employed to calibrate theRaman laser frequency as seen in Figure 2 for KMnO4. TheKMnO4 provided several low frequency lines with whichone can obtain calibration accuracies of the Stokes and anti-Stokes Raman shifts of better than 0.2 cm−1 using a few ofthe strongest lines. For both the 1064 nm Nd:YAG laser andthe 785 nm GaAlAs laser, the nominal frequency was adjusteduntil the agreement was within ±0.20 cm−1. Due to theinherent Raman laser linewidths, typically 1.0 to 1.5 cm−1,greater precision is not warranted.
4 International Journal of Spectroscopy
2
1.5
1
0.5
0
Ram
an in
ten
sity
1000 500 0 −500 −1000
Potassium permanganate
Stokes Anti-Stokes(×10)
Raman laserfrequency
Wavenumber (cm−1)
+912.7+904.4+843.1+397.6+351.3
−912.7−904.3−843.0−397.5−351.1
Figure 2: Calibration scheme demonstrating how Stokes and anti-Stokes lines are used to calibrate the laser frequency such thatthe Stokes lines are at the same shift with the opposite signof the anti-Stokes lines. The present data show Raman lines ofpotassium permanganate. Typically the values are ≤ 0.20 cm−1
absolute value of each other. The excitation laser line is nominallyat 9397.58 cm−1 (air) absolute frequency, but has typical dailyvariations of ±0.50 cm−1 or more.
2.3. Intensity Calibration. In some instances, intensity cal-ibration plays a lesser role as chemical identification isaccomplished only via peak look-up tables. In many cases,however, the relative amplitude of the peaks plays a key roleas peak heights as well as positions are used for identification.This is more crucial when methods such as partial leastsquares are used for chemometric analysis [45]. In somecases absolute scattering coefficients are obtained, and inmost cases this is done by comparison to an absolutestandard [7]. As Ray and McCreery have pointed out,[27] obtaining Raman intensity values that are correctedeven on a relative scale, that is, that properly ratio outthe instrumental response, is more challenging than firstsupposed. The challenge lies in the fact that the Ramanexperiment is a single-beam experiment; that is, it is not aself-ratioing measurement such as an infrared transmittancemeasurement.
In our earlier measurements, the calibration of thescattering intensity for its wavelength dependence wasaccomplished using a broadband source of known brightness[46]. Other workers have accomplished this using calibratedblackbodies whose absolute emittance was known as a func-tion of drive current. However, the FRA 106 Raman modulehas a 3000 K white light source whose intensity is scatteredinto the spectrometer off a NIST-traceable Spectralon surfacemounted at the sample position. The instrument responsefunction as a function of wavelength was generated byratioing this spectrum relative to the intensity predictedby Planck’s law for a 3000 K source. The quality of theintensity correction was assessed by measuring the intensitiesin the corrected Stokes and anti-Stokes spectra; the relativeintensities were within a few percent of the expected value[21] and the agreement was good.
While a useful method, this is not especially practicalfor field instruments. Recently, the National Institute ofStandards and Technology [25] has developed standard
calibrated targets SRM 2241 and SRM2244, for use witheither 785 or 1064 nm excitation lasers, respectively. Bymeasuring the spectrum of such a target and comparing itto the NIST-calibrated spectrum we are able to determinea calibrated system response curve from 3500 to 100 cm−1.After determining the system response in this manner allthat is required for intensity calibration is a simple spectralmultiplication. Subsequent spectra are then multiplied bythis frequency-dependent y-axis scaling factor.
An example of the relative response factor for our1064 nm system between +3500 to +100 cm−1 can be seenin Figure 3, as well as a Raman spectrum of ortho-xylenebefore and after the correction factor has been applied.It is seen that the intensity correction is changing themost rapidly at the ends of the spectrum near the systemnotch filter cutoff and at the red end of the spectrum(Δν = 3500 cm−1, ν ∼ 5900 cm−1) where the Ge detector isapproaching its bandgap cutoff. The intensity correctionresults using the two different methods were found to givecomparable results.
2.4. Molecule Selection. To test the library’s portability alist of species was derived. The list of the compositelibrary contains a total of 145 molecules. Of these, 20 areknown explosive materials specifically selected and these aresummarized with some of their properties in Table 1. Forthe nonexplosive materials we intentionally chose severaldifferent categories and colors of molecules and materialsso as to attain a good cross-representation. While a moreextensive list is always desirable for statistical purposes, timeand budget constraints would not allow this. Many of thereference materials are pure chemicals commonly found ina modern laboratory, but care was taken such that the listrepresented a good variety of chemical classes, rather thanjust a few classes such as, for example, alkanes, alkenes, andalcohols. The composite list was designed to contain at leastthree species from each of the several chemical categoriesfound in Table 2: aldehydes, alkenes, amines, amino acids,aromatics, carboxylic acids, halogenated organics, ketones,thiols, mineral acids, ionic simple salts, and organometallics.Table 2 characterizes the chemical breakdown of these 125non-explosive materials. For those pure chemical specieswith two or more functional groups, the compound couldbe counted in two different categories; for example, 1, 3-dichlorobenzene would be tallied both as an aromatic andas a halogenated organic. Besides pure chemicals foundin a chemical laboratory, the list was further expanded tocontain common household and industrial materials, andalso materials such as mineral acids, common minerals andsome biological samples. Some of the common materialsincluded items such as wood, concrete, minerals, and dirt;plastics such as nylon, Teflon, and a water bottle; other fabricssuch as wool, cotton, leather; and household materials.
The list was thus completed and expanded to includea total spectral database of 145 compounds and materialsincluding the 20 explosives as described above—with asignificant effort to derive a representative potpourri ofdifferent chemical classes. What is only partially indicatedis that several of the non-explosive chemical samples were
Figure 3: Response of the 1064 nm FT-Raman system before andafter correcting for the spectrometer intensity response functionusing the NIST 2244 standard plotted as a function of Raman shift.The x-axis represents 5897 to 9327 cm−1 absolute wavenumbers,with the intensity correction factor generated by the standardplotted as the dashed green line. The “raw” spectrum is plotted inblack as the lower trace, the corrected spectrum in red as the uppertrace. These spectra are arbitrarily scaled 0 to 1 on the ordinate andhave been vertically offset for clarity.
intentionally selected due to their mixture of light and darkmaterials, that is, their physical colors. While there was a longlist of clear liquids and white solids (the “unknown whitepowder” challenge), there were also many deeply coloredmaterials, which are more susceptible to fluorescence at785 nm. To further ensure a representative cross-section, spe-cific examples were also intentionally chosen because they areknown to fluoresce, in some cases more strongly at 785 than1064 nm. These include species such as calcium hypochlorite,but also some ink dyes as suggested by the work of Geimanet al. [47], namely, acid red 52 dye and crystal violet dye.The complete list of chemical species and breakdown bychemical category is available as Supplementary materialavailable online at doi:10.1155/2012/297056, with the classessummarized in Table 2.
3. Results and Discussion: Spectroscopy
As discussed above, the intensity calibration scales only therelative (wavelength-dependent) response as seen in Figure 3,with the spectrum maximum arbitrarily set to a value of2.0. Absolute cross-sections are not needed for this study asthe goal is only for identification not quantification. Thatis to say, the present results do not explicitly account forthe “ν4” factor associated with excitation wavelength. Strictlyspeaking, if a power-detecting element is used (commonin NIR systems), the (ν0 − νk)4 expression is appropriatewhereas if a photon-counting device (common in visibleRaman systems) is used, the relative response term isν0(ν0 − νk)3, where ν0 is the laser frequency and νk thevibrational mode frequency [22]. As has been noted before
Caprylic acid: 785 nm
Caprylic acid: 1064 nm
Hexanoic acid: 1064 nm
Tributyl phosphate:1064 nm
8
7
6
5
4
3
2
1
0
Ram
an in
ten
sity
1800 1600 1400 1200 1000 800 600 400 200
Wavenumber (cm−1)
Referencespectrum
Score:
997
739
676
Figure 4: Example of a successful identification for comparingthe 785 nm data versus the 1064 nm library. The result is typical;for most species the 1064 nm spectrum of the same compound isidentified as the top candidate “hit” for the 785 spectrum. Scoresfor the top three hits are at right. Spectra are scaled 0 to 2 and havebeen vertically offset for clarity.
[7, 22] any measured intensity of a Raman band in facthas contributions from 3 sources, namely, (1) the Ramanactivity itself that is intrinsic to the scattering species; thisis the term that is typically calculated by theoretical models,(2) a statistical mechanical term accounting for temperature(which affects the population of the scattering vibrationalstate), and (3) the well-known “ν4” factor that depends onthe laser excitation frequency and the type of photometricdetection in the Raman spectrometer as discussed above.
The quality of the derived spectra is very high due tothe laboratory nature of our experiments with adequateaveraging time. After proper wavelength and (relative) inten-sity calibration, and barring any substantial fluorescence orresonance effects, the spectra from the differing wavelengthsystems should nearly superimpose on one another. Inalmost all cases our results have shown this to be the case.The 1064 reference data can readily serve as reference spectrafor 785 systems, as shown for the two FT-Raman systemsshown here, as well as for dispersive 785 handheld Ramansystems [8]. This is seen for a typical example in Figure 4and was the case for almost all measured species. The searchalgorithm and criteria for declaring a match are describedbelow, but Figure 4 illustrates the results of this process forcaprylic acid. In particular, caprylic acid (octanoic acid) isa “785 clean spectrum” so the search clearly identifies thecorrect compound at 1064 as the top hit. The traces of the“search” 785 spectrum and the “reference” 1064 spectrumare seen as the top two traces in the plot and are identicalto the eye. The second hit, with a relatively high score, is thechemically and spectroscopically similar hexanoic acid, withtributyl phosphate detected as the third hit.
For the explosives, the commercial grade materials suchas those used for mining and demolition are sold by tradenames and generally consist of a mixture of energetic mate-rials. The variety and relative percent concentrations of thematerials used vary widely and depend upon required per-formance and cost. Many of the commercial products, whilesold under different names, have some strong commonalities
6 International Journal of Spectroscopy
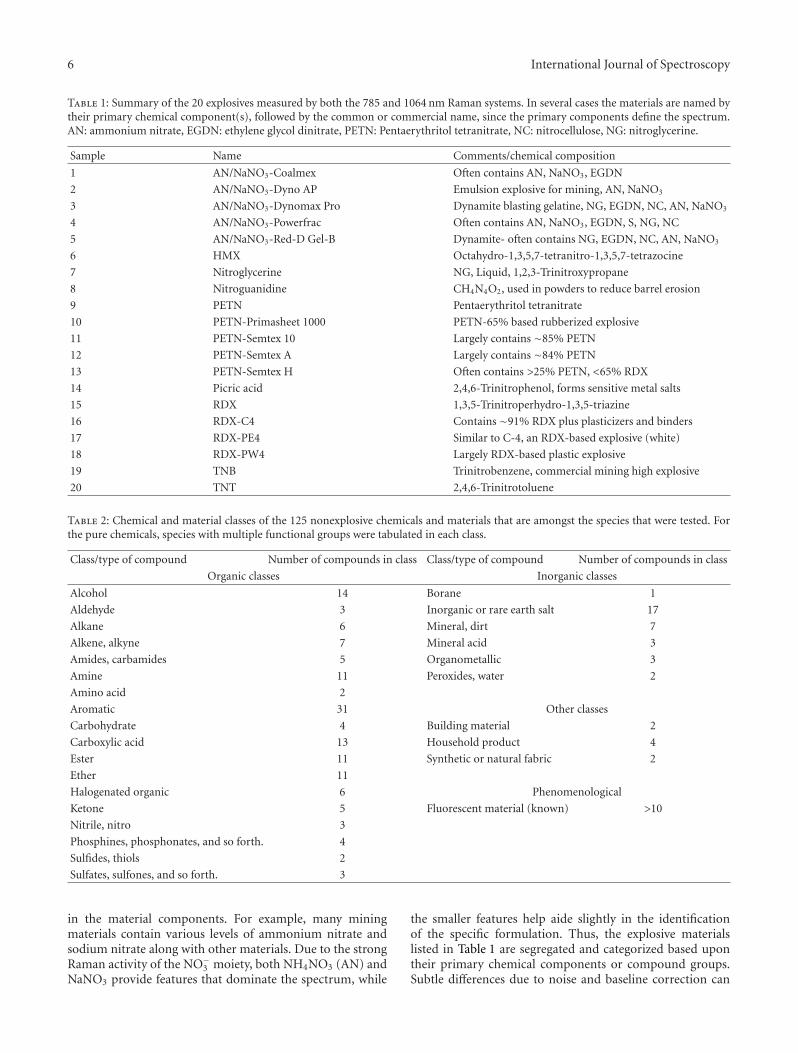
Table 1: Summary of the 20 explosives measured by both the 785 and 1064 nm Raman systems. In several cases the materials are named bytheir primary chemical component(s), followed by the common or commercial name, since the primary components define the spectrum.AN: ammonium nitrate, EGDN: ethylene glycol dinitrate, PETN: Pentaerythritol tetranitrate, NC: nitrocellulose, NG: nitroglycerine.
Sample Name Comments/chemical composition
1 AN/NaNO3-Coalmex Often contains AN, NaNO3, EGDN
2 AN/NaNO3-Dyno AP Emulsion explosive for mining, AN, NaNO3
3 AN/NaNO3-Dynomax Pro Dynamite blasting gelatine, NG, EGDN, NC, AN, NaNO3
4 AN/NaNO3-Powerfrac Often contains AN, NaNO3, EGDN, S, NG, NC
5 AN/NaNO3-Red-D Gel-B Dynamite- often contains NG, EGDN, NC, AN, NaNO3
8 Nitroguanidine CH4N4O2, used in powders to reduce barrel erosion
9 PETN Pentaerythritol tetranitrate
10 PETN-Primasheet 1000 PETN-65% based rubberized explosive
11 PETN-Semtex 10 Largely contains ∼85% PETN
12 PETN-Semtex A Largely contains ∼84% PETN
13 PETN-Semtex H Often contains >25% PETN, <65% RDX
14 Picric acid 2,4,6-Trinitrophenol, forms sensitive metal salts
15 RDX 1,3,5-Trinitroperhydro-1,3,5-triazine
16 RDX-C4 Contains ∼91% RDX plus plasticizers and binders
17 RDX-PE4 Similar to C-4, an RDX-based explosive (white)
18 RDX-PW4 Largely RDX-based plastic explosive
19 TNB Trinitrobenzene, commercial mining high explosive
20 TNT 2,4,6-Trinitrotoluene
Table 2: Chemical and material classes of the 125 nonexplosive chemicals and materials that are amongst the species that were tested. Forthe pure chemicals, species with multiple functional groups were tabulated in each class.
Class/type of compound Number of compounds in class Class/type of compound Number of compounds in class
Organic classes Inorganic classes
Alcohol 14 Borane 1
Aldehyde 3 Inorganic or rare earth salt 17
Alkane 6 Mineral, dirt 7
Alkene, alkyne 7 Mineral acid 3
Amides, carbamides 5 Organometallic 3
Amine 11 Peroxides, water 2
Amino acid 2
Aromatic 31 Other classes
Carbohydrate 4 Building material 2
Carboxylic acid 13 Household product 4
Ester 11 Synthetic or natural fabric 2
Ether 11
Halogenated organic 6 Phenomenological
Ketone 5 Fluorescent material (known) >10
Nitrile, nitro 3
Phosphines, phosphonates, and so forth. 4
Sulfides, thiols 2
Sulfates, sulfones, and so forth. 3
in the material components. For example, many miningmaterials contain various levels of ammonium nitrate andsodium nitrate along with other materials. Due to the strongRaman activity of the NO−3 moiety, both NH4NO3 (AN) andNaNO3 provide features that dominate the spectrum, while
the smaller features help aide slightly in the identificationof the specific formulation. Thus, the explosive materialslisted in Table 1 are segregated and categorized based upontheir primary chemical components or compound groups.Subtle differences due to noise and baseline correction can
International Journal of Spectroscopy 7
lead to slight changes in relative peak intensity and evenpeak position. Due to the similar makeup of several of theexplosives, such differences were likely the cause of the top hitof an analyte not being an exact match to that formulationbut the top hit was for a formulation containing nearlyidentical chemical components to those in the analyte. Whenthe library generated at 1064 nm was used for identifyingsamples measured at 785 nm and was based upon selectingthe correct compound group (e.g., if any of the AN/NaNO3
formulations were identified), all 20 explosive formulationsin Table 1 were correctly identified.
There were a few outliers in the statistical data, a few ofwhich merit additional explanation: for a few species, thefluorescence phenomenon stimulated by the excitation laserlight generated a signal that is more intense than the lightscattered by the weaker Raman effect; this was true for thosespecies selected due to their 785 nm fluorescence [47]. Influorescence, the excitation light is absorbed and re-emittedvia an electronic transition that does not involve a changein the spin quantum number; at room temperature thefluorescence bands typically manifest themselves as a broadand featureless background. In some cases, this fluorescencebackground signal can be removed via baseline correction,but many researchers have shown that shifting to longerwavelength excitation is even more advantageous, as Lewiset al. have shown for certain explosives [48, 49]. In thepresent studies a broad fluorescence was observed in ∼10out of 145 cases, but identification was still possible for afew of these materials. Typically the method used in mostsensors is to simply filter the analysis via baseline correctionsuch as with a rolling circle filter or some other baselinecorrection algorithm. While the phenomena are real opticalphenomena, they are usually featureless and are simplyremoved as backgrounds via a software algorithm, leavingonly the Raman peaks.
Interestingly, there were also a few anomalous situationswhere there was significant spectral change (not just afluorescence background) depending upon the excitationwavelength. One example, illustrated in Figure 5, was forneat Er2O3. While a few peaks are common and arelikely Raman bands, it appears that either the 1064 nmor 785 nm excitation, or both, has excited transitions intolow-lying electronic states. The resulting fluorescence thendominates the emission spectrum. In this particular casethe fluorescence(s) are not broad and featureless as in theother cases, but are structured and are likely associatedwith the pseudoatomic transitions of the Er3+ cation. Thetranslanthanides and trans-actinides typically have multiplelow-lying electronic states that give the species their colors. Intheir studies of Er2O3 nanocolloids, Patel et al. [50] discussan upconversion signal observed at 740 nm when pumpingwith a 980 nm multimode diode laser that is resonant with4I11/2 state. This was ascribed to a two photon excitationprocesses of the type 4I15/2 → 4I11/2 and 4I13/2 → 4F9/2
that resulted (after internal conversion) to a 4I9/2 → 4I15/2
emitted. The structured bands we see in the 785 nm Ramanspectrum near 2500 cm−1 shift correspond to 10,235 cm−1
absolute or about 977 nm and are likely emission from theoriginal state into which their 980 nm laser pumped, that is,
Erbium oxide 1064Erbium oxide 785
4
3
2
1
0
3500 3000 2500 2000 1500 1000 500
Raman shift (cm−1)
Figure 5: Results of the Er2O3 spectra at the two different excitationwavelengths. The spectra have been vertically offset for clarity withy-axis scaled 0–2. The results are discussed in the text.
an 4I11/2 → 4I15/2 emission, though further measurementswould be needed to confirm this [51].
4. Results and Discussion:Statistical Analysis
For the analysis, our overarching goal was to determinewhether a spectrum recorded using 785 nm excitation can besuccessfully identified using a library created from 1064 nmreference data. To test the hypothesis that the 785 nm and1064 nm spectra are interchangeable after wavelength andintensity corrections, a comparison study was conducted,where the Bruker OPUS commercial spectral searchingsoftware was used and the 785 nm intensity-corrected spectrawere treated as test cases and searched against a 1064 nmintensity-corrected library. The software has several differentsearch algorithms, each with several possible variations to it.However, our intent was not to perform a comprehensivestudy of different algorithms, but rather to measure thesimilarity of the 785 nm and 1064 nm spectra under ordinarylaboratory conditions. Therefore, the OPUS basic searchalgorithm was used.
The OPUS basic search algorithm works by matchingpeaks without regard to their intensities. In particular, forany given spectrum, a peak table is constructed. This peaktable is used to create a signature spectrum consisting ofLorentz curves for every peak, each of which has a heightof one. To compare a test case to a library compound, thealgorithm looks up all of the test signature peaks in thelibrary signature. Those test peaks that appear in the librarysignature are assigned a value of one, whereas those thatare different or do not appear in the library signature areassigned a lesser value, with a minimum of zero. A hit qualityis then calculated as the average of these values times 1000.More simply, when all test case peaks are found in givenlibrary signature spectrum, the hit quality is 1000. Whennone of them are found, the hit quality is zero. For example,when three of four test signature peaks are found in a givenlibrary entry, the hit quality is 3/4∗1000 = 750. For a giventest case, this comparison process is repeated for every entry
8 International Journal of Spectroscopy
of the spectral library, and the three library compounds withthe highest hit quality—the top three hits—are reported.
OPUS allows for some parameter adjustment in itsbasic search algorithm. In particular, there is an adjustable“search sensitivity” parameter. While specific details aboutthis parameter are unavailable, its value, an integer between 1and 20, relates to the sensitivity with which OPUS identifiespeaks, 20 dictating a much closer match. Loosely interpreted,a higher search sensitivity means the peak locations must bemore precise for the algorithm to give a higher hit score,to the point that Bruker did not recommend a setting of15 or higher for this application. The search sensitivity alsoaffects the number of peaks created in the temporary peaktable for the spectrum being searched. Thus, a higher searchsensitivity implies a stronger match and implies more peaksmay have been created and matched than a lower sensitivityvalue. OPUS suggests testing different values to determinewhich is best for a particular application. For our application,a search sensitivity of 7 was chosen because preliminaryresults showed this value tended to generate favorable searchresults in terms of good discrimination.
A 1064 nm library was created in OPUS using all145 compound spectra. The 785 nm spectra were thenindividually loaded and searched against the 1064 nm libraryvia the basic search algorithm. In terms of the explosives,using the chemical formulation grouping, all 20 explosiveswere correctly identified. It should also be noted that formany of these formulations the top 3 or 4 hits were forsimilar compounds and all had very similar high scores. Thusthe explosive materials listed in Table 1 are segregated andcategorized based upon primary chemical components orcompound groups. When the library generated at 1064 nmwas used for identifying samples measured at 785 nm andwas based upon selecting the correct compound group, all20 explosive formulations were correctly identified. We alsonote that, for the explosives, the first hit minus secondhit refers to the first hit minus the first hit outside of itscompound group. For example, NH4NO3-NaNO3-Coalmexhas a top hit of 1000. Its second, third, fourth, and fifth hitsare also 1000 with each hit belonging to the same compoundgroup. Its first hit outside of the group is potassium nitratewith a hit score of 468. Therefore the distance between firstand second hits for AN-NaNO3 is 532, the difference of 1000and 468.
While the explosives were all easily identified with the1064 imported library, for the more general case of relyingon an algorithm for identifications, it is important tofirst establish objective criteria for declaring a match. Forexample, when the top hit score is near 1000, there is strongevidence for a match, but not so when the top hit score is near400. Even in the case of a high score, if the top two hit scoresare so close as to be virtually identical (say 985 and 988), thenthere is ambiguity in declaring one or the other a match.A concrete example of this is provided in Figure 6. In thefigure, hair gel had petroleum jelly as its top hit with hair gelas its second hit. This implies the search algorithm cannot,for certain, determine which spectrum is the correct match.In this particular case, because the hair gel was determinedto be made of almost exclusively petroleum jelly with a few
8
6
4
2
0
Ram
an in
ten
sity
3200 2800 2400 2000 1600 1200 800 400
Hair gel: 785 nm
Petroleum jelly: 1064 nm
Hair gel: 1064 nm
Paraffin wax: 1064 nm
Referencespectrum
Score:
999
922
919
Raman shift (cm−1)
Figure 6: Spectral search example of one of the few false hitsshowing hair gel at 785 nm with petroleum jelly (1064) as its tophit and hair gel (1064) as its second hit. The distance between thetop two hits is more than 60 (with a distance of 77) and the top hitis above 775 so it is declared a match. These spectra are all scaled0–2 on the y-axis and have been vertically offset for clarity.
trace additives (namely a coloring agent) the major peakswere therefore in the same positions. Hair gel is an exampleof a “false hit”; however, in the more general case, a “falsemiss” is usually caused by peaks in (nearly) the same x-axislocation but which have slightly different peak intensities orprofiles. In such cases a more definitive criterion is needed todeclare a match.
Based on the above considerations, two criteria were thusestablished for matching the 785 nm spectra to the 1064 nmlibrary. The first criterion, referred to as the naıve criterion,selects the top hit as a match regardless of the hit score. Usingthis criterion, 128 out of the 145 spectra at 785 nm (88.3%)were correctly identified. The second method, referred tohere as the dual criteria, is designed to take into accountnot only the top hit but also the difference between the firstand second hits. In this case, the top hit must be above aminimum threshold to be declared a match, and the distancebetween the first and second hit must be larger than aspecified value. These dual criteria ensure that (1) the top hitclosely matches the test spectrum, and (2) there are no otherlibrary spectra similar enough to the test spectrum to causeambiguity. After initial experimentation, the dual criteriawere set so that the minimum hit threshold was 775 and theminimum required distance between the first and second hitwas at least 60. Those test spectra meeting both criteria weredeclared a match. All others were declared “uncertain.”
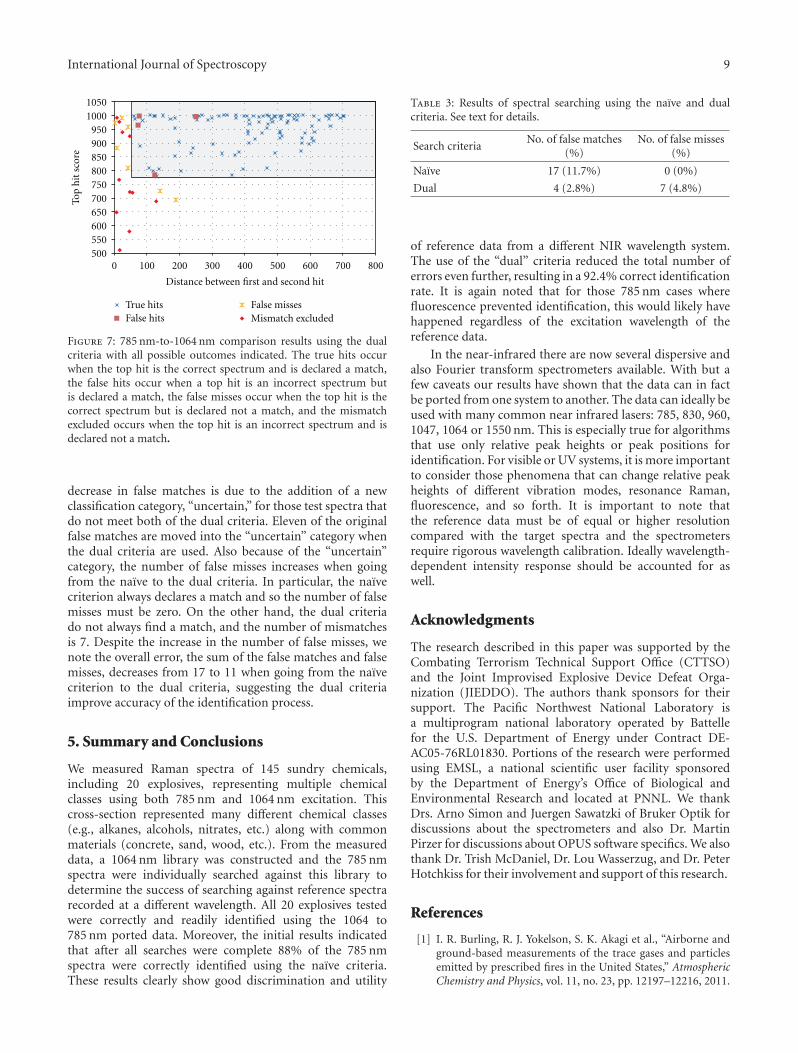
Figure 7 contains the results of matching the 785 nmspectra to the 1064 nm library using the dual criteria. The y-axis contains the top hit score and the x-axis is the distancebetween the first two hit scores. The points inside the shadedregion are the ones that are declared a match using the dualcriteria. The markers indicate whether the correspondingspectrum was a (1) correct match (true hit), (2) an incorrectmatch (false hit), (3) an incorrect elimination (false miss), or(4) a correct elimination (mismatch excluded).
Table 3 provides a comparison between the results usingthe naıve criteria and the dual criteria. As can be seen, thenumber of false matches using the naıve criteria is 17, andthis number drops to 4 using the dual criteria. This large
International Journal of Spectroscopy 9
10501000
950900850800750700650600550500
Top
hit
sco
re
0 100 200 300 400 500 600 700 800
Distance between first and second hit
True hitsFalse hits
False missesMismatch excluded
Figure 7: 785 nm-to-1064 nm comparison results using the dualcriteria with all possible outcomes indicated. The true hits occurwhen the top hit is the correct spectrum and is declared a match,the false hits occur when a top hit is an incorrect spectrum butis declared a match, the false misses occur when the top hit is thecorrect spectrum but is declared not a match, and the mismatchexcluded occurs when the top hit is an incorrect spectrum and isdeclared not a match.
decrease in false matches is due to the addition of a newclassification category, “uncertain,” for those test spectra thatdo not meet both of the dual criteria. Eleven of the originalfalse matches are moved into the “uncertain” category whenthe dual criteria are used. Also because of the “uncertain”category, the number of false misses increases when goingfrom the naıve to the dual criteria. In particular, the naıvecriterion always declares a match and so the number of falsemisses must be zero. On the other hand, the dual criteriado not always find a match, and the number of mismatchesis 7. Despite the increase in the number of false misses, wenote the overall error, the sum of the false matches and falsemisses, decreases from 17 to 11 when going from the naıvecriterion to the dual criteria, suggesting the dual criteriaimprove accuracy of the identification process.
5. Summary and Conclusions
We measured Raman spectra of 145 sundry chemicals,including 20 explosives, representing multiple chemicalclasses using both 785 nm and 1064 nm excitation. Thiscross-section represented many different chemical classes(e.g., alkanes, alcohols, nitrates, etc.) along with commonmaterials (concrete, sand, wood, etc.). From the measureddata, a 1064 nm library was constructed and the 785 nmspectra were individually searched against this library todetermine the success of searching against reference spectrarecorded at a different wavelength. All 20 explosives testedwere correctly and readily identified using the 1064 to785 nm ported data. Moreover, the initial results indicatedthat after all searches were complete 88% of the 785 nmspectra were correctly identified using the naıve criteria.These results clearly show good discrimination and utility
Table 3: Results of spectral searching using the naıve and dualcriteria. See text for details.
Search criteriaNo. of false matches
(%)No. of false misses
(%)
Naıve 17 (11.7%) 0 (0%)
Dual 4 (2.8%) 7 (4.8%)
of reference data from a different NIR wavelength system.The use of the “dual” criteria reduced the total number oferrors even further, resulting in a 92.4% correct identificationrate. It is again noted that for those 785 nm cases wherefluorescence prevented identification, this would likely havehappened regardless of the excitation wavelength of thereference data.
In the near-infrared there are now several dispersive andalso Fourier transform spectrometers available. With but afew caveats our results have shown that the data can in factbe ported from one system to another. The data can ideally beused with many common near infrared lasers: 785, 830, 960,1047, 1064 or 1550 nm. This is especially true for algorithmsthat use only relative peak heights or peak positions foridentification. For visible or UV systems, it is more importantto consider those phenomena that can change relative peakheights of different vibration modes, resonance Raman,fluorescence, and so forth. It is important to note thatthe reference data must be of equal or higher resolutioncompared with the target spectra and the spectrometersrequire rigorous wavelength calibration. Ideally wavelength-dependent intensity response should be accounted for aswell.
Acknowledgments
The research described in this paper was supported by theCombating Terrorism Technical Support Office (CTTSO)and the Joint Improvised Explosive Device Defeat Orga-nization (JIEDDO). The authors thank sponsors for theirsupport. The Pacific Northwest National Laboratory isa multiprogram national laboratory operated by Battellefor the U.S. Department of Energy under Contract DE-AC05-76RL01830. Portions of the research were performedusing EMSL, a national scientific user facility sponsoredby the Department of Energy’s Office of Biological andEnvironmental Research and located at PNNL. We thankDrs. Arno Simon and Juergen Sawatzki of Bruker Optik fordiscussions about the spectrometers and also Dr. MartinPirzer for discussions about OPUS software specifics. We alsothank Dr. Trish McDaniel, Dr. Lou Wasserzug, and Dr. PeterHotchkiss for their involvement and support of this research.
References
[1] I. R. Burling, R. J. Yokelson, S. K. Akagi et al., “Airborne andground-based measurements of the trace gases and particlesemitted by prescribed fires in the United States,” AtmosphericChemistry and Physics, vol. 11, no. 23, pp. 12197–12216, 2011.
10 International Journal of Spectroscopy
[2] B. E. Bernacki and M. C. Phillips, “Standoff hyperspectralimaging of explosives residues using broadly tunable externalcavity quantum cascade laser illumination,” in Chemical,Biological, Radiological, Nuclear, and Explosives (CBRNE)Sensing XI, vol. 7665, article 76650I of Proceedings of SPIE,Orlando, Fla , USA, April 2010.
[3] T. J. Johnson, R. L. Sams, S. D. Burton, and T. A. Blake,“Absolute integrated intensities of vapor-phase hydrogenperoxide (H2O2) in the mid-infrared at atmospheric pressure,”Analytical and Bioanalytical Chemistry, vol. 395, no. 2, pp.377–386, 2009.
[4] W. M. Wendlandt and H. G. Hecht, Reflectance Spectroscopy,Interscience Publishers, London, UK, 1966.
[5] T. J. Johnson, N. B. Valentine, and S. W. Sharpe, “Mid-infrared versus far-infrared (THz) relative intensities of room-temperature Bacillus spores,” Chemical Physics Letters, vol.403, no. 1–3, pp. 152–157, 2005.
[6] D. M. Sheen, D. L. McMakin, and T. E. Hall, “Detection ofExplosives by Millimeter-wave Imaging,” in CounterterroristDetection Techniques of Explosives, J. Yinon, Ed., pp. 237–278,Elsevier, Amsterdam, The Netherlands, 2007.
[7] R. L. McCreery, “Photometric standards for Raman spec-troscopy,” in Handbook of Vibrational Spectroscopy, J. M.Chalmers and P. R. Griffiths, Eds., Wiley, New York, NY, USA,2002.
[8] J. C. Weatherall, J. Barber, C. S. Brauer et al., “Adapting Ramanspectra from laboratory spectrometers to portable detectionsystems,” Applied Spectroscopy.
[9] P. Vandenabeele, K. Castro, M. Hargreaves, L. Moens, J. M.Madariaga, and H. G. M. Edwards, “Comparative study ofmobile Raman instrumentation for art analysis,” AnalyticaChimica Acta, vol. 588, no. 1, pp. 108–116, 2007.
[10] N. R. Butt, M. Nilsson, A. Jakobsson et al., “Classification ofRaman spectra to detect hidden explosives,” IEEE Geoscienceand Remote Sensing Letters, vol. 8, no. 3, pp. 517–521, 2011.
[11] A. Ehlerding, I. Johansson, S. Wallin, and H. Ostmark,“Electro-optical remote sensing, photonic technologies, andapplications IV,” vol. 7835, article 783507 of Proceedings ofSPIE, Toulouse, France, September 2010.
[12] S. Wallin, A. Pettersson, H. Ostmark, and A. Hobro, “Laser-based standoff detection of explosives: a critical review,”Analytical and Bioanalytical Chemistry, vol. 395, no. 2, pp.259–274, 2009.
[13] A. Pettersson, I. Johansson, S. Wallin, M. Nordberg, and H.Ostmark, “Near real-time standoff detection of explosives in arealistic outdoor environment at 55 m distance,” Propellants,Explosives, Pyrotechnics, vol. 34, no. 4, pp. 297–306, 2009.
[14] M. D. Ray, A. J. Sedlacek, and M. Wu, “Ultraviolet mini-Raman lidar for stand-off, in situ identification of chemicalsurface contaminants,” Review of Scientific Instruments, vol. 71,no. 9, pp. 3485–3489, 2000.
[15] M. Wu, M. Ray, K. H. Fung, M. W. Ruckman, D. Harder, andA. J. Sedlacek, “Stand-off detection of chemicals by UV Ramanspectroscopy,” Applied Spectroscopy, vol. 54, no. 6, pp. 800–806, 2000.
[16] B. Zachhuber, G. Ramer, A. Hobro, E. T. H. Chrysostom,and B. Lendl, “Stand-off Raman spectroscopy: a powerfultechnique for qualitative and quantitative analysis of inorganicand organic compounds including explosives,” Analytical andBioanalytical Chemistry, vol. 400, no. 8, pp. 2439–2447, 2011.
[17] B. Zachhuber, C. Gasser, E. T. H. Chrysostom, and B. Lendl,“Stand-off Raman spectroscopy: a powerful stand-off spatialoffset Raman spectroscopy for the detection of concealed
content in distant objects,” Analytical Chemistry, vol. 83, no.24, pp. 9438–9442, 2011.
[18] E. D. Emmons, A. Tripathi, J. A. Guicheteau, S. D. Christesen,and A. W. Fountain, “Raman chemical imaging of explosive-contaminated fingerprints,” Applied spectroscopy, vol. 63, no.11, pp. 1197–1203, 2009.
[19] B. Schrader, A. Hoffmann, A. Simon, and J. Sawatzki, “Can aRaman renaissance be expected via the near-infrared Fouriertransform technique?” Vibrational Spectroscopy, vol. 1, no. 3,pp. 239–250, 1991.
[20] D. B. Chase, “Fourier transform Raman spectroscopy,” Journalof the American Chemical Society, vol. 108, no. 24, pp. 7485–7488, 1986.
[21] D. A. Long, Raman Spectroscopy, McGraw-Hill, New York, NY,USA, 1977.
[22] S. D. Williams, T. J. Johnson, T. P. Gibbons, and C. L. Kitchens,“Relative Raman intensities in C6H6, C6D6, and C6F6: acomparison of different computational methods,” TheoreticalChemistry Accounts, vol. 117, no. 2, pp. 283–290, 2007.
[23] T. A. Blake, J. F. Kelly, N. B. Gallagher, P. L. Gassman, andT. J. Johnson, “Passive standoff detection of RDX residues onmetal surfaces via infrared hyperspectral imaging,” Analyticaland Bioanalytical Chemistry, vol. 395, no. 2, pp. 337–348, 2009.
[24] T. Okuno, “Thermal effect of visible light and infra-redradiation (IR-A, IR-B AND IR-C) on the eye—a study ofinfra-red cataract based on a model,” Annals of OccupationalHygiene, vol. 38, no. 4, pp. 351–359, 1994.
[25] S. J. Choquette, E. S. Etz, W. S. Hurst, D. H. Blackburn, and S.D. Leigh, “Relative intensity correction of Raman spectrome-ters: NIST SRMs 2241 through 2243 for 785 nm, 532 nm, and488 nm/514.5 nm excitation,” Applied Spectroscopy, vol. 61, no.2, pp. 117–129, 2007.
[26] M. Fryling, C. J. Frank, and R. L. McCreery, “Intensitycalibration and sensitivity comparisons for CCD/Ramanspectrometers,” Applied Spectroscopy , vol. 47, pp. 1965–1974,1993.
[27] K. G. Ray and R. L. McCreery, “Simplified calibration ofinstrument response function for Raman spectrometers basedon luminescent intensity standards,” Applied Spectroscopy, vol.51, no. 1, pp. 108–116, 1997.
[28] R. Martini, C. Glazowski, E. A. Whittaker et al., “Optical free-space communications at middle infra-red wavelengths,” inQuantum Sensing and Nanophotonic Devices, M. Razeghi andG. J. Brown, Eds., vol. 5359 of Proceedings of SPIE, pp. 196–202, San Jose, Calif, USA, January 2004.
[29] A. W. Fountain III, C. K. Mann, and T. J. Vickers, “Rou-tine wavenumber calibration of an FT-Raman spectrometer,”Applied Spectroscopy, vol. 49, no. 7, pp. 1048–1053, 1995.
[30] W. S. Hurst, S. J. Choquette, and E. S. Etz, “Requirementsfor relative intensity correction of Raman spectra obtainedby column-summing charge-coupled device data,” AppliedSpectroscopy, vol. 61, no. 7, pp. 694–700, 2007.
[31] P. Vandenabeele, “Evaluation of a spectral searching algorithmfor the comparison of Raman band positions,” SpectrochimicaActa A, vol. 80, no. 1, pp. 27–31, 2011.
[32] R. J. Bell, Introductory Fourier Transform Spectroscopy, Aca-demic Press, New York, NY, USA, 1972.
[33] S. W. Sharpe, R. L. Sams, T. J. Johnson, P. M. Chu, G. C.Rhoderick, and F. R. Guenther, “Creation of 0.10 cm−1 resolu-tion, quantitative, infrared spectral libraries for gas samples,”in Vibrational Spectroscopy-based Sensor Systems, vol. 4577 ofProceedings of SPIE, pp. 12–24, Boston, Mass, USA, 2002.
International Journal of Spectroscopy 11
[34] S. W. Sharpe, T. J. Johnson, R. L. Sams, P. M. Chu, G.C. Rhoderick, and P. A. Johnson, “Gas-phase databases forquantitative infrared spectroscopy,” Applied Spectroscopy, vol.58, no. 12, pp. 1452–1461, 2004.
[35] J. E. Bertie, “Specification of components, methods, andparameters in Fourier transform spectroscopy by Michelsonand related interferometers: IUPAC recommendations,” Pureand Applied Chemistry, vol. 70, no. 10, pp. 2039–2045, 1998.
[36] B. Schrader, A. Hoffmann, A. Simon, R. Podschadlowski, andM. Tischer, “NIR-FT-Raman-spectroscopy, state of the art,”Journal of Molecular Structure, vol. 217, pp. 207–220, 1990.
[37] T. J. Johnson, R. L. Sams, T. A. Blake, S. W. Sharpe, and P.M. Chu, “Removing aperture-induced artifacts from Fouriertransform infrared intensity values,” Applied Optics, vol. 41,no. 15, pp. 2831–2839, 2002.
[38] D. Bonen, T. J. Johnson, and S. L. Sarkar, “Characterization ofprincipal clinker minerals by FT-Raman microspectroscopy,”Cement and Concrete Research, vol. 24, no. 5, pp. 959–965,1994.
[39] J. W. C. Johns, “High resolution and the accurate measure-ment of intensities,” Mikrochimica Acta, vol. 93, no. 1–6, pp.171–188, 1987.
[40] A. G. Maki and J. S. Wells, “Wavenumber calibration tablesfrom heterodyne frequency measurements,” National Insti-tute of Standards and Technology, Special Publication 821,U.S. Government Printing Office, Washington, DC, 1991,http://physics.nist.gov/PhysRefData.
[41] D. Hutsebaut, P. Vandenabeele, and L. Moens, “Evaluation ofan accurate calibration and spectral standardization procedurefor Raman spectroscopy,” Analyst, vol. 130, no. 8, pp. 1204–1214, 2005.
[42] A. W. Fountain III, T. J. Vickers, and C. K. Mann, “Factorsthat affect the accuracy of Raman shift measurements onmultichannel spectrometers,” Applied Spectroscopy, vol. 52, no.3, pp. 462–468, 1998.
[43] M. Fryling and C. J. Frank, “Intensity calibration and sen-sitivity comparisons for CCD/Raman spectrometers,”AppliedSpectroscopy, vol. 47, no. 12, pp. 1965–1974, 1993.
[44] “Standard Guide for Testing the Resolution of a Raman Spec-trometer,” ASTM E2529-06, ASTM Publication, www.astm.org/.
[45] J. B. Forrester, N. B. Valentine, Y.-F. Su, and T. J. Johnson,“Chemometric analysis of multiple species of Bacillus bacterialendospores using infrared spectroscopy: discrimination to thestrain level,” Analytica Chimica Acta, vol. 651, no. 1, pp. 24–30,2009.
[46] B. M. Kunkel, Y.-F Su, and R. G. Tonkyn, “Raman databaseconsiderations for near-infrared systems,” in Optics andPhotonics for Counterterrorism and Crime Fighting VII, vol.8189, article 818905 of Proceedings of SPIE, Prague, CzechRepublic, September 2011.
[47] I. Geiman, M. Leona, and J. R. Lombardi, “Application ofRaman spectroscopy and surface-enhanced Raman scatteringto the analysis of synthetic dyes found in ballpoint pen inks,”Journal of Forensic Sciences, vol. 54, no. 4, pp. 947–952, 2009.
[48] M. L. Lewis, I. R. Lewis, and P. R. Griffiths, “Anti-StokesRaman spectrometry with 1064-nm excitation: an effectiveinstrumental approach for field detection of explosives,”Applied Spectroscopy, vol. 58, no. 4, pp. 420–427, 2004.
[49] N. W. Daniel Jr., I. R. Lewis, and P. R. Griffiths, “Interpretationof Raman spectra of nitro-containing explosive materials. PartII: the implementation of neural, fuzzy, and statistical models
for unsupervised pattern recognition,” Applied Spectroscopy,vol. 51, no. 12, pp. 1868–1879, 1997.
[50] D. Patel, C. Vance, N. King, M. Jessup, and S. Sarkisov, “Prepa-ration, fluorescence spectroscopy and AFM analysis of erbiumoxide nanocolloid,” in Optical Components and Materials VI,vol. 7212, article 72121F of Proceedings of SPIE, 2009.
[51] S. Heer, K. Kompe, H.-U. Gudel, and M. Haase, “Highly effi-cient multicolour upconversion emission in transparent col-loids of lanthanide-doped NaYF4 nanocrystals,” AdvancedMaterials, vol. 16, no. 23-24, pp. 2102–2105, 2004.


![Implications of a Metric for Performance Portability ...€¦ · [3] K. Raman, T. Deakin, J. Price and S. McIntosh-Smith, “Improving Achieved Memory Bandwidth from C++ Codes on](https://static.documents.pub/doc/80x56/60508736ac4f6661f64aa599/implications-of-a-metric-for-performance-portability-3-k-raman-t-deakin.jpg)


![Final Report Integrated Automated Analyzer for Monitoring of … · 2014-09-02 · analysis of explosives, including gas [2], liquid [3-5], thin-layer chromatographies [6], Raman](https://static.documents.pub/doc/80x56/5f085ceb7e708231d421a36e/final-report-integrated-automated-analyzer-for-monitoring-of-2014-09-02-analysis.jpg)


![Integrated Automated Analyzer for Monitoring of Explosives in … · 2004-01-09 · analysis of explosives, including gas [2], liquid [3-5], thin-layer chromatographies [6], Raman](https://static.documents.pub/doc/80x56/5f085ceb7e708231d421a36c/integrated-automated-analyzer-for-monitoring-of-explosives-in-2004-01-09-analysis.jpg)
