Page 1
Proceedings World Geothermal Congress 2015
Melbourne, Australia, 19-25 April 2015
1
Demonstration of New Geophysical Methods for Geothermal Exploration - the Technology
Explained
Helen Gibson1, Ben Delwiche
2, Des FitzGerald
1, Scott Wieberg
3, John Mims
3 and Paolo Berardelli
4
1 Intrepid Geophysics, Suite 110, 3 Male Street, Brighton, Victoria, 3186, Australia
2 Ormat Technologies Inc., 6225 Neil Road, Reno, Nevada, NV 89511, United States
3 Bell Geospace, Suite 325, 400 North Sam Houston Parkway East, Houston, TX 77060, United States
4 Geotech Ltd., 245 Industrial Pkwy N, Aurora, ON L4G 3W2, Canada
[email protected]
Keywords: ZTEM, FTG, Magnetics, geothermal exploration, 3D subsurface geology, geological ambiguity
ABSTRACT
This paper describes a Geothermal Technology Advancement Project now underway, funded by the US Department of Energy
(DE-FOA-0000522). The project advances the combined use of airborne geophysical technologies: Full tensor gradiometry (FTG)
and ZTEM deep penetrating, low frequency, passive electromagnetic exploration system, set up on a combined survey acquisition
platform. The combined system is currently being tested for geothermal exploration. ZTEM alone has previously been used in
geothermal case studies, for example, in the Reese River region of central Nevada (Legault et al., 2010). FTG has also shown
promising results as a viable tool for geothermal exploration in modelling studies in the Great Basin, central Nevada (Mataragio,
2012), and in the Salton Sea, southern California (Kohrn et al., 2011). FTG data is not currently acquired routinely for geothermal
applications but this Project will highlight the benefits and advantages of its incorporation.
The strengths of the key technologies which will be combined (FTG, ZTEM and Magnetics) lie in the ability to provide detailed
subsurface geologic mapping by an aerial method. Such regional-scale integrated surveys for geothermal exploration will provide a
better picture of the geologic framework of an area from which more focused exploration for prospective areas would be possible –
Best practise will be the establishment of an interpretation toolkit aimed at reducing geological ambiguity to a much greater degree
than was possible based on data from just any one of the geophysical methods alone. In particular, imagining of near vertical faults
using FTG, resistive/conductive layers from ZTEM and depths from Magnetics.
1. INTRODUCTION
Key to the project is the establishment of interpretation methods for characterizing unique geological expressions of a known
geothermal system and thus providing a toolkit for more rapid identification of “greenfield’ geothermal systems.
The project objectives are fourfold:
a) Combine airborne the FTG, ZTEM and conventional Magnetometer systems onto one platform for simultaneous
acquisition,
b) Test the applicability of each of these technologies for geothermal exploration over a known geothermal deposit
(McGinness Hills, Lander County, Nevada),
c) Acquire test surveys over a more “greenfield” area, on the provision that initial tests successfully demonstrate the
usefulness of the combined technologies, and
d) Use new ZTEM, FTG and Magnetic data (all acquired simultaneously) to perform an integrated interpretation,
including 3D geological modelling and geophysical inversion, to determine whether or not an interpretation of the
combined data reduces geothermal exploration risk and geological uncertainty, compared to the use of any one of the
technologies alone.
2. THE TECHNOLOGIES
2.1 Full Tensor Gradiometry (FTG)
The Rotating Accelerometer Gravity-Gradiometer is an instrument which employs two pairs of opposing accelerometers mounted
orthogonally on a continuously rotating plate (Figure 1). In the gravity-gradiometer now employed commercially by Bell Geospace,
there are three assemblies of four rotating accelerometers (GGIs) mounted on a single gyro stabilized assembly (6 pairs of
accelerometers). This arrangement provides for continuous measurement of all five independent gravity-gradient tensor elements in
a 3D gravity field.
Optimum quality survey data is acquired from a flying platform which is low, slow and with lots of inertia. Air turbulence is a
major factor contributing to noise. In this regard, the six degrees of freedom contributing to the noise in the full tensor gravity
gradients are: roll, yaw and pitch (Figure 2 right) plus forward, side and up/down directions.
Experience with this signal in terms of leveling, gridding, grid filtering and interpretation (Figure 2 left) has been gained over more
than 10 years of onshore FTG surveys over rifts and other complex geological settings. Careful processing yields high resolution
results and insights into the causative geology. Furthermore, full tensor gravity gradiometry has been proven to work in a highly
complementary sense with magnetic data.
Page 2
Gibson et al.
2
Figure 1: The Air FTG gravity-gradiometer instrument (Rotating Multi-Accelerometer Moving Platform).
Along with development of potential field full tensor instrumentation, new methods have been developed to denoise and process
these curvature gradients. Traditional Fourier Domain and Minimum Squares least squares residual of the linear differential
relationships have been adapted. This has led to innovations in levelling, gridding and grid filtering (Figure 2). An outcome of
advancements in these geophysical methods has been the ability to form a Full Tensor Grid representation of curvature gradients
that is coherent and compliant with the measured physics at all points in the grid. All of the observed data is thus honored by a
Tensor grid. This then enables innovations using all of the measured signal for the project, in a spatial context.
Figure 2: Left: list of considerations for forming Full Tensor Grids. Right: Three of the rotational degrees of freedom for
consideration when processing FTG measurements.
2.2 ZTEM System
The ZTEM system uses naturally occurring AFMAG magnetotelluric fields as the source of the primary fields, and therefore
requires no transmitter (Ward, 1959), only an airborne receiver and base station receiver (Figure 3). The fields resemble those from
VLF except that they are lower frequency (tens & hundreds of Hz versus tens of kHz) and are not strongly directionally polarized
(Labson et al., 1985). These AFMAG EM fields, derived from world-wide atmospheric thunderstorm activity, have the unique
characteristic of being uniform, planar and horizontal, and also propagate vertically into the earth – to great depth, up to several km,
as determined by the magnetotelluric (MT) skin depth, which is directly proportional to the ratio of the bedrock resistivity to the
frequency. At the frequencies used for ZTEM, the MT skin depths likely range between approx. 460m to 1.6km for the region of
interest in central Nevada, according to the following equation for skin depth (Vozoff, 1972):
δs = 503 * √(ρA / ƒ) metres
If ρA = 300 ohm-m, δs ≈ 460m at 360Hz and ~1.6km at 30Hz
The other unique aspect of AFMAG fields is that they react to relative contrasts in the resistivity, and therefore do not depend on
the absolute conductance, as measured using inductive EM systems, such as VTEM – hence poorly conductive targets, such as
alteration zones and fault zones, can be mapped, as well as higher conductance features, like graphitic units. Conversely, resistive
targets can also be mapped using AFMAG – provided they are of a sufficient size and contrast to produce a vertical field anomaly.
Indeed resistors produce reversed anomalies relative to conductive features.
Page 3
Gibson et al.
3
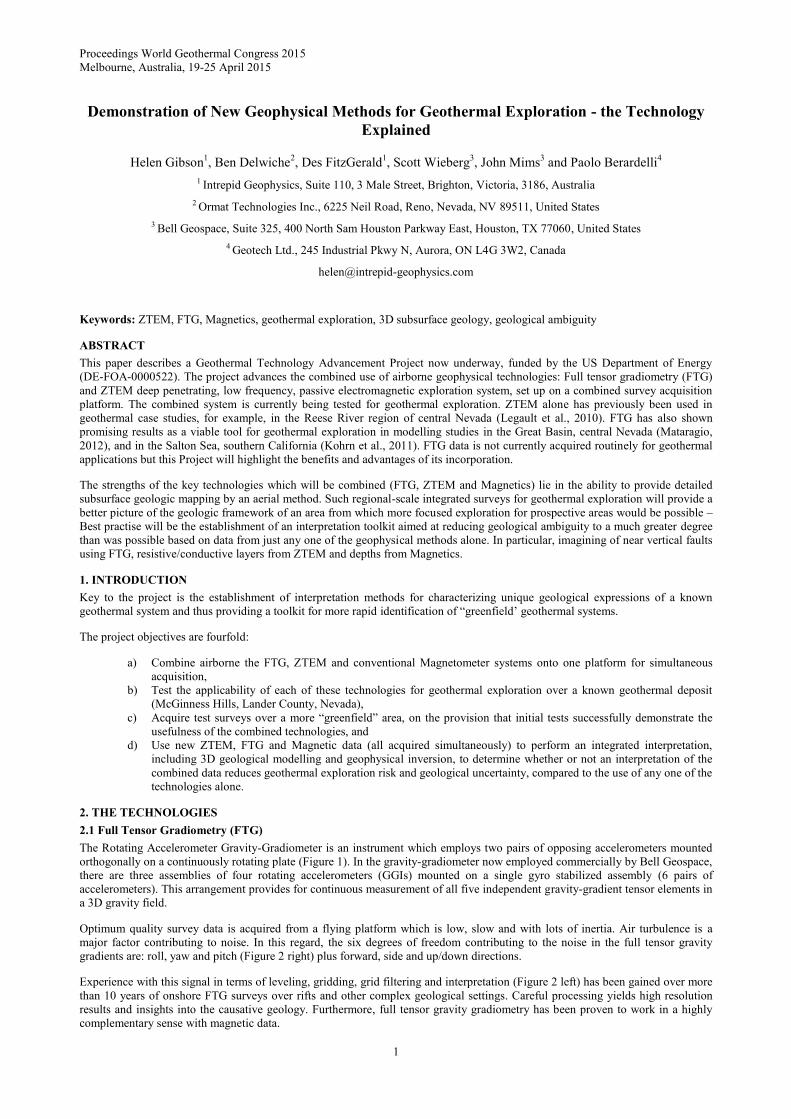
Figure 3: A) FTG-ZTEM-MAG system in flight, showing the newly designed sled (ZTEM) receiver and magnetic sensor
(FTG system is within the plane); B) Hx-Hy base station receiver is located at a remote site adjacent to the survey.
3. MCGINNESS HILLS GEOTHERMAL PROJECT, LANDER COUNTY, NEVADA
3.1 Introduction
At the time of writing this paper, the planned simultaneous acquisition of FTG, ZTEM and Mag over the Project’s chosen ‘known’
geothermal deposit at McGinness Hills, Nevada – had been delayed. Therefore the incomplete reportable work to date includes:
A preliminary 3D geology model of the McGinness Hills geothermal project in readiness for facilitating and integrating
the geophysical interpretations.
An FTG survey over the the McGinness Hills acquired without ZTEM or Mag.
The 3D model is based on geological data from nine drill holes, surface mapping, two regional cross-sections, and the digital terrain
model (from SRTM). The model extents (x,y,z) are: 13.2km x 14.1 km x 3.5km, viewed in two different modes: i) the fault-
network and ii) the sold geology are shown below in Figure 4.
3.2 Overview of the known geological and structural setting of the McGinness Hills (after Delwiche B., 2012).
The McGinness Hills geothermal project is situated within the central Basin and Range physiographic province and along low-lying
hills near the eastern flank of the Toiyabe Range. The Toiyabe Range consists of Paleozoic marine strata cut by complex thrust
faults related to the Antler orogeny. Jurassic plutons intrude the Paleozoic rocks, and Tertiary volcanic rocks mantle and intrude
older strata. The Toiyabe Range is a gently west tilted northnortheast trending block-faulted mountain that is bounded by Late
Pliocene to Early Miocene north-northeast-striking normal faults (Stewart and McKee, 1968). Major north-northeast, northwest,
and east-northeast striking faults intersect within the McGinness Hills project area and are related to the active geothermal system.
The primary structural features of the McGinness Hills area are normal-oblique faults associated with Tertiary Basin and Range
extension. These include northwest-striking faults that are locally re-activated dextral-normal faults cut by younger modern north-
northeast-striking normal-sinistral faults. Also locally present, east-northeast-striking faults cut northwest-striking faults and appear
to be contemporaneous with the north-northeast-striking faults. The northwest-striking faults appear to be antithetic and dip steeply
southwest and northeast to form an early northwest trending graben structure centered on the geothermal field.
North-northeast-striking faults locally dip antithetically east-southeast and west-northwest from 48° to 85° and accommodate
primarily normal displacements with throws estimated between 100 to 300 m. They also appear to accommodate some minor left
lateral offsets with offsets estimated between ~30 to 50 m. The geothermal reservoir has been demonstrated to associate with the
sub-group of north-northeast-striking faults that dip west-northwest, and thermal fluid upflows may be located along these fractured
conduits at their intersection with northwest and east-northeast striking faults where relatively high density of fractures and
permeability are thought to exist.
Combined, the north-northeast-striking faults form a north-northeast trending graben again within the central part of the geothermal
field, which overprints the younger (mid-Oligocene) northwest trending graben described above. Furthermore, drilling and
geophysical data suggest that the west-northwest dipping faults are in the hanging wall of, and truncated at depth by, east-southeast
dipping piedmont faults, and that these fault intersections are estimated to occur at depths between 1000 and 3000 m within the
geothermal field.
The geothermal resource therefore likely originates from a deeper source along the east-southeast dipping faults and thermal fluids
preferentially upflow along the hanging wall west-northwest dipping faults.
Page 4
Gibson et al.
4
Figure 4: Left: Fault network and drill holes of the preliminary McGinness Hills 3D model Right: Solid geology of the
model, with simplified stratigraphic pile. Views are oblique, from the south-east. Vertical exaggeration 2:1.
3.3 Preliminary Gravity Gradient acquisition/processing (FTG)
Two sorties have been conducted over the McGinness Hills geothermal project site with the new airborne configuration (Figure 3),
as part of the initial proving/testing of the new geophysical acquisition system. This is quite novel and required the design of a
winching system, ZTEM sled, and sound aeronautical design considerations so the pilots have good control. While the aircraft was
on site, one FTG survey was flown minus the ZTEM.
Figure 5 below (left-side) shows the integrated tensor signal (FitzGerald et al, 2009), where the estimated vertical component of
gravity is computed from the tensor, before the terrain correction. As with all gradiometry data, the initial Free Air signal is
dominated (approximately 80%), by the terrain effects. The image on the right-side (Figure 5) shows the multi-scale edge detection
or “worms”. This second image reflects the dominant topography effects still in the unreduced data. (Note the worm-linears are not
depth-corrected, and are simply shown altogether, in a 2D birds-eye view.)
Figure 5: Vertical Component of Gravity. Left: This is the integrated Free Air Gravity gradient tensor. Right: Image of the
multi-scale edge detection, or “worms” that mostly reflect the terrain, prior to the terrain correction being applied.
McGinness Hills Geothermal Project - Preliminary 3D model
Page 5
Gibson et al.
5
No attempt has been made yet to find the dip/strike of the known faults from the FTG dataset. It is usual to use the Free Air FTG
data in 3D modelling, as the terrain forms part of what is modelled, once a true 3D approach is adopted.
4. EXPLORATION AND INTERPRETATION CONCEPTS
In analysing the key features of known geothermal resources (including but not limited to the McGinness Hills), we focus on what
characterises a geothermal resource, and what are the key challenges in their successful and efficiently executed exploration.
In a pre-geophysical survey stage, qualifying aspects of a potential geothermal resource may include any combination of the
following:
a) Presence of surficial geothermal features,
b) Existence and favorable distribution of indicator fluid, gas, or soil chemistries,
c) Recent indicator geothermal mineralization
d) Favorable active structural framework
e) Favorable volcanic setting,
f) Favorable reservoir rock-type(s), and
g) Any drilling data that correlate any of the above.
Key challenges for consideration when planning a geophysical survey of a pre-qualified potential geothermal resource using an
appropriately selected combination of geophysical technologies (we suggest FTG, ZTEM and Magnetics):
1) Ability to resolve geological and structural features undercover, to considerable depths.
2) Presence of steep, sub-vertical structures.
3) Existence and favorable distribution of very low resistivity values (possibly 2-4 Ohm-m or less) which may correlate
with clays and brine fluids located above or lateral to a deeper body of relatively higher resistivity (possibly >6 Ohm-m)
that may correlate with competent reservoir rock.
4) Existence and favorable distribution of low magnetic values which may also correlate with a distribution of alterations
related to outflowing/mixing/boiling/condensing geothermal fluids and gases associated with a geothermal system.
5) Presence of clay caps and ability to map these in 3D.
These five key challenges are now addressed below.
5. MEETING THE KEY CHALLENGES THROUGH NEW INTERPRETATION TECHNOLOGIES INCLUDING 2D/3D
MODELLING AND INVERSION USING DATA FROM FTG, ZTEM AND MAGNETICS
5.1 Ability to resolve geological and structural features undercover, to considerable depths
The challenge in blind geothermal exploration is having the ability to resolve geology and structure down to maximum depths of
approximately 3000 m, as guided by our known case study of the McGinness Hills geothermal prospect, where the zone of
intersection of the west-northwest with east-southeast faults occurs at depths between 1000 and 3000m.
Together the three selected geophysical technologies meet this requirement, but separately they meet them only to varying degrees.
The ZTEM system is estimated (by use of the skin depth equations) to provide good resolution in the depth range of 500 to 1600m
when applied in central Nevada. Magnetics will provide highest resolution in the shallow sources, at depths less than approximately
1000 m. FTG provides resolution down to almost 3000m in this region of Nevada.
5.2 Presence of steep, sub-vertical structures
Innovative processing of gravity gradient data for elucidation of near sub-vertical planar faults has been demonstrated with FTG
data from the Crescent Valley, Nevada (FitzGerald and Holstein, 2014a; FitzGerald and Holstein, 2014b; Mataragio, 2012). This
new interpretation technology takes the Full Tensor Grid and performs a deterministic inversion of the Eigen System. The solution
is a point dataset of strike vectors (the colored vectors in Figure 6 left) which are returned in clear zones where just the signal from
a nearby fault is present, and that signal is strong and planar (for example, the vectors highlighted by the red oval in Figure 6, left).
This cluster of vectors is then realised as a high-reliability set from which to achieve a good estimate of the orientation of the
nearby source fault, which is the north-east trending fault indicated by the worming trace in white (highlighted by white arrows
each-end in Figure 6 left). Good dip and strike estimates where achieved for this fault from the highlighted cluster of vectors (see
Table 2 in FitzGerald and Holstein, 2014a). The new algorithm involves fitting the Gxz and Gxx components in a plot, as rotated
across a fault profile, to an ellipse by least squares. These are reported in SEG workshop documentation, 2014 (FitzGerald and
Holstein, 2014a).
5.3 Existence and favorable distribution of very low resistivity values (possibly 2-4 Ohm-m or less)
Inversion of ZTEM data will detect distributions of low resistivity sources, for example as demonstrated in 2D over the Reese River
Geothermal Test area (Figure 7, after Legault et al, 2010). The issue however is to prove the correlation with clays and brine fluids
of a geothermal system in the face of non-unique causative geology. That is, a distribution of low resistivity may instead correlate
with primary sedimentary clays (argillite), evaporate deposits, or graphite-rich sediments.
Confidence that the former ‘geothermal system’ interpretation is true rather than the alternatives, may come from coincidence with
the low resistivity zone being located above or lateral to a deeper body of relatively higher resistivity (possibly >6 Ohm-m) that
may correlate with higher-grade competent reservoir rock (Figure 7). However, other evidence from the pre-geophysical survey
stages above, based on surface mapping or drilling may also help corroborate favorable evidence.
Page 6
Gibson et al.
6
Figure 6 after FitzGerald and Holstein, 2014a: FTG data from Montezuma-Vasquir gold and geothermal prospect,
Crescent Valley, Nevada. Left: Vertical gravity greyscale, 3 levels of upward continued multi-scale edge picks or
‘worms’ (Hornby et al 1999), and the full tensor Eigen system derived strike vectors, showing the zones where a 2D
signal character dominates the observed signal. Right: Gridded tensor data with a phase enhancement derived from
rotating each tensor to solve the Eigen system (hence like an AGC filter). The NE cross-cutting fault and the N20W
rift bounding faults are clear.
Figure 7 after Legault et al., 2010: ZTEM data from Reese River Geothermal Test area, central Nevada. 2D Inversion of
ZTEM data on Line 1000.
5.4 Existence and favorable distribution of low magnetic values
Magnetic surveys can detect, among other things, distributions of relatively low magnetic susceptibility sources, which when
coincident with a low resistivity signal may favorably suggest a geological interpretation in terms of alteration mineralogy related
to outflowing/mixing/boiling/condensing geothermal fluids and gases associated with a geothermal system.
Page 7
Gibson et al.
7
Again however, caution is required due to possible non-unique geological interpretations. Conversely, a low magnetic signature
might instead correspond with i) any nonmagnetic rock-type such as most fine sediments, mature sandstones, or metamorphic
rocks, ii) rocks deposited during a reversed polar chron, or iii) correspond with some fossil alteration event. Again evidence from
the pre-geophysical survey stages above, based on surface mapping or drilling together with other geophysical data and methods
may be required to corroborate evidence, and reduce the geological ambiguity of the interpretation.
The additional message here is that if no significant resistive or magnetic lows are detected, then the technology probably indicates
a lack of geothermal prospectivity. In itself, this can be a clear and useful exploration outcome. Early and decisive elimination of
non-prospective geothermal areas saves time, reduces risk, and hence reduces the cost of exploration.
5.5 Presence of clay caps and ability to map these in 3D
Dense clay caps integral to geothermal resources are usually a density anomaly. These geological elements are present within the
McGuinness geothermal prospect where FTG is expected to be able to resolve the edges and volumes of these units.
Kohrn et al., 2011 discusses the delineation of dense clay caps in the Salton Sea, southern California, using gravity gradiometry.
This aspect is also very helpful in the early stages of geothermal prospecting.
6. CULMINATION OF THE 3D MODEL AND ADVANCES IN 3D MESH OUTPUTS
A final 3D geological and structural model can be derived from synthesis of all available datasets including innovative processing
of FTG, ZTEM inversion, and the magnetics. At this point, ambiguities and poor resolutions will likely still persist in the model,
and these should be assessed qualitatively or quantitatively. Quantitative assessment can be achieved by performing a litho-
constrained stochastic inversion of the joint geophysical data sets (e.g., Lane et al, 2009). Outcomes of this method of geophysical
inversion can be expressed in terms of probabilities of finding certain geological units. Either way, the geothermal explorationist
will have a good basis, from integrated geology and innovative geophysics, on which to make informed decisions about directions
of further exploration. The ultimate goal of a reliable 3D model includes the ability to select exploration drill targets.
Shown below are synthetic examples of structural and solid geology models (Figure 8). These views demonstrate a new
interpretation technology using CGAL libraries which enable creation of adaptive size meshes, which ideally suit the shape of any
geological or fault surface using well-formed triangles. These high fidelity meshes, ready for flow simulation in finite elements
codes, are the end product of a 3D geology and structural model which can be built from the combined results from FTG, ZTEM,
magnetics together with primary geological knowledge from mapping and any drilling.
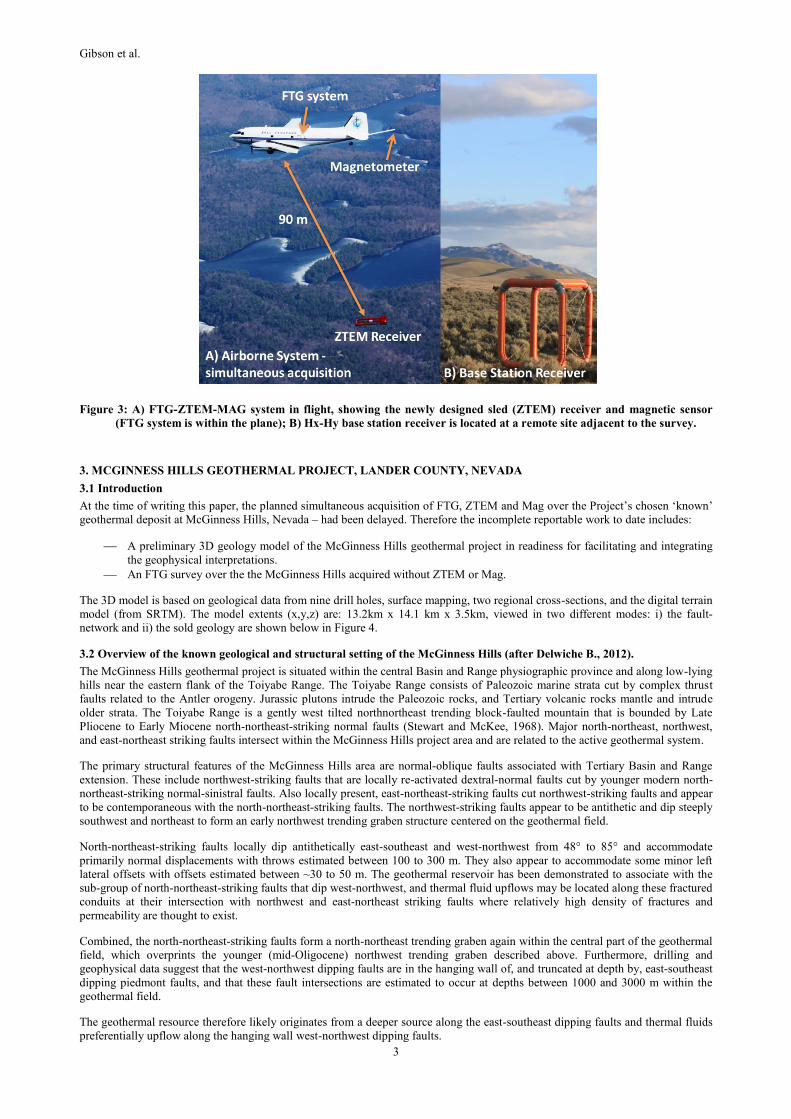
Figure 8: Left: Synthetic model fault network Right: Synthetic model solid geology. These views demonstrate a new
interpretation technology using CGAL libraries which enable creation of high-fidelity, adaptive meshes which are
ready for finite elements flow modelling codes.
7. CONCLUSIONS
Simultaneously acquired FTG, ZTEM, magnetics, and related advances in interpretation technologies (processing, inversion and
modelling) are together expected to meet the key challenges of geothermal resource evaluation in pre-qualified prospects.
This expectation is partially proven by preliminary work, but requires the completion of a Geothermal Technology Advancement
Project now underway (at the time of writing), funded by the US Department of Energy (DE-FOA-0000522) – after which we
expect to realise a significantly better interpretation tool kit for geothermal exploration, than was previously possible.
Integrated interpretations of simultaneously acquired FTG, ZTEM, and magnetics, together with primary geological knowledge
from surface mapping, and any available drilling, can reliably constrain geological and structural models for early assessment of
geothermal prospect analysis. The goal of building a realistic 3D model includes the ability to select exploration drilling targets.
Alternatively, modelling provides the tools for early elimination of non-prospective geothermal zones, saving time, and reducing
the risks and costs of deep drilling and further exploration.
Additional advantages of building a realistic 3D model of a geothermal resource includes the ability to simulate flow using a
derived high-fidelity adaptive mesh – another advanced technology which is now available.
Page 8
Gibson et al.
8
REFERENCES
Delwiche, B.: Geologic report on the McGinness Hills geothermal unit application for a participating area Lander County, Nevada.
Submitted by Ormat Nevada Inc., Reno, Nevada to U.S. Bureau of Land Management. (January 2012).
FitzGerald, D.J. and Holstein, H.: Practical demonstrations of inversion of gravity gradient data for a 2D fault. In prep. 2014 SEG
Workshop (2014a).
FitzGerald, D.J. and Holstein, H: Structural geology observations derived from full tensor gravity gradiometry over rift systems.
Accepted. Proceedings SEG (2014b).
FitzGerald, D.J., Argast, D., and Holstein, H.: Further developments with Full Tensor Gradiometry Datasets. Extended Abstracts,
20th ASEG International Geophysical Conference and Exhibition, Australian Society of Exploration Geophysicists, (2009).
Hornby, P., Boschetti, F. and Horowitz, F.G.: Analysis of potential field data in the wavelet domain: Geophysical Journal
International, 137, 175-196 (1999).
Kohrn, B., Bonet, C., DiFrancesco, D., and Gibson, H.: Geothermal Exploration Using Gravity Gradiometry – a Salton Sea
Example. Geothermal Resources Council Transactions Volume 35. GRC Annual Meeting (2011).
Labson, V.F., Becker, A., Morrison, H.F., and Conti, U.: Geophysical exploration with audio frequency natural magnetic fields,
Geophysics, 50, 656-664 (1985).
Lane, R., McInerney, P. and Seikel, R.: Using a 3D geological mapping framework to integrate AEM, Gravity and Magnetic
Modelling – San Nicolas Case History. Extended Abstracts, 20th ASEG International Geophysical Conference and Exhibition,
Australian Society of Exploration Geophysicists, (2009).
Legault, J.M., Witter, J.B., Berardelli, P. and Orta, M.: ZTEM airborne AFMAG EM results over the Reese River geothermal test
area, central Nevada. Extended Abstracts, 21st ASEG International Geophysical Conference and Exhibition, Australian
Society of Exploration Geophysicists, (2010).
Mataragio, J.: Exploring for gold and Geothermal Systems in the Great Basin Using Full Tensor Gravity Gradiometry.GRC
Transactions, Vol. 36, (2012).
Stewart, J.H., and McKee, E.H.: Geologic map of the Mount Callaghan quadrangle, Lander County, Nevada: U.S. Geological
Survey Geologic Quadrangle Map GQ-730, (1968).
Vozoff, K.: The magnetotelluric method in the exploration of sedimentary basins. Geophysics 37:98–141, (1972).
Ward, S.H.: AFMAG - Airborne and Ground: Geophysics, 24, 761-787, (1959).