Demonstration to Integrate Care for Dual Eligible Individuals Updated Rate Report May 15, 2013 1 MassHealth, in conjunction with the Centers for Medicare and Medicaid Services (CMS), is releasing updated CY2013 rates for the Massachusetts Demonstration to Integrate Care for Dual Eligible Individuals. The updates included in this document are specific to: Medicare county baselines (including related to wage index repricing and bad debt adjustments); the MassHealth component of the capitation rate (updated to reflect the new enrollment timeline and a small administrative cost adjustment); coding intensity adjustment; savings percentages; risk corridors; and the impact of sequestration. The MassHealth component of the rates is subject to final review and approval by CMS. The general principles of the rate development process for the Demonstration have been outlined in the Memorandum of Understanding (MOU) between CMS and the Commonwealth of Massachusetts. Included in this report are final Medicare county base rates, information supporting the estimation of risk adjusted Medicare components of the rate, details related to the development of the MassHealth component of the rate, and some information supplemental to the July 2012 MassHealth Data Book to support comparisons of projected spending on the target population to the rates. I. Components of the Capitation Rate CMS and MassHealth will each contribute to the global capitation payment. CMS and MassHealth will each make monthly payments to ICOs for their components of the capitated rate. ICOs will receive three monthly payments for each enrollee: one amount from CMS reflecting coverage of Medicare Parts A/B services, one amount from CMS reflecting coverage of Medicare Part D services, and a third amount from MassHealth reflecting coverage of Medicaid services. The Medicare Parts A/B payment will be risk adjusted using the Medicare Advantage CMS- HCC Model. The Medicare Part D payment will be risk adjusted using the Part D RxHCC Model. MassHealth’s methodology assigns each enrollee to a rating category (RC) according to the individual enrollee’s clinical status and setting of care, for the purposes of risk adjusting the MassHealth payment. Section II of this report provides information on the MassHealth component of the capitation rate. Section III includes details related to the Medicare Parts A/B and Medicare Part D components of the rate.
Transcript
Demonstration to Integrate Care for Dual Eligible Individuals Updated Rate Report
May 15, 2013
1
MassHealth, in conjunction with the Centers for Medicare and Medicaid Services (CMS), is releasing updated CY2013 rates for the Massachusetts Demonstration to Integrate Care for Dual Eligible Individuals. The updates included in this document are specific to: Medicare county baselines (including related to wage index repricing and bad debt adjustments); the MassHealth component of the capitation rate (updated to reflect the new enrollment timeline and a small administrative cost adjustment); coding intensity adjustment; savings percentages; risk corridors; and the impact of sequestration. The MassHealth component of the rates is subject to final review and approval by CMS. The general principles of the rate development process for the Demonstration have been outlined in the Memorandum of Understanding (MOU) between CMS and the Commonwealth of Massachusetts. Included in this report are final Medicare county base rates, information supporting the estimation of risk adjusted Medicare components of the rate, details related to the development of the MassHealth component of the rate, and some information supplemental to the July 2012 MassHealth Data Book to support comparisons of projected spending on the target population to the rates.
I. Components of the Capitation Rate CMS and MassHealth will each contribute to the global capitation payment. CMS and MassHealth will each make monthly payments to ICOs for their components of the capitated rate. ICOs will receive three monthly payments for each enrollee: one amount from CMS reflecting coverage of Medicare Parts A/B services, one amount from CMS reflecting coverage of Medicare Part D services, and a third amount from MassHealth reflecting coverage of Medicaid services. The Medicare Parts A/B payment will be risk adjusted using the Medicare Advantage CMS-HCC Model. The Medicare Part D payment will be risk adjusted using the Part D RxHCC Model. MassHealth’s methodology assigns each enrollee to a rating category (RC) according to the individual enrollee’s clinical status and setting of care, for the purposes of risk adjusting the MassHealth payment. Section II of this report provides information on the MassHealth component of the capitation rate. Section III includes details related to the Medicare Parts A/B and Medicare Part D components of the rate.
Demonstration to Integrate Care for Dual Eligible Individuals Updated Rate Report
May 15, 2013
2
II. MassHealth Component of the Rate
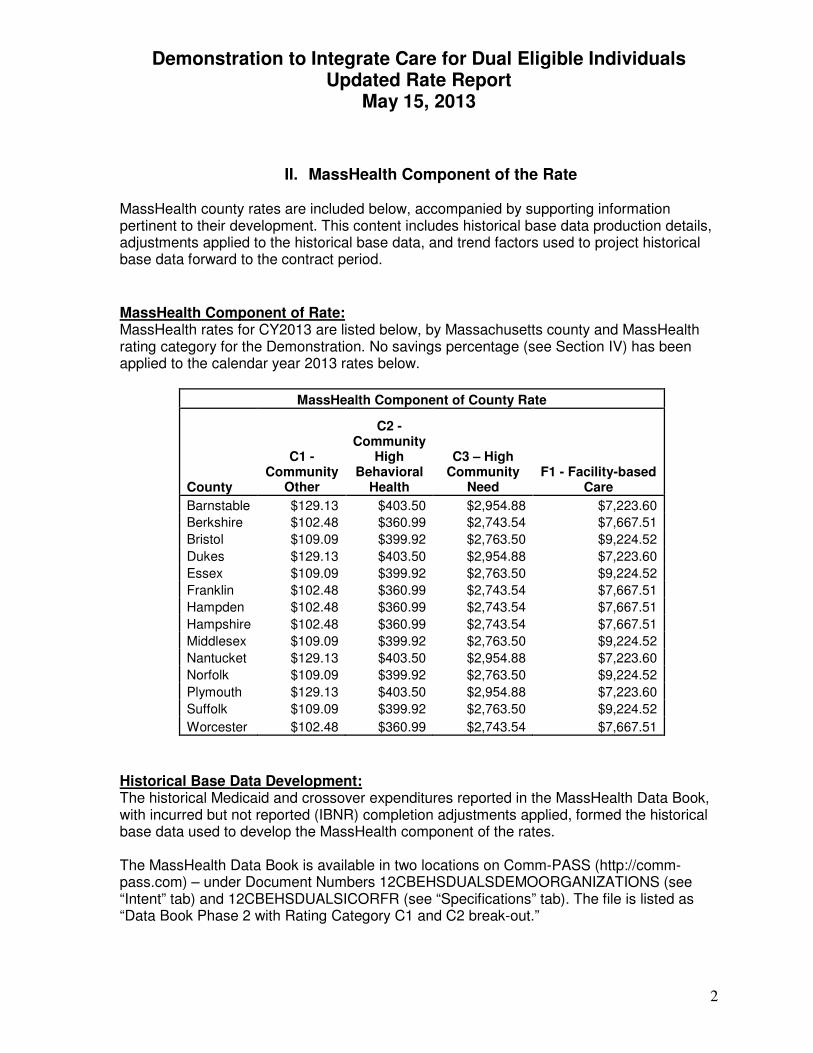
MassHealth county rates are included below, accompanied by supporting information pertinent to their development. This content includes historical base data production details, adjustments applied to the historical base data, and trend factors used to project historical base data forward to the contract period. MassHealth Component of Rate: MassHealth rates for CY2013 are listed below, by Massachusetts county and MassHealth rating category for the Demonstration. No savings percentage (see Section IV) has been applied to the calendar year 2013 rates below.
MassHealth Component of County Rate
County
C1 - Community
Other
C2 - Community
High Behavioral
Health
C3 – High Community
Need F1 - Facility-based
Care
Barnstable $129.13 $403.50 $2,954.88 $7,223.60
Berkshire $102.48 $360.99 $2,743.54 $7,667.51
Bristol $109.09 $399.92 $2,763.50 $9,224.52
Dukes $129.13 $403.50 $2,954.88 $7,223.60
Essex $109.09 $399.92 $2,763.50 $9,224.52
Franklin $102.48 $360.99 $2,743.54 $7,667.51
Hampden $102.48 $360.99 $2,743.54 $7,667.51
Hampshire $102.48 $360.99 $2,743.54 $7,667.51
Middlesex $109.09 $399.92 $2,763.50 $9,224.52
Nantucket $129.13 $403.50 $2,954.88 $7,223.60
Norfolk $109.09 $399.92 $2,763.50 $9,224.52
Plymouth $129.13 $403.50 $2,954.88 $7,223.60
Suffolk $109.09 $399.92 $2,763.50 $9,224.52
Worcester $102.48 $360.99 $2,743.54 $7,667.51
Historical Base Data Development: The historical Medicaid and crossover expenditures reported in the MassHealth Data Book, with incurred but not reported (IBNR) completion adjustments applied, formed the historical base data used to develop the MassHealth component of the rates. The MassHealth Data Book is available in two locations on Comm-PASS (http://comm-pass.com) – under Document Numbers 12CBEHSDUALSDEMOORGANIZATIONS (see “Intent” tab) and 12CBEHSDUALSICORFR (see “Specifications” tab). The file is listed as “Data Book Phase 2 with Rating Category C1 and C2 break-out.”
Demonstration to Integrate Care for Dual Eligible Individuals Updated Rate Report
May 15, 2013
3
The historical base data can be created by taking Medicaid and crossover expenditures reported in the MassHealth Data Book, using the mapping provided below to map Data Book categories of service to rate development categories of service, mapping counties to geographic regions, and applying the completion factors also included below. For convenience, per member per month (PMPM) expenditures with IBNR are provided at the end of this report in Section VII for Medicare, Medicaid and crossover claims by calendar year, region, rating category and category of service. Category of Service Mapping: The following is a category of service mapping between the services reflected in the MassHealth Data Book and the service categories used in the rate development process. Descriptions of the MassHealth Data Book categories of service can be found within the MassHealth Data Book in the “Medicaid COS” tab for Medicaid claims, and in the “Medicare COS” tab for the crossover claims. Medicaid Claims:
Rate Development Category of Service
MassHealth DataBook Medicaid Claim
Category of Service
Inpatient – Non-MH/SA IP – Non-Behavioral Health
Inpatient MH/SA IP – Behavioral Health
Hospital Outpatient Hospital Outpatient
Outpatient MH/SA Outpatient BH
Professional Professional
HCBS/Home Health Community LTSS
LTC Facility LTC
Pharmacy (Non-Part D) Non-Part D Pharmacy
DME and Supplies DME and Supplies
Transportation Transportation
All Other Other Services
Demonstration to Integrate Care for Dual Eligible Individuals Updated Rate Report
May 15, 2013
4
Crossover Claims:
Rate Development Category of Service
MassHealth DataBook Crossover Claim
Category of Service
Inpatient – Non-MH/SA IP – Non-Behavioral Health
Inpatient MH/SA IP - Mental Health
IP – Substance Abuse
IP – Substance Abuse/ IP - Mental Health
Hospital Outpatient HOP – ER / Urgent Care
HOP - Lab / Rad
HOP – Other
HOP – Pharmacy
HOP – PT/OT/ST
Outpatient MH/SA HOP - Behavioral Health
Prof – Behavioral Health
Professional Prof – HIP Visits
Prof – Lab / Rad
Prof – OP Visits
Prof – Other
LTC Facility SNF
DME and Supplies DME and Supplies
Transportation Transportation
Demonstration to Integrate Care for Dual Eligible Individuals Updated Rate Report
May 15, 2013
5
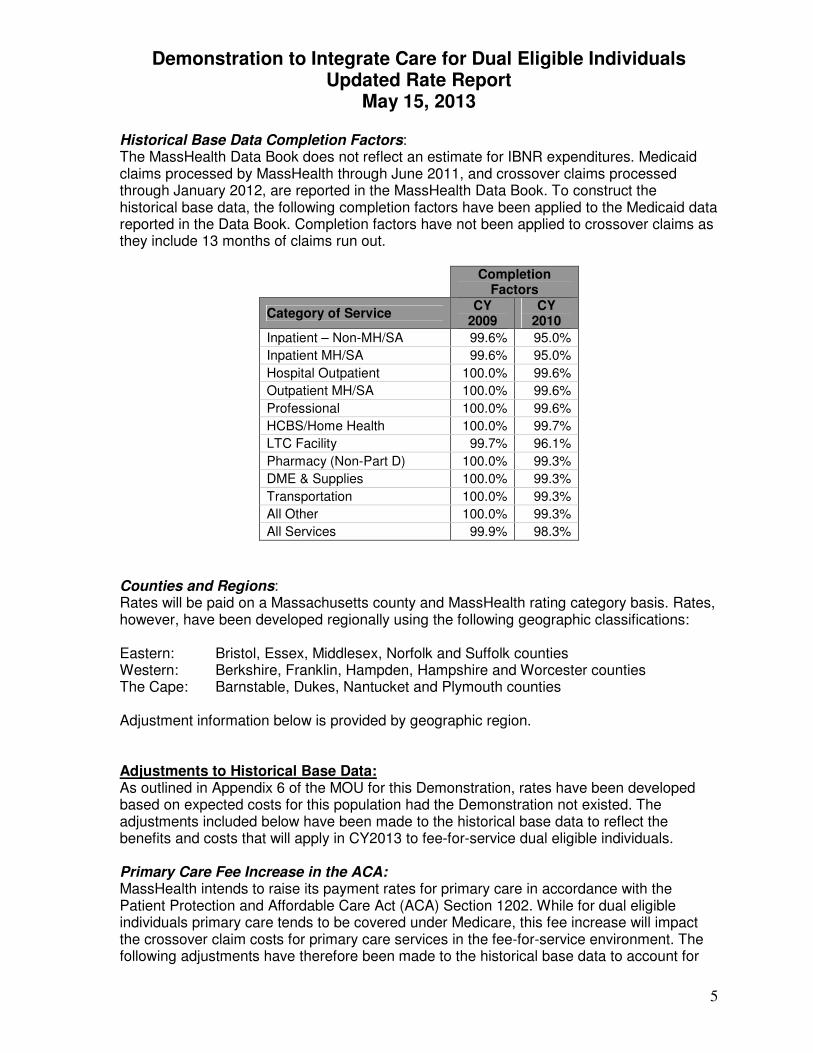
Historical Base Data Completion Factors: The MassHealth Data Book does not reflect an estimate for IBNR expenditures. Medicaid claims processed by MassHealth through June 2011, and crossover claims processed through January 2012, are reported in the MassHealth Data Book. To construct the historical base data, the following completion factors have been applied to the Medicaid data reported in the Data Book. Completion factors have not been applied to crossover claims as they include 13 months of claims run out.
Completion
Factors
Category of Service CY
2009 CY
2010
Inpatient – Non-MH/SA 99.6% 95.0%
Inpatient MH/SA 99.6% 95.0%
Hospital Outpatient 100.0% 99.6%
Outpatient MH/SA 100.0% 99.6%
Professional 100.0% 99.6%
HCBS/Home Health 100.0% 99.7%
LTC Facility 99.7% 96.1%
Pharmacy (Non-Part D) 100.0% 99.3%
DME & Supplies 100.0% 99.3%
Transportation 100.0% 99.3%
All Other 100.0% 99.3%
All Services 99.9% 98.3%
Counties and Regions: Rates will be paid on a Massachusetts county and MassHealth rating category basis. Rates, however, have been developed regionally using the following geographic classifications: Eastern: Bristol, Essex, Middlesex, Norfolk and Suffolk counties Western: Berkshire, Franklin, Hampden, Hampshire and Worcester counties The Cape: Barnstable, Dukes, Nantucket and Plymouth counties Adjustment information below is provided by geographic region. Adjustments to Historical Base Data: As outlined in Appendix 6 of the MOU for this Demonstration, rates have been developed based on expected costs for this population had the Demonstration not existed. The adjustments included below have been made to the historical base data to reflect the benefits and costs that will apply in CY2013 to fee-for-service dual eligible individuals. Primary Care Fee Increase in the ACA: MassHealth intends to raise its payment rates for primary care in accordance with the Patient Protection and Affordable Care Act (ACA) Section 1202. While for dual eligible individuals primary care tends to be covered under Medicare, this fee increase will impact the crossover claim costs for primary care services in the fee-for-service environment. The following adjustments have therefore been made to the historical base data to account for
Demonstration to Integrate Care for Dual Eligible Individuals Updated Rate Report
May 15, 2013
6
these fee increases. The increase was computed based on crossover claims, but the final adjustments are percentages of, and have been applied to, both crossover and Medicaid only professional claims.
Adjustment: ACA 1202 Category of Service: Professional
Region C1 C2 C3 F1
Eastern 52.6% 45.1% 82.7% 132.9%
Western 50.7% 57.9% 94.8% 139.0%
The Cape 51.4% 58.3% 91.9% 114.8%
Medicaid Graduate Medical Education (GME) Expenses: Through September 2009, MassHealth included a GME component in its hospital rate development for certain hospitals. MassHealth no longer pays for GME. These expenses, however, have been included in the CY2009 Medicaid and crossover claim expenditures reported in the MassHealth Data Book, and accordingly, in the historical base data used to establish the MassHealth component of the rates. The adjustment factors applied to the historical base data to account for this are included below. These adjustment factors are based on, and have been applied to, both Medicaid only and crossover claims.
Adjustment: GME
Category of Service:
Inpatient - Non-MH/SA and Inpatient MH/SA
Region C1 C2 C3 F1
Eastern -2.3% -2.3% -0.6% 0.0%
Western -2.5% -2.5% -1.3% -0.1%
The Cape -0.8% -0.8% -0.3% -0.1%
Demonstration to Integrate Care for Dual Eligible Individuals Updated Rate Report
May 15, 2013
7
Home Health MassHealth Appeals: The MassHealth Data Book and historical base data include some home health service payments that have been subsequently appealed by MassHealth and billed to Medicare. Successful appeals are not adjusted in the MassHealth claims system due to the mechanism by which MassHealth processes such recoupments. Estimates of the annual recoveries achieved for these services result in the following adjustment factors which have been applied to both the Medicaid only and the crossover claims.
Adjustment: Home Health Category of Service: HCBS/Home Health
Region C1 C2 C3 F1
Eastern -0.4% -0.4% -0.4% -0.4%
Western -0.4% -0.4% -0.4% -0.4%
The Cape -0.4% -0.4% -0.4% -0.4%
Pharmacy Rebates: The MassHealth Data Book and historical base data do not reflect potential Federal Omnibus Budget Reconciliation Act (OBRA) rebates. The following adjustments have been applied to the historical Medicaid base data to reflect this rebate potential.
Adjustment: Rx Rebates Category of Service: Pharmacy (Non-Part D)
Region C1 C2 C3 F1
Eastern -5.8% -5.8% -5.8% -5.8%
Western -5.8% -5.8% -5.8% -5.8%
The Cape -5.8% -5.8% -5.8% -5.8%
Dental Benefit Changes: The MassHealth dental benefit for adults was reduced effective July 2010. The MassHealth Data Book and historical base data include costs associated with the full adult dental benefit in place during CY2009 and the first half of CY2010. Effective January 1, 2013, MassHealth restored composite fillings for front teeth to the adult dental benefit. The following adjustments have been applied to the historical base data to reflect the net effect of these benefit changes.
Adjustment: Dental Category of Service: All Other
Region C1 C2 C3 F1
Eastern -40.7% -39.8% -20.4% -13.3%
Western -37.6% -30.7% -14.8% -22.4%
The Cape -40.9% -40.8% -15.6% -18.4%
Demonstration to Integrate Care for Dual Eligible Individuals Updated Rate Report
May 15, 2013
8
Note that if the State Plan adult dental benefit is further restored as proposed in the Governor’s budget, necessary rate adjustments will be made as appropriate. Enrollee Contributions to Care: The MassHealth Data Book and historical base data reflect costs net of contributions to care or patient-paid amounts (PPA) paid by individuals in facilities. These costs have been included in rates through the adjustments displayed below, and enrollee contributions to care will be deducted from capitation payments on an individual enrollee basis. These adjustments are based on, and have been applied to, both Medicaid only and crossover claims.
Adjustment: Share of Cost Category of Service: LTC Facility
Region C1 C2 C3 F1
Eastern 1.8% 0.4% 5.7% 13.3%
Western 2.7% 0.7% 5.2% 12.4%
The Cape 0.8% 0.0% 5.1% 12.5%
Seasonality Adjustment for CY2013: The contract period for which rates have been developed is only 5 months from 8/1/2013 to 12/31/2013. To account for seasonality in service utilization, and the fact that enrollments will not begin until the second half of CY2013, a seasonality adjustment has been made to all service categories.
Adjustment: Seasonality Category of Service: All COS
Region C1 C2 C3 F1
Eastern 0.941 0.969 1.029 1.008
Western 0.941 0.969 1.029 1.008
The Cape 0.941 0.969 1.029 1.008
Medicaid Administrative Expenses: The Medicare standardized FFS county rates used to develop the Medicare A/B component of the capitation rate include a 0.27% adjustment for administrative costs associated with claims processing. A similar increase of 0.27% has been applied to the MassHealth component of the rate for 2013 to reflect the transfer of these costs from MassHealth to the ICOs. An administrative amount of $1.70 has been added to each county rate for each rating category.
Demonstration to Integrate Care for Dual Eligible Individuals Updated Rate Report
May 15, 2013
9
Trend Factors Applied to Adjusted Historical Base Data: The following trend factors have been applied to the adjusted historical base data through a contract year enrollment weighted midpoint of November 15, 2013. Trend factors do not vary geographically. C1 C2 C3 F1
Category of Service Crossover Medicaid Crossover Medicaid Crossover Medicaid Crossover Medicaid
All Other 2.60% 4.00% 2.60% 4.00% 2.80% 4.00% 2.80% 3.00%
Demonstration to Integrate Care for Dual Eligible Individuals Updated Rate Report
May 15, 2013
10
III. Final Medicare Components of the Rate
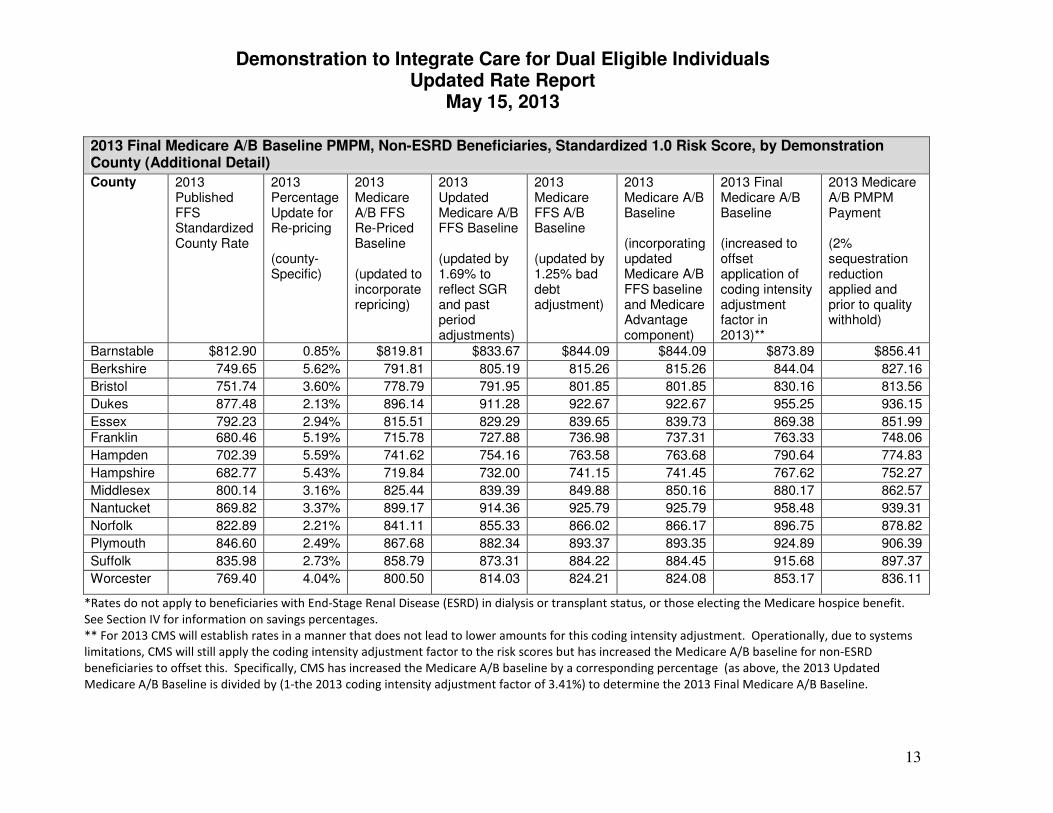
Medicare Component of Blended Rate Medicare A/B Services CMS has developed baseline spending (costs absent the Demonstration) for Medicare A and B services using estimates of what Medicare would have spent on behalf of the enrollees absent the Demonstration. With the exception of specific subsets of enrollees as noted below, the Medicare baseline for A/B services is a blend of the Medicare Fee-for-Service (FFS) Standardized County Rates and the Medicare Advantage projected payment rates for each year, weighted by the proportion of the target population that would otherwise be enrolled in each program in the absence of the Demonstration. The Medicare Advantage baseline spending includes costs that would have occurred absent the Demonstration, such as quality bonus payments for applicable Medicare Advantage plans. Both baseline spending and payment rates under the Demonstration for Medicare A/B services are calculated as PMPM standardized amounts for each Demonstration county. Except as otherwise noted, the Medicare A/B portion of the baseline will be updated annually consistent with the annual FFS estimates and benchmarks released each year with the annual rate announcement. Medicare A/B Component Payments: Final 2013 Medicare A/B Baseline County rates are provided below. These rates represent the weighted average of the 2013 FFS Standardized County Rates, updated to incorporate the adjustments noted below, and the Medicare Advantage projected payment rates for CY 2013 based on the expected enrollment of beneficiaries from Medicare FFS and Medicare Advantage in 2013 at the county level. The rates incorporate the assumption that at least 98% of enrollees in every county will come from Medicare FFS. The Medicare A/B component includes the following adjustments:
• The FFS component of the 2013 Medicare A/B baseline rates has been updated to reflect changes related to the Medicare Sustainable Growth Rate (SGR) and past period adjustments (the final rate update factor for these changes in aggregate is 1.69%).
• The FFS component of the 2013 Medicare A/B baseline rates has also been updated to fully incorporate the most current hospital wage index and physician geographic practice cost index. This adjustment is applied only to the FFS component of the Medicare A/B baseline and the final rate update factor for this change varies by county (see following tables for additional information). The adjustment will also be fully applied in 2014 to the FFS component of the Medicare A/B baseline. The adjustment to the Medicare Advantage component of the Medicare A/B baseline will follow the phase-in process detailed in the 2014 Medicare Advantage Rate Announcement.
• In addition, the FFS component of the 2013 Medicare A/B baseline rates has also been updated to reflect a 1.25% upward adjustment to account for the disproportionate share of bad debt attributable to Medicare-Medicaid enrollees in Medicare FFS (in the absence of the Demonstration). This 1.25% adjustment
Demonstration to Integrate Care for Dual Eligible Individuals Updated Rate Report
May 15, 2013
11
applies for 2013 and will be updated for 2014 and subsequent years of the Demonstration.
Coding Intensity Adjustment: CMS annually applies a coding intensity factor to Medicare Advantage risk scores to account for differences in diagnosis coding patterns between the Medicare Advantage and the Original Fee-for-Service Medicare programs. The adjustment for 2013 is 3.41%. The majority of new ICO enrollees will come from Medicare FFS, and 2013 ICO risk scores for those individuals will be based solely on prior FFS claims. Therefore, for 2013 CMS will establish rates in a manner that does not lead to lower amounts due to this coding intensity adjustment. Operationally, due to systems limitations, CMS will still apply the coding intensity adjustment factor to the risk scores but will increase the Medicare A/B baseline for non-ESRD beneficiaries and for beneficiaries with an ESRD status of functioning graft to offset this (by increasing the Medicare A/B baseline by a corresponding percentage). The coding intensity factor will not be applied to risk scores for enrollees with an ESRD status of dialysis or transplant during the Demonstration, consistent with Medicare Advantage policy.
In calendar year 2014, CMS will apply an appropriate coding intensity adjustment reflective of all Demonstration enrollees; this will apply the prevailing Medicare Advantage coding intensity adjustment proportional to the anticipated proportion of Demonstration enrollees in 2014 with prior Medicare Advantage experience or whose enrollment in the Demonstration began prior to October 1, 2013. Additional information will be included in the 2014 Rate Report. Impact of Sequestration: Under sequestration, for services beginning April 1, 2013, Medicare payments to providers for individual services under Medicare Parts A and B, and non-exempt portions of capitated payments to Part C Medicare Advantage Plans and Part D Medicare Prescription Drug Plans are reduced by 2%. These reductions are also applied to the Medicare components of the integrated rate. Therefore, under this Demonstration CMS will reduce non-exempt portions of the Medicare Part A and B fee-for-service and Medicare Advantage components, and the Medicare Part D component of the integrated rate, by 2%, as noted in the sections below.
Demonstration to Integrate Care for Dual Eligible Individuals Updated Rate Report
May 15, 2013
12
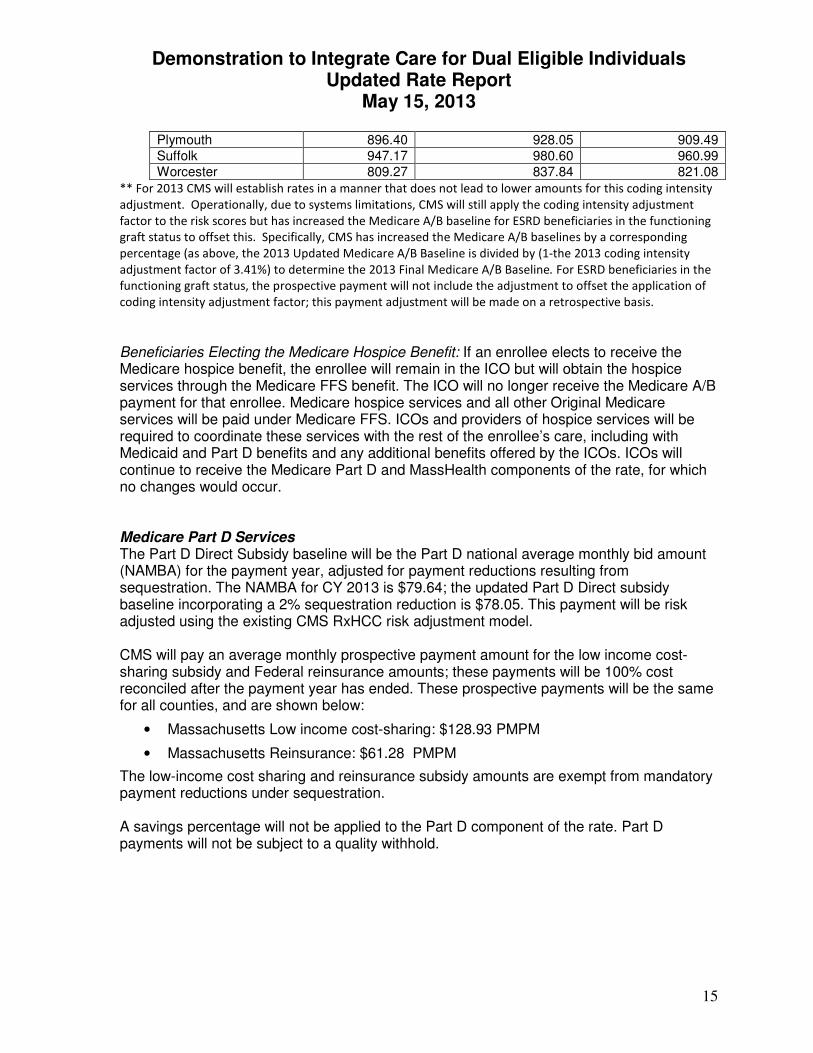
Note: See subsequent table for additional detail *Rates do not apply to beneficiaries with End-Stage Renal Disease (ESRD) in dialysis or transplant status, or those electing the Medicare hospice benefit. See Section IV for information on savings percentages.
**Repricing to reflect most recent current hospital wage index and physician geographic practice cost index.
2013 Final Medicare A/B Baseline PMPM, Non-ESRD Beneficiaries, Standardized 1.0 Risk Score, by Demonstration County*
County 2013 Updated Medicare A/B
Baseline PMPM
(after application of SGR, past period, repricing**, bad debt, and coding intensity
adjustments)
2013 Medicare A/B PMPM Payment
(after application of 2%
sequestration reduction and prior to quality withhold)
*Rates do not apply to beneficiaries with End-Stage Renal Disease (ESRD) in dialysis or transplant status, or those electing the Medicare hospice benefit.
See Section IV for information on savings percentages.
** For 2013 CMS will establish rates in a manner that does not lead to lower amounts for this coding intensity adjustment. Operationally, due to systems
limitations, CMS will still apply the coding intensity adjustment factor to the risk scores but has increased the Medicare A/B baseline for non-ESRD
beneficiaries to offset this. Specifically, CMS has increased the Medicare A/B baseline by a corresponding percentage (as above, the 2013 Updated
Medicare A/B Baseline is divided by (1-the 2013 coding intensity adjustment factor of 3.41%) to determine the 2013 Final Medicare A/B Baseline.
Demonstration to Integrate Care for Dual Eligible Individuals Updated Rate Report
May 15, 2013
14
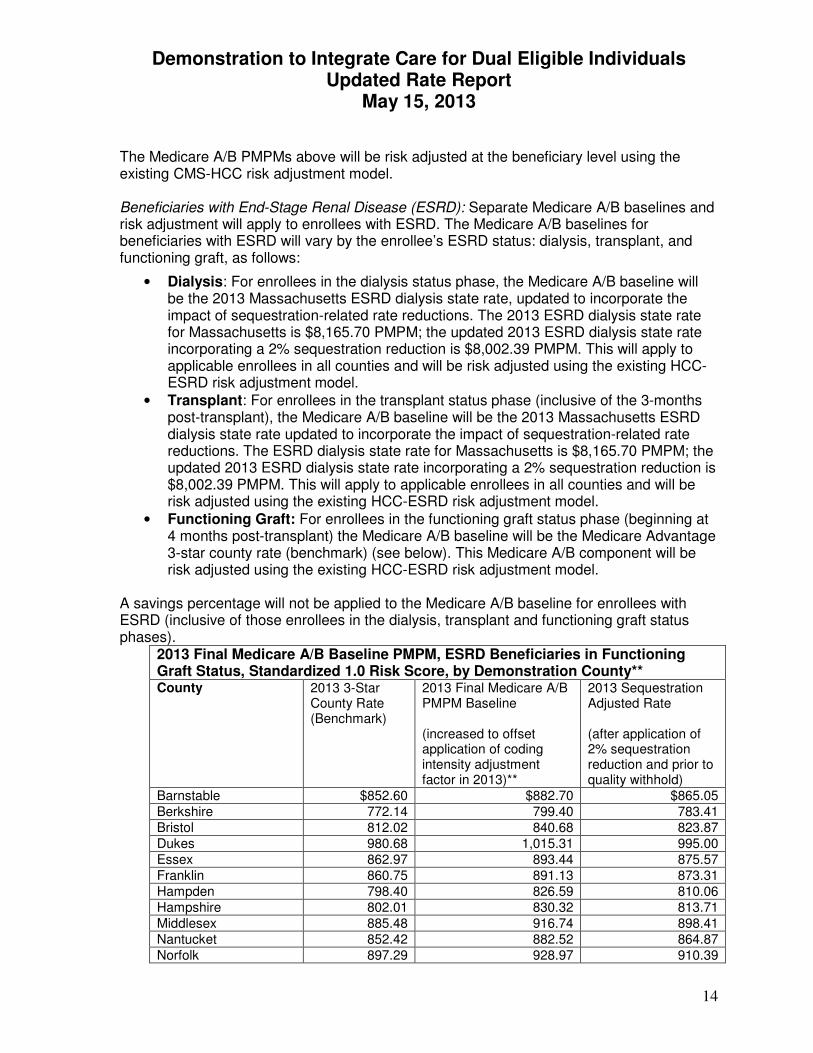
The Medicare A/B PMPMs above will be risk adjusted at the beneficiary level using the existing CMS-HCC risk adjustment model. Beneficiaries with End-Stage Renal Disease (ESRD): Separate Medicare A/B baselines and risk adjustment will apply to enrollees with ESRD. The Medicare A/B baselines for beneficiaries with ESRD will vary by the enrollee’s ESRD status: dialysis, transplant, and functioning graft, as follows:
• Dialysis: For enrollees in the dialysis status phase, the Medicare A/B baseline will be the 2013 Massachusetts ESRD dialysis state rate, updated to incorporate the impact of sequestration-related rate reductions. The 2013 ESRD dialysis state rate for Massachusetts is $8,165.70 PMPM; the updated 2013 ESRD dialysis state rate incorporating a 2% sequestration reduction is $8,002.39 PMPM. This will apply to applicable enrollees in all counties and will be risk adjusted using the existing HCC-ESRD risk adjustment model.
• Transplant: For enrollees in the transplant status phase (inclusive of the 3-months post-transplant), the Medicare A/B baseline will be the 2013 Massachusetts ESRD dialysis state rate updated to incorporate the impact of sequestration-related rate reductions. The ESRD dialysis state rate for Massachusetts is $8,165.70 PMPM; the updated 2013 ESRD dialysis state rate incorporating a 2% sequestration reduction is $8,002.39 PMPM. This will apply to applicable enrollees in all counties and will be risk adjusted using the existing HCC-ESRD risk adjustment model.
• Functioning Graft: For enrollees in the functioning graft status phase (beginning at 4 months post-transplant) the Medicare A/B baseline will be the Medicare Advantage 3-star county rate (benchmark) (see below). This Medicare A/B component will be risk adjusted using the existing HCC-ESRD risk adjustment model.
A savings percentage will not be applied to the Medicare A/B baseline for enrollees with ESRD (inclusive of those enrollees in the dialysis, transplant and functioning graft status phases).
2013 Final Medicare A/B Baseline PMPM, ESRD Beneficiaries in Functioning Graft Status, Standardized 1.0 Risk Score, by Demonstration County** County 2013 3-Star
County Rate (Benchmark)
2013 Final Medicare A/B PMPM Baseline (increased to offset application of coding intensity adjustment factor in 2013)**
2013 Sequestration Adjusted Rate (after application of 2% sequestration reduction and prior to quality withhold)
** For 2013 CMS will establish rates in a manner that does not lead to lower amounts for this coding intensity
adjustment. Operationally, due to systems limitations, CMS will still apply the coding intensity adjustment
factor to the risk scores but has increased the Medicare A/B baseline for ESRD beneficiaries in the functioning
graft status to offset this. Specifically, CMS has increased the Medicare A/B baselines by a corresponding
percentage (as above, the 2013 Updated Medicare A/B Baseline is divided by (1-the 2013 coding intensity
adjustment factor of 3.41%) to determine the 2013 Final Medicare A/B Baseline. For ESRD beneficiaries in the
functioning graft status, the prospective payment will not include the adjustment to offset the application of
coding intensity adjustment factor; this payment adjustment will be made on a retrospective basis.
Beneficiaries Electing the Medicare Hospice Benefit: If an enrollee elects to receive the Medicare hospice benefit, the enrollee will remain in the ICO but will obtain the hospice services through the Medicare FFS benefit. The ICO will no longer receive the Medicare A/B payment for that enrollee. Medicare hospice services and all other Original Medicare services will be paid under Medicare FFS. ICOs and providers of hospice services will be required to coordinate these services with the rest of the enrollee’s care, including with Medicaid and Part D benefits and any additional benefits offered by the ICOs. ICOs will continue to receive the Medicare Part D and MassHealth components of the rate, for which no changes would occur. Medicare Part D Services The Part D Direct Subsidy baseline will be the Part D national average monthly bid amount (NAMBA) for the payment year, adjusted for payment reductions resulting from sequestration. The NAMBA for CY 2013 is $79.64; the updated Part D Direct subsidy baseline incorporating a 2% sequestration reduction is $78.05. This payment will be risk adjusted using the existing CMS RxHCC risk adjustment model. CMS will pay an average monthly prospective payment amount for the low income cost-sharing subsidy and Federal reinsurance amounts; these payments will be 100% cost reconciled after the payment year has ended. These prospective payments will be the same for all counties, and are shown below:
• Massachusetts Low income cost-sharing: $128.93 PMPM
• Massachusetts Reinsurance: $61.28 PMPM
The low-income cost sharing and reinsurance subsidy amounts are exempt from mandatory payment reductions under sequestration. A savings percentage will not be applied to the Part D component of the rate. Part D payments will not be subject to a quality withhold.
Demonstration to Integrate Care for Dual Eligible Individuals Updated Rate Report
May 15, 2013
16
Risk Scores: For the purposes of assisting ICOs in evaluating the potential range of the Medicare Parts A/B and Part D components of the rate under the Demonstration, HCC and RxHCC risk score information is provided below for informational purposes. This information represents the HCC and RxHCC risk scores as of 2011 for full benefit FFS Medicare-Medicaid beneficiaries, aged 21-64, in each county. Information is presented separately for beneficiaries with ESRD. Note that these are not the actual risk scores that would be applied to the Medicare Parts A/B and Part D baseline payment rates provided above, but represent a historical average risk score of the beneficiaries likely to be Demonstration enrollees. Actual scores will be based on actual coding for ICO enrollees; the table below is for informational purposes only. 2011 HCC and RxHCC Risk Score Information, Massachusetts Medicare-Medicaid Enrollees Aged 21-64
Average HCC Risk Score*
Average RxHCC Risk Score
Non-ESRD FFS Beneficiaries
Non-ESRD
FFS Beneficiaries
FFS
Beneficiaries with ESRD
Barnstable 1.074 1.387 1.848
Berkshire 0.994 1.256 1.951
Bristol 1.033 1.343 1.887
Dukes 1.132 1.401 --
Essex 1.023 1.329 1.973
Franklin 0.920 1.254 1.592
Hampden 0.967 1.257 1.887
Hampshire 1.004 1.301 1.851
Middlesex 1.098 1.383 1.937
Nantucket 1.077 1.358 --
Norfolk 1.092 1.375 1.983
Plymouth 1.044 1.320 1.993
Suffolk 1.060 1.359 2.058
Worcester 1.074 1.338 1.894 *Weighted by beneficiary Member Months.
Demonstration to Integrate Care for Dual Eligible Individuals Updated Rate Report
May 15, 2013
17
Note: The HCC risk scores for non-ESRD beneficiaries included in this analysis and have the 2011 coding intensity adjustment of 3.41% applied. As discussed above, CMS will calculate rates as if the coding intensity adjustment factor were not applied in calendar year 2013. Operationally, due to systems limitations, CMS will still apply the coding intensity adjustment factor to the risk scores but will increase the Medicare A/B baseline for non-ESRD beneficiaries to offset this (by increasing the Medicare A/B baseline by a corresponding percentage). For example, to estimate a range of potential payments for non-ESRD beneficiaries, apply the risk scores above to the 2013 Medicare A/B PMPM payments provided above. Risk scores are not presented for rows in which there are fewer than 10 beneficiaries, due to privacy considerations. Additional Information: More information on the Medicare components of the rate under the Demonstration may be found online at:
Demonstration to Integrate Care for Dual Eligible Individuals Updated Rate Report
May 15, 2013
18
IV. Savings Percentages and Quality Withholds
Savings Percentages One of the components of the capitated Financial Alignment Demonstration is the application of aggregate savings percentages to reflect savings achievable through the coordination of services across Medicare and Medicaid. This is reflected in the rates through the application of aggregate savings percentages to both the MassHealth and Medicare A/B components of the rates. CMS and MassHealth established composite savings percentages for each year of the Demonstration, as shown in the table below. The savings percentage will be applied to the MassHealth and Medicare A/B components of the rates, uniformly to all population groups, unless otherwise noted in this report. The savings percentage will not be applied to the Part D component of the rate. Year Calendar dates Savings percentage Demonstration Year 1 First effective enrollment date through
Dec 31, 2013 0%
Jan 1 2014 through Dec 31, 2014 1% Demonstration Year 2 Jan 1, 2015 through Dec 31, 2015 2% Demonstration Year 3 Jan 1, 2016 through Dec 31, 2016 >4%* * In Demonstration Year 3, the 4% will be increased to make up for the amount of foregone savings from applying no savings factor in CY 2013 (in comparison to 1%). Because of the enrollment phase-in, there will be a disproportionately small number of member months in 2013. We estimate that the adjusted savings factor for Demonstration Year 3 will be approximately 4.2%, but the final percentage will be calculated based on actual enrollment experience in 2013.
Quality Withhold In Demonstration Year 1, a 1% quality withhold will be applied to the MassHealth and Medicare A/B components of the rate. The quality withhold will increase to 2% in Demonstration Year 2 and 3% in Demonstration Year 3.
Demonstration to Integrate Care for Dual Eligible Individuals Updated Rate Report
May 15, 2013
19
V. Medicare Expenditures Reported in the MassHealth Data Book
The following should be considered when using the historical Medicare data reported in the MassHealth Data Book to evaluate the Medicare Parts A/B component of the rates. End-Stage Renal Disease (ESRD): The Medicare data summaries reported in the MassHealth Data Book do not separately report on the ESRD population. The information below reflects an estimate of member months and Medicare spending on individuals with ESRD included in the MassHealth data book. The CDPS+Rx classification of ‘Renal Extra High’ was used as a proxy for individuals with ESRD. This will not necessarily match the CMS designation of ESRD, but is provided for informational purposes.
ESRD individuals: Member months and Medicare expenditures included in data book
CY2009 CY2010 County Member
Months Medicare Paid
Member Months
Medicare Paid
Barnstable/Dukes/Nantucket 236 $1,557,549 172 $1,569,476 Berkshire 411 $2,901,983 350 $3,024,616 Bristol 1,308 $10,615,447 1,304 $11,145,556 Essex 1,712 $13,364,701 1,562 $11,860,501 Franklin 114 $940,355 93 $332,693 Hampden 1,979 $14,200,252 1,986 $14,763,012 Hampshire 175 $881,912 147 $793,646 Middlesex 1,992 $17,455,403 1,770 $15,188,767 Norfolk 810 $6,833,906 663 $7,117,135 Plymouth 731 $6,610,851 763 $7,603,792 Suffolk 2,759 $28,823,685 2,427 $25,854,441 Worcester 1,337 $12,673,881 1,298 $12,266,080 Hospice: The MassHealth Data Book includes Medicare hospice service costs. Medicare hospice services will be provided through Original Medicare (see Appendix 7 of the MOU, Section V.e, and Section III of this Rate Report for details). Hospice costs can be identified in the MassHealth Data Book under Category of Service = Hospice. Medicare Advantage Population: The MassHealth Data Book does not contain any information on the Medicare Advantage population. Medicare Indirect Medical Education (IME) Expenditures: The Medicare expenditures reported in the MassHealth Data Book include payments for Indirect Medical Education. The table below summarizes Medicare IME payments included in the Data Book for each CY by county. On January 18, 2013 MassHealth provided a more
Demonstration to Integrate Care for Dual Eligible Individuals Updated Rate Report
May 15, 2013
20
granular summary of IME by CY, county, service category and rating category. The file was named Detailed IME Summary_01 14 13.xls.
Demonstration to Integrate Care for Dual Eligible Individuals Updated Rate Report
May 15, 2013
21
VI. Risk Mitigation The MOU established two additional mechanisms, High Cost Risk Pools (HCRP) and Risk Corridors, to mitigate risk in the event of disproportionate enrollment of high need individuals in some ICOs or adverse enrollment selection across the Demonstration as a whole. High Cost Risk Pools (HCRPs) MassHealth will establish HCRPs to offset the impact of disproportionate enrollment of high-cost enrollees across ICOs. High-cost enrollees will be defined based on spending for select Medicaid long-term services and supports above a defined per enrollee threshold within MassHealth rating categories C3 (Community High Need) and F1 (Facility-based Care). For each of those rating categories, a portion of the MassHealth component of the rate will be withheld from capitations MassHealth pays to all ICOs and held in a risk pool. The risk pool will be distributed among ICOs in proportion to the amount of applicable spending above the per enrollee threshold that is attributed to each ICO for their high cost enrollees. In the event that the HCRP exceeds the amount of applicable spending that is over the threshold, any excess funds will be distributed to all ICOs in proportion to their contributions to the pool. Thresholds for CY 2013 are on a PMPM basis, to account for the phase-in enrollment that will occur at the start of the Demonstration. Thresholds for CY2014 and subsequent years will be on the more traditional enrollee annual expense basis. In order to balance cash flow concerns with meaningful threshold amounts, the following threshold amounts and withhold rates have been selected for CY2013:
Rating Category
Threshold Statewide Average Withhold PMPM
Withhold Rate
C3 $5,000 $51.54 1.9% F1 $30,000 $129.95 1.5%
Services applicable towards the high cost threshold:
• State Plan LTSS excluding home health services • Cost-effective, non-State Plan services provided by ICOs in place of State Plan
LTSS (subject to MassHealth approval) • IL-LTSS coordinator expenses • LTC Facility expenses beyond 100 days (F1 HCRP only) • Behavioral Health Diversionary Services • Dental benefits offered to ICO enrollees
Applicable expense must be net of any enrollee Contribution to Care amounts. Risk Corridors Risk corridors will be established for Demonstration Year 1 (August 1, 2013 – December 31, 2014). Risk corridors will not be applied for Demonstration Years 2 and 3 (Calendar Years 2015 and 2016, respectively). The Demonstration will utilize a tiered ICO-level symmetrical risk corridor to include all Medicare A/B and Medicaid eligible service and non-service
Demonstration to Integrate Care for Dual Eligible Individuals Updated Rate Report
May 15, 2013
22
expenditures. The risk corridors will be reconciled after application of any HCRP or risk adjustment methodologies (e.g. CMS-HCC), and as if ICOs had received the full quality withhold payment. For gains and/or losses of less than 3%, or greater than 20%, the ICO bears 100% of the risk. For gains and/or losses between 3 and 20%, MassHealth and CMS will share 50% of the risk with the ICO. In addition, as applicable, the risk corridor band will updated to account for updates to the Medicare trend (past period adjustments) as published in April 2014 in comparison to the trends published in April 2013 and used to develop the Medicare A/B component of the rates under the Demonstration. If the trends change, the amount at which ICOs are at full risk will be reduced by the absolute value of the cumulative past period adjustment, down to a minimum of 0.5%. Gains and/or losses within and outside of the revised risk corridor band will be shared between the ICOs, MassHealth and CMS in the same manner as described above, with the exception that the absolute value of the cumulative past period adjustment will be added to the maximum Medicare payment/recoupment.
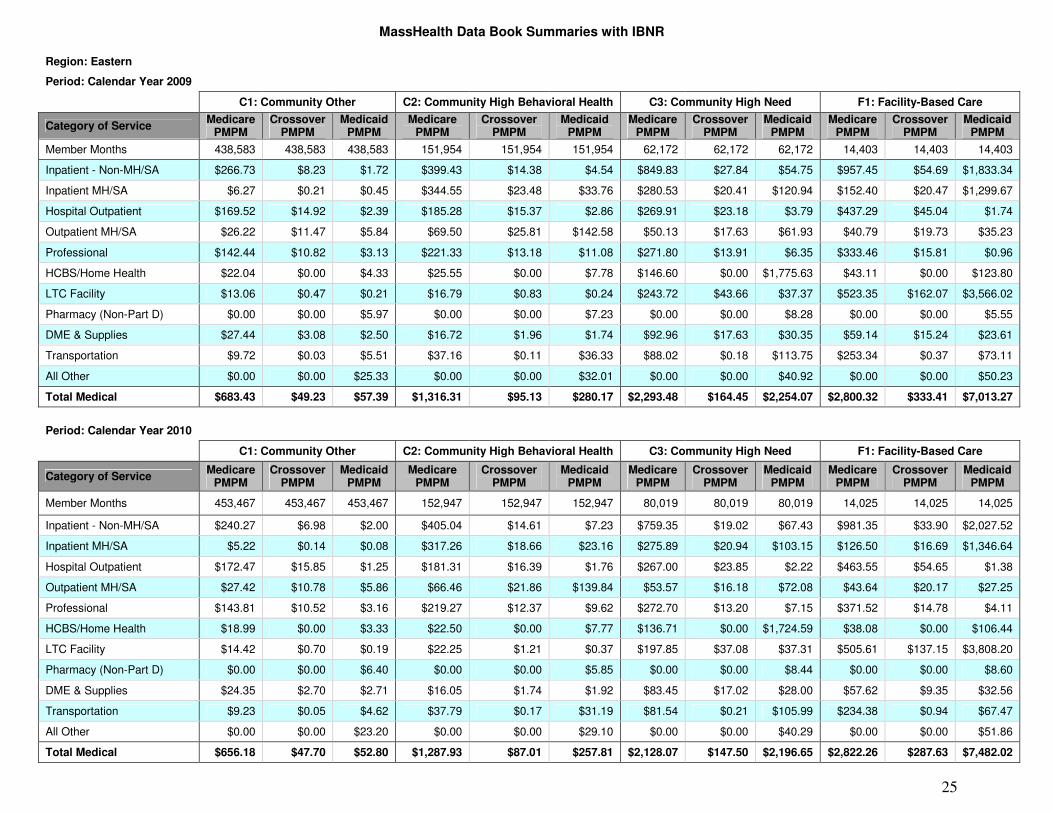
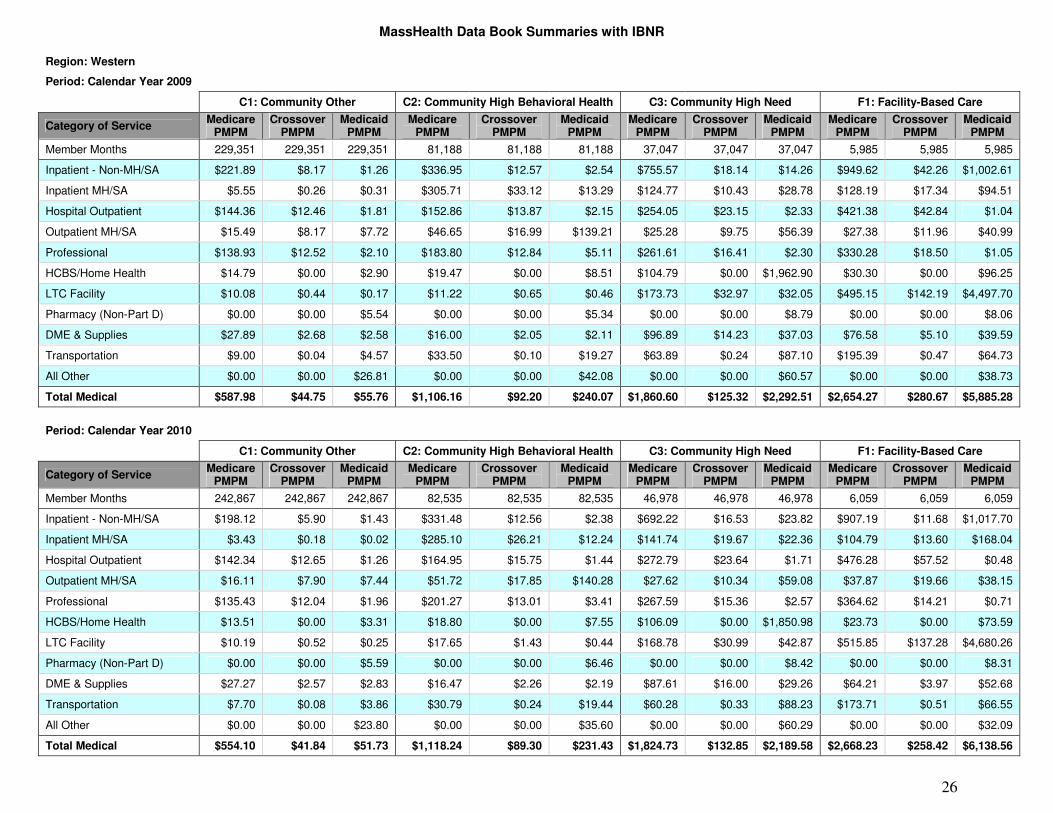
VII. MassHealth Data Book Summaries Summary PMPMs for Medicare, Medicaid and crossover claims from the MassHealth Data Book are included below. IBNR completion adjustments have been applied to the Medicaid expenditures. Expenditures are reported by calendar year, geographic region, rating category, and rate development category of service. Combined across calendar years, the Medicaid and crossover data represents the historical base data used to develop the MassHealth component of the rates.
Demonstration to Integrate Care for Dual Eligible Individuals Updated Rate Report
May 15, 2013
24
This page intentionally left blank.
MassHealth Data Book Summaries with IBNR
25
Region: Eastern E
Period: Calendar Year 2009 CY 2009
C1: Community Other C2: Community High Behavioral Health C3: Community High Need F1: Facility-Based Care