This article appeared in a journal published by Elsevier. The attached copy is furnished to the author for internal non-commercial research and education use, including for instruction at the authors institution and sharing with colleagues. Other uses, including reproduction and distribution, or selling or licensing copies, or posting to personal, institutional or third party websites are prohibited. In most cases authors are permitted to post their version of the article (e.g. in Word or Tex form) to their personal website or institutional repository. Authors requiring further information regarding Elsevier’s archiving and manuscript policies are encouraged to visit: http://www.elsevier.com/copyright
Transcript
This article appeared in a journal published by Elsevier. The attachedcopy is furnished to the author for internal non-commercial researchand education use, including for instruction at the authors institution
and sharing with colleagues.
Other uses, including reproduction and distribution, or selling orlicensing copies, or posting to personal, institutional or third party
websites are prohibited.
In most cases authors are permitted to post their version of thearticle (e.g. in Word or Tex form) to their personal website orinstitutional repository. Authors requiring further information
regarding Elsevier’s archiving and manuscript policies areencouraged to visit:
Dendrimer based terahertz time-domain spectroscopy and applicationsin molecular characterization
Anis Rahman ⇑Applied Research & Photonics, 470 Friendship Road, Suite 10, Harrisburg, PA 17111, USA
a r t i c l e i n f o
Article history:Available online 23 July 2011
Keywords:EO DendrimerTerahertz generationTerahertz time-domain spectroscopyWide broadband and ultra-sensitiveExplosiveFullerene
a b s t r a c t
Electro-optic Dendrimer is used to generate milliwatts of terahertz power by difference frequencymethod. A terahertz time-domain spectrometer (THz-TDS) has been designed around this source thatexhibits wide broadband terahertz range, �0.1 to 35 THz. Examples of molecular characterization are dis-cussed for three common explosives and the vibrational states of Fullerenes. The explosives’ spectra areunique for each explosive that allow detection and identification of the species. The Fullerenes C60 andH2@C60 also exhibit distinctively different spectra and absorbance states indicating that the THz-TDS issuitable for probing increased number of vibrational states expected from molecular vibrations.
� 2011 Elsevier B.V. All rights reserved.
1. Introduction
The electro-optic (EO) route for terahertz (THz) generation isadvantageous, because, in this case the pump-THz conversion isnot limited either by emission saturation or by heat dissipation. InEO route, the main mechanisms include: EO rectification (EOR),difference frequency generation (DFG), and optical parametric oscil-lation. Of these, EOR depends on a femto-second pulsed laser (fem-to-laser) where an ultra-fast laser pulse is introduced into the latticeof an electro-optically active material; the lattice acts as a rectifier toconvert the very high frequency derived from the femto-laser pumpto a relatively lower frequency pulse that falls in the terahertz range.This is the so-called electro-optic rectification effect. The rectifica-tion method usually uses a femto-laser at 800 nm wavelength whileother wavelengths, e.g., 1064 nm may also be used. The difficultyhere is that, not only the process is depended on the availability ofa femto-laser, but two vital parameters of the terahertz radiation –the output power and the terahertz range – are completely depen-dent on the characteristics of the femto-laser. As such, only low aver-age power has been produced and a range of a few terahertz has beenpossible. The output is always pulsed because of the pulsed nature ofthe femto-laser pulse train. Because of its low available power andlow THz range (�5 THz) it is difficult to uniquely characterize manymaterials system. A source capable of providing higher power andwider THz range in a compact form, therefore, is important forspectroscopy applications.
2. Difference frequency generation
In contrast, difference frequency generation (DFG) (or two-photon excitation) not only eliminates the use of an expensivefemto-laser, it also allows for producing both continuous wave(CW) and pulsed terahertz radiation, as well as higher outputpower and tunable terahertz range. Early efforts have shown thatDFG can be achieved by means of commercially available diodelasers. Nobel Laureate Robert F. Curl Jr. (Chemistry, 1996) group[1] has reported generation of tunable far-IR radiation by meansof two single-mode diode lasers by focusing the overlapped beamin AgGaS2 crystal. Their scheme involved two diode-lasers withcollimated output, spatially overlapped and focused into AgGaS2
crystal. The combined pump generated 3.3 nW of far-IR radiation.Shi et al. [2] have reported terahertz generation by DFG methodin GaSe crystal. These authors generated an average terahertzpower of 0.43 lW corresponding to an average pump power of895 mW. Our earlier work [3] showed that chromophore dopedand poled poly(amido amine) Dendrimer can produce �3.4 mWterahertz power when pumped by two fiber coupled diode laserswith a combined pump power of �5.5 W. Thus the terahertz figureof merit ðPTHz=P2
pumpÞ of this source is 1.124 � 10�4 W�1. This wasachieved by means of the higher electro-optic coefficient of theEO Dendrimer, viz., 130 pm/V [3]. While 3.4 mW average THzpower is a significant improvement over EOR or photoconduction,another important factor for terahertz applications, such as time-domain spectrometry, is the obtainable range from a given source.Both EOR and photoconductor sources span only up to a few tera-hertz. However, many molecular systems become indiscernible
0022-2860/$ - see front matter � 2011 Elsevier B.V. All rights reserved.doi:10.1016/j.molstruc.2011.07.004
within the first few terahertz, while over a longer range almost allmolecules will exhibit discernible behavior. DFG enjoys particularadvantage in this regard. Because the resulting terahertzfrequencies are given by the difference of the pump laser frequen-cies, mTHz / m1 � m2, one can choose appropriate pump frequenciesto obtain desired output terahertz bandwidth [3]. In practice, how-ever, both m1 and m2 are not single frequency lasers because thediode lasers always have a bandwidth distribution around theirmain peaks; as such when a stationary beam of the generated ter-ahertz is scanned by a moving beam derived from the same source,a wide frequency distribution will result. This is the so called elec-tro-optic sampling or probing and the basis of the so called pump–probe method.
3. Terahertz time-domain spectrometer
Fig. 1 illustrates the functional diagram of a terahertz time-domain spectrometer1 (THz-TDS) where the EO Dendrimer is usedas the terahertz emitter as well as the sensor. Here we used twodiode lasers at 1064 nm and 945 nm, respectively; consequently, a
range of �35 THz is expected. A compact layout is achieved byarranging the components in the manner shown in Fig. 1. An inter-ferogram is generated when the stationary beam is scanned by theterahertz beam whose intensity distribution is captured by thedetector pair. Fig. 2 exhibits the time-domain pulse generated forthe setup without any sample in. A self-calibrating algorithm isimplemented such that the effect of atmospheric moisture is mini-mized. That is, a sample must be placed in the spectrometer for itto be measured; otherwise, the spectrometer will reproduce thesame (empty) characteristic spectrum. A slightly different algorithmcalled Fourier transform of unevenly sampled data (aka Lomb peri-odogram, Fig. 3) [4] was deployed to analyze the experimental data.This algorithm essentially defines a transform by suppressing spec-tral leakage. Fig. 3 exhibits that the spectrum spans up to �35 THz.In practical measurements this ‘‘empty’’ spectrum will serve as thebackground but when the sample is placed on a substrate (e.g., glassslide), then the blank substrate spectrum will serve as thebackground.
4. Principle of THz spectroscopy
When THz radiation interacts with molecules, it may stimulatemany resonances such as molecular vibrations, phonons and/orother resonances in the system (in general molecular ‘‘events’’),resulting in the THz photons being affected by characteristicamounts determined by a specific interaction or event (see Fig. 4).The change in energy and/or frequency yields information aboutthe molecular nature of the interaction. Infrared and Raman spec-troscopy yields similar information but not capable of detectingmany resonant states as can be detected with THz because tera-hertz photons are sensitive to the vibrational states of the entiremolecule as opposed to just a bond or charge state. Molecularsimulation, especially molecular dynamics, reveals that there arenumerous vibrational and conformational states possible when amolecule is not at its lowest energy state. As most material remainsat its lowest energy state under normal and steady state conditions,THz perturbation will stimulate possible available states in the lowfrequency regions.
In common techniques such as Raman or IR spectroscopy, typ-ically, a sample is illuminated with a laser beam. Light from theilluminated spot is collected with a lens and passed through amonochromator. Wavelengths close to the laser line, due to elasticRayleigh scattering, are filtered out while the rest of the collectedlight is dispersed onto a detector. Modern Raman instrumentsemploys notch or edge filters for laser rejection and spectrographs(either axial transmissive (AT), Czerny–Turner (CT) monochroma-tor) or FT (Fourier transform spectroscopy based), and CCD
Fig. 1. Left: Layout of time-domain measurement system. Here two lasers are used with wavelengths 1064 nm and 945 nm, respectively. Consequently, a broadbandterahertz spectrum is produced. Right: ARP’s TeraSpectra� implementing the layout.
Fig. 2. Representative time-domain temporal signal (aka THz Pulse or interfero-gram) of the empty spectrometer.
1 Although the term ‘‘spectrophotometer’’ has been used traditionally based on thefact that most spectrometer functions based on the measurements of light of one kindor another, however, the terahertz spectrometer deploys a different mode ofmeasurements, viz., the time-domain measurements based on electro-optic sampling.Therefore, most authors in this area including this one choose to use the term‘‘terahertz time-domain spectrometer (THz-TDS).’’
60 A. Rahman / Journal of Molecular Structure 1006 (2011) 59–65
Author's personal copy
detectors. Spontaneous Raman scattering is typically very weak, asa result the main difficulty of Raman spectroscopy is in resolvingthe weak inelastically scattered light from the intense Rayleighscattered laser light. This is a fundamental limitation of this meth-od and though Raman gives more information than (e.g., IR spec-troscopy), it is still not sensitive enough for resolving manystates, especially the closely spaced ones.
Fig. 4 illustrates the interactions of radiation with a material sys-tem. The balls represent the lattice which may be composed ofatoms for crystalline materials or of molecules (macromolecules)for amorphous and organic materials. Considering the lattice is com-posed of macromolecules, the material is most likely to be an amor-phous matrix. In this case the transmitted beam will be composedmainly of the photons that have been involved in interaction withthe matrix but not absorbed. Therefore, the transmitted beam willcarry information about the material; and equivalently the reflectedbeam will also carry information about the nature of the matrix.Quantitative prediction of such information is obviously materialsspecific and best determined by experimental measurements.
5. Application examples
In this section, a few applications of the terahertz time-domainspectroscopy is described. In particular, molecular systems havingvery small differences have been considered where existing meth-ods such as IR or Raman is not sensitive enough to discern closelylying events. Since terahertz interaction with molecules is sensitiveto the vibrational modes of the entire macromolecule, THz-TDS has
been successfully applied to characterize a number of molecularphenomena such as non-ionic detergents in biopharmaceuticals[5], transdermal drug delivery [6], single nucleotide polymorphism[7], DNA hybridization [8], and molecular chirality [9].
5.1. Detection of explosives
Because of its specific molecular selectivity, THz-TDS is promis-ing for explosive detection. Many packaging or concealment mate-rials are semi-transparent at THz frequencies. Because terahertzcan penetrate into many non-metallic containers, it is capable ofidentifying the explosive molecules within such containers. Be-cause trace amount of explosives are present on these containers,a high sensitivity spectrometer may also be able to pick up explo-sive’s signature from external traces as well. So, the problem is tounderstand how the THz interaction within target materials (by,for example, granular morphology) or near the target (by packag-ing) affects observation of characteristic resonances or vibrational
Fig. 3. Fourier transform terahertz magnitude spectrum of the THz pulse of Fig. 2.
Fig. 4. Interaction of photons with matter; four different situations may occur:reflection, transmission, absorption and scattering. Both transmitted and reflectedbeam will include the scattered beam.
Fig. 5. Sample (spot) on a glass slide mounted on a XYZ-stage placed in the beampath.
A. Rahman / Journal of Molecular Structure 1006 (2011) 59–65 61
Author's personal copy
states. Recently there has been a renewed interest to apply tera-hertz technology for explosives detection from various sources[10–14]. However, so far these attempts enjoy only partial success.A main reason is that the current art of terahertz spectroscopy al-lows collecting spectra over a narrow terahertz window, only up to�3–6 THz. Within this range many compounds may look similar;this window is not enough to distinguish different explosives andtheir matrices uniquely. Wider terahertz bandwidth is expectedto identify significant features in the acquired spectra specific toeach molecule. Recently, we have demonstrated that molecularspecimen having granular morphology with both smooth andrough surfaces can be uniquely characterized by the wide band ter-ahertz spectroscopy [15].
A key factor in remote identification of the explosives is themolecular signature recognition of the compounds from traceamount of residues. To achieve higher success rate and low falsealarm, the technology must have very high sensitivity to pick upthe right signature from very small amount of material remainingin the residue. Such sensitivity may be exploited to incorporateselectivity of the explosive materials by generating their terahertzspectral signature and building a library. Such libraries will also beuseful for other initiatives. Another task will involve the design andimplementation of an appropriate protocol for testing and deploy-ing the devices in the field. Since terahertz is capable of penetratingthrough fog and sand storm, this technology is an ideal candidatefor remote identification of explosives.
Fig. 6. Temporal signal (interferogram) of known explosive samples on glass slide (see insert): (a) TNT, (b) PETN, and (c) RDX.
62 A. Rahman / Journal of Molecular Structure 1006 (2011) 59–65
Author's personal copy
Another key factor for extended range (distance) detection isthe intensity of terahertz radiation. While EO Dendrimer technol-ogy allows generation of milliwatts of terahertz power [3], thismay be further enhanced via a chip based terahertz generator. Thisinvolves fabrication of terahertz chip from EO Dendrimer that willenable terahertz amplification via waveguide technology [16].
5.1.1. Explosives’ spectraThe most commonly used military explosives are pentaerythritol
tetranitrate (PETN), a nitrate ester; cyclotrimethylenetrinitramine(RDX), a nitramine; and 2,4,6-trinitrotoluene (TNT), a nitroarene.The first two are white powders, but they may be plasticized. TNTcan range in appearance from a creamy white powder to a yellowsolid. Because TNT is melt-castable, it is often the matrix for PETNor RDX, e.g., Pentalite or Comp. B, respectively.
TNT, PETN and RDX samples were prepared as 1 mg/mL solutionin methanol [17]. An aliquot (30 lL) of each solution was
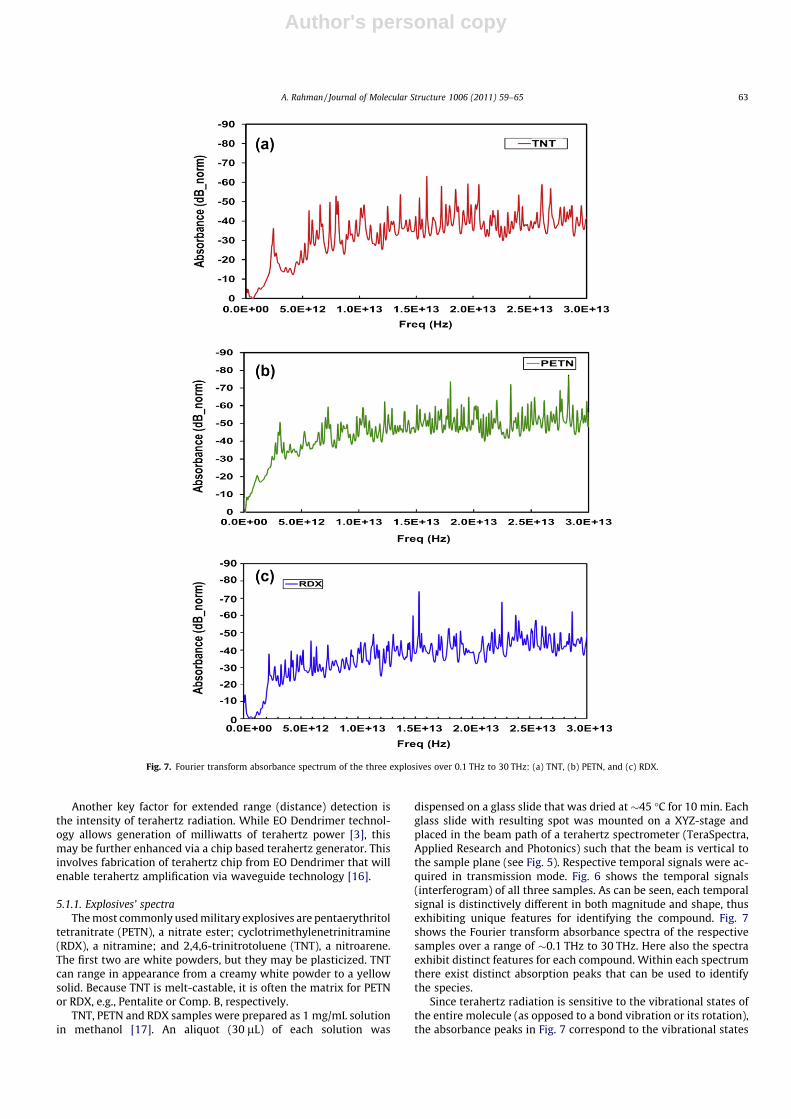
dispensed on a glass slide that was dried at �45 �C for 10 min. Eachglass slide with resulting spot was mounted on a XYZ-stage andplaced in the beam path of a terahertz spectrometer (TeraSpectra,Applied Research and Photonics) such that the beam is vertical tothe sample plane (see Fig. 5). Respective temporal signals were ac-quired in transmission mode. Fig. 6 shows the temporal signals(interferogram) of all three samples. As can be seen, each temporalsignal is distinctively different in both magnitude and shape, thusexhibiting unique features for identifying the compound. Fig. 7shows the Fourier transform absorbance spectra of the respectivesamples over a range of �0.1 THz to 30 THz. Here also the spectraexhibit distinct features for each compound. Within each spectrumthere exist distinct absorption peaks that can be used to identifythe species.
Since terahertz radiation is sensitive to the vibrational states ofthe entire molecule (as opposed to a bond vibration or its rotation),the absorbance peaks in Fig. 7 correspond to the vibrational states
Fig. 7. Fourier transform absorbance spectrum of the three explosives over 0.1 THz to 30 THz: (a) TNT, (b) PETN, and (c) RDX.
A. Rahman / Journal of Molecular Structure 1006 (2011) 59–65 63
Author's personal copy
of the molecules of the present investigation. However, furtherinvestigation is necessary to establish a relationship between thesignificant peaks with the molecular structure. Nevertheless, theseinitial spectra are promising and indicate the feasibility for furtherinvestigation within this region of rich spectral activities. Forexample, the observed trend in the RDX spectrum (Fig. 7c) matcheswith those reported within the first 4 THz (see Ref. [18], Fig. 5e).
5.2. Vibrational states of C60 and H2@C60
Here we describe another example of the vibrational states oftwo Fullerenes, C60 and H2@C60. The two molecules differ only bytwo Hydrogen atoms from one another and thus difficult to distin-guish their spectral features using standard spectroscopy methods,e.g., see Ref. [19]. Here, THz-TDS was used to determine the fea-tures in the respective spectra of the above two Fullerenes.
Pure C60 and H2@C60 were received in powder form. The sam-ples were kindly provided by Dr. Nicholas J. Turro’s Lab fromColumbia University, NY. Two solutions were prepared in 1,2-dicholorobenzene (solvent) via gravimetric method. C60: Asreceived 5.09 mg C60 (solute) was added to 3.33863 g solvent,yielding a solution of 1.52458 mg/g. H2@C60: As received 2 mgH2@C60 (solute) was added to 1.30954 g solvent, producing a solu-tion of 1.52725 mg/g. Thirty micro liter of each solution (equiva-lent to �45.818 lg solid) were dispensed on two glass slides andthe resulting drops were allowed to dry on a hot plate at 45 �Cfor �15 min. The slides were mounted on a XYZ stage one at a timeand their spectra were acquired.
5.2.1. Results and discussionFig. 8 shows the time domain temporal signal of both samples.
The H2@C60 pulse shows lower peak height compared to pure C60
as well as different peak positions. Fig. 9 exhibits the Fourier trans-form absorbance spectra of the two Fullerenes obtained from theirrespective pulses that show distinctively different peaks comparedto each other. Table 1 summarizes the absorbance peaks for bothC60 and H2@C60 extracted from their spectra and also thoseobtained from IR spectra [19]. As seen from Table 1, there is a num-ber of absorbance peaks present in the THz spectra that were notdetected by the IR spectra. This is indicative of the sensitivityobtainable from THz interaction with the entire molecule. That isas the molecular conformation change as a function of time-depen-dent stimulus on the femto- to pico-second scale (or, equivalently,the frequency of the stimulus on the THz scale), the absorbance isdirectly probed and recorded by the detection system. While somefar lying states (e.g., 4250 cm�1) were observed by low-tempera-ture (6 K) IR spectroscopy and explained by translational and rota-tional motions of H2 inside C60 cage [20], those studies were alsolimited to the detection of only a few number of states. The obser-vation of multiple states in the low frequency region indicates thatthe vibrational states of these molecules can be effectively probedby THz.
It has been predicted by Turro et al. [21] that an important abil-ity of the Fullerene research is the possibility of controlling the spinselectivity of the catalyzed conversion of the para species, pH2@C60,into the ortho species, oH2@C60, so that a strong nuclear spin polar-ization may be produced. However, if spin selective H2@C60 is pro-duced, it seems to be difficult for standard IR spectroscopy to easilydistinguish and identify the ortho and para states. The presence ofdistinguishable absorbance peaks identified by THz spectra sug-gests that this tool has the required sensitivity for detecting thespin isomers of H2 inside C60. Additionally, the presence of addi-tional peaks indicates that this method can detect modes not visi-ble in standard IR, yielding unique insight into uncharacterizedhost/guest interactions.
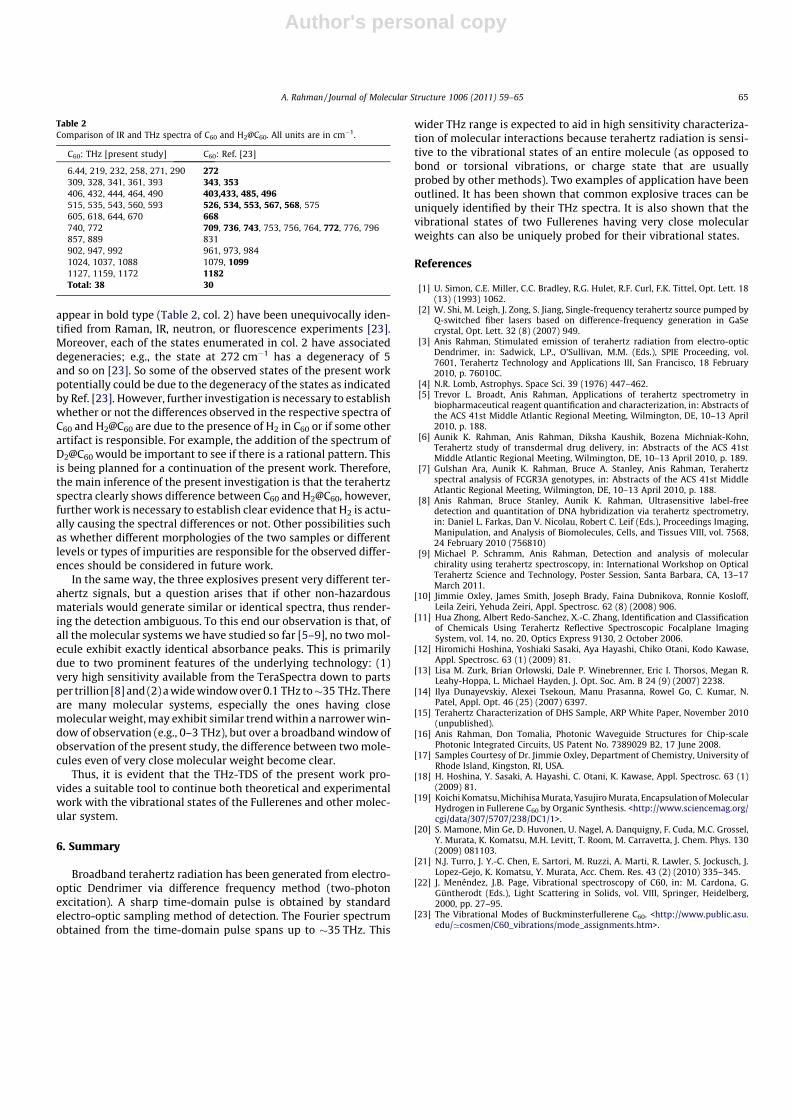
So an obvious question is, ‘‘are the additional states observed inFig. 9 (or, Table 1) real?’’ Menendez and Page [22] have illustratedvarious vibrational states assignment of C60 from theoretical calcu-lations [23]. These authors have pointed out a number of vibra-tional states present in C60 along with their multiplicities. Table 2summarizes the predicted states of C60 (col. 2) and also the mea-sured states of the present study (col. 1). Modes whose frequencies
-8.0E+6
-6.0E+6
-4.0E+6
-2.0E+6
0.0E+0
2.0E+6
4.0E+6
6.0E+6
8.0E+6
1.0E+7
0.E+00 1.E-12 2.E-12 3.E-12 4.E-12 5.E-12 6.E-12 7.E-12Time (s)
Cou
nts
(A.U
.)
C60H2@C60
Fig. 8. Time domain signal of C60 and H2@C60 exhibit clear difference between C60
64 A. Rahman / Journal of Molecular Structure 1006 (2011) 59–65
Author's personal copy
appear in bold type (Table 2, col. 2) have been unequivocally iden-tified from Raman, IR, neutron, or fluorescence experiments [23].Moreover, each of the states enumerated in col. 2 have associateddegeneracies; e.g., the state at 272 cm�1 has a degeneracy of 5and so on [23]. So some of the observed states of the present workpotentially could be due to the degeneracy of the states as indicatedby Ref. [23]. However, further investigation is necessary to establishwhether or not the differences observed in the respective spectra ofC60 and H2@C60 are due to the presence of H2 in C60 or if some otherartifact is responsible. For example, the addition of the spectrum ofD2@C60 would be important to see if there is a rational pattern. Thisis being planned for a continuation of the present work. Therefore,the main inference of the present investigation is that the terahertzspectra clearly shows difference between C60 and H2@C60, however,further work is necessary to establish clear evidence that H2 is actu-ally causing the spectral differences or not. Other possibilities suchas whether different morphologies of the two samples or differentlevels or types of impurities are responsible for the observed differ-ences should be considered in future work.
In the same way, the three explosives present very different ter-ahertz signals, but a question arises that if other non-hazardousmaterials would generate similar or identical spectra, thus render-ing the detection ambiguous. To this end our observation is that, ofall the molecular systems we have studied so far [5–9], no two mol-ecule exhibit exactly identical absorbance peaks. This is primarilydue to two prominent features of the underlying technology: (1)very high sensitivity available from the TeraSpectra down to partsper trillion [8] and (2) a wide window over 0.1 THz to�35 THz. Thereare many molecular systems, especially the ones having closemolecular weight, may exhibit similar trend within a narrower win-dow of observation (e.g., 0–3 THz), but over a broadband window ofobservation of the present study, the difference between two mole-cules even of very close molecular weight become clear.
Thus, it is evident that the THz-TDS of the present work pro-vides a suitable tool to continue both theoretical and experimentalwork with the vibrational states of the Fullerenes and other molec-ular system.
6. Summary
Broadband terahertz radiation has been generated from electro-optic Dendrimer via difference frequency method (two-photonexcitation). A sharp time-domain pulse is obtained by standardelectro-optic sampling method of detection. The Fourier spectrumobtained from the time-domain pulse spans up to �35 THz. This
wider THz range is expected to aid in high sensitivity characteriza-tion of molecular interactions because terahertz radiation is sensi-tive to the vibrational states of an entire molecule (as opposed tobond or torsional vibrations, or charge state that are usuallyprobed by other methods). Two examples of application have beenoutlined. It has been shown that common explosive traces can beuniquely identified by their THz spectra. It is also shown that thevibrational states of two Fullerenes having very close molecularweights can also be uniquely probed for their vibrational states.
References
[1] U. Simon, C.E. Miller, C.C. Bradley, R.G. Hulet, R.F. Curl, F.K. Tittel, Opt. Lett. 18(13) (1993) 1062.
[2] W. Shi, M. Leigh, J. Zong, S. Jiang, Single-frequency terahertz source pumped byQ-switched fiber lasers based on difference-frequency generation in GaSecrystal, Opt. Lett. 32 (8) (2007) 949.
[3] Anis Rahman, Stimulated emission of terahertz radiation from electro-opticDendrimer, in: Sadwick, L.P., O’Sullivan, M.M. (Eds.), SPIE Proceeding, vol.7601, Terahertz Technology and Applications III, San Francisco, 18 February2010, p. 76010C.
[4] N.R. Lomb, Astrophys. Space Sci. 39 (1976) 447–462.[5] Trevor L. Broadt, Anis Rahman, Applications of terahertz spectrometry in
biopharmaceutical reagent quantification and characterization, in: Abstracts ofthe ACS 41st Middle Atlantic Regional Meeting, Wilmington, DE, 10–13 April2010, p. 188.
[6] Aunik K. Rahman, Anis Rahman, Diksha Kaushik, Bozena Michniak-Kohn,Terahertz study of transdermal drug delivery, in: Abstracts of the ACS 41stMiddle Atlantic Regional Meeting, Wilmington, DE, 10–13 April 2010, p. 189.
[7] Gulshan Ara, Aunik K. Rahman, Bruce A. Stanley, Anis Rahman, Terahertzspectral analysis of FCGR3A genotypes, in: Abstracts of the ACS 41st MiddleAtlantic Regional Meeting, Wilmington, DE, 10–13 April 2010, p. 188.
[8] Anis Rahman, Bruce Stanley, Aunik K. Rahman, Ultrasensitive label-freedetection and quantitation of DNA hybridization via terahertz spectrometry,in: Daniel L. Farkas, Dan V. Nicolau, Robert C. Leif (Eds.), Proceedings Imaging,Manipulation, and Analysis of Biomolecules, Cells, and Tissues VIII, vol. 7568,24 February 2010 (756810)
[9] Michael P. Schramm, Anis Rahman, Detection and analysis of molecularchirality using terahertz spectroscopy, in: International Workshop on OpticalTerahertz Science and Technology, Poster Session, Santa Barbara, CA, 13–17March 2011.
[10] Jimmie Oxley, James Smith, Joseph Brady, Faina Dubnikova, Ronnie Kosloff,Leila Zeiri, Yehuda Zeiri, Appl. Spectrosc. 62 (8) (2008) 906.
[11] Hua Zhong, Albert Redo-Sanchez, X.-C. Zhang, Identification and Classificationof Chemicals Using Terahertz Reflective Spectroscopic Focalplane ImagingSystem, vol. 14, no. 20, Optics Express 9130, 2 October 2006.
[12] Hiromichi Hoshina, Yoshiaki Sasaki, Aya Hayashi, Chiko Otani, Kodo Kawase,Appl. Spectrosc. 63 (1) (2009) 81.
[13] Lisa M. Zurk, Brian Orlowski, Dale P. Winebrenner, Eric I. Thorsos, Megan R.Leahy-Hoppa, L. Michael Hayden, J. Opt. Soc. Am. B 24 (9) (2007) 2238.
[14] Ilya Dunayevskiy, Alexei Tsekoun, Manu Prasanna, Rowel Go, C. Kumar, N.Patel, Appl. Opt. 46 (25) (2007) 6397.
[15] Terahertz Characterization of DHS Sample, ARP White Paper, November 2010(unpublished).
[16] Anis Rahman, Don Tomalia, Photonic Waveguide Structures for Chip-scalePhotonic Integrated Circuits, US Patent No. 7389029 B2, 17 June 2008.
[17] Samples Courtesy of Dr. Jimmie Oxley, Department of Chemistry, University ofRhode Island, Kingston, RI, USA.
[18] H. Hoshina, Y. Sasaki, A. Hayashi, C. Otani, K. Kawase, Appl. Spectrosc. 63 (1)(2009) 81.
[19] Koichi Komatsu, Michihisa Murata, Yasujiro Murata, Encapsulation of MolecularHydrogen in Fullerene C60 by Organic Synthesis. <http://www.sciencemag.org/cgi/data/307/5707/238/DC1/1>.
[20] S. Mamone, Min Ge, D. Huvonen, U. Nagel, A. Danquigny, F. Cuda, M.C. Grossel,Y. Murata, K. Komatsu, M.H. Levitt, T. Room, M. Carravetta, J. Chem. Phys. 130(2009) 081103.
[21] N.J. Turro, J. Y.-C. Chen, E. Sartori, M. Ruzzi, A. Marti, R. Lawler, S. Jockusch, J.Lopez-Gejo, K. Komatsu, Y. Murata, Acc. Chem. Res. 43 (2) (2010) 335–345.
[22] J. Menéndez, J.B. Page, Vibrational spectroscopy of C60, in: M. Cardona, G.Güntherodt (Eds.), Light Scattering in Solids, vol. VIII, Springer, Heidelberg,2000, pp. 27–95.
[23] The Vibrational Modes of Buckminsterfullerene C60. <http://www.public.asu.edu/’cosmen/C60_vibrations/mode_assignments.htm>.
Table 2Comparison of IR and THz spectra of C60 and H2@C60. All units are in cm�1.