Salt marshes provide diverse ecosystem servicesthat have been evaluated as being some of the mostvaluable services for humanity (Costanza et al. 1997,Wieski et al. 2010). These services and human bene-fits include disturbance regulation (e.g. shorelineerosion protection), waste treatment (e.g. nutrient re -moval and transformation, denitrification, and nutri-ent retention), recreation (e.g. bird watching), and
productivity (e.g. primary and secondary production,including plant biomass production as a source oforganic matter and nutrients, and fish productionthrough fishing activities and aquaculture) (Boorman2003, Gedan et al. 2009, Wieski et al. 2010).
Salt marshes are classified as sensitive habitatsunder the European Habitats Directive (Best et al.2007). The reduction in salt marsh areas worldwideas a result of anthropogenic and natural distur-bances, namely through habitat disruption and frag-
Denitrification: an ecosystem service provided by salt marshes
Ana I. Sousa1,2,*, Ana I. Lillebø2, Nils Risgaard-Petersen3, Miguel A. Pardal4, Isabel Caçador1
1Centre of Oceanography (CO), Faculty of Sciences, University of Lisbon, Campo Grande, 1749-016 Lisbon, Portugal2Department of Biology & CESAM, University of Aveiro, Campus de Santiago, 3810-193 Aveiro, Portugal
3Institute of Biological Science, Center for Geomicrobiology, Aarhus University, Ny Munkegade, Building 1540, 8000 Aarhus C, Denmark
4Centre for Functional Ecology (CFE), Department of Life Sciences, University of Coimbra, Apartado 3046, 3001-401 Coimbra, Portugal
ABSTRACT: We hypothesized that denitrification rates, as an N removal process, would be en-hanced in salt marsh rhizosediments as compared to sediments without vegetation (bare mudflats).Denitrification rates (measured by the 15N-isotope pairing technique), potential nitrification, andnutrient fluxes were seasonally quantified in a Spartina maritima salt marsh and in adjacent baremudflats. Potential nitrification rates were significantly higher in autumn and winter, but therewere no significant differences between the bare mudflats and S. maritima vegetated sediment.Seasonally, denitrification rates in vegetated sediments under dark conditions were significantlyhigher in winter (676 ± 497 µmol N2 m−2 h−1, mean ± SD), whereas bare mudflats showed a maxi-mum rate of 151 ± 24 µmol N2 m−2 h−1 in summer. The high denitrification rates recorded in wintermay be due to many abiotic and biotic factors, namely higher potential nitrification and nitrateavailability in the water column, lower competition for nitrogen within the sediment, and less com-petition between plants, microphytobenthos, and nitrifiers, especially in dark conditions. Hence,during winter, there was a higher contribution of S. maritima marshes to N removal through deni-trification, highlighting the role of the marshes in this ecosystem service. As a whole, consideringthe seasonal variations of the studied processes, it cannot be concluded whether or not annual de -nitrification was significantly different between the vegetated sediment and the bare mudflats.
Resale or republication not permitted without written consent of the publisher
Mar Ecol Prog Ser 448: 79–92, 2012
mentation, pollution, climate change, storm events,and coastal development, is of major concern, andseveral studies on the ecology of estuaries haveemphasized the negative consequences of its disap-pearance (e.g. Valiela et al. 2000, Boorman 2003,Best et al. 2007, Jin et al. 2007, Simas & Ferreira 2007,Gedan et al. 2009, Green et al. 2009).
Estuarine eutrophication occurs all over the world(Nixon 1995, Valiela et al. 2000, Lillebø et al. 2005,Dugdale et al. 2007) as a result of water column nutri-ent enrichment by landscape runoff, which in turn isfrequently the result of anthropogenic activities(Vitousek et al. 1997, Hauxwell & Valiela 2004). Inmarine and estuarine systems, nitrogen (N) is fre-quently the limiting nutrient to primary production(Nixon 1981, Vitousek & Howarth 1991), and in thelast few decades this nutrient has been recognized asbeing the major cause of eutrophication in coastalecosystems (Howarth & Marino 2006). Thus, the in -crease in N loading in estuaries causes algal bloomsand shifts in the primary producers (phytoplankton,macroalgae, and seagrasses) (Hauxwell & Valiela2004, Howarth & Marino 2006). This em pha sizes theimportance of studying the N cycle.
Salt marshes are very important as N sinks throughplant biomass production (i.e. the incorpo ration of Nin standing biomass, detritus, litter, and sedi ments)(Edwards & Mills 2005, Caçador et al. 2007, Sousa etal. 2008) and denitrification (e.g. Teal & Howes 2000,Valiela & Cole 2002). These processes may contributeto counteract eutrophication in coastal areas (Seit zin -ger 1988). In fact, most of the land-derived nitrogenthat loads to coastal environments, in non-human- impacted environments, could be denitrified in estu-arine and shelf regions (Galloway 1998).
Even though anammox (anaerobic ammonium oxi-dation) contributes to N removal in aquatic ecosys-tems (Trimmer et al. 2003), denitrification seems to bethe most significant process that produces N2 in estu-aries (Schlesinger 1997, Jaffe 2000). Accordingly, theorganic enrichment of sediments seems to in creasedenitrification to a greater extent than anammox,since the latter process greatly depends on waterdepth (much less in estuaries than in marine waters)and mineralization rates (deeper water columns showlower organic enrichment) (Dalsgaard et al. 2005).For example, in the Thames estuary, anammox con-tributed to less than 10% of N2 production (Trimmeret al. 2003), while Risgaard-Petersen et al. (2004b) re-ported that, compared to marine deep sea sediments(where anammox represented 30 to 70% of N2 pro-duction), N2 production by anammox represented 5 to24% of total N2 production in estuaries.
Denitrification in aquatic ecosystems depends onmany physical, chemical, and biological factors. Ni -tra te concentration, availability of easily degradableorganic carbon, oxygen availability, temperature,light, and wa ter retention time are some of the physi-cal-chemical factors influencing denitrification ratesin these eco systems (Thompson 1995, Cornwell et al.1999, Piña-Ochoa & Álvarez-Cobelas 2006, Silven-noinen et al. 2008). Indirectly, sulfide concentrationmay also affect denitrification: for sulfide concentra-tions within a certain range, nitrification is suppressed,which consequently affects denitrification (Seitzinger1988). In addition, biological factors such as plantroots, fauna (through bioturbation and bio-irrigation),and microbiological abundance and activity may af-fect denitrification. Plants can influence denitrificationrates (Reddy et al. 1989, Howarth et al. 1996, Corn -well et al. 1999, Eriksson et al. 2003, Piña-Ochoa & Ál-varez-Cobelas 2006, Koop-Jacobsen & Giblin 2009)due to O2 diffusion through the aeren chyma (Cartax-ana & Lloyd 1999, Maricle & Lee 2002) and the cre-ation of oxic micro-zones surrounding the roots andrhizomes (the rhizosphere) at a certain depth in thesediment, which enhances coupled nitrification-deni-trification. Spartina maritima also creates a more oxi-dized rhizosphere, which en hances sulfide oxidationand contributes to sulfide detoxification (Madureira etal. 1997). Moreover, in the presence of reduced sulfurforms (H2S, S2−, S), which act as electron donors, deni-trification coupled to sulfur-oxidation occurs (Burgin& Hamilton 2007), thus contributing to nitrate removalin these sediments. It has been shown that bioturba-tion by benthic macrofauna significantly stimulates insitu sediment denitrification, which is associated withthe sediment layer where infauna is more active(Gilbert et al. 1998). Denitrification rates can also bein fluenced by plants and microphytobenthos (MPB),which compete with microbial denitrifier communitiesfor substrate (nitrate).
Nitrification (the microbial aerobic oxidation ofNH4
+ and NO2− to NO3
−) is an important step in the ni-trogen cycle, occurring in oxic surface sediments.Since many biotic and abiotic factors can influencepotential nitrification (e.g. plant roots, fauna abun-dance, activity of nitrifying bacteria, temperature,oxygen penetration, and NH4
+ concentration; Henrik-sen et al. 1981), it is important to quantify potential ni-trification rates, which can be regarded as a proxy forthe abundance of active nitrifiers (Risgaard-Petersenet al. 2004a). The product of this process (NO3
−) islater denitrified (coupled nitrification-denitrification[Dn]) and can also diffuse from the sediment into thewater column. Several studies have been performed
80
Sousa et al.: Denitrification in salt marshes
in order to quantify denitrification in different aquaticecosystems, namely freshwater tidal marshes(Seitzinger 1988, Cornwell et al. 1999), estuaries,rivers, lakes, coastal waters (Steingruber et al. 2001,Piña-Ochoa & Álvarez-Cobelas 2006), and wetlands(Merrill & Cornwell 2000, Risgaard-Petersen 2003,Trimmer et al. 2003, Sundbäck et al. 2006). However,regarding denitrification in estuaries, there are onlyfew studies concerning mudflats (e.g. Cabrita &Brotas 2000, Risgaard-Petersen 2003, Sundbäck et al.2006) and even fewer concerning salt marshes(Valiela & Teal 1979, Koch et al. 1992, White & Howes1994, Eriksson et al. 2003, Poulin et al. 2007). In thesestudies, different techniques were applied and there-fore restrict comparisons be tween systems.
The present study aimed to evaluate the role ofSpartina maritima salt marshes in the denitrificationprocess, as a service provided by the ecosystem. Inorder to do so, we hypothesized that: (1) the rhizo -sphere environment may enhance nitrification anddenitrification; and (2) in eutrophic systems, wherenutrients are not limiting, marsh plants and bacteriado not compete for resources. Thus, we hypothesizedthat, compared to sediments without vegetation(bare mudflats), salt marsh rhizosediments enhanceN2 removal.
MATERIALS AND METHODS
Sampling site and procedure
Sampling took place in the Tagus estuary, locatedin the southern European Atlantic margin (Portugal)(38° 40’ 10’’ N, 9° 00’ 13’’ W). The Tagus estuary is oneof Europe’s largest estuaries (320 km2), classified bythe Convention of Wetlands as a Ramsar site. It ischaracterized by water temperatures ranging be -tween 20 and 26°C in summer and 8 and 18°C in win-ter (Gameiro et al. 2007). Water column dissolved in -organic nitrogen (DIN) concentrations for the period1999 to 2005 varied seasonally between 27 ± 19 µmoll−1 (mean ± SD) in summer and 84 ± 33 µmol l−1 inwinter; the PO4-P concentrations varied between3.4 ± 1.1 µmol l−1 during winter and 4.5 ± 3.0 µmol l−1
in autumn (Gameiro et al. 2007).Spartina maritima (Curt.) Fernald is an herbaceous
perennial plant that colonizes estuarine intertidalmudflats and is distributed throughout the coasts ofwestern, southern, and southeastern Europe, as wellas in western Africa. It is one of the most commonhalophytes colonizing salt marshes in the Tagus estu-ary, which has 20 km2 of salt marsh vegetation (Simas
et al. 2001). Spartina maritima is the dominant species in the lower marsh, with an area covering675 ha, which represents one-third of the total marsharea (Simas et al. 2001, Reboreda & Caçador 2007). Itis described as a pioneer species, tolerating highsalinity and long flooding conditions common in lowmarshes. In this system, the aboveground biomass ofS. maritima is 0.60 ± 0.02 kg DW m−2, while thebelowground biomass is 3.60 ± 0.15 kg DW m−2
(Reboreda & Caçador 2007).A seasonal study was performed from autumn 2007
to summer 2008. Sampling was carried out duringspring tides at low tide. Ten sediment cores were col-lected in the Spartina maritima salt marsh (each corecontaining 1 or 2 shoots of S. maritima; the inter-coreplant biomass was as similar as possible) using aPlexiglass core (∅ = 8 cm; 30 cm height). Each sedi-ment core was 15 cm in depth. An additional 10 sed-iment cores (5 cm depth) were collected in order tocharacterize the vegetated sediment (n = 5) and toperform the potential nitrification experiment (n = 5).The same number and type of sediment cores werecollected in the adjacent area without vegetation(henceforth called bare mudflats). Estuarine waterwas collected in containers and taken to the labora-tory to be used in the incubation procedure. The insitu temperatures of the water and sediment wererecorded, and all samples were immersed in estuar-ine water and taken to the laboratory within 1 h. Thein situ temperature conditions were maintained inthe laboratory using coolers.
Sediment characterization
The sediment was characterized for MPB, chloro-phyll a (chl a) and sediment particle size. For chl adetermination, the top 5 mm of the 5 sediment cores(5 cm depth) were collected, weighed, and stored at−80°C. Later on, this sediment was freeze-dried andweighed again. About 0.3 g of freeze-dried sedimentwas immersed in 5 ml of 90% acetone and stored at−20°C for 24 h. Then, the samples were stirred in thevortex, centrifuged for 10 min at 2800 × g, and thesupernatant was analyzed in a UV-1603 spectropho-tometer. The chl a values were obtained according toLorenzen (1967). The chl a level was also estimatedfrom the trichromatic equations of Jeffrey & Hum -phrey (1975), which do not include an acidificationstep.
Sediment particle size was determined by sequen-tial sieving of the top 5 cm of the sediment cores andclassified according to Folk (1954). Organic matter
81
Mar Ecol Prog Ser 448: 79–92, 2012
was quantified as loss on ignition (% LOI) during 8 hat 500°C.
Potential nitrification measurements
Potential nitrification was measured through aslurry incubation experiment (adapted from Hansenet al. 1981) in Spartina maritima vegetated sedi-ment (n = 5) and in sediment from the bare mudflat(n = 5). Homogenized surface sediment aliquots(0 to 5 mm depth; 2 ml) were incubated with20 mM NH4Cl and 4 mM KH2PO4 in 40 ml artificialseawater (ASW) adjusted to in situ salinity. Samplesfor the determination of nitrification rates weretaken at timed intervals of 1 h, over 5 h. Sampleswere centrifuged (8 min at 1180 × g), and super-natant from the water sample was filtered andfrozen for subsequent NOx-N (NO3-N + NO2-N)analysis. The NOx-N concentrations were expectedto increase over time (5 h of incubation) in a linearmanner, meaning that the added NH4-N wasimmediately nitrified after the start of incubation.Potential nitrification was calculated from thisincrease in NOx-N according to Hansen et al.(1981) and Rysgaard et al. (1994).
Incubation procedure: nutrient fluxes and O2 consumption
In order to assess whether there was competitionfor resources between plants and bacteria (Risgaard-Petersen & Ottosen 2000) in non-N-limited condi-tions, nutrient fluxes in Spartina maritima vegetatedsediment and in bare mudflats were quantified andcompared. Incubations were performed in a batchmode assay in a tank/incubator with 10 cores eachtime (i.e. 5 cores with S. maritima and 5 cores of baremudflat sediment, meaning that light and dark incu-bations were always performed on different cores).The cores were aerated overnight (with an air pumpand a magnetic stirrer rotating a magnet inside eachcore, as described by Cabrita & Brotas (2000) andDalsgaard et al. (2000) and under a natural seasonallight-dark cycle. On the following day, each core wassealed with Plexiglass stoppers and incubated asdescribed by these authors. After measuring thenutrient fluxes, the cores were aerated overnight tore-establish the equilibrium between the sedimentand water column, and denitrification rates weremeasured on the following day. Flux incubation timewas calculated considering the reduction in O2 con-
centration in the water column, which cannot de -crease by more than 20% of the initial concentration(2 vegetated cores and 2 bare mudflat cores weresampled and measured after 1 h of incubation).Nutrients (NH4-N, NOx-N) and oxygen fluxes werecalculated using a mass balance approach. Both darkand light incubations for nutrient fluxes were per-formed twice each season, using extra cores toincrease the number of replicates, i.e. twice (5 lightvegetated + 5 light bare mudflat) and twice (5 darkvegetated + 5 dark bare mudflat).
Nutrient and oxygen analyses
Dissolved oxygen was quantified by Winkler titra-tion (Grasshoff et al. 1983). Inorganic nutrient con-centrations were quantified in water samples thathad previously been filtered through GF/C Whatmanfilter paper and immediately frozen. Following this,colorimetric analyses in a Tecator FIAstar 5000 Ana -lyser were performed. The NO3-N concentration wasquantified according to Grasshoff (1976), NO2-Naccording to Bendschneider & Robinson (1952), andNH4-N using colorimetric methods in filtered sam-ples according to Koroleff (1969/1970).
Denitrification measurements were performed onthe same cores as nutrient fluxes, according to theisotope pairing technique (Nielsen 1992). Followingthis, 15NO3 (from a Na15NO3 stock solution, 99%;Sigma Aldrich) was added to the estuarine water inthe container with 10 sediment cores each time(5 light vegetated + 5 light bare mudflat and 5 darkvegetated + 5 dark bare mudflat), to a final concen-tration of at least 20% of the O2 concentration and afinal enrichment of at least 30 atom % in the nitratepool (Dalsgaard et al. 2000). The diffusion time for15NO3 was about 15 min, and the time was calculatedaccording to Dalsgaard et al. (2000). The sedimentcores were closed with PVC lids and incubationstarted. The incubation time was calculated accord-ing to the O2 fluxes performed the day before. At theend of incubation, the water samples were placed inExetainer vials (Exetainer, Labco) for N2 analyses(200 µl of ZnCl2 [50% w/v] was added to stop anybiological activity). The water samples were filteredand stored for NO3 analyses. Immediately after, eachcore was carefully slurried in order to homogenize
82
Sousa et al.: Denitrification in salt marshes
the dissolved N2 in the water column and in pore -water, and new samples for N2 analyses were col-lected. Thus, N2 diffused into the water column dur-ing incubation and N2 still in the porewater wassampled and quantified. Denitrification rates werecalculated according to Nielsen (1992).
15N IPT assumptions
The isotope pairing technique (IPT) has the follow-ing assumptions: (1) the added 15NO3 does not affectthe production of 14N2; (2) the 28N2, 29N2, and 30N2
produced is binomially distributed; and (3) 14NO3 and15NO3 homogeneously mixes in the nitrate reductionzone in the sediment. In order to test these assump-tions, a 15NO3 concentration series experiment wasperformed following the method of Nielsen (1992).Seven different 15NO3 concentrations were tested(20 to 160 µM, in order to include a wide range ofNO3 concentrations in the water column) and thedenitrification rates were quantified.
Plant biomass and fauna characterization
After all incubations, Spartina maritima plantswere carefully washed and rinsed with distilledwater and then dried at 60°C for dry weight (DW)quantification per sample. Sediment from each core,with and without vegetation, was sieved through a500 µm-sized mesh net and macrofauna were collected, identified, and the species abundance calculated.
The biological factors MPB, plant density, andfauna abundance were considered because they canaffect oxygen production and consumption and, con-sequently, other chemical processes such as mineral-ization, denitrification, and other nutrient fluxes(Rysgaard et al. 1995, Hulth et al. 2005, Sundbäck etal. 2006).
Statistical analysis
Linear correlation was performed (Pearson’s andSpearman’s rank correlations) to test for correlationsbetween 15NO3 concentration in the water columndenitrification of NO3
− in bottom water (Dw) and Dn.
Analyses were performed using SPSS 17.0 and theSTATISTICA 9 software package. 2-way ANOVAwas performed to test for differences in potentialnitrification rates and in denitrification rates betweendark/light conditions and Spartina maritima vege-tated sediment/bare mudflat sediment. If needed,data were transformed to satisfy the ANOVAassumptions. Cochran’s Q and Kolmogorov-Smirnovtests were used to analyze the homogeneity of vari-ances and normality of data, respectively. 1-wayANOVA was performed to test for differences in Dt
(total denitrification) between seasons. A principalcomponents analysis (PCA) was performed (Zar1998) using PRIMER ver. 5 software. Projections con-sidered the principal components 1 and 2 for variableenvironmental vectors (water temperature, MPB,nitrate and ammonium concentrations, macrofaunaabundance, salinity, potential nitrification rate; datain Table 1 and Fig. 1), and the study sites (S. maritimasediment and bare mudflat sediment from the 4 sea-sons). All concentration data were log(x + 1) trans-formed and all variables were normalized.
RESULTS
Sediment characterization, plant and macrofauna biomass
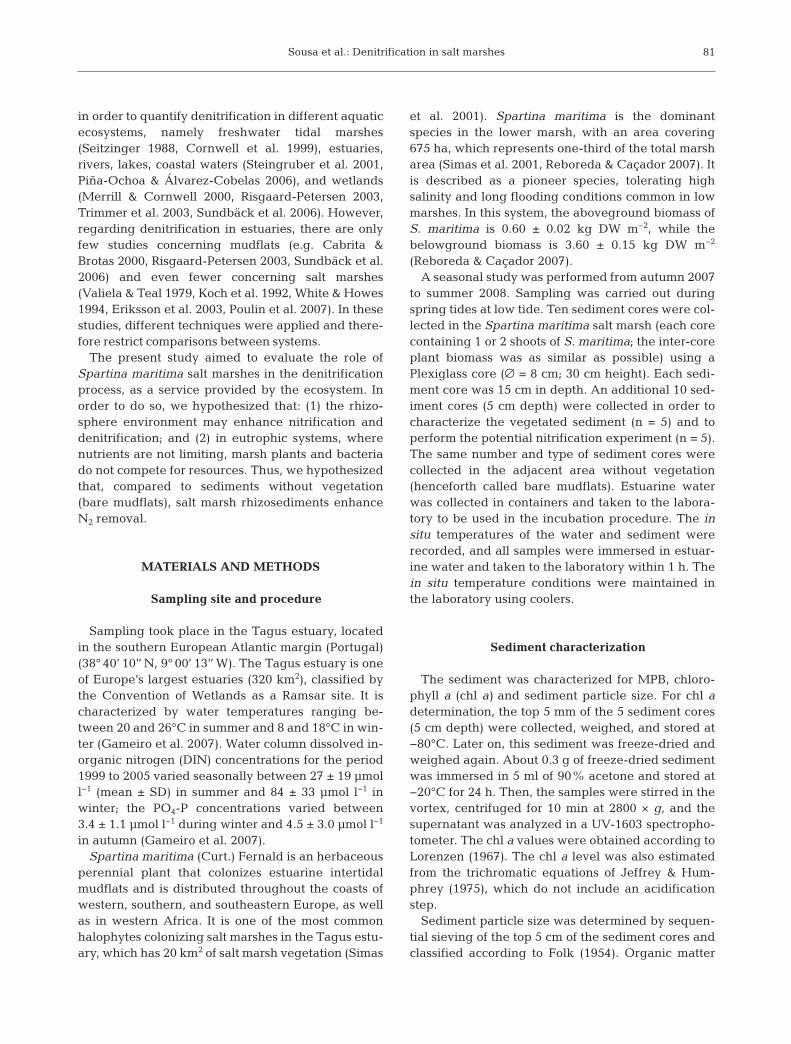
The temperature of the water and sediment showeda clear seasonal variation, with higher values inspring and summer and lower ones in autumn andwinter (Tables 1 & 2). In both areas (Spartinamaritima vegetated sediment and bare mudflats), thepercentage of fine particles (silt and clay) was higher
83
Season Temperature (°C) Salinity O2 NH4-N NOx-NIncubation In situ Incubation In situ (µmol l−1) (µmol l −1) (µmol l −1)
Table 1. Water temperature and salinity in each season, and mean concentrations (± SE; min. n = 3) of oxygen and nutrients(NH4-N, NOx-N), of the incubation water, in the initial conditions. In situ temperature and salinity are from the Tagus estuary
in 1999–2005 (Gameiro et al. 2007)
Mar Ecol Prog Ser 448: 79–92, 2012
in the autumn/winter period. Both sediment and sea-son influenced the percentage of organic matter (de-termined as the percentage of loss on ignition, % LOI)(there was interaction between both factors, 2-way ANOVA, F = 77.69, p < 0.001), with S. maritimavegetated sediment having a higher % LOI duringsummer and autumn, and bare mudflats showing alower % LOI in summer and autumn (Table 2).
The MPB abundance (estimated as the concentra-tion of chl a) depended on the sediment type and sea-son (there was an interaction between both factors,2-way ANOVA, F = 4.55, p < 0.05) and was compara-tively higher in the Spartina maritima vegetatedsedi ment. Even though S. maritima DW per coreslightly increased along the growing season (rangingfrom 0.7 ± 0.2 to 2.2 ± 1.5 g DW), there was also anincrease in the SD, thus reducing the meaning of theplant biomass increase (Table 2). In the cores from
both sites, the most abundant infauna species wereHydrobia ulvae, Scrobicularia plana, Hediste diversi-color, and Abra tenuis, and their seasonal abundancewas generally higher in spring. In S. maritima vege-tated sediment, the mean macrofauna abundancewas 1.1 to 2× higher than in the bare mudflats.
Potential nitrification rates
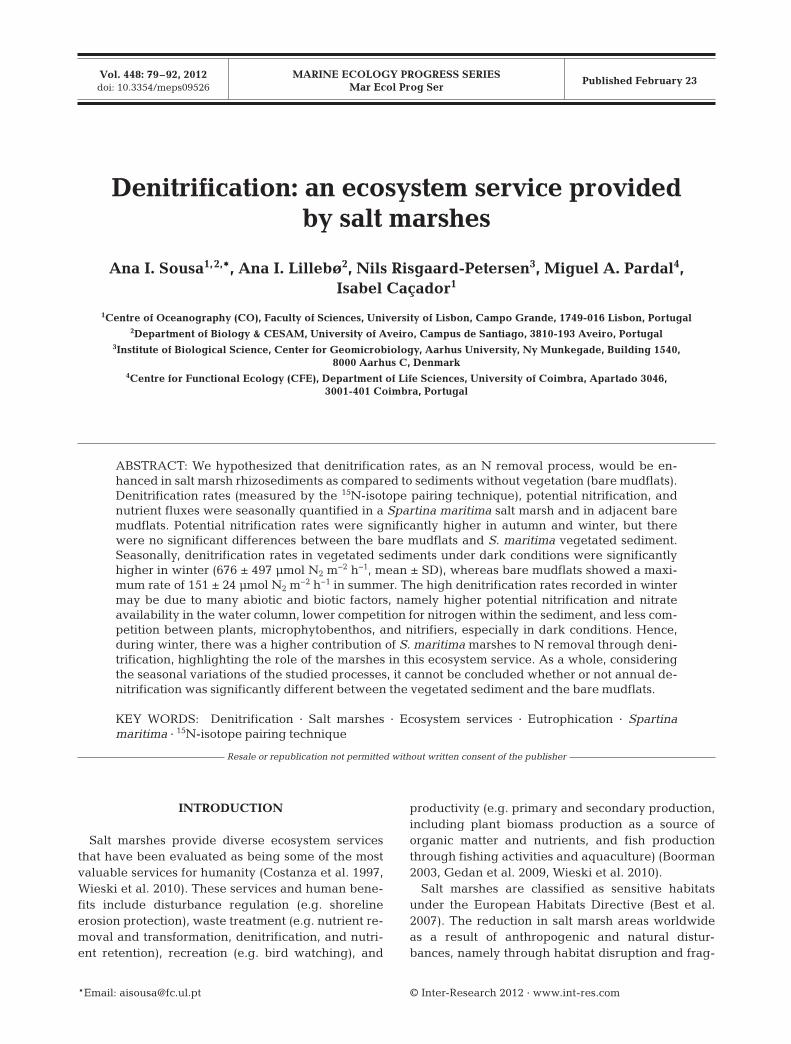
The slurry incubation salinities ranged between 28and 30. Potential nitrification rates were significantlyhigher in winter and autumn compared to spring andsummer (2-way ANOVA, F = 11.99, p < 0.0001)(Fig. 1). No statistically significant differences werefound between bare mudflat and Spartina maritimavegetated sediments (2-way ANOVA, F = 0.49, p >0.05).
O2 and nutrient fluxes
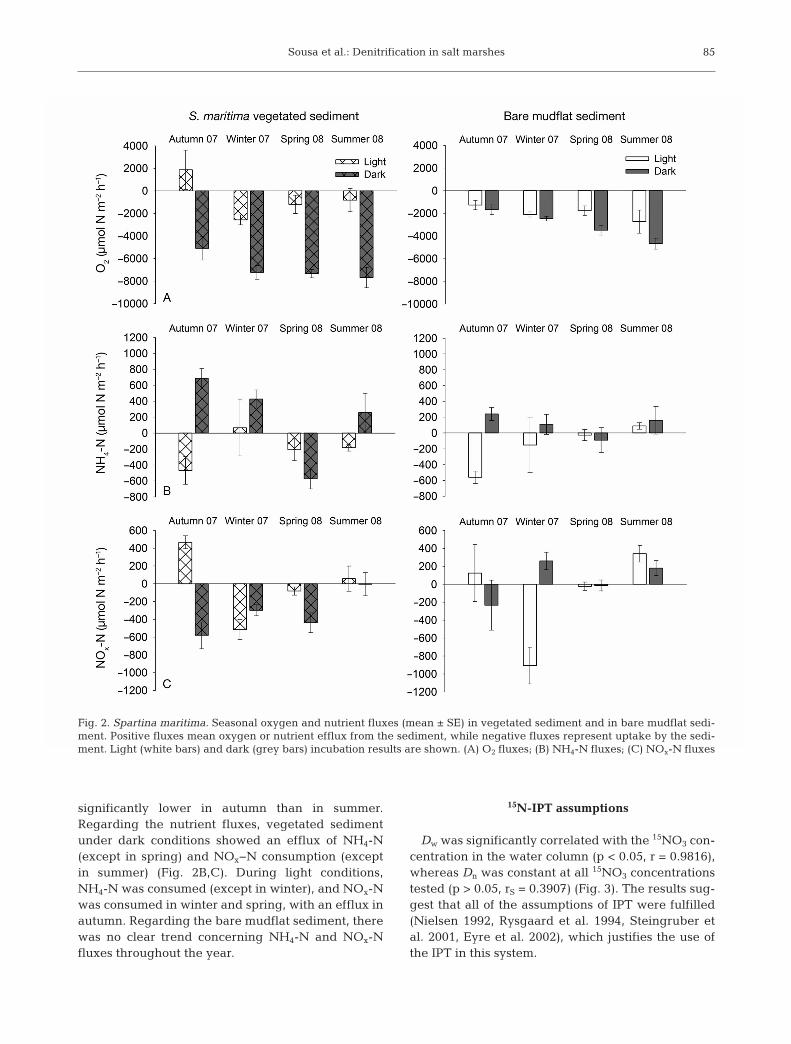
Oxygen and nutrient concentrations at the begin-ning of the incubations varied seasonally (Table 1). Inboth areas (with vegetation and bare mudflats), netconsumption of oxygen usually occurred under bothdark and light conditions (Fig. 2A). Nevertheless,under dark conditions, when respiration is not com-pensated by primary production, the O2 consumptionwas greater (2-way ANOVA, F = 86.70, p < 0.0001 forvegetated sediment, and F = 5.50, p < 0.05 for baremudflat sediment). A seasonal variation was ob -served for both vegetated sediment, where the con-sumption was lower in autumn (2-way ANOVA, F =3.74, p < 0.05), and in bare mudflat sediment (2-wayANOVA, F = 3.92, p < 0.05), where consumption was
84
Fig. 1. Spartina maritima. Potential nitrification in vegetatedsediment (cross-hatched bars) and bare mudflat sediment(white bars), during autumn, winter, spring, and summer(mean + SD, n = 5). Different lowercase letters (a, b) mean
statistical significant differences (p ≤ 0.05)
Season Mudflat Sediment S. maritimatype In situ Granulometry LOI MPB-chl a biomass
Table 2. Sediment characterization and Spartina maritima biomass in each season. Granulometry: Fs: fine sand (values:63−125 µm fraction + >125 µm fraction); Sc: silt and clay (≤63 µm). LOI: loss on ignition, MPB: microphytobenthos. MPB-chl a
and S. maritima biomass: values are mean ± SD (MPB-chl a: n = 3 to 5, S. maritima biomass: n = 15)
Sousa et al.: Denitrification in salt marshes
significantly lower in autumn than in summer.Regarding the nutrient fluxes, vegetated sedimentunder dark conditions showed an efflux of NH4-N(except in spring) and NOx−N consumption (exceptin summer) (Fig. 2B,C). During light conditions,NH4-N was consumed (except in winter), and NOx-Nwas consumed in winter and spring, with an efflux inautumn. Regarding the bare mudflat sediment, therewas no clear trend concerning NH4-N and NOx-Nfluxes throughout the year.
15N-IPT assumptions
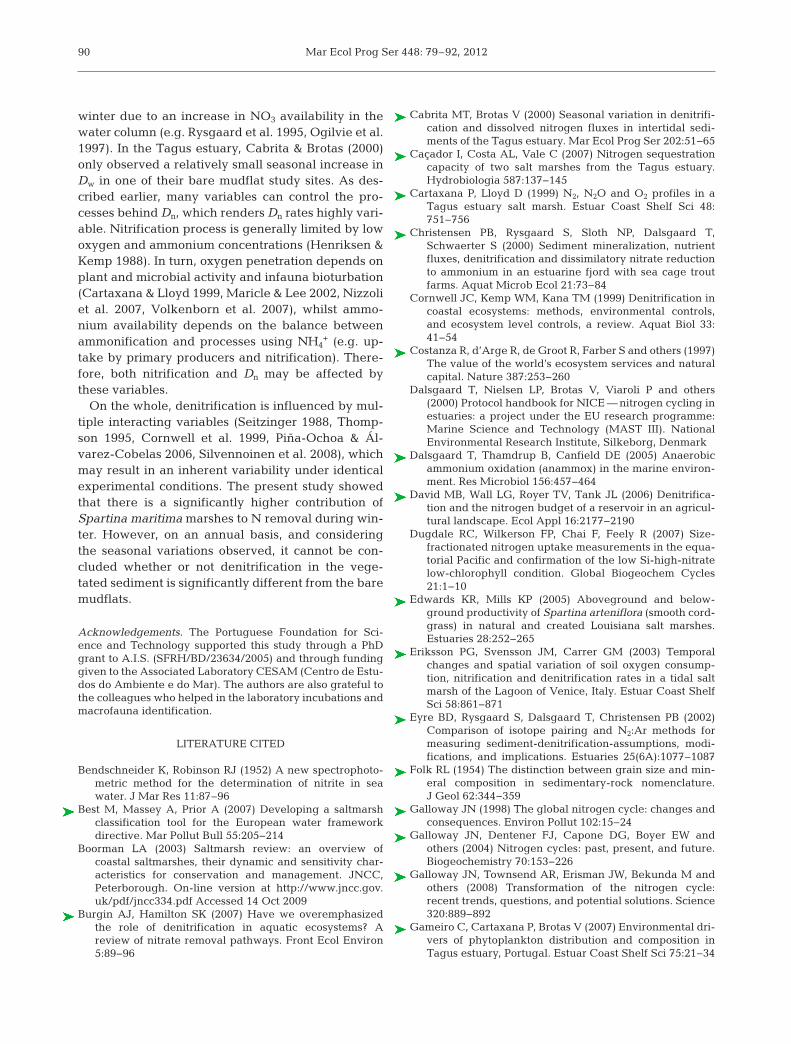
Dw was significantly correlated with the 15NO3 con-centration in the water column (p < 0.05, r = 0.9816),whereas Dn was constant at all 15NO3 concentrationstested (p > 0.05, rS = 0.3907) (Fig. 3). The results sug-gest that all of the assumptions of IPT were fulfilled(Nielsen 1992, Rysgaard et al. 1994, Steingruber etal. 2001, Eyre et al. 2002), which justifies the use ofthe IPT in this system.
85
Fig. 2. Spartina maritima. Seasonal oxygen and nutrient fluxes (mean ± SE) in vegetated sediment and in bare mudflat sedi-ment. Positive fluxes mean oxygen or nutrient efflux from the sediment, while negative fluxes represent uptake by the sedi -ment. Light (white bars) and dark (grey bars) incubation results are shown. (A) O2 fluxes; (B) NH4-N fluxes; (C) NOx-N fluxes
Mar Ecol Prog Ser 448: 79–92, 2012
Denitrification measurements
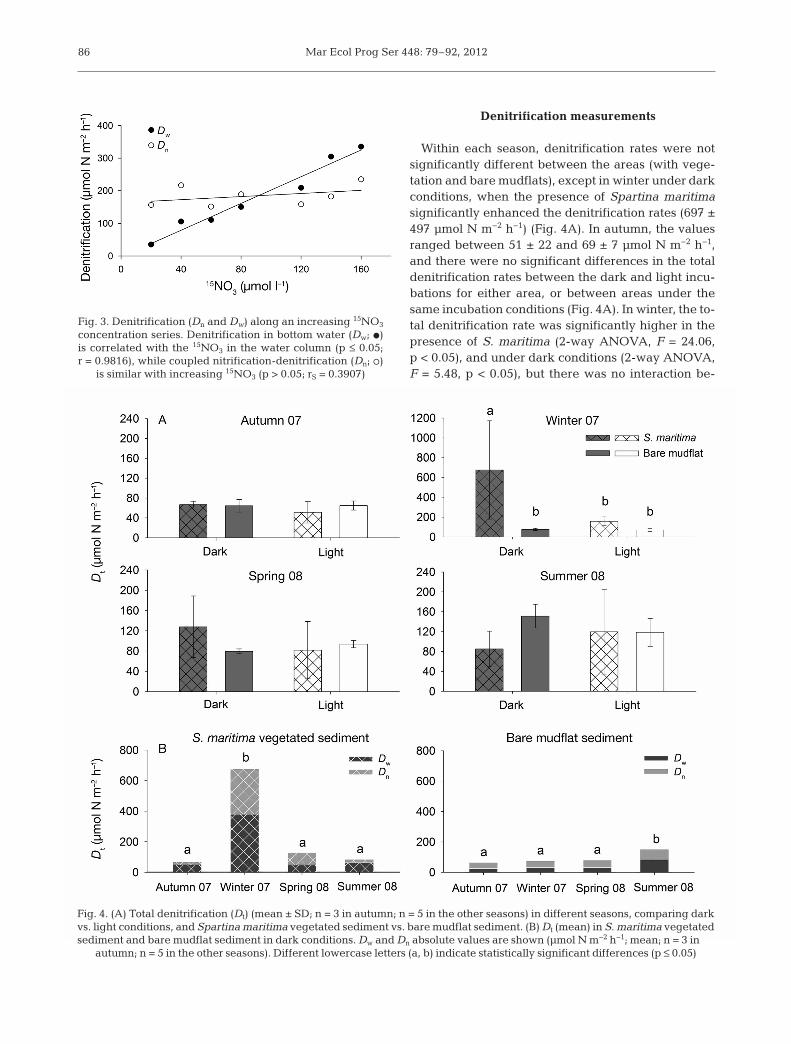
Within each season, denitrification rates were notsignificantly different be tween the areas (with vege-tation and bare mudflats), except in winter under darkconditions, when the presence of Spar tina maritimasignificantly enhanced the denitrification rates (697 ±497 µmol N m−2 h−1) (Fig. 4A). In autumn, the valuesranged between 51 ± 22 and 69 ± 7 µmol N m−2 h−1,and there were no significant differences in the totaldenitrification rates between the dark and light incu-bations for either area, or between areas under thesame incubation conditions (Fig. 4A). In winter, the to-tal denitrification rate was significantly higher in thepresence of S. maritima (2-way ANOVA, F = 24.06,p < 0.05), and under dark con ditions (2-way ANOVA,F = 5.48, p < 0.05), but there was no interaction be-
86
Fig. 3. Denitrification (Dn and Dw) along an increasing 15NO3
concentration series. Denitrification in bottom water (Dw; d)is correlated with the 15NO3 in the water column (p ≤ 0.05;r = 0.9816), while coupled nitrification-denitrification (Dn; s)
is similar with increasing 15NO3 (p > 0.05; rS = 0.3907)
Fig. 4. (A) Total denitrification (Dt) (mean ± SD; n = 3 in autumn; n = 5 in the other seasons) in different seasons, comparing darkvs. light conditions, and Spartina maritima vegetated sediment vs. bare mudflat sediment. (B) Dt (mean) in S. maritima vegetatedsediment and bare mudflat sediment in dark conditions. Dw and Dn absolute values are shown (µmol N m−2 h−1; mean; n = 3 in
autumn; n = 5 in the other seasons). Different lowercase letters (a, b) indicate statistically significant differences (p ≤ 0.05)
Sousa et al.: Denitrification in salt marshes
tween these 2 variables (Fig. 4A). Inspring, the values ranged between 80± 5 and 128 ± 61 µmol N m−2 h−1, andthere were no significant differencesin the total denitrification rates be-tween the areas under the same incu-bation conditions, or be tween darkand light incubations within eacharea. In addition, there were no differ-ences in the summer incubations be-tween either type of sediment (vege-tated vs. bare mudflat) or light vs. darkconditions; values ranged between 85± 36 and 151 ± 24 µmol N m−2 h−1 (Fig.4A). Fig. 4B shows that, for the darkconditions, denitrification rates in thebare mudflat areas were significantlyhigher in summer, whereas in colo-nized areas the denitrification rateswere sig nificantly higher in winter.Between seasons and within each sea-son, the contributions of Dn and Dw tothe denitrification rates between theareas (with vegetation and bare mud-flat) did not show a clear trend (Fig.4B, see Table 3).
The PCA (Fig. 5) showed that theprincipal components 1 and 2 ex -plained 77% of the variance. Fig. 5shows that principal component 1,which explained 47% of the variance,clearly separated autumn and winterfrom spring and summer seasons onthe right side of the axis (positive values). The right side of the axis ischaracterized by higher concentra-tions of nitrate, lower salinity, higherpotential nitrification, and higher de -nitrification under dark conditions;whereas the left side of the axis (negative values) is characterized byhigher temperature, presence of fau na, and higher concentrations ofammonium. Principal component 2,which explained 30% of the variance,clearly separates winter from autumn,where as spring and summer are notdifferentiated. In summary, winterwas clearly different from the otherseasons and characterized by compar-atively higher potential nitrificationand higher denitrification rates underdark conditions.
87
Veg
etat
ed s
edim
ent
Un
veg
etat
ed s
edim
ent
Ref
eren
ceA
utu
mn
Win
ter
Sp
rin
gS
um
mer
Au
tum
nW
inte
rS
pri
ng
Su
mm
er
Tag
us
estu
ary,
D
t51
−67
158−
676
82−
128
85−
120
64−
6571
−76
80−
9411
9−15
1P
rese
nt
stu
dy
Por
tug
alD
w19
−48
57−
381
34−
4637
−63
24−
2723
−32
32−
4341
−81
Dn
19−
3210
2−29
548
−81
22−
8338
−40
44−
4847
−51
70−
78
Tag
us
estu
ary,
D
t−
−−
−0−
100
(R)
20−
250
(R)
−0−
50 (
R)
Cab
rita
& B
rota
s (2
000)
a
Por
tug
al0−
35 (
P)
45−
150
(P)
0−55
(P
)D
w−
−−
−10
−30
(R
)10
−24
(R)
−0−
10 (
R)
0−28
(P
)0−
38(P
)−
0−13
(P
)D
n−
−−
−0−
65 (
R)
5−20
0(R
)−
0−12
(R
)0−
10 (
P)
0−55
(P
)0−
40 (
P)
Ven
ice
lag
oon
, Ita
lyD
t12
5−25
0−
21−
125
7−21
143−
286
−72
−14
314
−43
Eri
ckso
n e
t al
. (20
03)b
Col
ne
Poi
nt,
En
gla
nd
Dt
8.3
−−
−−
Azi
z &
Ned
wel
l (1
986)
c
Gre
at S
ipp
ewis
sett
mar
sh, U
SA
Dt
75−
−−
−W
hit
e &
How
es (
1994
)d
Poi
nte
-au
-Pèr
e, C
anad
aD
t11
−25
6−15
−18
−42
−−
−−
Pou
lin
et
al. (
2007
)e
Ker
tin
ge
Nor
, Den
mar
kD
t−
−−
−3−
535
−75
20−
307.
5−12
.5R
ysg
aard
et
al. (
1995
)D
w−
−−
−1
10−
1610
−15
3D
n−
−−
−2−
520
−60
7.5−
157.
5−12
.5
Est
uar
ine
fjor
d, D
enm
ark
Dt
−−
−−
−29
8−17
5C
hri
sten
sen
et
al. (
2000
)
a R: R
osár
io s
alt
mar
sh; P
: Pan
cas
salt
mar
sh. b
Dat
a in
bar
e m
ud
flat
col
um
n c
orre
spon
ds
to c
reek
sed
imen
t; s
tud
y p
erfo
rmed
wit
h L
imon
ium
ser
otin
um
. c Stu
dy
per
-fo
rmed
wit
h P
ucc
inel
ia/H
alim
ion
e. d
Cap
e C
od,
MA
, U
SA
; st
ud
y p
erfo
rmed
wit
h S
par
tin
a al
tern
iflo
ra.
e St.
Law
ren
ce e
stu
ary,
Can
ada;
stu
dy
per
form
ed w
ith
Sp
arti
na
alte
rnif
lora
Tab
le 3
. Sea
son
al o
r an
nu
al d
enit
rifi
cati
on (
µm
ol N
m–2
h–
1)
in s
alt
mar
shes
: un
veg
etat
ed a
nd
veg
etat
ed s
edim
ent
abil
ity
to r
emov
e N
in s
alt
mar
shes
th
rou
gh
den
itri
fi-
cati
on. A
ll t
hes
e st
ud
ies
wer
e p
erfo
rmed
usi
ng
15N
, an
d v
alu
es s
how
n in
clu
de
bot
h li
gh
t an
d d
ark
incu
bat
ion
s (s
ing
le v
alu
es c
orre
spon
d t
o th
e m
ean
, wh
ile
ran
ges
cor
-re
spon
d t
o m
inim
um
an
d m
axim
um
val
ues
rec
ord
ed).
Val
ues
for
Dtar
e sh
own
in b
old
Mar Ecol Prog Ser 448: 79–92, 2012
DISCUSSION
The role of denitrification as a N removal processhas been demonstrated across several ecosystemtypes (from agricultural landscapes to aquatic eco -systems, namely marine, estuarine, and freshwatersystems) (e.g. Cornwell et al. 1999, David et al. 2006,Seitzinger et al. 2006). In addition, other pathwayscontribute to this N removal in aquatic ecosystems(salt marshes included), such as dissimilatory nitratereduction to ammonium (DNRA), or autotrophicpath ways, such as anammox (anaerobic ammoniumoxidation) or chemoautotrophic denitrification viasulfur or iron oxidation; the magnitude of whichdepends on the ecosystem type and its inherent char-acteristics (Eriksson et al. 2003, Risgaard-Petersen etal. 2004b, Dalsgaard et al. 2005, Burgin & Hamilton2007, Poulin et al. 2007).
The biogeochemistry of the salt marshes’ sediment(and consequently, the nitrogen removal capacity)depends on a complex interaction of biotic andabiotic factors. In the present work, denitrification
rate and nutrient flux measurementsshowed some variability within each sea-son and within sites, as also reported inother works (e.g. Cabrita & Brotas 2000,Eriksson et al. 2003, Poulin et al. 2007). Ac-cordingly, differences within and amongsites, result from the natural variabilitywithin each system, given the number ofparameters/variables that may interactand influence all of these processes. Thesevariables can include the abundance ofbiota (from microorganisms to macrofauna,and from MPB to macrophytes), whichmay have an interacting effect on theaforementioned biogeochemical proces -ses (e.g. Lille bø et al. 1999, Eriksson etal. 2003, Gilbert et al. 2003, Risgaard- Petersen 2003, Hou et al. 2007). Despitethe inherent environmental variability, it isimportant to understand the contributionof salt marshes to the removal of excess ni-trogen through denitrification in coastalareas. Even though denitrification is an im-portant reactive nitrogen sink (David et al.2006), there are still uncertainties concern-ing the fate of all land-derived nitrogen(Galloway et al. 2004). Thus, even in heavily altered regions, rivers (importantsources of nitrogen to coastal systems) rep-resent small sources of reactive ni trogen tothe open ocean (Gallo way et al. 2008).
Potential nitrification can be re garded as a proxyfor abundance of active nitrifiers (Risgaard-Petersenet al. 2004a). In the Tagus estuary, potential nitrifica-tion rates were significantly higher in autumn andwinter, and there were no statistically significant dif-ferences between bare mudflat and Spartina mari -tima vegetated sediment. Two main reasons couldexplain these seasonal differences: (1) in this warm-temperate system, the water temperature in autumn/winter ranges between 15 and 17°C, which corre-sponds to the higher end of the temperatures thattemperate estuaries generally ex perience duringwinter (e.g. Lillebø et al. 2005); (2) during the warmergrowing season, plants and MPB may outcompetenitrifiers (Cabrita & Brotas 2000).
Total denitrification ranged be tween 64 ± 13 and151 ± 24 µmol N m−2 h−1 in the bare mudflat sedi-ment, and between 51 ± 22 and 676 ± 497 µmol N m−2
h−1 in Spartina maritima vegetated sediment. As awhole, denitrification was not higher in the marsh,considering the seasons and dark/light conditions.However, under dark winter conditions, the rates
88
Fig. 5. PCA results, showing principal components 1 and 2 for environ-mental variable vectors (nitrate [NO3], ammonium [NH4], temperature,salinity, denitrification in dark conditions [DDark], microphytobenthos[MPB], fauna, potential nitrification [PotNit], and the seasons; A: autumn;W: winter; Spr: spring; and S: summer). Sp: Spartina maritima vegetated
sediment; Bm: bare mudflat sediment
Sousa et al.: Denitrification in salt marshes
were significantly higher in the vegetated sediment,meaning that at least during winter, areas colonizedby S. maritima en hance the removal of nitrogenthrough denitrification. As shown in the PCA, thisseems to be related to the higher potential nitrifica-tion, as well as to the higher availability of inorganicnitrogen (namely nitrate) in the water column. Theseresults are in agreement with those of other studies(Koch et al. 1992, Eriksson et al. 2003, Piña-Ochoa &Álvarez-Cobelas 2006, Koop-Jacobsen & Giblin2009). The greater availability of nitrate, derivedfrom freshwater inputs during winter (Lillebø et al.2005), reduces the competition for nitrogen withinthe sediment and may contribute to higher denitrifi-cation levels (Rysgaard et al. 1995, Ogilvie et al.1997, Cabrita & Brotas 2000). Accordingly, on a dailybasis (day and night fluxes), winter was the seasonwith the highest net consumption of NOx−N. More-over, there was less competition between plants andMPB and nitrifiers during winter, especially underdark conditions, due to a lower NH4−N uptake (Rys-gaard et al. 1993, 1995, Risgaard-Petersen et al. 1994,Lillebø et al. 2002). In addition, O2 diffusion throughthe plant aerenchyma, namely in S. maritima (Car-taxana & Lloyd 1999), and the creation of oxic micro-zones at the rhizosphere may increase Dn (Koop-Jacobsen & Giblin 2010), which may explain ourresults. Conversely, bare mudflat sediment showedhigher denitrification rates in summer under darkconditions. Considering the previous work carriedout in the Tagus estuary (Cabrita & Brotas 2000), itwas expected that denitrification rates in bare mud-flat were higher during winter, as occurred in thevegetated sediment. The higher abundance of activenitrifiers recorded in winter than in summer (giventhe potential nitrification rates) could ultimately leadto higher denitrification rates. However, denitrifica-tion rates in winter were lower than in summer.Accordingly, it should be taken into account thatdenitrification rates obtained in the present studyin winter (bare mudflats) are within the rangesobtained by Cabrita & Brotas (2000) in the same estu-ary and season. Nevertheless, further studies shouldbe performed in order to better understand this bio-geochemical process. Differen ces in the summerdenitrification rates between bare mudflat andS. maritima vegetated sediment may have been dueto the less abundant MPB community in the baremudflat (<50% chl a content in the surface sedi-ment), meaning that there was only minor competi-tion between MPB and nitrifiers, in addition to theabsence of plants, which also compete for nitrogensources.
Table 3 summarizes the results of the literaturereview of seasonal and annual denitrification rates inthe salt marshes measured using a 15N tracer. TheTagus estuary denitrification rates in bare mudflatsediment were within the same range as in theVenice lagoon (Eriksson et al. 2003), as well as withinthe range previously recorded in the Tagus estuary(Cabrita & Brotas 2000), but they were higher thanthose recorded in Denmark (Rysgaard et al. 1995,Christensen et al. 2000). On the other hand, the den-itrification rates in the Tagus areas colonized bySpartina maritima were comparatively higher than inother vegetated sediments, namely Limonium sero -tinum in the Venice lagoon (Eriksson et al. 2003). Thecomparison with other vegetated sediments, namelyS. alterniflora (Valiela & Teal 1979, White & Howes1994) and Puccinelia/Halimione (Aziz & Nedwell1986 in White & Howes 1994) becomes limited due todifferences in the methodologies used, even thoughthey were all were based on tracing 15N (for moredetailed information about the methodologies usedsee the review by Cornwell et al. 1999). Neverthe-less, differences between comparable results may bedue to: (1) species-specific interactions, i.e. differentsalt marsh species may create specific rhizo sphereeffects, depending on their life cycles, physiology,root systems, and nutritional status, and thus influ-ence the microbial community and competition withnitrifiers; (2) bioturbation and bioirrigation, i.e. ben-thic fauna diversity and abundance will also changethe redox state of the sediment and thus influencenutrient fluxes and the microbial community; (3) theMPB, which may also change the top sediment redoxstate and compete with the microbial community fornutrients; (4) geographical environmental character-istics, namely temperature range and seasonal avail-ability of nitrate. More specifically, differences indenitrification rates between ecosystems may be dueto several physical, chemical, and biological factors,such as temperature, light, NO3 concentrations, oxy-gen availability, benthic microalgae, benthic fauna,and the presence/absence of plants (e.g. Kaplan et al.1979, Valiela & Teal 1979, Risgaard-Petersen et al.1994, Cornwell et al. 1999, Herbert 1999, Eriksson etal. 2003, Pinã-Ochoa & Alvarez-Cobelas 2006, Poulinet al. 2007, Koop-Jacobsen & Giblin 2009).
Seasonally, the relative contribution of Dn and Dw
to total denitrification in the bare mudflats was rathersimilar. In sediments colonized by Spartina maritima,the relative contribution of Dn and Dw to total denitri-fication was more variable, although no clear sea-sonal variation was found. As shown in other studies,one could expect an increased contribution of Dw in
89
Mar Ecol Prog Ser 448: 79–92, 2012
winter due to an increase in NO3 availability in thewater column (e.g. Rysgaard et al. 1995, Ogilvie et al.1997). In the Tagus estuary, Cabrita & Brotas (2000)only observed a relatively small seasonal increase inDw in one of their bare mudflat study sites. As des -cribed earlier, many variables can control the pro-cesses behind Dn, which renders Dn rates highly vari-able. Nitrification process is generally limited by lowoxygen and ammonium concentrations (Henriksen &Kemp 1988). In turn, oxygen penetration depends onplant and microbial activity and infauna bioturbation(Cartaxana & Lloyd 1999, Maricle & Lee 2002, Nizzoliet al. 2007, Volkenborn et al. 2007), whilst ammo-nium availability depends on the balance betweenammonification and processes using NH4
+ (e.g. up -take by primary producers and nitrification). There-fore, both nitrification and Dn may be affected bythese variables.
On the whole, denitrification is influenced by mul-tiple interacting variables (Seitzinger 1988, Thomp-son 1995, Cornwell et al. 1999, Piña-Ochoa & Ál -varez-Cobelas 2006, Silvennoinen et al. 2008), whichmay result in an inherent variability under identicalexperimental conditions. The present study showedthat there is a significantly higher contribution ofSpartina maritima marshes to N removal during win-ter. However, on an annual basis, and consideringthe seasonal variations observed, it cannot be con-cluded whether or not denitrification in the vege-tated sediment is significantly different from the baremudflats.
Acknowledgements. The Portuguese Foundation for Sci-ence and Technology supported this study through a PhDgrant to A.I.S. (SFRH/BD/23634/2005) and through fundinggiven to the Associated Laboratory CESAM (Centro de Estu-dos do Ambiente e do Mar). The authors are also grateful tothe colleagues who helped in the laboratory incubations andmacrofauna identification.
LITERATURE CITED
Bendschneider K, Robinson RJ (1952) A new spectrophoto-metric method for the determination of nitrite in seawater. J Mar Res 11: 87−96
Best M, Massey A, Prior A (2007) Developing a saltmarshclassification tool for the European water frameworkdirective. Mar Pollut Bull 55: 205−214
Boorman LA (2003) Saltmarsh review: an overview ofcoastal saltmarshes, their dynamic and sensitivity char-acteristics for conservation and management. JNCC,Peterborough. On-line version at http: //www.jncc.gov.uk/pdf/jncc334.pdf Accessed 14 Oct 2009
Burgin AJ, Hamilton SK (2007) Have we overemphasizedthe role of denitrification in aquatic ecosystems? Areview of nitrate removal pathways. Front Ecol Environ5: 89−96
Cabrita MT, Brotas V (2000) Seasonal variation in denitrifi-cation and dissolved nitrogen fluxes in intertidal sedi-ments of the Tagus estuary. Mar Ecol Prog Ser 202: 51−65
Caçador I, Costa AL, Vale C (2007) Nitrogen sequestrationcapacity of two salt marshes from the Tagus estuary.Hydrobiologia 587: 137−145
Cartaxana P, Lloyd D (1999) N2, N2O and O2 profiles in aTagus estuary salt marsh. Estuar Coast Shelf Sci 48: 751−756
Christensen PB, Rysgaard S, Sloth NP, Dalsgaard T,Schwaerter S (2000) Sediment mineralization, nutrientfluxes, denitrification and dissimilatory nitrate reductionto ammonium in an estuarine fjord with sea cage troutfarms. Aquat Microb Ecol 21: 73−84
Costanza R, d’Arge R, de Groot R, Farber S and others (1997)The value of the world’s ecosystem services and naturalcapital. Nature 387: 253−260
Dalsgaard T, Nielsen LP, Brotas V, Viaroli P and others(2000) Protocol handbook for NICE — nitrogen cycling inestuaries: a project under the EU research programme: Marine Science and Technology (MAST III). NationalEnvironmental Research Institute, Silkeborg, Denmark
Dalsgaard T, Thamdrup B, Canfield DE (2005) Anaerobicammonium oxidation (anammox) in the marine environ-ment. Res Microbiol 156: 457−464
David MB, Wall LG, Royer TV, Tank JL (2006) Denitrifica-tion and the nitrogen budget of a reservoir in an agricul-tural landscape. Ecol Appl 16: 2177−2190
Dugdale RC, Wilkerson FP, Chai F, Feely R (2007) Size- fractionated nitrogen uptake measurements in the equa-torial Pacific and confirmation of the low Si-high-nitratelow-chlorophyll condition. Global Biogeochem Cycles21: 1−10
Edwards KR, Mills KP (2005) Aboveground and below-ground productivity of Spartina arteniflora (smooth cord-grass) in natural and created Louisiana salt marshes.Estuaries 28: 252−265
Eriksson PG, Svensson JM, Carrer GM (2003) Temporalchanges and spatial variation of soil oxygen consump-tion, nitrification and denitrification rates in a tidal saltmarsh of the Lagoon of Venice, Italy. Estuar Coast ShelfSci 58: 861−871
Eyre BD, Rysgaard S, Dalsgaard T, Christensen PB (2002)Comparison of isotope pairing and N2: Ar methods formeasuring sediment-denitrification-assumptions, modi-fications, and implications. Estuaries 25(6A): 1077−1087
Folk RL (1954) The distinction between grain size and min-eral composition in sedimentary-rock nomenclature.J Geol 62: 344−359
Galloway JN (1998) The global nitrogen cycle: changes andconsequences. Environ Pollut 102: 15−24
Galloway JN, Dentener FJ, Capone DG, Boyer EW and others (2004) Nitrogen cycles: past, present, and future.Biogeochemistry 70: 153−226
Galloway JN, Townsend AR, Erisman JW, Bekunda M andothers (2008) Transformation of the nitrogen cycle: recent trends, questions, and potential solutions. Science320: 889−892
Gameiro C, Cartaxana P, Brotas V (2007) Environmental dri-vers of phytoplankton distribution and composition inTagus estuary, Portugal. Estuar Coast Shelf Sci 75: 21−34
90
Sousa et al.: Denitrification in salt marshes
Gedan KB, Silliman BR, Bertness MD (2009) Centuries ofhuman-driven change in salt marsh ecosystems. Ann RevMar Sci 1: 117−141
Gilbert F, Stora G, Bonin P (1998) Influence of bioturbationon denitrification activity in Mediterranean coastal sedi-ments: an in situ experimental approach. Mar Ecol ProgSer 163: 99−107
Gilbert F, Aller RC, Hulth S (2003) The influence of macro-faunal burrow spacing and diffusive scaling on sedimen-tary nitrification and denitrification: an experimentalsimulation and model approach. J Mar Res 61: 101−125
Grasshoff K (1976) Methods of seawater analysis. VerlagChemie, Weinheim
Grasshoff K, Ehrhardt M, Kremling K (1983) Methods of sea-water analysis. Verlag Chemie, Weinheim
Green BC, Smith DJ, Earley SE, Hepburn LJ, UnderwoodGJC (2009) Seasonal changes in community compositionand trophic structure of fish populations of five saltmarshes along the Essex coastline, United Kingdom.Estuar Coast Shelf Sci 85: 247−256
Hansen JI, Henriksen K, Blackburn TH (1981) Seasonal dis-tribution of nitrifying bacteria and rates of nitrification incoastal marine sediments. Microb Ecol 7: 297−304
Hauxwell J, Valiela I (2004) Effects of nutrient loading onshallow seagrass-dominated coastal systems: patternsand processes. In: Nielsen S, Banta G, Pedersen M(eds) Estuarine nutrient cycling: the influence of pri-mary producers. Kluwer Academic Publishers, London,p 59−92
Henriksen K, Kemp WM (1988) Nitrification in estuarine andcoastal marine sediments: methods, patterns and regu-lating factors. In: Blackburn TH, Sorensen J (eds) Nitro-gen cycling in coastal marine environments. John Wileyand Sons, New York, p 207−250
Henriksen K, Hansen JI, Blackburn TH (1981) Rates of nitri-fication, distribution of nitrifying bacteria, and nitratefluxes in different types of sediment from Danish waters.Mar Biol 61: 299−304
Herbert RA (1999) Nitrogen cycling in coastal marineecosystems. FEMS Microbiol Rev 23: 563−590
Hou LJ, Liu M, Xu SY, Ou DN and others (2007) The effectsof semi-lunar spring and neap tidal change on nitrifica-tion, denitrification and N2O vertical distribution in theintertidal sediments of the Yangtze estuary, China.Estuar Coast Shelf Sci 73: 607−616
Howarth RW, Marino R (2006) Nitrogen as the limiting nutri-ent for eutrophication in coastal marine ecosystems: evolving views over three decades. Limnol Oceanogr51(1/2): 364−376
Howarth RW, Billen G, Swaney D, Townsend A and others(1996) Riverine inputs of nitrogen to the north AtlanticOcean: fluxes and human influences. Biogeochemistry35: 75−139
Hulth S, Aller RC, Canfield DE, Dalsgaard T and others(2005) Nitrogen removal in marine environments: recentfindings and future research challenges. Mar Chem 94: 125−145
Jaffe DA (2000) The nitrogen cycle. In: Jacobson MC, Charl-son RJ, Rodhe H, Orians GH (eds) Earth system science.Academic Press, San Diego, p 322−342.
Jeffrey SW, Humphrey GF (1975) New spectrophotometricequations for determining chlorophylls a, b, c1 and c2 inhigher plants, algae and natural phytoplankton. BiochemPhysiol Pflanz 167: 191−194
Jin B, Fu C, Zhong J, Li B, Chen J, Wu J (2007) Fish utiliza-
tion of a salt marsh intertidal creek in the Yangtze Riverestuary, China. Estuar Coast Shelf Sci 73: 844−852
Kaplan W, Valiela I, Teal JM (1979) Denitrification in saltmarsh ecosystem. Limnol Oceanogr 24: 726−734
Koch MS, Malby E, Oliver GA, Bakker SA (1992) Factorscontrolling denitrification rates of tidal mudflats andfringing salt marshes in south-west England. EstuarCoast Shelf Sci 34: 471−485
Koop-Jakobsen K, Giblin AE (2009) Anammox in tidalmarsh sediments: the role of salinity, nitrogen loading,and marsh vegetation. Estuar Coast 32: 238−245
Koop-Jakobsen K, Giblin AE (2010) The effect of increasednitrate loading on nitrate reduction via denitrificationand DNRA in salt marsh sediments. Limnol Oceanogr 55: 789−802
Koroleff F (1969/1970) Direct determination of ammonia innatural waters as indophenol blue. Int Counc Explor Sea(ICES) Comm Meet Pap 1969/C: 9; revised 1970: 19−22
Lillebø AI, Flindt MR, Pardal MA, Marques JC (1999) Popu-lation structure, dynamics and production of Hydrobiaulvae (Pennant) (Mollusca: Prosobranchia) along aneutrophication gradient in the Mondego estuary (Portu-gal). Acta Oecol 20: 289−304
Lillebø AI, Flindt MR, Pardal MA, Martins I, Neto JM, Mar-ques JC (2002) Nutrient dynamics in the intertidal poolsof the Mondego estuary. II. Seasonal efflux of PO4
−P andNH4
−N in bare bottom and vegetated pools. In: PardalMA, Marques JC, Graça MA (eds) Aquatic ecology of theMondego River basin. Global importance of local experi-ence. Imprensa da Universidade de Coimbra, Coimbra,p 257−272
Lillebø AI, Neto JM, Martins I, Verdelhos T and others(2005) Management of a shallow temperate estuary tocontrol eutrophication: the effect of hydrodynamics onthe system nutrient loading. Estuar Coast Shelf Sci 65: 697−707
Lorenzen CJ (1967) Determination of chlorophyll and pheo-pigments: spectrophotometric equations. LimnolOceanogr 12: 343−346
Madureira MJ, Vale C, Simões Gonçalves ML (1997) Effectof plants on sulphur geochemistry in the Tagus salt-marshes sediments. Mar Chem 58: 27−37
Maricle BR, Lee RW (2002) Aerenchyma development andoxygen transport in the estuarine cordgrasses Spartinaarteniflora and S. anglica. Aquat Bot 74: 109−120
Merrill JZ, Cornwell JC (2000) The role of oligohalinemarshes in estuarine nutrient cycling. In: Weinstein MP,Kreeger DA (eds) Concepts and controversies in tidalmarsh ecology. Kluwer Academic Press, Dordrecht, p 425−441
Nixon SW (1981) Remineralization and nutrient cycling incoastal marine ecosystems. In: Neilson BJ, Cronin LE(eds) Estuaries and nutrients. Humana Press, Clifton, NJ,p 111−138
Nixon SW (1995) Coastal marine eutrophication: a defini-tion, social causes, and future concerns. Ophelia 41: 199−219
Nizzoli D, Bartoli M, Cooper M, Welsh DT, Underwood GJC,Viaroli P (2007) Implications for oxygen, nutrient fluxesand denitrification rates during the early stage of sedi-ment colonisation by the polychaete Nereis spp. in fourestuaries. Estuar Coast Shelf Sci 75: 125−134
91
Mar Ecol Prog Ser 448: 79–92, 2012
Ogilvie B, Nedwell DB, Harrison RM, Robinson A, Sage A(1997) High nitrate, muddy estuaries as nitrogen sinks: the nitrogen budget of the River Colne estuary (UnitedKingdom). Mar Ecol Prog Ser 150: 217−228
Piña-Ochoa E, Álvarez-Cobelas M (2006) Denitrification inaquatic environments: a cross-system analysis. Biogeo-chemistry 81: 111−130
Poulin P, Pelletier E, Saint-Louis R (2007) Seasonal variabil-ity of denitrification efficiency in northern salt marshes: an example from the St. Lawrence estuary. Mar EnvironRes 63: 490−505
Reboreda R, Caçador I (2007) Halophyte vegetation influ-ences in salt marsh capacity retention for heavy metals.Environ Pollut 146: 147−154
Reddy KR, Patrick WH, Lindau CH (1989) Nitrification- denitrification at the plant root-sediment interface inwetlands. Limnol Oceanogr 34: 1004−1013
Risgaard-Petersen N (2003) Coupled nitrification-denitrifi-cation in autotrophic and heterotrophic estuarine sedi-ment: on the influence of benthic microalgae. LimnolOceanogr 48: 93−105
Risgaard-Petersen N, Ottosen LDM (2000) Nitrogen cyclingin two temperate Zostera marina beds: seasonal varia-tion. Mar Ecol Prog Ser 198: 93−107
Risgaard-Petersen N, Rysgaard S, Nielsen LP, Revsbech NP(1994) Diurnal variation of denitrification and nitrifica-tion in sediments colonized by benthic microphytes. Lim-nol Oceanogr 39: 573−579
Risgaard-Petersen N, Nicolaisen MH, Revsbech NP, Lomstein BA (2004a) Competition between ammonia-oxidizing bacteria and benthic microalgae. Appl EnvironMicrobiol 70: 5528−5537
Risgaard-Petersen N, Meyer RL, Schmid M, Jetten MSM,Enrich-Prast A, Rysgaard S, Revsbech NP (2004b) Anaer-obic ammonium oxidation in an estuarine sediment.Aquat Microb Ecol 36: 293−304
Rysgaard S, Risgaard-Petersen N, Nielsen LP, Revsbech NP(1993) Nitrification and denitrification in lake and estu -arine sediments measured by the 15N dilution techniqueand isotope pairing. Appl Environ Microbiol 59: 2093−2098
Rysgaard S, Risgaard-Petersen N, Sloth NP, Jensen K,Nielsen LP (1994) Oxygen regulation of nitrification anddenitrification in sediments. Limnol Oceanogr 39(7): 1643−1652
Rysgaard S, Christensen PB, Nielsen LP (1995) Seasonalvariation in nitrification and denitrification in estuarinesediment colonized by benthic microalgae and biotur-bating infauna. Mar Ecol Prog Ser 126: 111−121
Schlesinger WH (1997) Biogeochemistry, 2nd edn. Acade-mic Press, San Diego
Seitzinger SP (1988) Denitrification in fresh and coastalmarine ecosystems: ecological and geochemical signifi-cance. Limnol Oceanogr 33: 702−724
Seitzinger S, Harrison JA, Böhlke JK, Bouwman AF and others (2006) Denitrification across landscapes andwaterscapes: a synthesis. Ecol Appl 16: 2064−2090
Silvennoinen H, Liikanen A, Torssonen J, Stange CF, Mar-tikainen PJ (2008) Denitrification and N2O effluxes in the
Bothnian Bay (northern Baltic Sea) river sediments asaffected by temperature under different oxygen concen-trations. Biogeochemistry 88: 63−72
Simas TC, Ferreira JG (2007) Nutrient enrichment and therole of salt marshes in the Tagus estuary (Portugal).Estuar Coast Shelf Sci 75: 393−407
Simas T, Nunes JP, Ferreira JG (2001) Effects of global climate change on coastal salt marshes. Ecol Modell 139: 1−5
Sousa AI, Lillebø AI, Caçador I, Pardal MA (2008) Contribu-tion of Spartina maritima to the reduction of eutrophica-tion in estuarine systems. Environ Pollut 156: 628−635
Steingruber SM, Friedrich J, Gachter R, Wehrli B (2001)Measurement of denitrification in sediments with the 15Nisotope pairing technique. Appl Environ Microbiol 67: 3771−3778
Sundbäck K, Miles A, Linares F (2006) Nitrogen dynamics innontidal littoral sediments: Role of microphytobenthosand denitrification. Estuar Coast 29: 1196−1211
Teal JM, Howes BL (2000) Salt marsh values: retrospectionfrom the end of the century. In: Weinstein MP, KreegerDA (eds) Concepts and controversies in tidal marsh eco logy. Kluwer Academic Publishing, Dordrecht, p 9−22
Thompson SP (1995) Seasonal pattern of nitrification anddenitrification in a natural and a restored salt marsh.Estuaries 18: 399−408
Trimmer M, Gowen RJ, Stewart BM (2003) Changes in sedi -ment processes across the western Irish Sea front. EstuarCoast Shelf Sci 56: 1011−1019
Valiela I, Cole ML (2002) Comparative evidence that saltmarshes and mangroves may protect seagrass meadowsfrom land-derived nitrogen loads. Ecosystems (NY) 5: 92−102
Valiela I, Teal JM (1979) The nitrogen budget of a salt marshecosystem. Nature 280: 652−656
Valiela I, Cole ML, McClelland J, Hauxwell J, Cebrian J,Joye SB (2000) Role of salt marshes as part of coastallandscapes. In: Weinstein MP, Kreeger DA (eds) Con-cepts and controversies in tidal marsh ecology. KluwerAcademic Publishers, Dordrecht, p 23−38
Vitousek PM, Howarth RW (1991) Nitrogen limitation onland and in the sea: how can it occur? Biogeochemistry13: 87−115
Vitousek PM, Aber J, Bayley SE, Howarth RW and others(1997) Human alteration of the global nitrogen cycle: causes and consequences. Ecol Appl 7: 737−750
Volkenborn N, Hedtkamp SIC, van Beusekom JEE, Reise K(2007) Effects of bioturbation and bioirrigation by lug-worms (Arenicola marina) on physical and chemicalsedi ment properties and implications for intertidal habi-tat succession. Estuar Coast Shelf Sci 74: 331−343
White DS, Howes BL (1994) Long-term 15N-nitrogen reten-tion in the vegetated sediments of a New England saltmarsh. Limnol Oceanogr 39: 1878−1892
Wieski K, Guo H, Craft CB, Pennings SC (2010) Ecosystemfunctions of tidal fresh, brackish, and salt marshes on theGeorgia coast. Estuar Coast 33: 161−169