Density Data Gap Filling Marine Geospatial Ecology Lab Duke University November 14 – 16, 2012 Marine Mammal Density Data Gap Assessments and Update for the Phase III AFTT Study Area Workshop objectives
Transcript
Density Data Gap Filling
Marine Geospatial Ecology LabDuke University
November 14 – 16, 2012
Marine Mammal Density Data Gap Assessments and Update for
the Phase III AFTT Study Area
Workshop objectives
Day 1 Review
• Meeting overview• Needs (Navy, NOAA…)• Context• Existing Density Models• Acoustic Effects Model Needs• Available Data
Atlantic Fleet Testing & Training – AFTT study area
Atlantic & Gulf of Mexico
Filling Density Data Gaps Density of protected species ship & aircraft surveys
Atlantic Fleet Testing & Training Area
?
???
??
The offshore-distant data-gap problem….
Filling Density Data Gaps Density of protected species ship & aircraft surveys
?
The port & pier-side data-gap problem….
Hierarchy of ApproachesA) Density spatial model based estimates will be used when available.B) If no density spatial model based estimates are available, the following can be used in order of preference:
– a) Density estimates using design-based methods incorporating line-transect survey
– data and involving spatial stratification (e.g., estimates split by depth strata or arbitrary survey sub-regions)
– b) Density estimates using design-based methods incorporating only line-transect survey data (i.e. regional density estimate, stock assessment report)
– c) Density estimates derived using a Relative Environmental Suitability (RES) model in conjunction with survey data.
C) In some cases extrapolation from neighboring regional density estimates or population/stock assessments is appropriate based on expert opinion.
2012 NMSDD NAVFAC Technical Report
The problem
• How do we provide best available information to fill cetacean density data gaps?
• How do we communicate uncertainty?• How do we prioritize new data collection
efforts?• How do we prioritize new modeling efforts?
Existing Approaches
• NMFS Stock assessments• Designed-based density estimation
– Stratified Designed-based density estimation• LTS / Habitat Based Density Models• Relative Environmental Suitability (RES) Models
Port & Pierside estuary scale
Regional Coastal shelf
(Large) Navy Testing & Training areas
Ocean Basin scales
Global scales
Spatial scales for hierarchical models
Navy Operational Areas scale
(RES models)
(LTS / Habitat-Based Density models)
Hierarchical / updatable Bayesian framework
Types of models
Source: Guisan & Zimmermann, 2000.
Different Statistical Approaches to Ecological Habitat Modeling
(a) Generalized Linear Model with second order polynomial terms;
(b) Generalized Additive Model with smoothed spline functions;
(c) Classification Tree (CART);
(d) Environmental Envelope models
(e) Canonical Correspondence Analysis;
(f) Bayesian models according to Aspinall (1992); pp posterior probability of presence of the modeled species, ppp a priori probability of presence, ppa a priori probability of absence, pcp product of conditional probability of presence of the various predictor classes, pca product of conditional probability of absence of the various predictor classes.
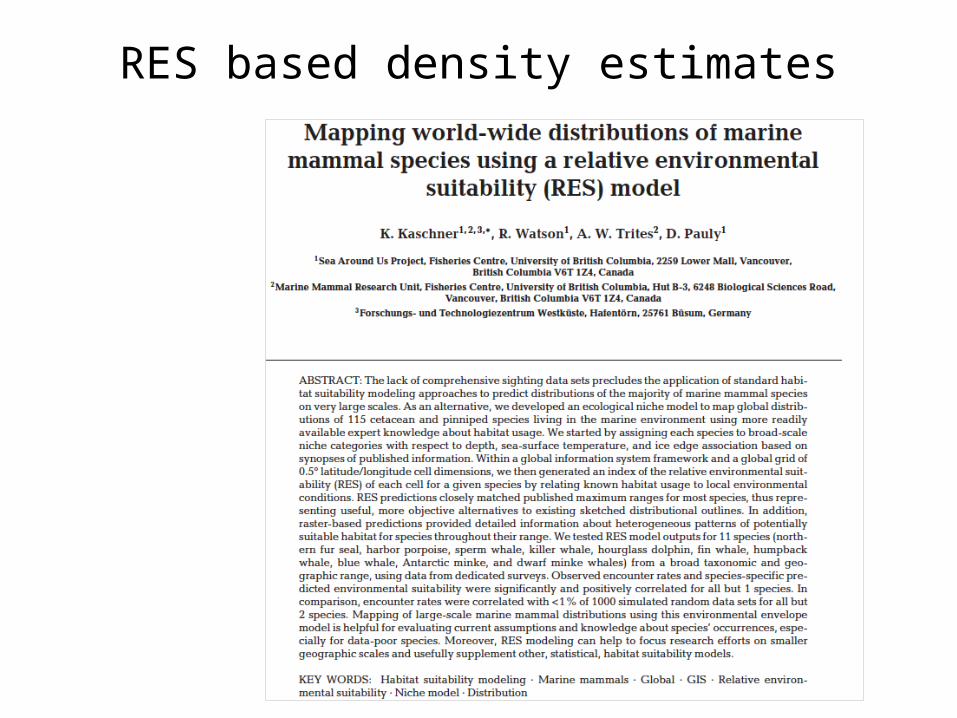
RES based density estimates
RES based density estimates
RES model predictors: (A) bathymetry (in m); (B) annual average sea-surface
temperature (SST, in °C), (C) mean annual distance to the
ice edge (in km)
RES based density estimatesData used to test RES model
Relative Environmental Suitability (RES) ModelKristin Kaschner, Sea Around Us Project, Fisheries
Centre, UBC [Version of April 2004]
http://www.seaaroundus.org/
where RESc represents the product of the generated RES in that cell c for D (depth), T (SST), distance from the ice edge (I) and, in some cases, from land (Dis), respectively
Method
Relative Environmental Suitability (RES) ModelKristin Kaschner, Sea Around Us Project, Fisheries
Centre, UBC [Version of April 2004]
http://www.seaaroundus.org/
RES model
Kaschner / SMRU
density estimates
Marine Mammal
observations by type
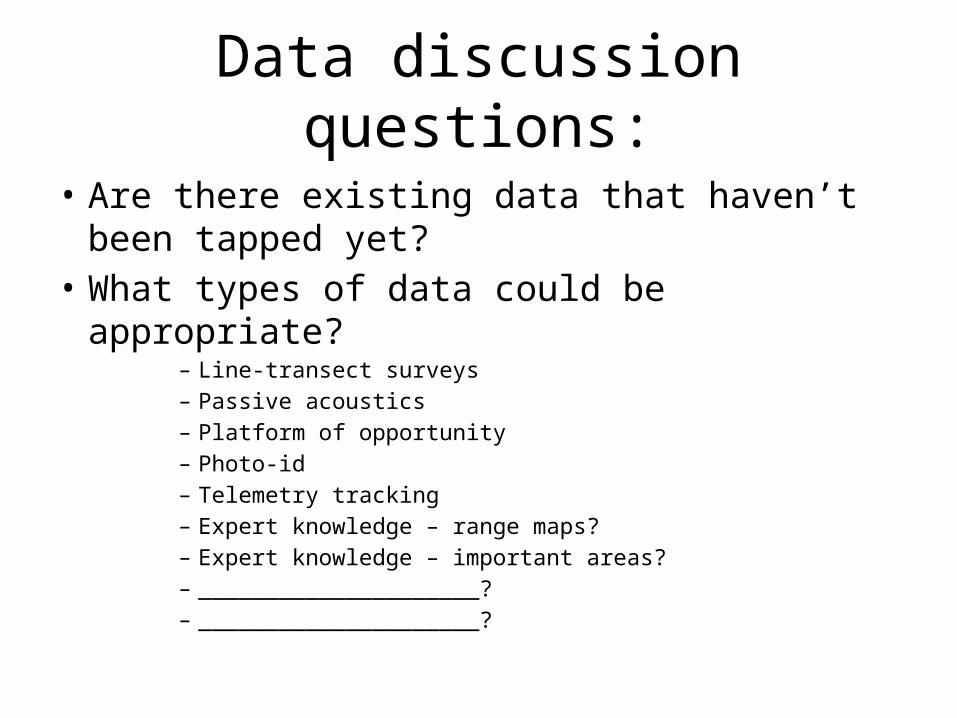
Data discussion questions:
• Are there existing data that haven’t been tapped yet?
• What types of data could be appropriate?– Line-transect surveys– Passive acoustics– Platform of opportunity– Photo-id– Telemetry tracking– Expert knowledge – range maps?– Expert knowledge – important areas?– _____________________?– _____________________?
Data discussion questions:
• What data can Navy use?• What data can NMFS use?• Will a data hierarchy be helpful?• __________________________?• __________________________?• __________________________?
Data discussion questions:
• How should we best use new data?– What is the best use of Navy monitoring data
collected in training ranges?– Validation testing vs. new model training?
GOODS
LME
Longhurst
Oliver & Irwin
Workshop Objectives
This workshop will explore the current state of the Navy Marine Species Density Database (NMSDD), the Navy Acoustic Effects Model (NAEMO), current animal density modeling efforts, and outline next steps for future marine animal density modeling.
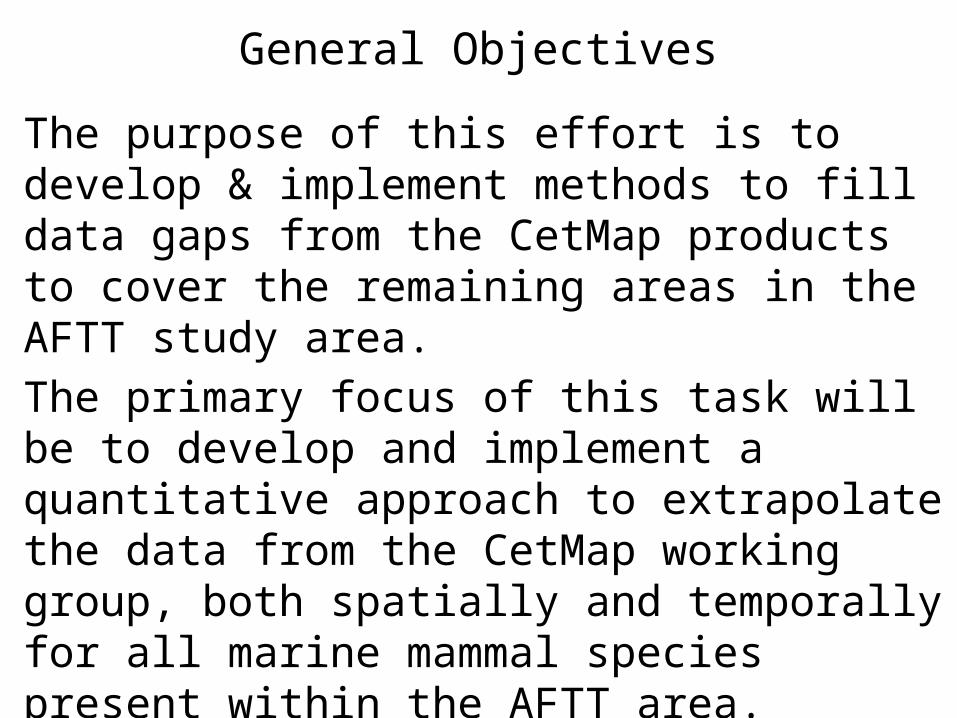
General Objectives
The purpose of this effort is to develop & implement methods to fill data gaps from the CetMap products to cover the remaining areas in the AFTT study area. The primary focus of this task will be to develop and implement a quantitative approach to extrapolate the data from the CetMap working group, both spatially and temporally for all marine mammal species present within the AFTT area.These marine density data will be the most up-to-date definitive data for acoustic effect analysis in the upcoming Phase III AFTT EIS.
Workshop Objectives
• Discuss making project outputs publically available and re-usable through the web and web services.
• Build consensus on next generation modeling approaches or ensembles for the USN Atlantic Testing and Training Range (AFTT).
• Discuss data gap assessment, gap filling methods, and creating a hierarchy of data quality
• Discuss the future beyond this modeling effort including data standards and model processes that enable repeatability of existing models.
Workshop Objectives
Additional objectives…• Set the stage for potential parallel efforts to be
conducted for Pacific training areas…• Begin the process of adding sea turtle density
The outcomes of this workshop are intended to directly inform future
priorities and activities
Workshop Objectives (1)Build consensus on next generation modeling approaches or ensembles for the USN Atlantic Testing and Training Range (AFTT).
General Discussion Topics:• Appropriate types of modeling approaches;• Error & uncertainty;• Model validation & testing;• Merging different models and information;
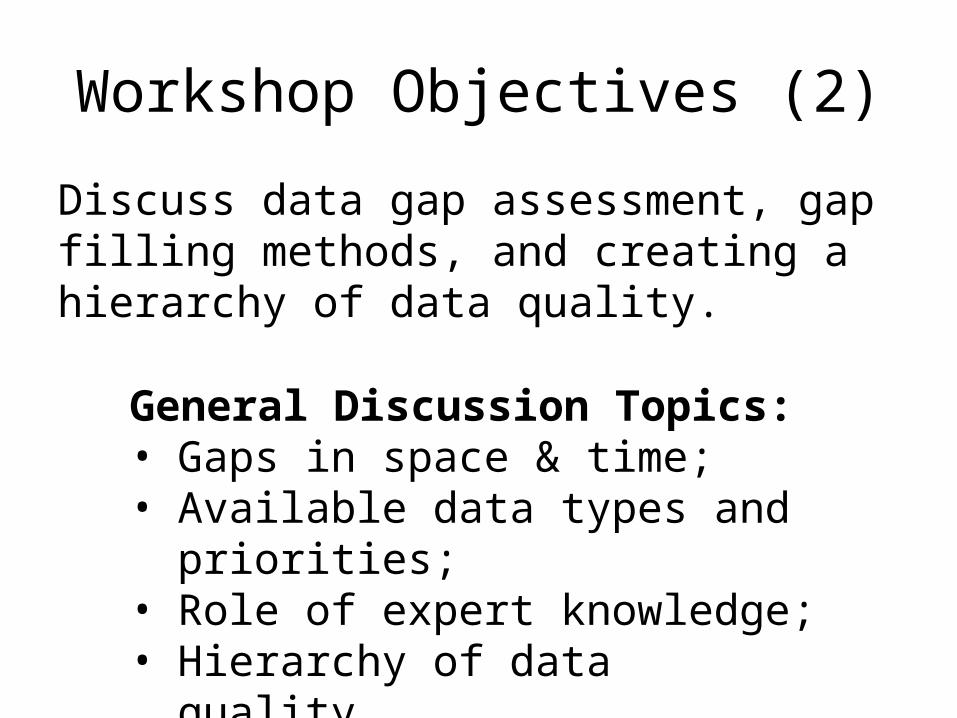
Workshop Objectives (2)
Discuss data gap assessment, gap filling methods, and creating a hierarchy of data quality.
General Discussion Topics:• Gaps in space & time;• Available data types and priorities;• Role of expert knowledge;• Hierarchy of data quality.
Workshop Objectives (3)
Discuss the future beyond this modeling effort including data standards and model processes that enable repeatability of existing models.
General Discussion Topics:• Data standards and classification of data types;• Best practice standards for models;• Ensemble models;
Workshop Objectives (4)
Discuss making project outputs publically available and re-usable through the web and web services.
General Discussion Topics:• Data and model delivery: clients & users;• Product types;• Discovery metadata services;• Data & model development, delivery & archival
process.
agenda
• Day 1, Wednesday November 14 – Problem Overview• (Executive Classroom)
• 10:00 AM Introduction • Welcome / Meeting Objectives (Pat)• Logistics (Ben D)• Introductions• • 10:30 AM Context and Programmatic Needs• Navy AFTT density modeling needs (Anu)• NOAA remarks (Jolie)
• Updates on ongoing projects• CetMap progress (discussion leads: Jolie, Pat)• AMAPPS (discussion leads: Debi, Lance)• Atlantic/GoMex modeling update (discussion leads: Pat, Ben B, Jason)• Pacific modeling update (discussion leads: Karin/Elizabeth) • 12:00 PM Lunch – Thomas Center dining room
Context & Updates
agenda• Day 1, Wednesday November 14 • 1:00 PM Extending density models• Overview of the problem (Pat)• Extent, seasonality, port/pierside• Navy Acoustic Effect model - NAEMO (discussion lead: TBD)• Sea Mammal Research Unit (SMRU) approaches and guidance (TBD)
• 2:00 PM Data Availability: Moderated Discussion• Hierarchy of Types• Line Transect Surveys• Passive Acoustics• Platforms of Opportunity, new and non-traditional data sources• Data Sources & Future data collection
– Navy – NOAA AMAPPS
• 3:00 PM Coffee Break/Free discussion • 3:30 PM Statistical Approaches: Moderated Discussion• Overview of existing modeling approaches (Pat)• Model types, Feasibility and implementation, Error and uncertainty, Selection and
validation, Edge matching• 4:45 PM End of day wrap up• 5:00 PM Break for the day
Problem definition& discussion
agenda• Day 2, Thursday, November 15 – Model Details • 9:00 AM Day 2 overview and goals• • 9:30 AM Model approach brainstorming• Statistical approaches for data poor regions• Ensemble approaches and model averaging
• 10:30 AM Coffee Break/Free Discussion• • 11:00 AM Extrapolation and Gap filling• Spatial gaps • Navy Ports / Pierside• Coastal• Pelagic• Temporal gaps• Seasonal Gaps• Taxonomic gaps• guilds, surrogates• Role of Expert Opinion• Validation of gap filling
• 12:00 PM Lunch – Thomas Center dining room
Potential solutions & approaches
agenda• Day 2, Thursday, November 15 – Model Details
• 1:00 PM Addressing error, uncertainty and standards• What is possible? What is required?• Creating an hierarchy of data quality• Standards to streamline incorporating new data into existing models • 3:00 PM Coffee Break • 3:30 PM Implementation Timelines
– Milestone map for implementation– NMSDD update process– Public and interagency access– Web services and upcoming technologies– Plan for third party guidance and review
• 4:45 PM End of day wrap up
– Modify and approve agenda for final day
• 5:00 PM Break for the day
Reality check: error, uncertainty, standards,
requirements & timelines
agenda
• Day 3, Friday, November 16 – Next Steps • 9:00 AM Review and next steps• Review responsibilities• Approve timeline • 10:30 AM Coffee Break • 10:45 AM Discussion and wrap up• Priorities• Next steps • 12:00 PM Lunch – Thomas Center dining room • 1:00 PM Meeting adjourns


![MARINE NH3 Ammonia as Marine Fuel · 2019. 12. 11. · MARINE NH3 Renewable Fuel Options Fuel type: Energy density LHV [MJ/kg] Volumetric energy density LHV [GJ/m3] Renewable synthetic](https://static.documents.pub/doc/80x56/5fdbecb9167767355544431e/marine-nh3-ammonia-as-marine-fuel-2019-12-11-marine-nh3-renewable-fuel-options.jpg)
