24
1 Dentsply Sirona First Quarter 2021 May 6, 2021

1
Dentsply SironaFirst Quarter 2021May 6, 2021
2
Forward-Looking Statements and Associated Risks
All statements in this presentation that do not directly and exclusively relate to historical facts constitute “forward-looking statements.” These statements represent current expectations and beliefs, and no assurance can be given that the results described in such statements will be achieved. Such statements are subject to numerous assumptions, risks, uncertainties and other factors that could cause actual results to differ materially from those described in such statements, many of which are outside of our control. Furthermore, many of these risks and uncertainties are currently amplified by and may continue to be amplified by or may, in the future, be amplified by, the novel coronavirus (“COVID-19”) pandemic and the impact of varying private and governmental responses that affect our customers, employees, vendors and the economies and communities where they operate. For a written description of these factors, see the section titled “Risk Factors” in Dentsply Sirona’s Annual Report on Form 10-K for the fiscal year ended December 31, 2020 and any updating information in subsequent SEC filings including the Company's Quarterly Report on Form 10-Q for the quarterly period ending March 31, 2021. No assurance can be given that any expectation, belief, goal or plan set forth in any forward-looking statement can or will be achieved, and readers are cautioned not to place undue reliance on such statements which speak only as of the date they are made. We do not undertake any obligation to update or release any revisions to any forward-looking statement or to report any events or circumstances after the date of this press release or to reflect the occurrence of unanticipated events.
3
Non-GAAP Financial Measures(3) Amortization of purchased intangible assets. This adjustment excludes the periodic amortization expense related to purchased intangible assets recorded in purchase accounting. Although these costs contribute to revenue generation and will recur in future periods, their amounts are significantly impacted by the timing and size of acquisitions.
(4) Credit risk and fair value adjustments. These adjustments include both the cost and income impacts of adjustments in certain assets and liabilities including the Company’s pension obligations, that are recorded through net income which are due solely to the changes in fair value and credit risk. These items can be variable and driven more by market conditions than the Company’s operating performance. As such, these items may not be indicative of past and future performance of the Company and therefore are excluded for comparability purposes.
(5) Income tax related adjustments. These adjustments include both income tax expenses and income tax benefits that are representative of income tax adjustments mostly related to prior periods, as well as the final settlement of income tax audits, and discrete tax items resulting from the implementation of restructuring initiatives and the vesting and exercise of employee share-based compensation. Income tax related adjustments may also include the impact to adjust the interim effective income tax rate to the expected annual effective tax rate. These adjustments are irregular in timing the variability in amounts may not be indicative of past and future performance of the Company and therefore are excluded for comparability purposes.
Both adjusted net income (loss) and adjusted EPS are important internal measures for the Company. The Company's senior management receives a monthly analysis of operating results that includes adjusted net income (loss) and adjusted EPS. The performance of the Company is measured on these metrics along with other performance metrics.
Adjusted Operating Income (Loss) and MarginIn addition to reporting operating income (loss) in accordance with US GAAP, the Company provides adjusted operating income (loss) and margin. The Company defines "adjusted operating income (loss)" as operating income (loss) in accordance with US GAAP excluding certain items noted above which are excluded on a pre-tax basis to arrive at adjusted operating income (loss), a Non-GAAP measure. The adjusted operating margin is calculated by dividing adjusted operating income (loss) by net sales. Both adjusted operating income (loss) and adjusted operating margin are important internal measures for the Company. The Company's senior management receives a monthly analysis of operating results that includes adjusted operating income (loss) and margin. The performance of the Company is measured on these metrics along with the adjusted net income (loss) and adjusted EPS metrics noted above as well as other performance metrics.
Non-GAAP Financial Measures
In addition to results determined in accordance with U.S. generally accepted accounting principles (“US GAAP”) the Company provides certain measures in this press release, described below, which are not calculated in accordance with US GAAP and therefore represent Non-GAAP measures. These Non-GAAP measures may differ from those used by other companies and should not be considered in isolation from, or as a substitute for, measures of financial performance prepared in accordance with US GAAP. The Company discloses these measures to allow investors to evaluate the performance of the Company’s operations exclusive of certain items that impact the comparability of results from period to period and which may not be indicative of past or future performance of the normal operations of the Company. The Company believes that this information is helpful in understandingunderlying operating results including net sales, operating income, and net income.
Organic Sales
The Company defines "organic sales" as the increase or decrease in net sales excluding: (1) net sales from acquired and divested businesses recorded prior to the first anniversary of the acquisition or divestiture, (2) net sales attributable to discontinued product lines in both the current and prior year periods, and (3) the impact of foreign currency translation, which is calculated by translating current period sales using the comparable prior periods currency conversion rates. Organic sales is an important internal measure for the Company. The Company's senior management receives a monthly analysis of operating results that includes organic sales and the performance of the Company is measured on this metric along with other performance metrics.
Adjusted Net Income (Loss) and Adjusted Earnings (Loss) per Diluted Common Share
The adjusted net income (loss) attributable to Dentsply Sirona consists of net income (loss) attributable to Dentsply Sirona adjusted to exclude the following:
(1) Business combination related costs and fair value adjustments. These adjustments include costs related to consummating and integrating acquired businesses, as well as net gains and losses related to the disposed businesses. In addition, this category includes the subsequent impact roll-off to the consolidated statements of operations which results from fair value adjustments related to business combinations, except for amortization expense of purchased intangible assets noted below. Although the Company is regularly engaged in activities to find and act on opportunities for strategic growth and enhancement of product offerings, the costs associated with these activities may vary significantly between periods based on the timing, size and complexity of acquisitions and as such may not be indicative of past and future performance of the Company. They are therefore excluded to allow investors to better understand underlying operating trends.
(2) Restructuring program related costs and other costs. These adjustments include costs related to the implementation of restructuring initiatives as well as certain other costs. These costs can include, but are not limited to, severance costs, facility closure costs, lease and contract termination costs and related professional service costs, duplicate facility and labor costs associated with specific restructuring initiatives. Other costs include legal settlements and impairments of assets. The Company's restructuring programs usually require several years to fully implemented and the Company is continually seeking to take actions that could enhance its efficiency. While restructuring charges are recurring, they are subject to significant fluctuations from period to period due to the varying levels of restructuring activity and the inherent imprecision in the estimates used to recognize the impairment of assets and the wide variety of costs and taxes associated with severance and termination benefits in the countries in which the restructuring actions occur.

4
First Quarter Agenda
Introduction Kari Dixon VP, FP&A
Overview Don Casey CEO
Financials & Outlook Jorge Gomez EVP & CFO
Operating Update Don Casey CEO
Q & A

5
Overview
Don CaseyChief Executive Officer
6
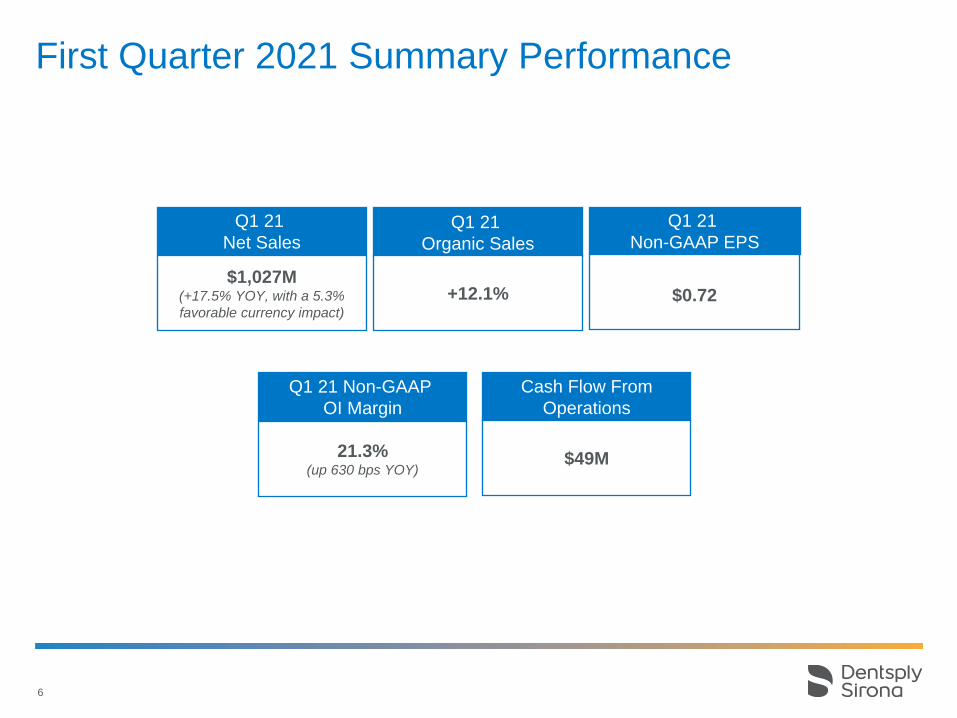
Q1 21
Net Sales
$1,027M(+17.5% YOY, with a 5.3%
favorable currency impact)
Q1 21
Organic Sales
+12.1%
Q1 21 Non-GAAP
OI Margin
21.3%(up 630 bps YOY)
Q1 21
Non-GAAP EPS
$0.72
Cash Flow From
Operations
$49M
First Quarter 2021 Summary Performance

7
Financials & Outlook
Jorge GomezEVP & Chief Financial Officer
8
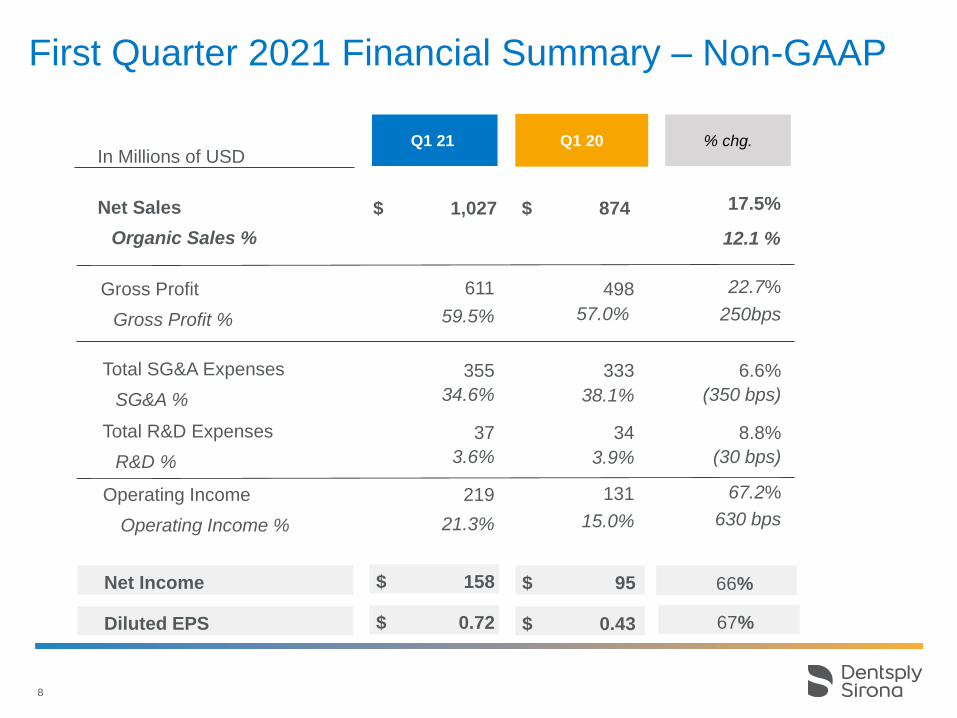
131219
8.8%3437Total R&D Expenses
6.6%355
22.7%611Gross Profit
17.5%$ 1,027
First Quarter 2021 Financial Summary – Non-GAAP
Q1 21 Q1 20 % chg.
Net Income
In Millions of USD
Net Sales
Organic Sales %
Gross Profit %
Total SG&A Expenses
SG&A %
Operating Income
Operating Income %
59.5%
34.6%
21.3%
$ 95
$ 874
498
57.0%
333
15.0%
66%
250bps
630 bps
38.1%
12.1 %
(350 bps)
Diluted EPS $ 0.43 67%
67.2%
R&D % 3.6% 3.9% (30 bps)
$ 158
$ 0.72
9
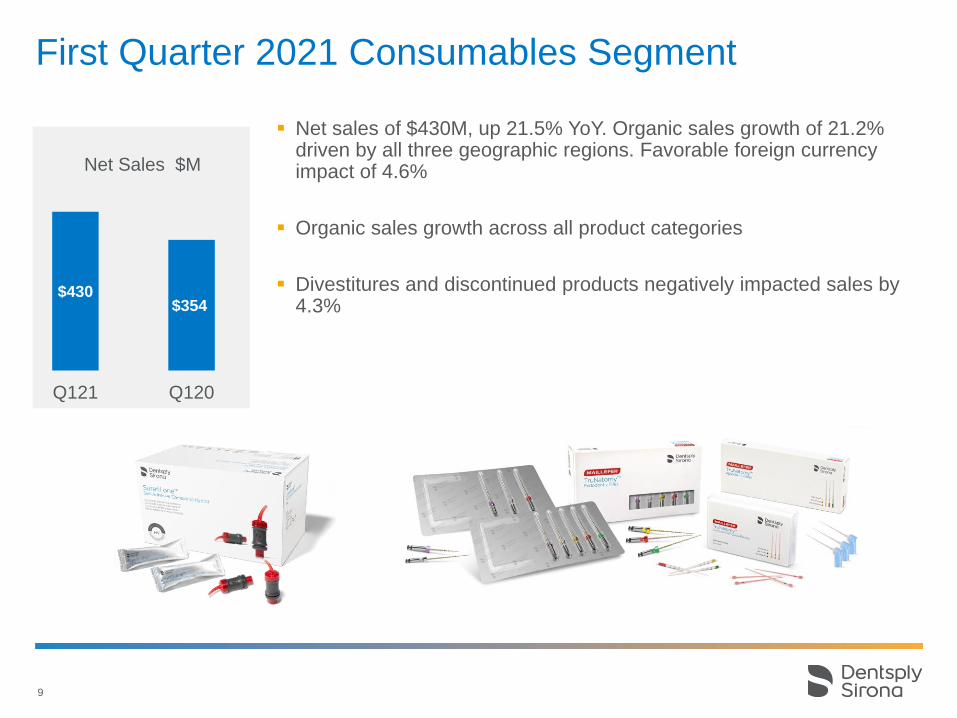
$430$354
Q121 Q120
Net Sales $M
First Quarter 2021 Consumables Segment
▪ Net sales of $430M, up 21.5% YoY. Organic sales growth of 21.2% driven by all three geographic regions. Favorable foreign currency impact of 4.6%
▪ Organic sales growth across all product categories
▪ Divestitures and discontinued products negatively impacted sales by 4.3%
10
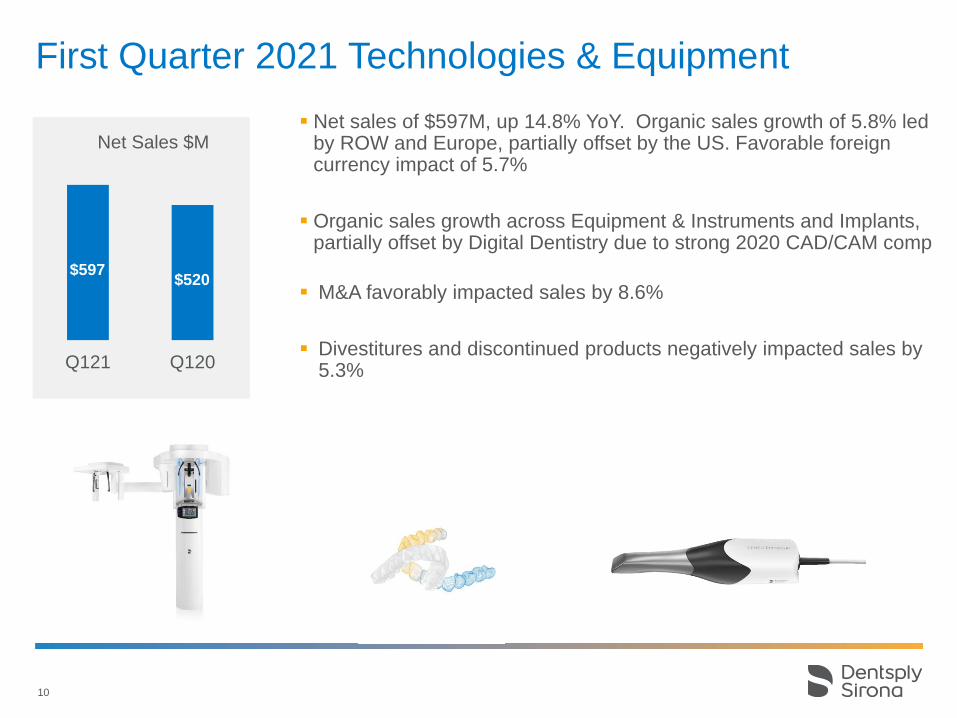
First Quarter 2021 Technologies & Equipment
▪ Net sales of $597M, up 14.8% YoY. Organic sales growth of 5.8% led by ROW and Europe, partially offset by the US. Favorable foreign currency impact of 5.7%
▪ Organic sales growth across Equipment & Instruments and Implants, partially offset by Digital Dentistry due to strong 2020 CAD/CAM comp
▪ M&A favorably impacted sales by 8.6%
▪ Divestitures and discontinued products negatively impacted sales by 5.3%
$597$520
Q121 Q120
Net Sales $M
11
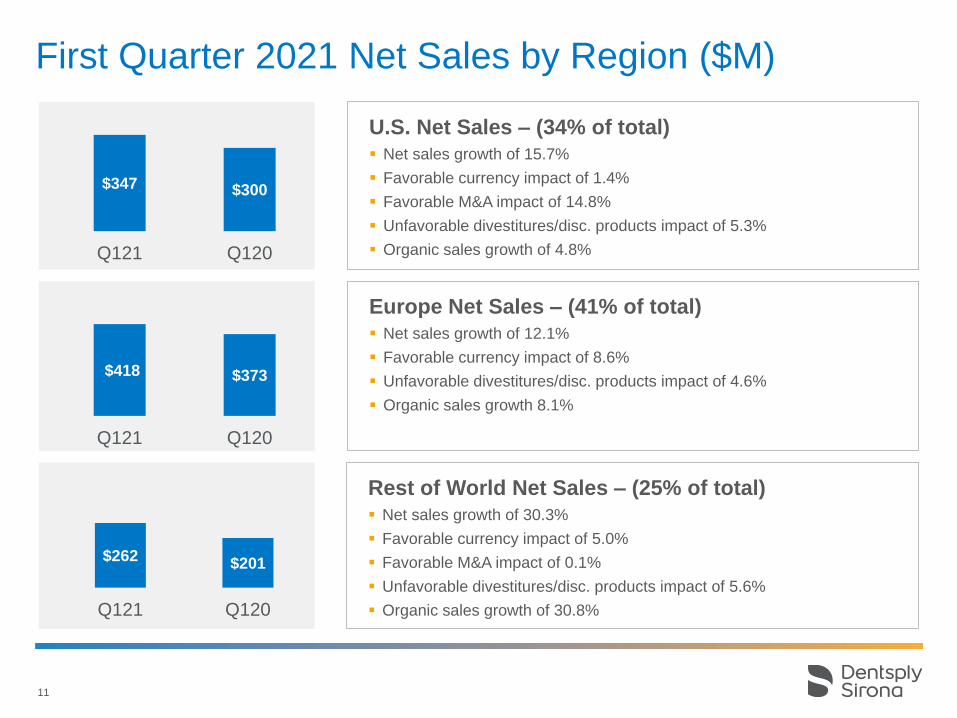
U.S. Net Sales – (34% of total)
▪ Net sales growth of 15.7%
▪ Favorable currency impact of 1.4%
▪ Favorable M&A impact of 14.8%
▪ Unfavorable divestitures/disc. products impact of 5.3%
▪ Organic sales growth of 4.8%
Rest of World Net Sales – (25% of total)
▪ Net sales growth of 30.3%
▪ Favorable currency impact of 5.0%
▪ Favorable M&A impact of 0.1%
▪ Unfavorable divestitures/disc. products impact of 5.6%
▪ Organic sales growth of 30.8%
Europe Net Sales – (41% of total)
▪ Net sales growth of 12.1%
▪ Favorable currency impact of 8.6%
▪ Unfavorable divestitures/disc. products impact of 4.6%
▪ Organic sales growth 8.1%
First Quarter 2021 Net Sales by Region ($M)
$347 $300
Q121 Q120
$418 $373
Q121 Q120
$262$201
Q121 Q120
12
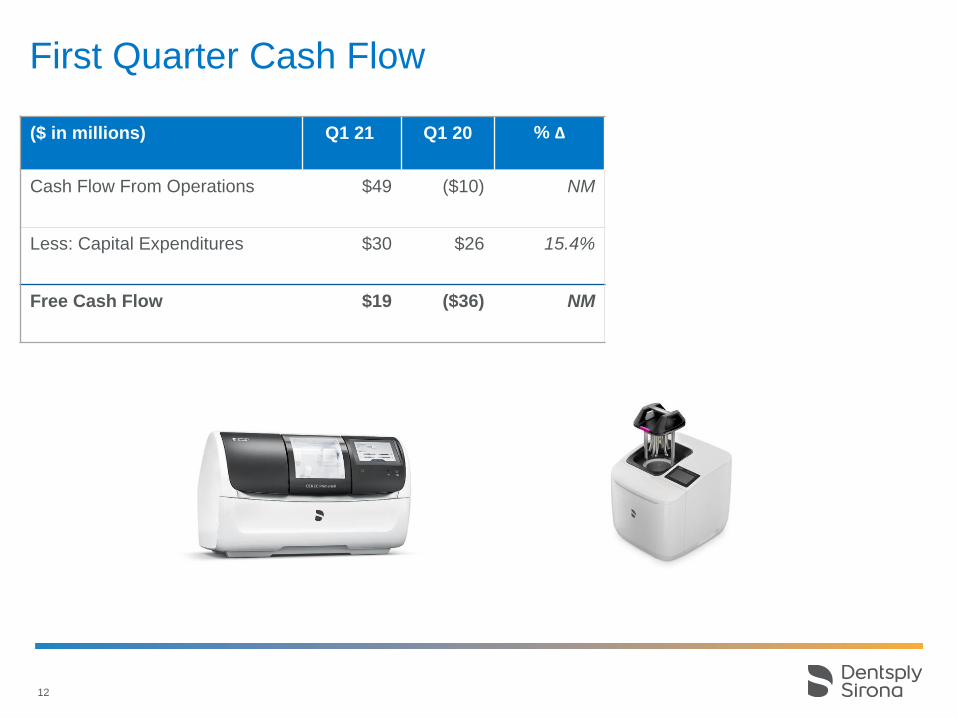
First Quarter Cash Flow
($ in millions) Q1 21 Q1 20 % Δ
Cash Flow From Operations $49 ($10) NM
Less: Capital Expenditures $30 $26 15.4%
Free Cash Flow $19 ($36) NM
13
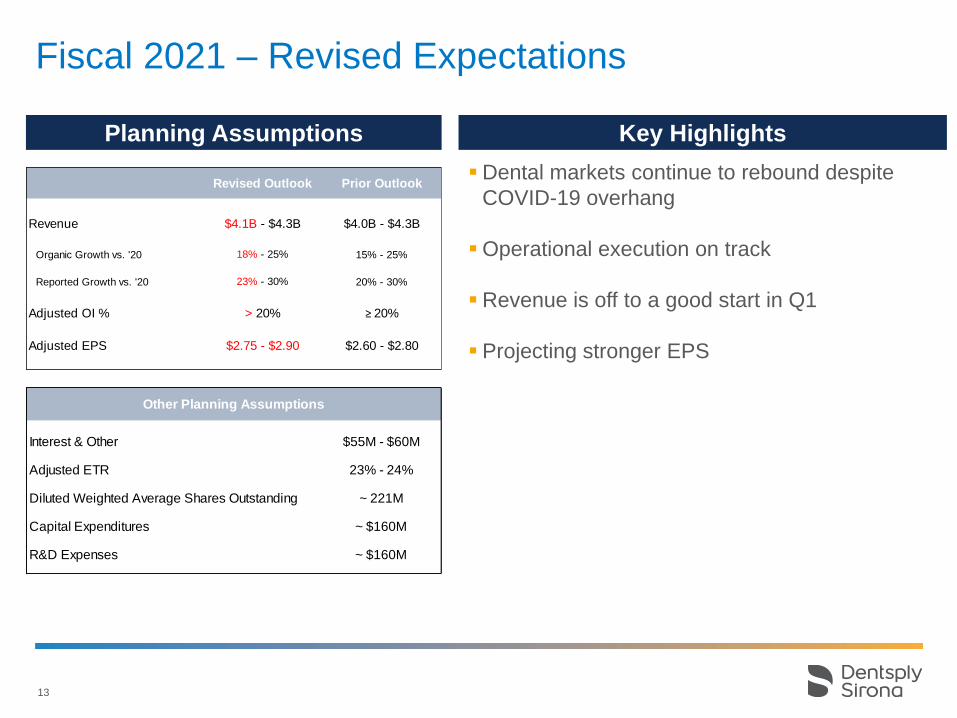
Fiscal 2021 – Revised Expectations
▪ Dental markets continue to rebound despite
COVID-19 overhang
▪ Operational execution on track
▪ Revenue is off to a good start in Q1
▪ Projecting stronger EPS
Key HighlightsPlanning Assumptions
Other Planning Assumptions
Interest & Other $55M - $60M
Adjusted ETR 23% - 24%
Diluted Weighted Average Shares Outstanding ~ 221M
Capital Expenditures ~ $160M
R&D Expenses ~ $160M
Revised Outlook Prior Outlook
Revenue $4.1B - $4.3B $4.0B - $4.3B
Organic Growth vs. '20 18% - 25% 15% - 25%
Reported Growth vs. '20 23% - 30% 20% - 30%
Adjusted OI % > 20% ≥ 20%
Adjusted EPS $2.75 - $2.90 $2.60 - $2.80

14
Operating Update
Don CaseyChief Executive Officer
15
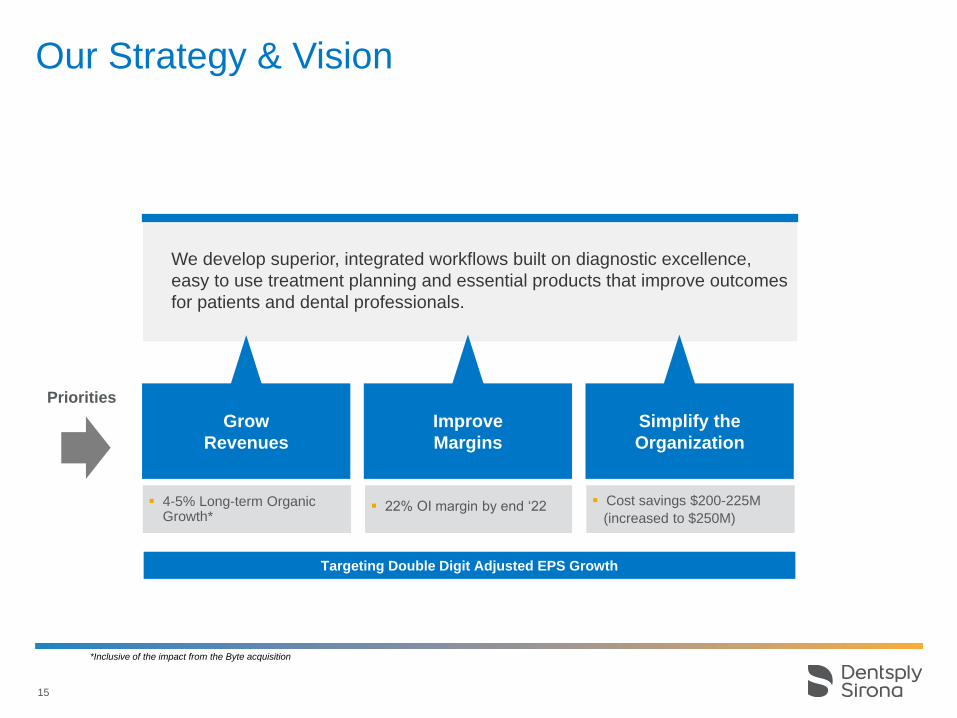
Our Strategy & Vision
We develop superior, integrated workflows built on diagnostic excellence,
easy to use treatment planning and essential products that improve outcomes
for patients and dental professionals.
Grow
Revenues
Improve
Margins
Simplify the
Organization
▪ 4-5% Long-term Organic Growth*
▪ 22% OI margin by end ‘22 ▪ Cost savings $200-225M
(increased to $250M)
Targeting Double Digit Adjusted EPS Growth
Priorities
*Inclusive of the impact from the Byte acquisition
16
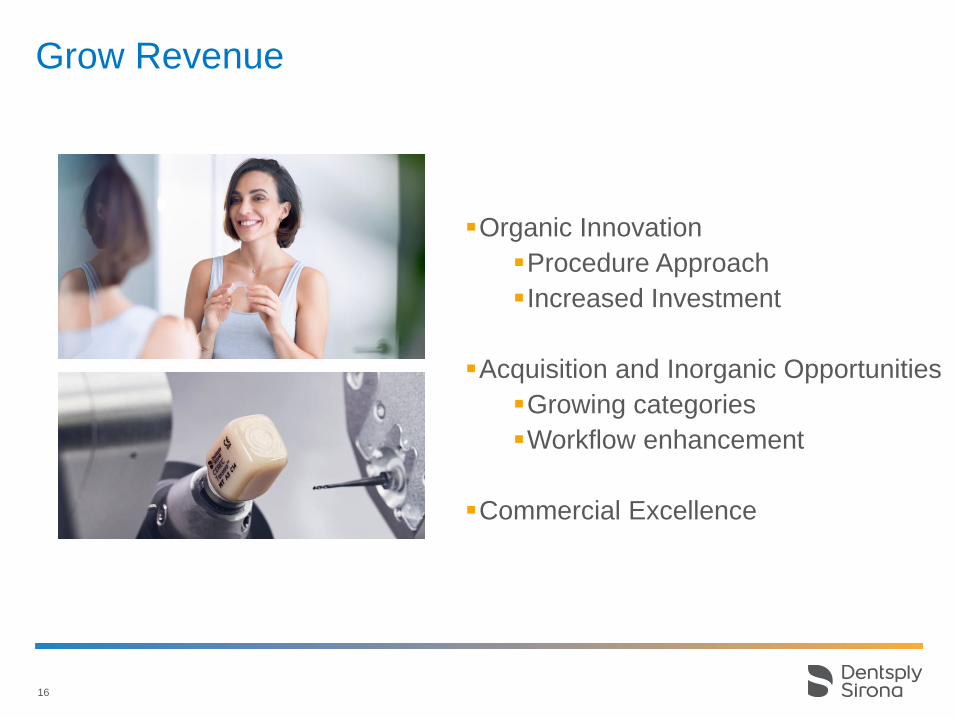
Grow Revenue
▪Organic Innovation
▪Procedure Approach
▪Increased Investment
▪Acquisition and Inorganic Opportunities
▪Growing categories
▪Workflow enhancement
▪Commercial Excellence
17
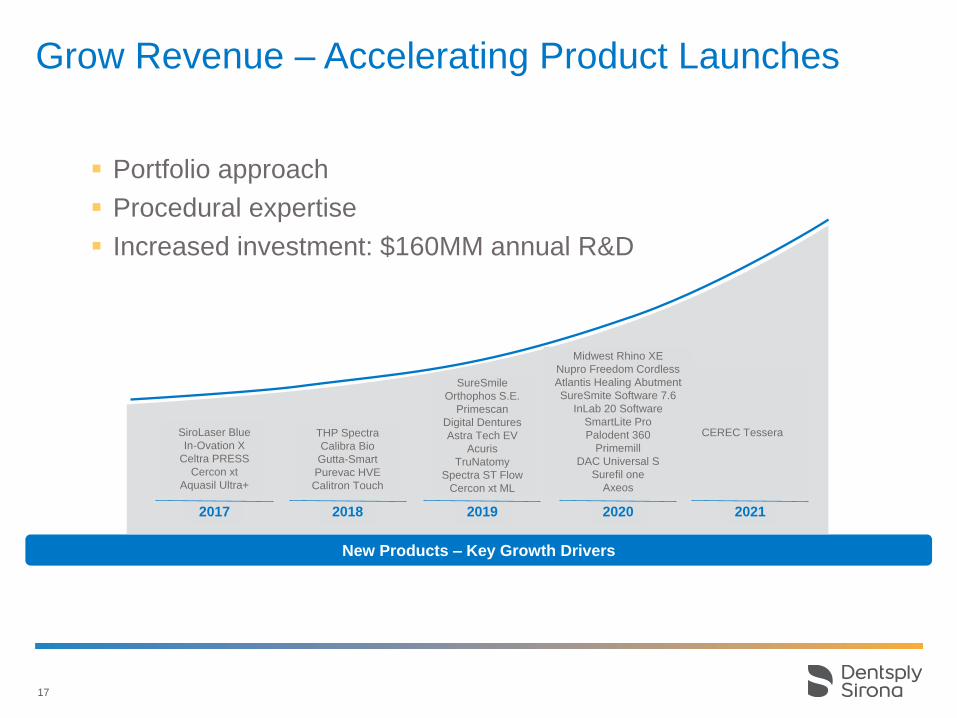
Grow Revenue – Accelerating Product Launches
New Products – Key Growth Drivers
SiroLaser Blue
In-Ovation X
Celtra PRESS
Cercon xt
Aquasil Ultra+
2017
THP Spectra
Calibra Bio
Gutta-Smart
Purevac HVE
Calitron Touch
2018
CEREC Tessera
2021
SureSmile
Orthophos S.E.
Primescan
Digital Dentures
Astra Tech EV
Acuris
TruNatomy
Spectra ST Flow
Cercon xt ML
2019
Midwest Rhino XE
Nupro Freedom Cordless
Atlantis Healing Abutment
SureSmite Software 7.6
InLab 20 Software
SmartLite Pro
Palodent 360
Primemill
DAC Universal S
Surefil one
Axeos
2020
▪ Portfolio approach
▪ Procedural expertise
▪ Increased investment: $160MM annual R&D
18
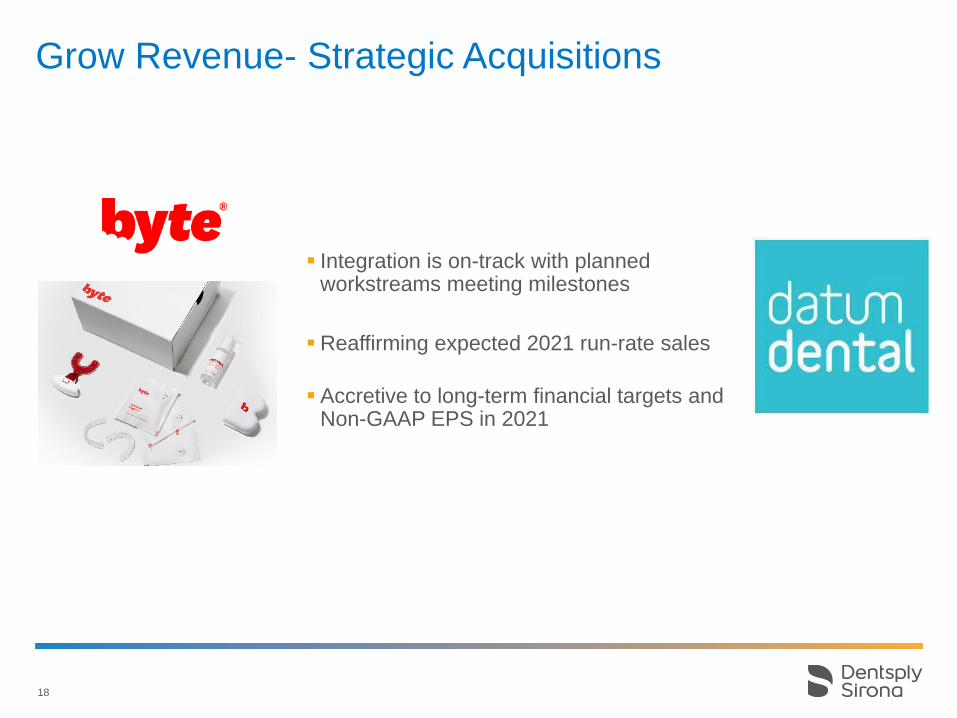
Grow Revenue- Strategic Acquisitions
▪ Integration is on-track with planned workstreams meeting milestones
▪ Reaffirming expected 2021 run-rate sales
▪ Accretive to long-term financial targets and Non-GAAP EPS in 2021
19
▪Some uncertainty due to the pandemic in 2021
▪Dental market is resilient and the recovery is underway
Conclusion
▪Expect to invest to support growth initiatives throughout the year
▪Dentsply Sirona is well positioned to capitalize on the continued recovery

Appendix
20
21
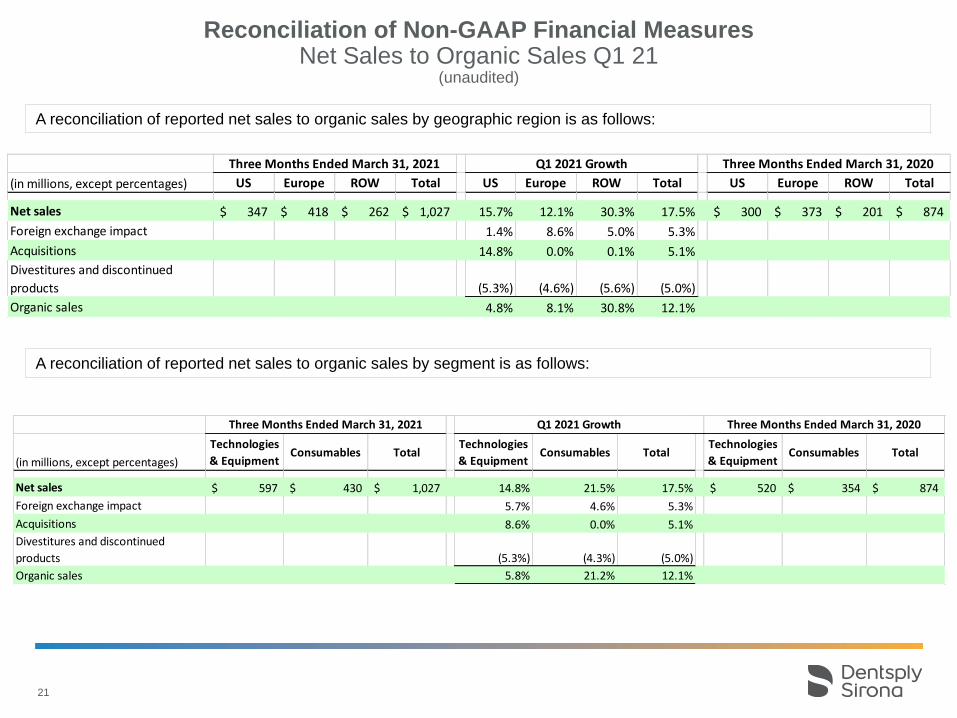
Reconciliation of Non-GAAP Financial MeasuresNet Sales to Organic Sales Q1 21
(unaudited)
A reconciliation of reported net sales to organic sales by geographic region is as follows:
A reconciliation of reported net sales to organic sales by segment is as follows:
(in millions, except percentages) US Europe ROW Total US Europe ROW Total US Europe ROW Total
Net sales 347$ 418$ 262$ 1,027$ 15.7% 12.1% 30.3% 17.5% 300$ 373$ 201$ 874$
Foreign exchange impact 1.4% 8.6% 5.0% 5.3%
Acquisitions 14.8% 0.0% 0.1% 5.1%
Divestitures and discontinued
products (5.3%) (4.6%) (5.6%) (5.0%)
Organic sales 4.8% 8.1% 30.8% 12.1%
Three Months Ended March 31, 2021 Q1 2021 Growth Three Months Ended March 31, 2020
(in millions, except percentages)
Technologies
& EquipmentConsumables Total
Technologies
& EquipmentConsumables Total
Technologies
& EquipmentConsumables Total
Net sales 597$ 430$ 1,027$ 14.8% 21.5% 17.5% 520$ 354$ 874$
Foreign exchange impact 5.7% 4.6% 5.3%
Acquisitions 8.6% 0.0% 5.1%
Divestitures and discontinued
products (5.3%) (4.3%) (5.0%)
Organic sales 5.8% 21.2% 12.1%
Three Months Ended March 31, 2021 Three Months Ended March 31, 2020Q1 2021 Growth
22
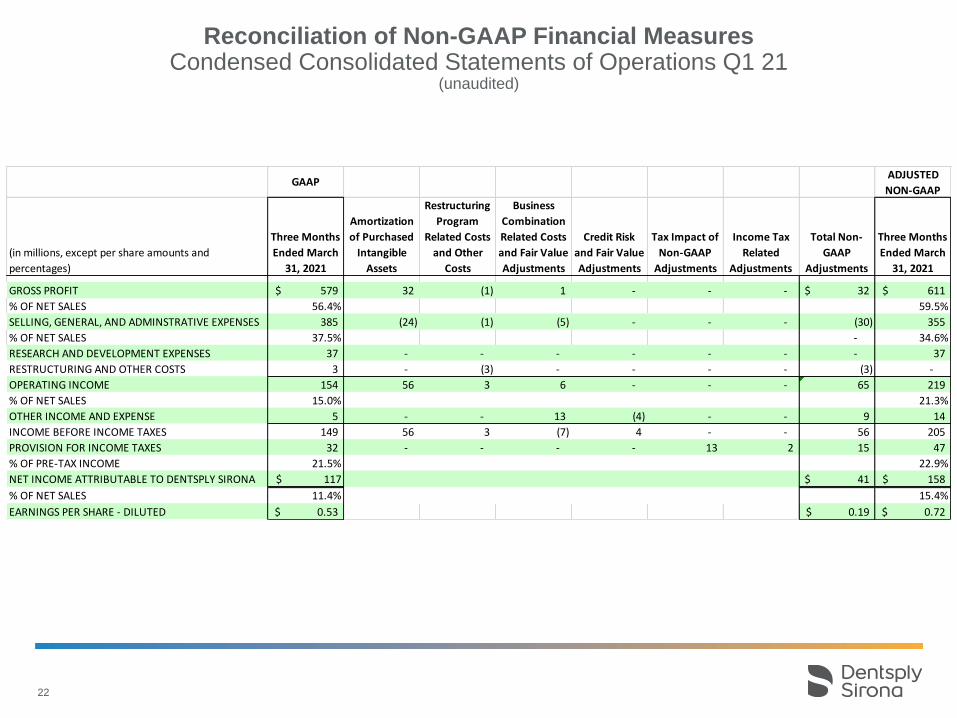
Reconciliation of Non-GAAP Financial MeasuresCondensed Consolidated Statements of Operations Q1 21
(unaudited)
GAAPADJUSTED
NON-GAAP
(in millions, except per share amounts and
percentages)
Three Months
Ended March
31, 2021
Amortization
of Purchased
Intangible
Assets
Restructuring
Program
Related Costs
and Other
Costs
Business
Combination
Related Costs
and Fair Value
Adjustments
Credit Risk
and Fair Value
Adjustments
Tax Impact of
Non-GAAP
Adjustments
Income Tax
Related
Adjustments
Total Non-
GAAP
Adjustments
Three Months
Ended March
31, 2021
GROSS PROFIT 579$ 32 (1) 1 - - - 32$ 611$
% OF NET SALES 56.4% 59.5%
SELLING, GENERAL, AND ADMINSTRATIVE EXPENSES 385 (24) (1) (5) - - - (30) 355
% OF NET SALES 37.5% - 34.6%
RESEARCH AND DEVELOPMENT EXPENSES 37 - - - - - - - 37
RESTRUCTURING AND OTHER COSTS 3 - (3) - - - - (3) -
OPERATING INCOME 154 56 3 6 - - - 65 219
% OF NET SALES 15.0% 21.3%
OTHER INCOME AND EXPENSE 5 - - 13 (4) - - 9 14
INCOME BEFORE INCOME TAXES 149 56 3 (7) 4 - - 56 205
PROVISION FOR INCOME TAXES 32 - - - - 13 2 15 47
% OF PRE-TAX INCOME 21.5% 22.9%
NET INCOME ATTRIBUTABLE TO DENTSPLY SIRONA $ 117 41$ 158$
% OF NET SALES 11.4% 15.4%
EARNINGS PER SHARE - DILUTED 0.53$ 0.19$ 0.72$
23
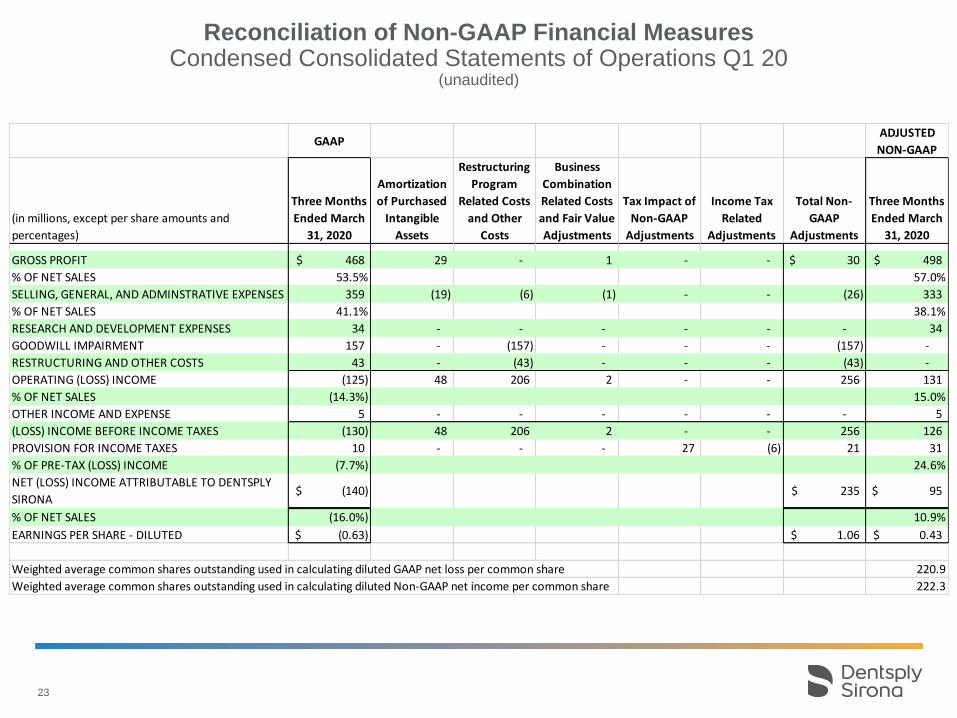
Reconciliation of Non-GAAP Financial MeasuresCondensed Consolidated Statements of Operations Q1 20
(unaudited)
GAAPADJUSTED
NON-GAAP
(in millions, except per share amounts and
percentages)
Three Months
Ended March
31, 2020
Amortization
of Purchased
Intangible
Assets
Restructuring
Program
Related Costs
and Other
Costs
Business
Combination
Related Costs
and Fair Value
Adjustments
Tax Impact of
Non-GAAP
Adjustments
Income Tax
Related
Adjustments
Total Non-
GAAP
Adjustments
Three Months
Ended March
31, 2020
GROSS PROFIT 468$ 29 - 1 - - 30$ 498$
% OF NET SALES 53.5% 57.0%
SELLING, GENERAL, AND ADMINSTRATIVE EXPENSES 359 (19) (6) (1) - - (26) 333
% OF NET SALES 41.1% 38.1%
RESEARCH AND DEVELOPMENT EXPENSES 34 - - - - - - 34
GOODWILL IMPAIRMENT 157 - (157) - - - (157) -
RESTRUCTURING AND OTHER COSTS 43 - (43) - - - (43) -
OPERATING (LOSS) INCOME (125) 48 206 2 - - 256 131
% OF NET SALES (14.3%) 15.0%
OTHER INCOME AND EXPENSE 5 - - - - - - 5
(LOSS) INCOME BEFORE INCOME TAXES (130) 48 206 2 - - 256 126
PROVISION FOR INCOME TAXES 10 - - - 27 (6) 21 31
% OF PRE-TAX (LOSS) INCOME (7.7%) 24.6%
NET (LOSS) INCOME ATTRIBUTABLE TO DENTSPLY
SIRONA $ (140) 235$ 95$
% OF NET SALES (16.0%) 10.9%
EARNINGS PER SHARE - DILUTED (0.63)$ 1.06$ 0.43$
Weighted average common shares outstanding used in calculating diluted GAAP net loss per common share 220.9
Weighted average common shares outstanding used in calculating diluted Non-GAAP net income per common share 222.3