26
Denver 2016 Travel Year Prepared For:

Denver 2016 Travel Year
Prepared For:
: Travel Clients
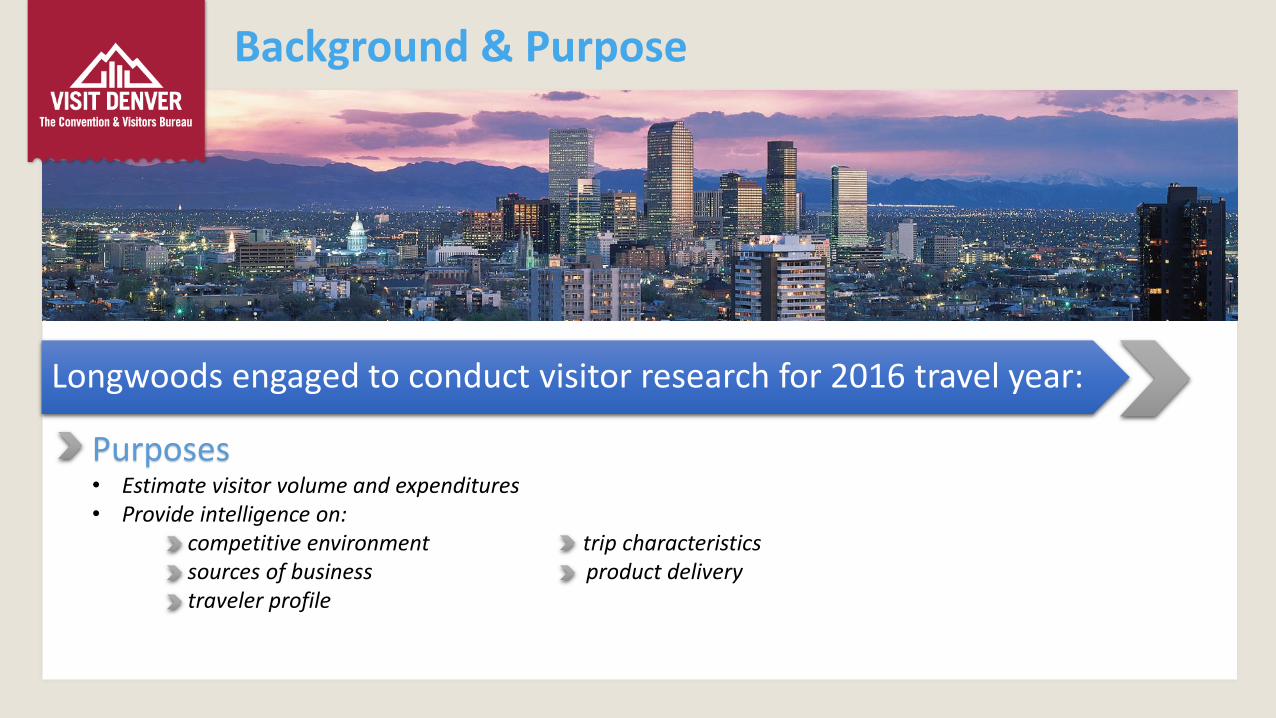
Background & Purpose
Longwoods engaged to conduct visitor research for 2016 travel year:
Purposes• Estimate visitor volume and expenditures• Provide intelligence on:
competitive environment trip characteristicssources of business product deliverytraveler profile
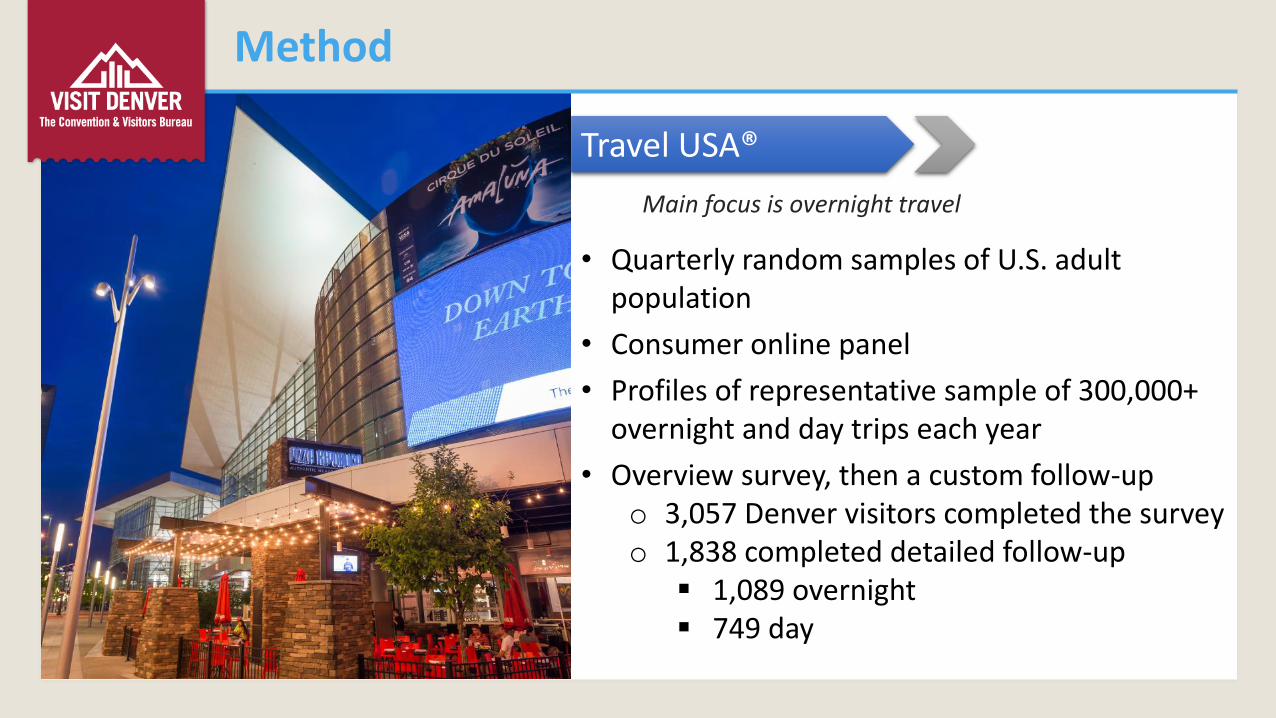
Main focus is overnight travel
Method
Travel USA®
• Quarterly random samples of U.S. adult population
• Consumer online panel
• Profiles of representative sample of 300,000+ overnight and day trips each year
• Overview survey, then a custom follow-upo 3,057 Denver visitors completed the survey o 1,838 completed detailed follow-up
1,089 overnight 749 day

Structure of the U.S. Travel Market
2016 Overnight Trips
Marketable Leisure Trips
47%
Visits to Friends/ Relatives
44%
Business Trips9%

U.S. Market Trends for Overnight Trips
2016 vs. 2015Base: Adult Overnight Trips
1
1
-1
4
-1
-5 0 5 10
ALL OVERNIGHT TRIPS
LEISURE TRIPS
Visiting Friends/Relatives
Marketable Trips
BUSINESS TRIPS
Percent Change
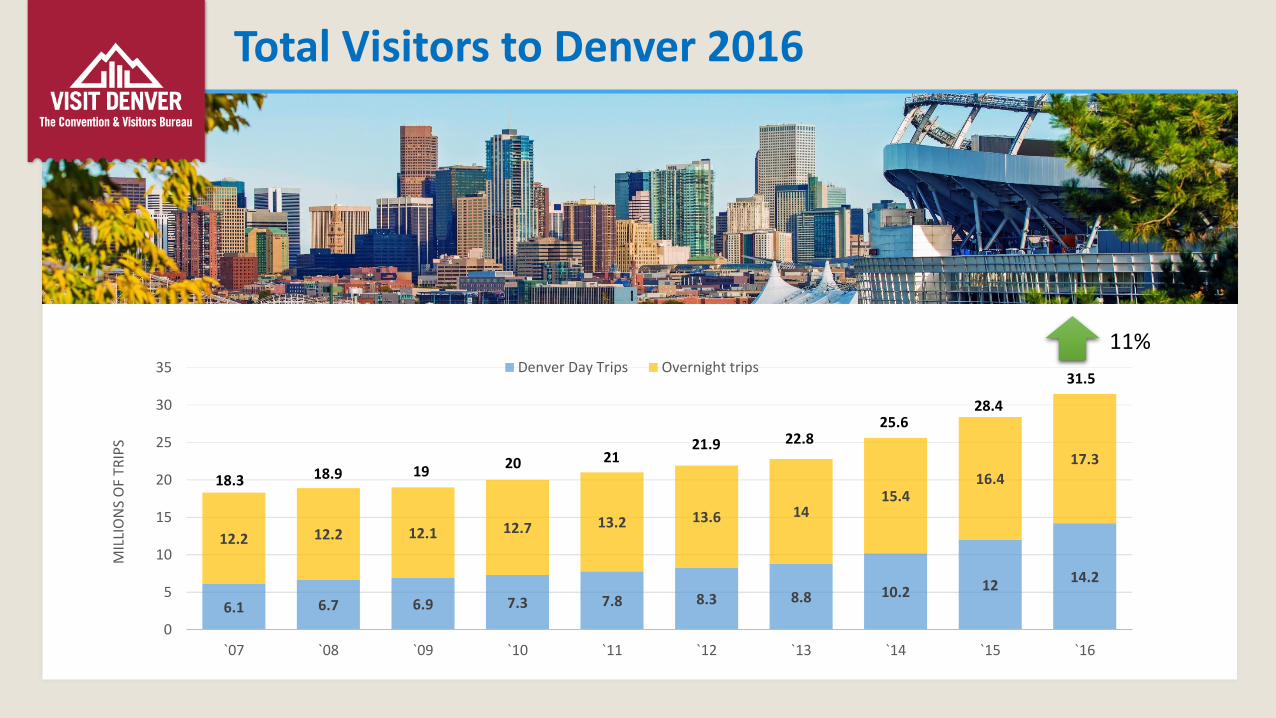
Total Visitors to Denver 2016
6.1 6.7 6.9 7.3 7.8 8.3 8.8 10.2 1214.2
12.2 12.2 12.1 12.7 13.2 13.6 1415.4
16.417.3
0
5
10
15
20
25
30
35
`07 `08 `09 `10 `11 `12 `13 `14 `15 `16
MIL
LIO
NS
OF
TRIP
S
Denver Day Trips Overnight trips
18.3 18.9 1920 21
21.9 22.825.6
28.4
31.5
11%
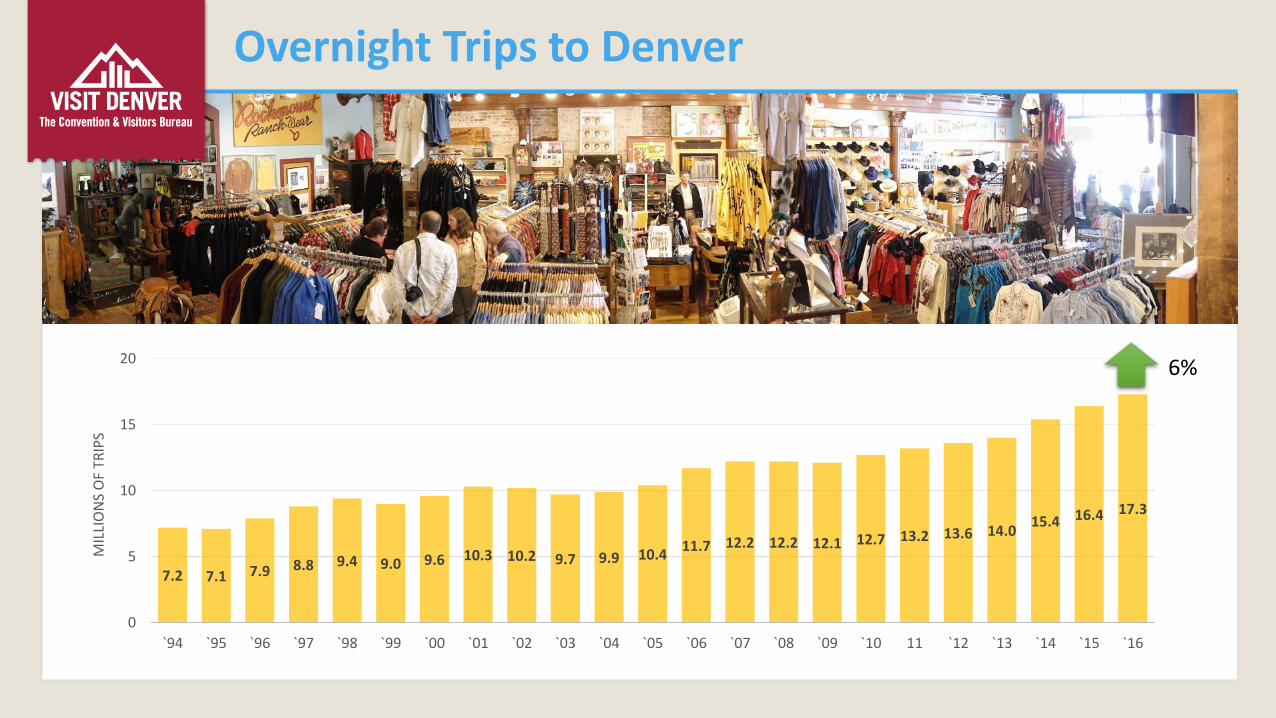
Overnight Trips to Denver
7.2 7.1 7.9 8.8 9.4 9.0 9.6 10.3 10.2 9.7 9.9 10.411.7 12.2 12.2 12.1 12.7 13.2 13.6 14.0
15.4 16.4 17.3
0
5
10
15
20
`94 `95 `96 `97 `98 `99 `00 `01 `02 `03 `04 `05 `06 `07 `08 `09 `10 11 `12 `13 `14 `15 `16
MIL
LIO
NS
OF
TRIP
S
6%
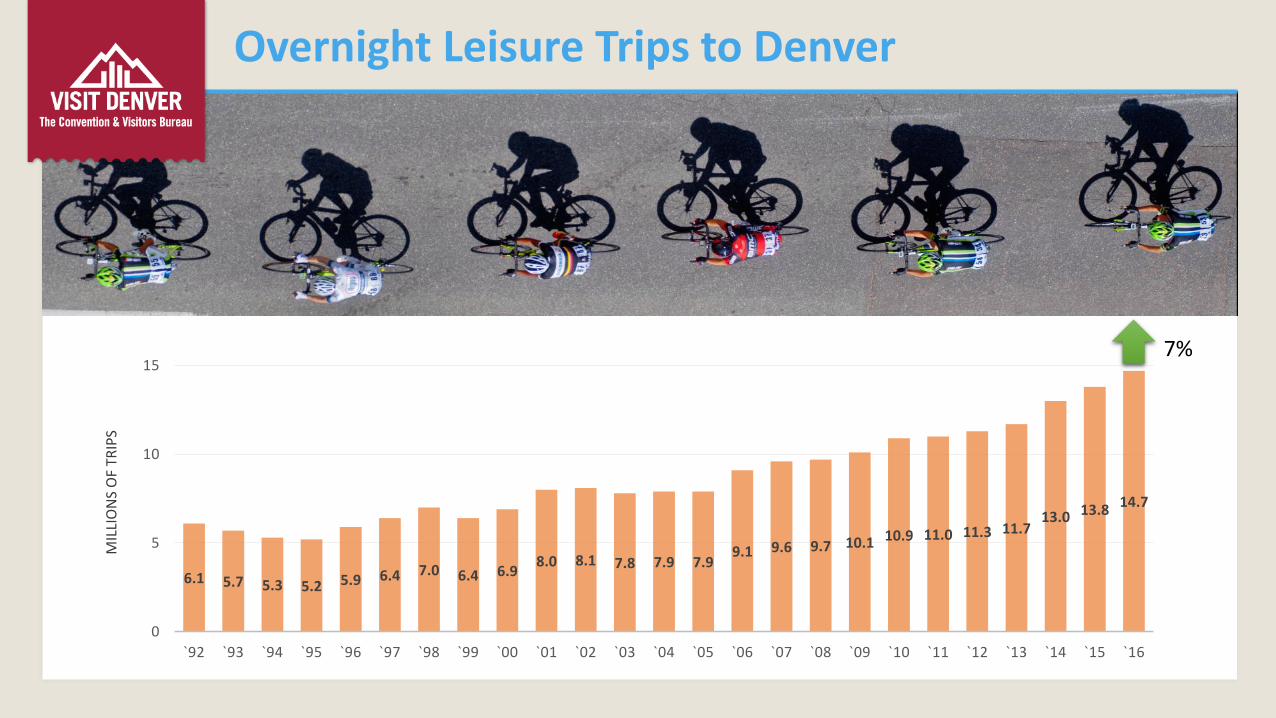
Overnight Leisure Trips to Denver
6.1 5.7 5.3 5.2 5.9 6.4 7.0 6.4 6.98.0 8.1 7.8 7.9 7.9
9.1 9.6 9.7 10.1 10.9 11.0 11.3 11.713.0 13.8 14.7
0
5
10
15
`92 `93 `94 `95 `96 `97 `98 `99 `00 `01 `02 `03 `04 `05 `06 `07 `08 `09 `10 `11 `12 `13 `14 `15 `16
7%
MIL
LIO
NS
OF
TRIP
S
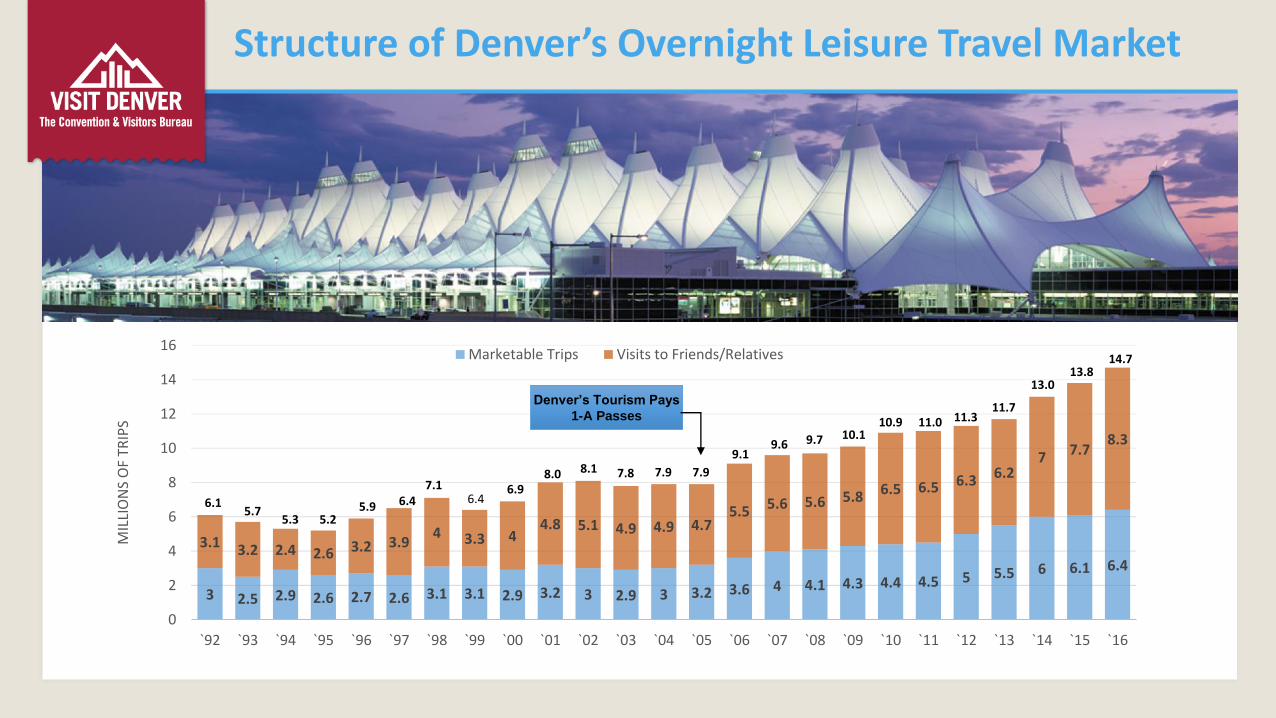
Structure of Denver’s Overnight Leisure Travel Market
3 2.5 2.9 2.6 2.7 2.6 3.1 3.1 2.9 3.2 3 2.9 3 3.2 3.6 4 4.1 4.3 4.4 4.5 5 5.5 6 6.1 6.4
3.1 3.2 2.4 2.6 3.2 3.94 3.3 4
4.8 5.1 4.9 4.9 4.75.5 5.6 5.6 5.8 6.5 6.5 6.3 6.2
7 7.78.3
0
2
4
6
8
10
12
14
16
`92 `93 `94 `95 `96 `97 `98 `99 `00 `01 `02 `03 `04 `05 `06 `07 `08 `09 `10 `11 `12 `13 `14 `15 `16
MIL
LIO
NS
OF
TRIP
S
Marketable Trips Visits to Friends/Relatives
Denver’s Tourism Pays
1-A Passes
6.47.1
6.46.9
8.0 8.1 7.8 7.9 7.9
9.19.6 9.7 10.1
10.9 11.0 11.311.7
13.013.8
6.15.7
5.3 5.25.9
14.7

Overnight Business Trips to Denver
1.9 1.9 2.02.4 2.4 2.5 2.7
2.3 2.1 1.9 2.02.5 2.6 2.6 2.5
2.0 1.82.2 2.3 2.3 2.4 2.6 2.6
0.0
1.0
2.0
3.0
4.0
`94 `95 `96 `97 `98 `99 `00 `01 `02 `03 `04 `05 `06 `07 `08 `09 `10 `11 `12 `13 `14 `15 `16
MIL
LIO
NS
OF
TRIP
S
Flat

Total Travel Spending in Denver- Overnight Trips
1.7 1.6 1.72.0 2.1 2.2 2.1 2.2 2.3 2.2 2.2 2.3
2.7 2.9 3.12.8 3.0
3.33.6
4.0
4.65.0
5.3
0.0
1.0
2.0
3.0
4.0
5.0
6.0
`94 `95 `96 `97 `98 `99 `00 `01 `02 `03 `04 `05 `06 `07 `08 `09 `10 `11 `12 `13 `14 `15 `16
$ B
ILLI
ON
S
5%

Total Expenditures in Denver- Overnight Trips
1.6 1.51.9 2.0 2.2 2.2 2.3 2.5 2.8
3.23.6
3.94.2
0.6 0.8 0.8 0.9 0.9 0.7 0.7 0.8 0.8 0.8 1.0 1.1 1.1
$0
$1
$2
$3
$4
`04 `05 `06 `07 `08 `09 `10 `11 `12 `13 `14 `15 `16 `04 `05 `06 `07 `08 `09 `10 `11 `12 `13 `14 `15 `16
BIL
LIO
NS
OF
DO
LLA
RS
7%
Flat
Total Spending Up 5%
Leisure Business
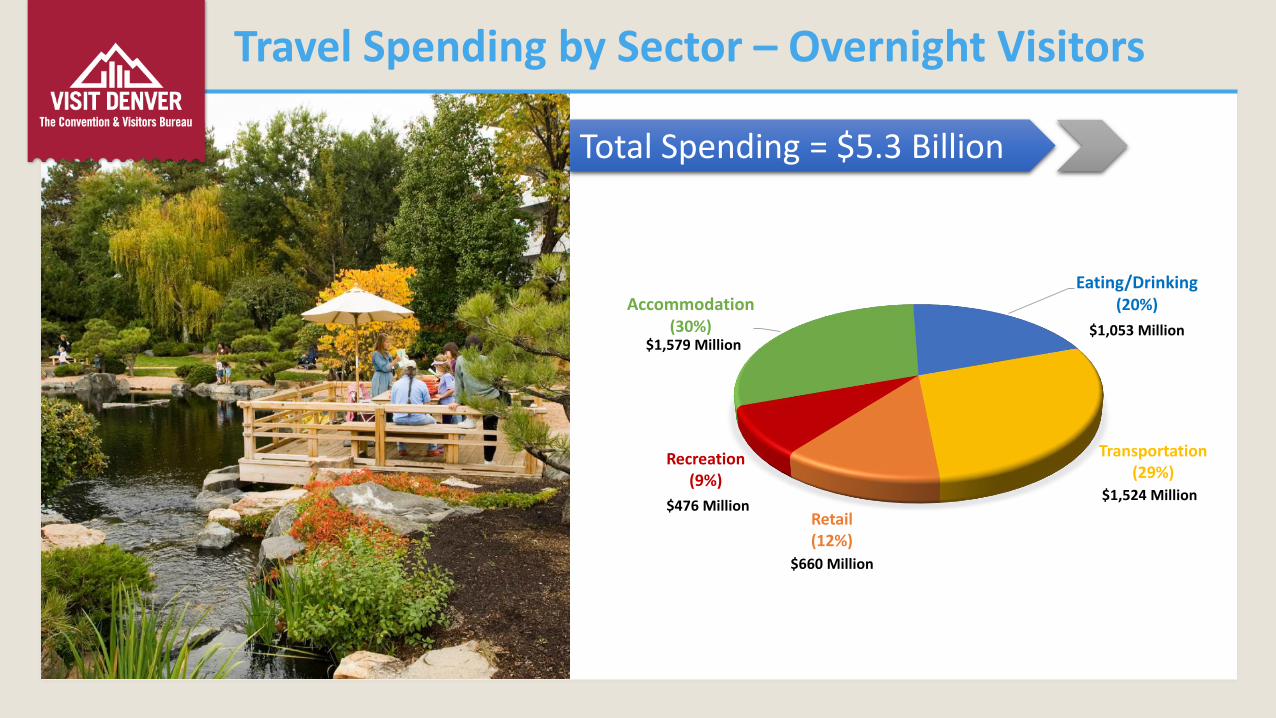
Travel Spending by Sector – Overnight Visitors
Accommodation(30%)
Eating/Drinking(20%)
Transportation(29%)
Retail(12%)
Recreation(9%)
Total Spending = $5.3 Billion
$1,579 Million$1,053 Million
$476 Million
$660 Million
$1,524 Million

Contributions to Expenditures/Visitor Volumes
38
41
21
48
37
15
0 20 40 60
Visit to Friends/Relatives
Marketable Leisure
Business
PercentExpenditures Visitors
Base: Overnight Visitors
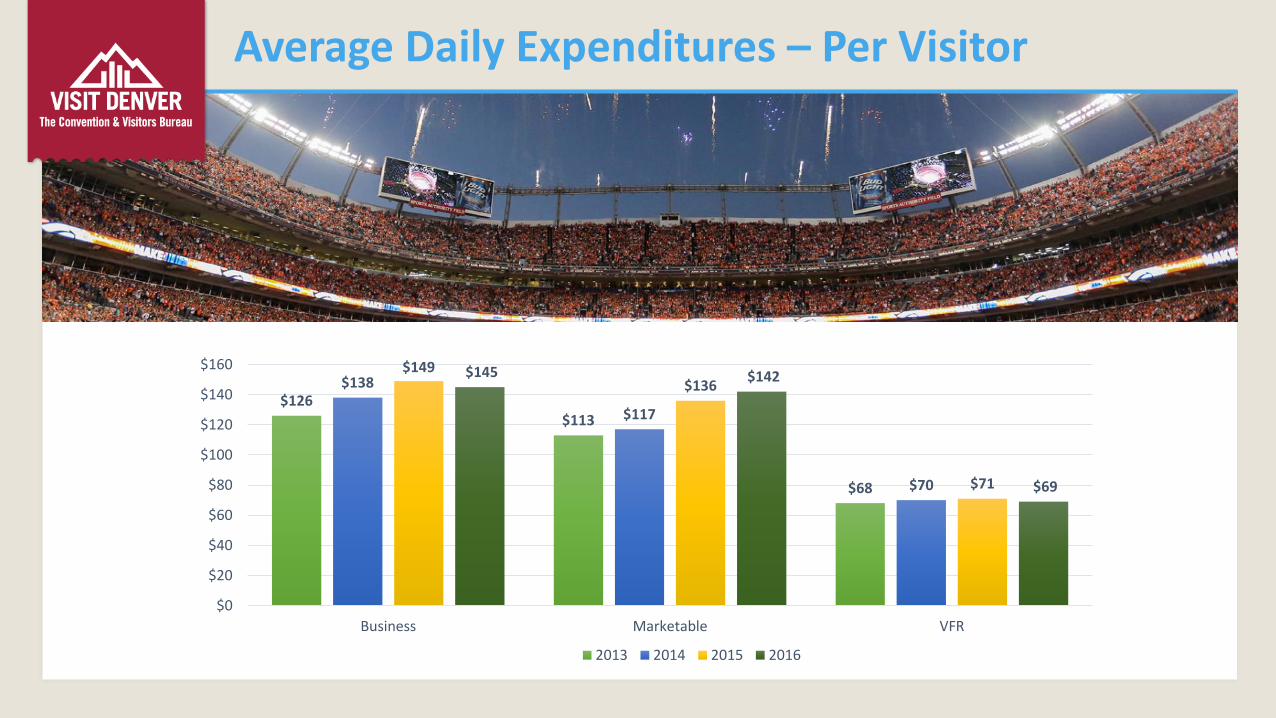
Average Daily Expenditures – Per Visitor
$126$113
$68
$138
$117
$70
$149$136
$71
$145 $142
$69
$0
$20
$40
$60
$80
$100
$120
$140
$160
Business Marketable VFR
2013 2014 2015 2016
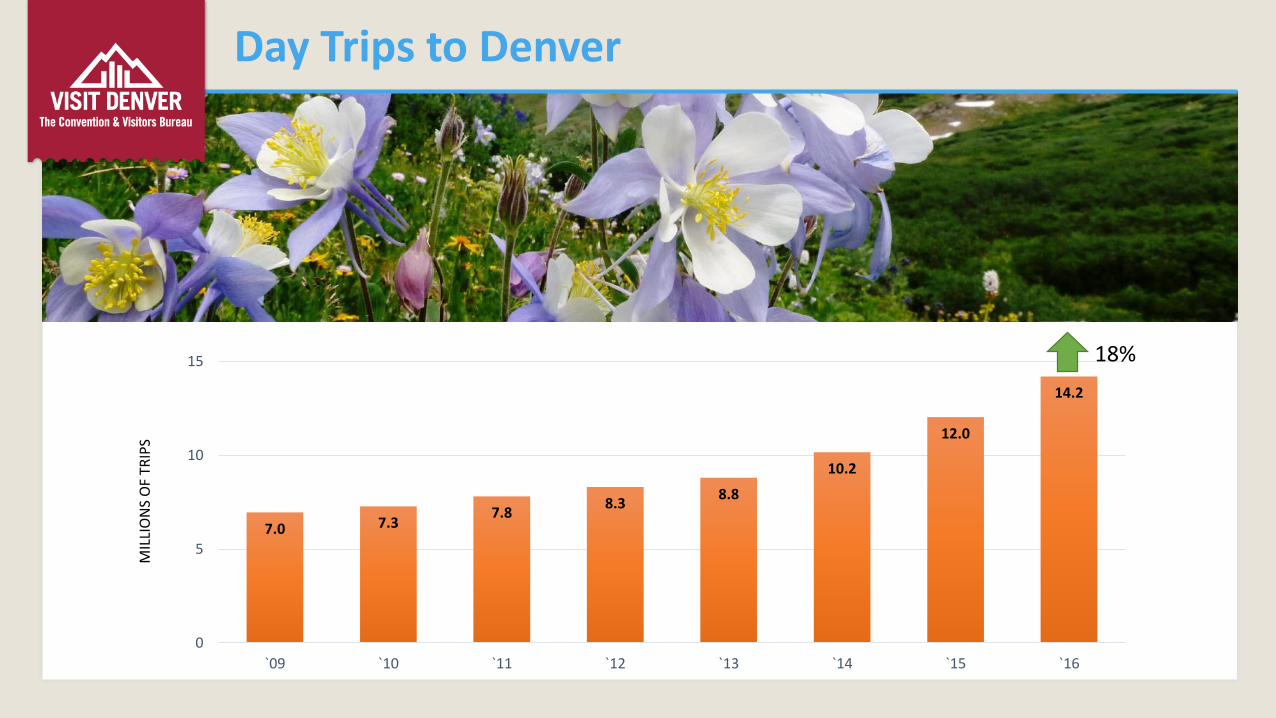
Day Trips to Denver
7.0 7.37.8
8.38.8
10.2
12.0
14.2
0
5
10
15
`09 `10 `11 `12 `13 `14 `15 `16
MIL
LIO
NS
OF
TRIP
S
18%

Denver’s Source of Business
States Contributing more than 5%
States contributing 2%-5%
DMAs contributing more than 2%
Base: Overnight Leisure Trips

76 71 71 70 70 74 7482 80
0
20
40
60
80
100
`08 `09 `10 `11 `12 `13 `14 `15 `16
PER
CEN
T
Out-of-State Leisure Visitors

Top Sources of Overnight Leisure Trips
Feed
er S
tate
s California
Florida
Texas
Illinois
New York
Kansas
Arizona
Ohio
Oregon
Virginia
Feed
er C
itie
s Los Angeles
New York
Chicago
Miami
San Francisco
Dallas
Phoenix
Kansas City
Washington DC
Houston
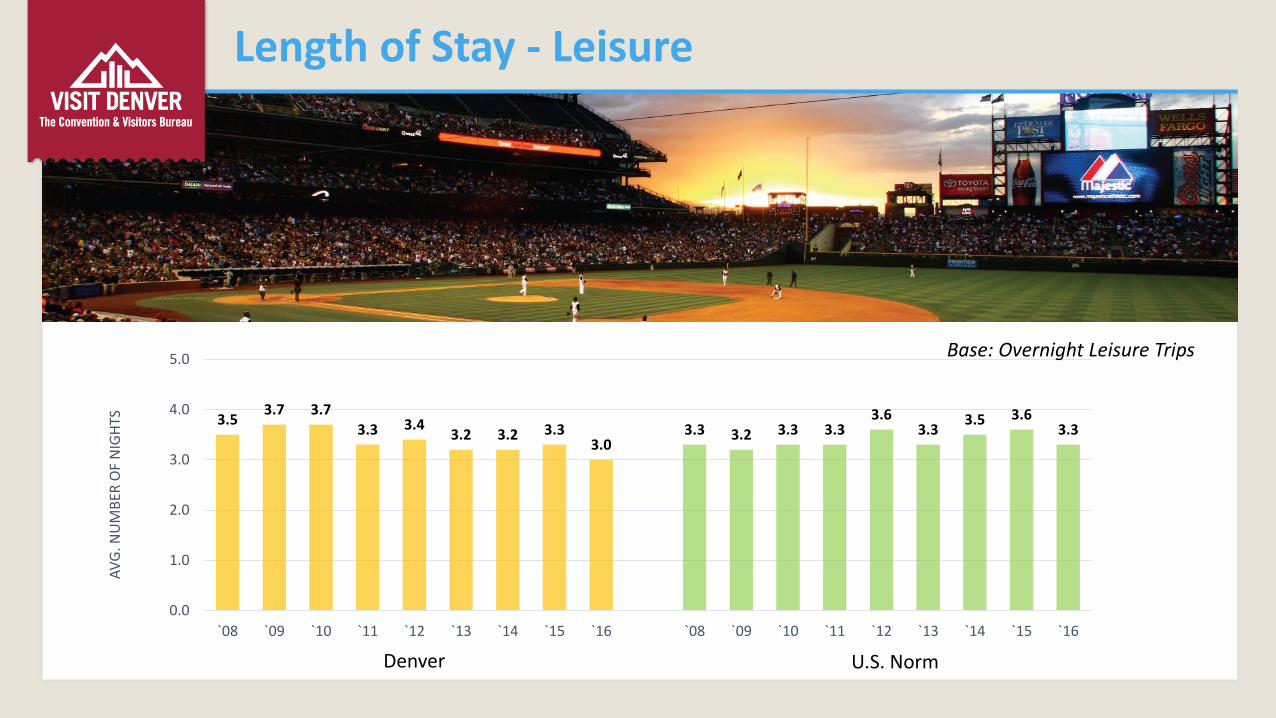
Length of Stay - Leisure
3.53.7 3.7
3.3 3.43.2 3.2 3.3
3.03.3 3.2 3.3 3.3
3.63.3
3.5 3.63.3
0.0
1.0
2.0
3.0
4.0
5.0
`08 `09 `10 `11 `12 `13 `14 `15 `16 `08 `09 `10 `11 `12 `13 `14 `15 `16
AV
G. N
UM
BER
OF
NIG
HTS
Base: Overnight Leisure Trips
Denver U.S. Norm

Attractions Visited in Denver
Paid
Ad
mis
sio
ns Denver Zoo
Red Rocks Park & Amphitheatre
Denver Art Museum
Denver Botanic Gardens
Buffalo Bill Museum & Grave
Colorado Rockies
Denver Museum of Nature & Science/IMAX
Downtown Aquarium
Colorado Railroad Museum
Denver Broncos
Top
3 F
ree
Ad
mis
sio
ns Coors Brewery
Red Rocks Park & Amphitheatre
Colorado State Capitol
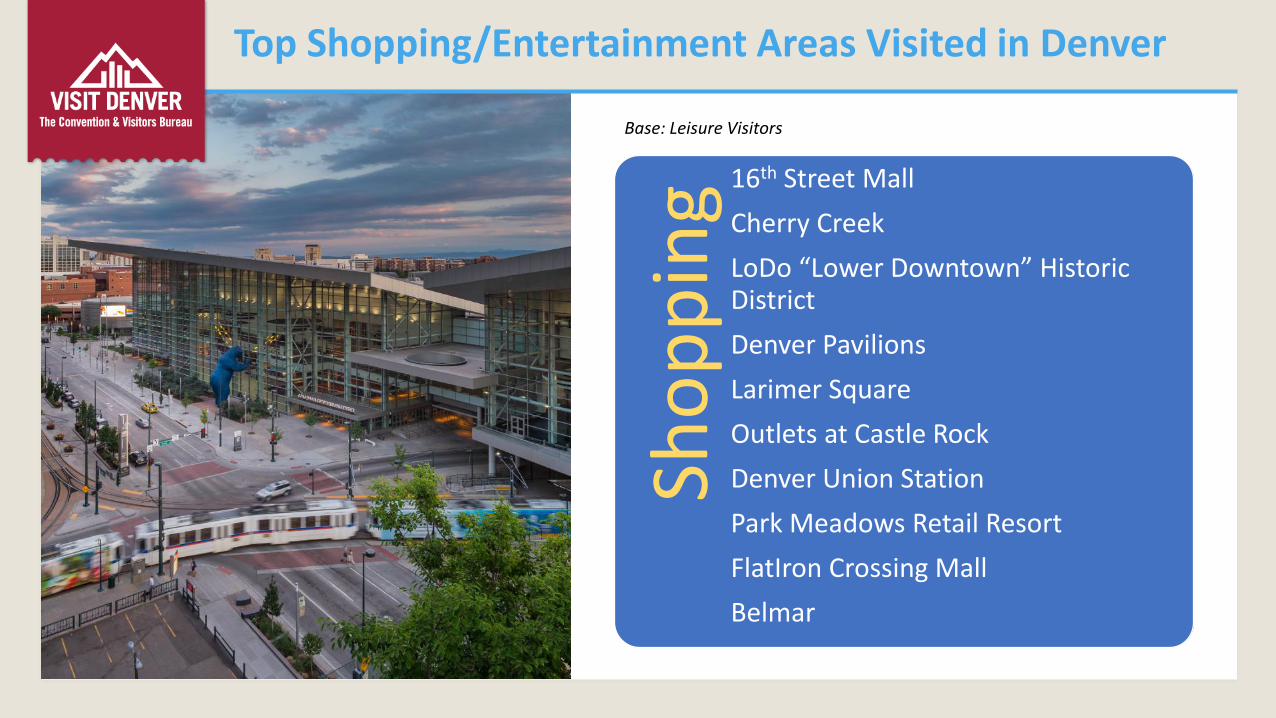
Top Shopping/Entertainment Areas Visited in Denver
Sho
pp
ing 16th Street Mall
Cherry Creek
LoDo “Lower Downtown” Historic District
Denver Pavilions
Larimer Square
Outlets at Castle Rock
Denver Union Station
Park Meadows Retail Resort
FlatIron Crossing Mall
Belmar
Base: Leisure Visitors
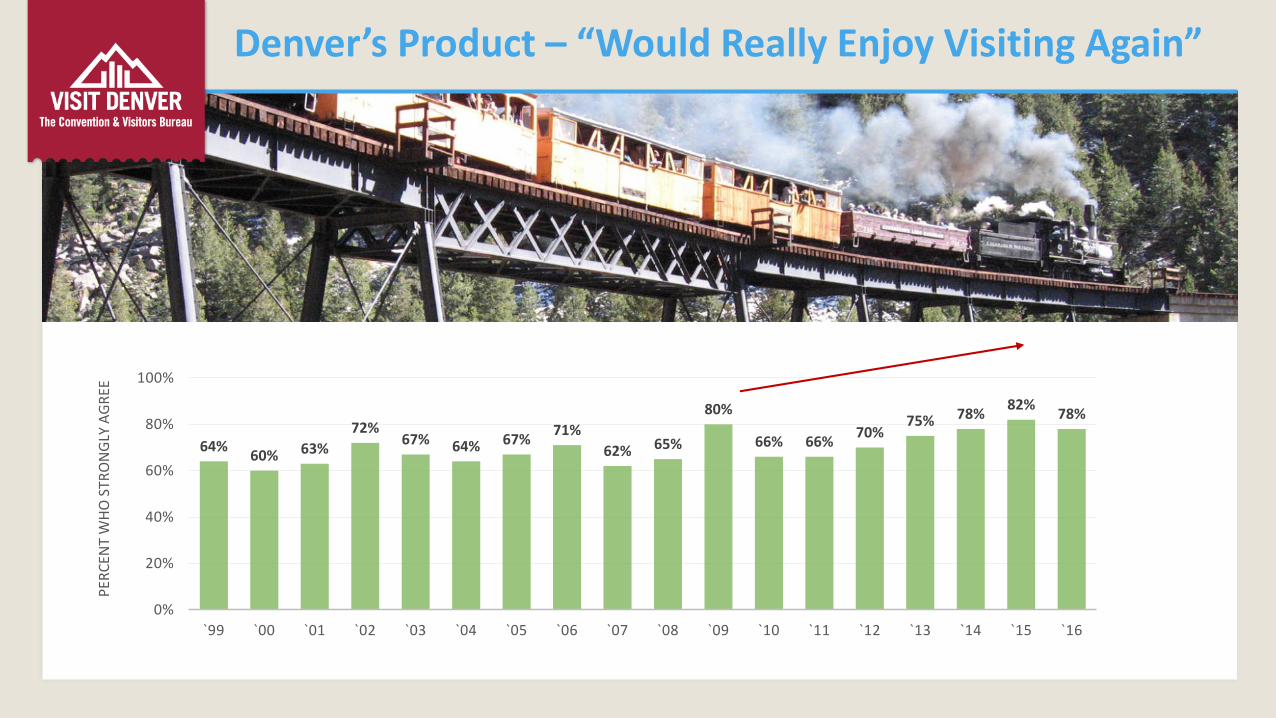
Denver’s Product – “Would Really Enjoy Visiting Again”
64%60% 63%
72%67% 64% 67%
71%
62% 65%
80%
66% 66%70%
75% 78%82%
78%
0%
20%
40%
60%
80%
100%
`99 `00 `01 `02 `03 `04 `05 `06 `07 `08 `09 `10 `11 `12 `13 `14 `15 `16
PER
CEN
T W
HO
STR
ON
GLY
AG
REE

Another Banner Year!
Continuing to break records
Exceeding, not just matching national trends...Leisure visits up 62% vs. 22% nationally since 2006
How? Successful marketing and product delivers on the promise
Tourism is important to Denver’s economy!
KEEP UP THE GOOD WORK!

THANK YOU!


