Deoiling Hydrocyclones Syed K. Ah and Charles A. Petty Department of Chemical Engmeering Michigan State University East Lansing, MI 48824 The use of hydrocvclones for deoiling produced water has grown steadily over the past ten years. Although hydrocvclones have been used as liquidliquid separators for more than forty years, the need to maintain and hrther reduce the discharge concentration of dispersed oil in produced water below 20-30ppm has motivated fbrther research which aims to identi6 improved designs and optimal operating conditions for deoihg hydrocyclones. Hydrocyclones with either tangential or involute feed entries are commonly employed as deoilers? but they are limited by drop breakup at high entry velocities. This phenomenon has been hrther quantlfied in laboratory tests conducted at room temperature on a commercial deoiling hydrocyclone for feed rates between 50 and 150 liters per minute. Kerosene in water was used as the experimental dispersion with the mean particle size in the feed stream ranging from 15 to 60 microns. The cut-size of the hydrocyclone studied was determined by measuring the particle size distributions of the feed and underflow streams using a laser light scattenng techaue. Due to drop breakup within the hydrocyclone, the 50% cut-size increases sigdicantly for feed dispersions with mean drop sizes larger than 20 to 35 microns. 1
Transcript
Deoiling Hydrocyclones P 05704
Syed K. Ah and Charles A. Petty Department of Chemical Engmeering
Michigan State University East Lansing, MI 48824
The use of hydrocvclones for deoiling produced water has grown steadily over the past ten years. Although hydrocvclones have been used as liquidliquid separators for more than forty years, the need to maintain and hrther reduce the discharge concentration of dispersed oil in produced water below 20-30ppm has motivated fbrther research which aims to identi6 improved designs and optimal operating conditions for deoihg hydrocyclones. Hydrocyclones with either tangential or involute feed entries are commonly employed as deoilers? but they are limited by drop breakup at high entry velocities. This phenomenon has been hrther quantlfied in laboratory tests conducted at room temperature on a commercial deoiling hydrocyclone for feed rates between 50 and 150 liters per minute. Kerosene in water was used as the experimental dispersion with the mean particle size in the feed stream ranging from 15 to 60 microns. The cut-size of the hydrocyclone studied was determined by measuring the particle size distributions of the feed and underflow streams using a laser light scattenng techaue. Due to drop breakup within the hydrocyclone, the 50% cut-size increases sigdicantly for feed dispersions with mean drop sizes larger than 20 to 35 microns.
1
ENVIRONMENTAL ISSUES AND SOLUTIOF IN P E T R O L E U EXPLORATION, PRODUCTION AND REFINING
~
Proceedings of the International Petroleum Environmental Conference
March 2 - 4,1994 Houston, Texas
Jointly Resented by
The University of Wsa and PennWell Books
Edited by
Kerry L. Sublette Thomas M. Harris Francis S. Manning
Conference Sponsors:
AMOCO Production CONOCO, Inc.
Mr. James McGill
INTRODUCTION
The successful use of hydrocyclones to clean produced water on offshore platforms has renewed an interest in thrs unit operation as a liquidiquid separator (1). The use of relatively long hydrocyclones to separate a light dispersed phase having a density smaller than water was studied by Regehr (2). Regehr's research with oil in water dispersions showed that high inlet velocities caused droplet breakup. Bohnet (3) also noted that liquidfliquid separation in hydrocydones required smaller inlet velocities than sometimes used to separate solidAiquid suspensions. Regehr also observed that the separation efficiency does not increase with flow rate or hydrocyclone length as much as expected based on residence time theory which uses oversimplified assumptions about the flow field. He suggested that this observation may be related to a reduction in the angular momentum as the length of the hydrocyclone increased and suggested that a secondary flow stream should be injected into the lower portion of long hydrocyclones to maintain the swirl. By using a tangenmi inlet design dose to the optimal design recommended by Retema (4) and by Bradley (5) for solid/liquid separation, Colman and Thew (6) showed that a long double-cone hydrocyclone (CT-hydrocyclone) could separate oil-water mixtures having a dispersed phase density of 900 kg/m3 and a mean drop size larger than 30 microns.
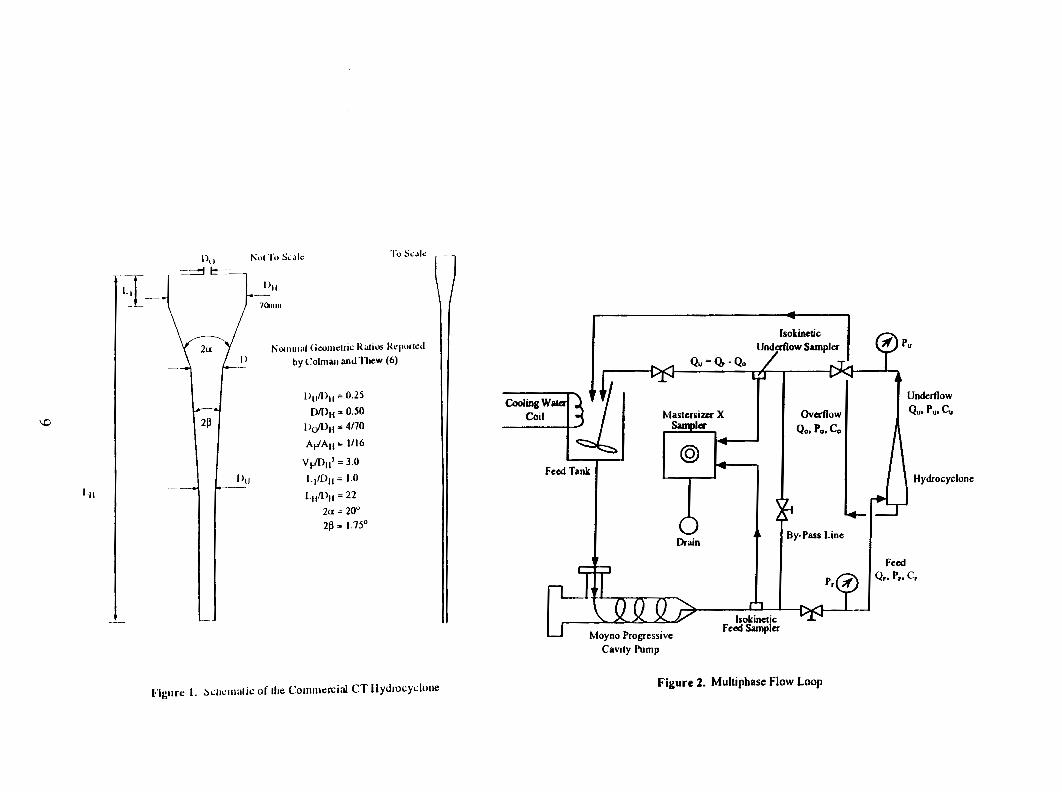
The CT-hydrocyclone uses a double cone configuration to control the flow structure. The upper cone has a half-angie of 10 O , which is also commonly employed for heavy dispersion separation (4,5). The lower cone has a half-angle of only 0.75 O .
Colman (7) studied the influence of the fine taper on separation performance and concluded that an optimal separation occurred for tapers in the neighborhood of 0.75". This result may be due to an increase in the separation length as noted earlier by Regehr (2). More recently, Young et al. (8) also reported an opnmal taper angle for a class of single-cone deoiling hydrocyclones.
Simms et ai. (9) studied a " m e r c d version of the CT-hydrocyclone at room temperature and observed increases in the 50% cut-size, t50, by more than a factor of two as the concentration increased from 1,000 ppm to 5,000 ppm. At higher temperatures, the effect was more pronounced. They attributed these results indirectly to drop coalescence and subsequent breakup of unstable drops in the high shear fields characteristic of hydrocyclone flows. The mfiuence of drop breakup on the separation performance of a commercial CT-hydrocyclone for low dispersed phase concentrations (< 1,000 ppm) and for particle size distributions having mean particle sizes up to 60 microns is presented here as a complement to the previously mentioned paper of Simms et al.
2
SEPARATION PRINCIPLES
The separation of a light dispersed phase (oil) from a heavy continuous phase (water) in a hydrocyclone occurs as a results of a large centrifbgal force field caused by the swirling flow. In a reverse flow hydrocyclone, the oil and water are removed at opposite ends. As oil droplets of size P move radially towards the axis, the continuous phase moves axially towards the underflow. The specific axial location at which an oil droplet intersects the reverse flow core depends upon its size and the radial distance at which it begins its trajectory.
The mean residence time provides an estimate, albeit approximate, of the time available for the oil droplet to migrate into the reverse flow vortex and, thereby, be removed with the overflow stream. The migration time of the oil droplets to the centerline of the flow field can be estimated by calculating particle trajectories governed by a quasi-steady state force balance (10). For small particle sizes for which Stokes' law applies, the controlling parameter for separation is a relaxation time given by
In Eq. (l), 4 denotes the diameter of the particle; pc, the viscosity of the continuous phase; and , pc - pD, the density difFerence between the continuous phase and the light dispersed phase. For produced water, T,(P) may range from lo-' to lo4 sec.. If L, represents the length of the reverse flow core vortex in a hydrocyclone with major radius &, then a critical particle trajectory for an ?,,-diameter particle would have initial c o o r h t e s and final coordinates of &, 0) and (0, L,), respectively. Because particle trajectories for the same size particle do not cross, all particles having a diameter equal to PI, will be recovered in the overflow stream regardless of their initial coordinates.
Dimensional analysis anticipates a relationship between the relaxation time for the e,,-diameter particle, ~,(100), the radial migration distance for the critical trajectory, RH, the axial migration distance for the critical trajectory, L,, and a characteristic velocity scale, k. If uc is identified as the tangential velocity near (RH, 0), then uc = aFuF. uF is the bulk average velocity of the feed and aF (0.5 I aF s 1) is an empirical coefficient which depends on the design of the feed entry and on the inlet Reynolds number ( 5 )
3
For aF = 1, a characteristic Stokes' number can be defined as the ratio of the radial drift velocity near (h, 0) to the tangential velocity near (RH, 0)
T,(Q is the relaxation time for a cut-size diameter of P,. Stk(Q will depend on the geometric ratios related to a specific design, a characteristic Reynolds number, and the influent and effluent flow ratios. For the CT-hydrocyclone, Stk(P,,) at large values of Re, (> 150,000) approaches an asymptotic value of 3 x 1 04, which is close to Stk(P,,) for Rietema's optimal cyclone for solid/liquid separation (1 1).
If drop breakup occurs, the measured Qso cut-size of the separation will increase as the mean particle S i in the feed increases. The cut-size can be estimated experimentally by measuring the particle size distributions (fF(Q) and G(P)) and the concentrations (G and CJ of the feed stream and the underflow stream of the cyclone. With ths information, the underflow purity coefficient E, and the underflow grude purity coefficient G,(Q) can be calculated as follows
The cut-size I?,, of the separator is defined by G,(O,,) = 0.50.
GJP) depends on the hydrocyclone design, flow parameters, and dispersion properties. It measures the ability of the separator to prevent a certain size particle fiom appearing in the underflow stream. G&) was determined from the experimental data by numerically differentiating the cumulative distribution fhctions and using the definition of G, given by Eq. (5). The experimental data for G, can be represented analytically by using the following empirical equation ( 1 1, 12)
The three dimensionless constants a, b, and c can be determined from the experimental data bvusing three cut-sizes: G,(Q,,) = 0.35, G,(O,,) = 0.50. and G,(P,,) = 0.75.
4
DESIGN AND OPERATION
Figure 1 shows the shape of a commercial CT-hydrocvclone used to conduct the study reported heremafter. The major diameter DH is 70 mm. The transition between the upper cone and the lower cone occurs at D/DH = 0.50; the overall transition between the upper cylindrical portion and the underflow tube has an approximate contraction ratio of DJDH = 0.25. The volume of the hydrocyclone is approximately 3 D:. Therefore, for DH = 70 mm and QF = 100 lpm, the mean residence time is approximately 0.6 sec.
For liquid/liquid separation, Bradley (5) recommends that the equivalent diameter of the feed should be between 0.20 D, and 0.33 DH. The optimal hydrocyclone developed by Rietema (4) for solidfliquid separation specifies DF = 0.28 D,. The CT-hydrocyclone and its commercial counterpart shown in Figure 1 set DF/DH - 0.25. Thus, the upper portion of the CT-shape module as well as the area ratio spdca t ion for the feed inlet conform to traditional hydrocyclone practice for solidliquid separation. The long taper section followed by a cylindrical tailpipe is needed to provide sufficient residence time for the light dispersed phase to drift into the reverse flow vortex.
For dilute suspensions (<lo00 ppm), the overflow rate should be a small fraction of the feed rate. However, as the overflow ratio QdQF decreases below a critical value at a fixed feed rate and a fixed overflow onfice size, the underflow purity will decrease sharply. Colman (7) attributed this phenomenon to instabilities in the reverse flow vortex as it approaches the ovefflow orifice. Dvorak (10) noted that the decline in the underflow purity was associated with a sudden flow reversal of the vortex core towards the apex. Thus, a critical overflow ratio (QdQF),, which depends on D@H, is an important operating characteristic for deoiling hydrocyclones.
EXPERIMENTAL PROCEDURES
A dilute (< 1000 ppm) kerosene in water dispersion at room temperature was used in this study. The hydrocyclone defined by Figure 1 was tested in a flow loop which runs in a continuous mode (see Figure 2). Magnetic flow meters are used for measuring the flow rates of the lnnuent and effluent streams. High accuracy Bourdon type gauges are used for pressure measurements. The feed and the underflow pressures are measured close to the hydrocyclone.
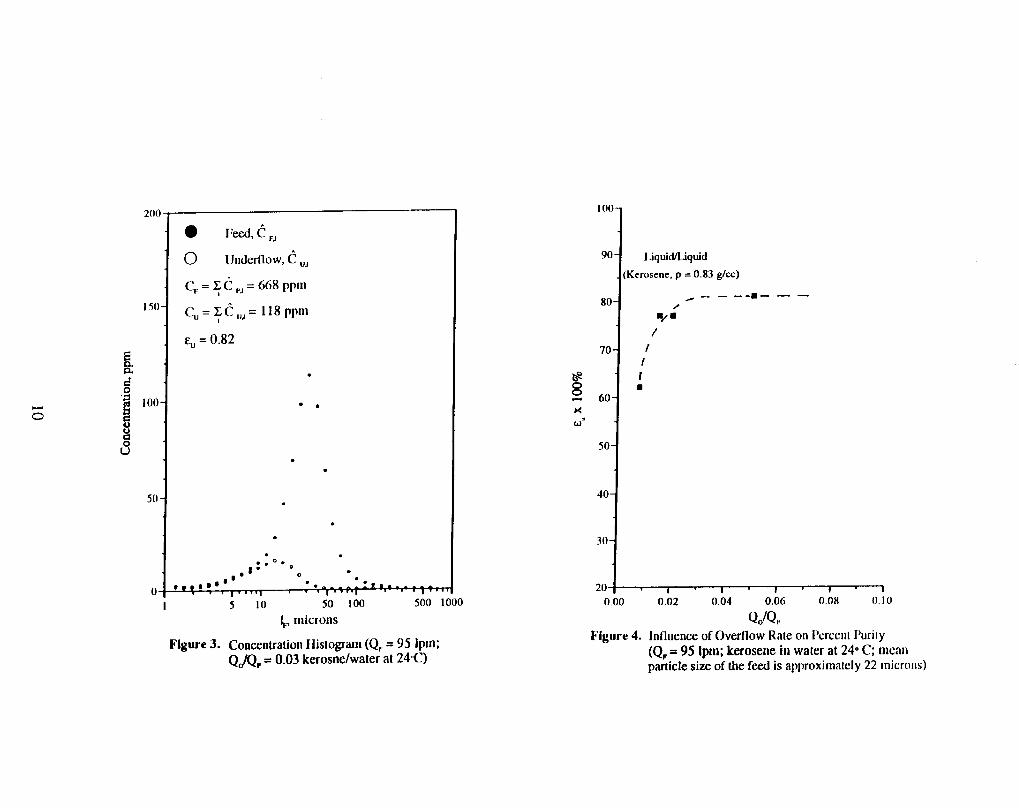
Continuous flow samples of the feed and underflow streams are analyzed for concentration (volume basis) and particle size distribution by using a laser light diffraction techruque (Malvem MasterSizer X). Several 500-sweep measurements were made to determine an average value of the concentration. Figure 3 illustrates an example of the measurements in the form of a concentration histogram. The feed
5
and underflow particle size distribution data are used to calculate the underflow grade purity function G,(P) by using Eq. (5).
RESULTS AND DISCUSSION
Figure 4 shows the effect of the overflow ratio QdQF on the underflow purity coefiicient for QF = 95 lpm. Note that E, reaches an asymptotic value for QdQ, = 0.03. This result is in agreement with previous studies (8,13,14) on similar commercial hydrocyclones. For = 1/16 (see Figure I), the overflow and feed streams have the same kinetic energy provided QdQF = 1/16. Thus, for the commercial CT hydrocyclone tested, the isokinetic operating point is above the observed critical ratio (QdQF)c = 0.03.
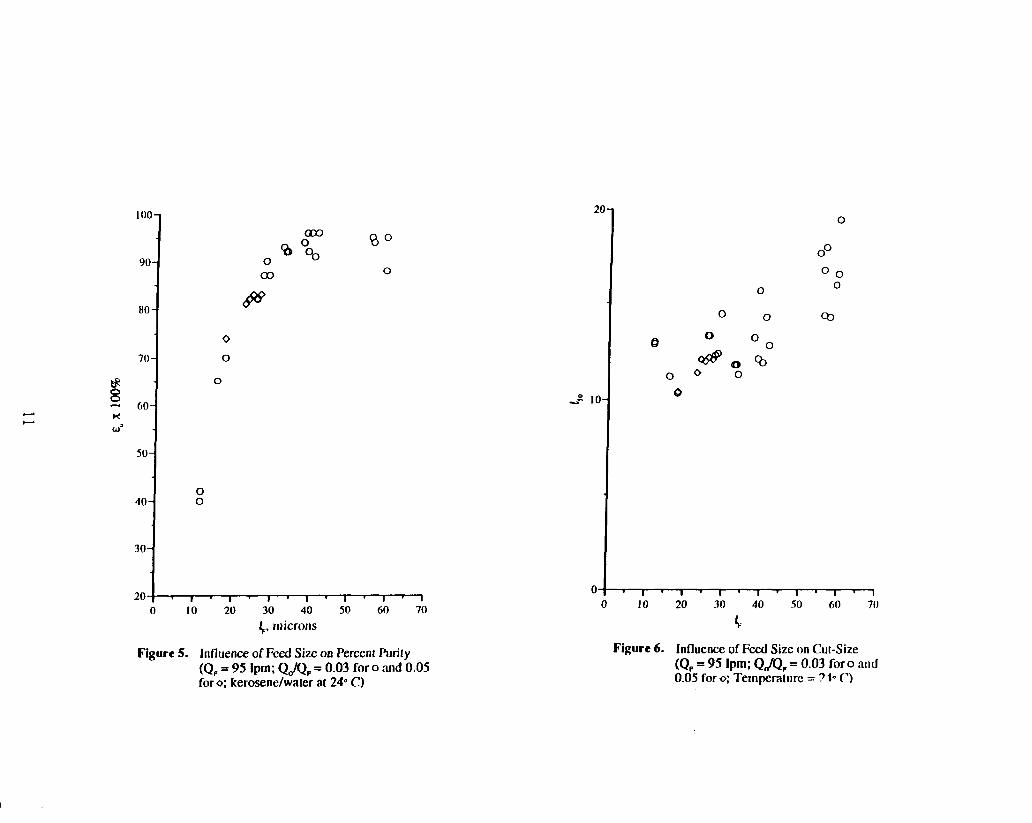
Figure 5 shows how the underflow purity coefficient E, depends on the mean feed size PF for Q F = 95 lpm and QdQF 2 0.03. After a sharp increase in E, as P, increases fiom 10 to 30 microns, E,, reaches a plateau around PF = 40 microns and then begm to decrease. The unexpected decrease in q, with increasing PF at constant flow rate is attributed to drop breakup. Figure 6, which shows an increase in P,, with P,, confirms this interpretation.
For the conditions studied, Figure 6 also shows that the k0 cut-size of the commercial CT-hydrocyclone increases as Q, increases from 25 to 60 microns. For Q, < 25 microns, P, = 12 microns; for P, > 50 microns, the cut-size is clearly above 15 microns and approaches 18 microns for P, = 60 microns. Thus, the Stokes' number (see Eq. (3)) increases by a factor of two as QF increases from 20 microns to 60 microns.
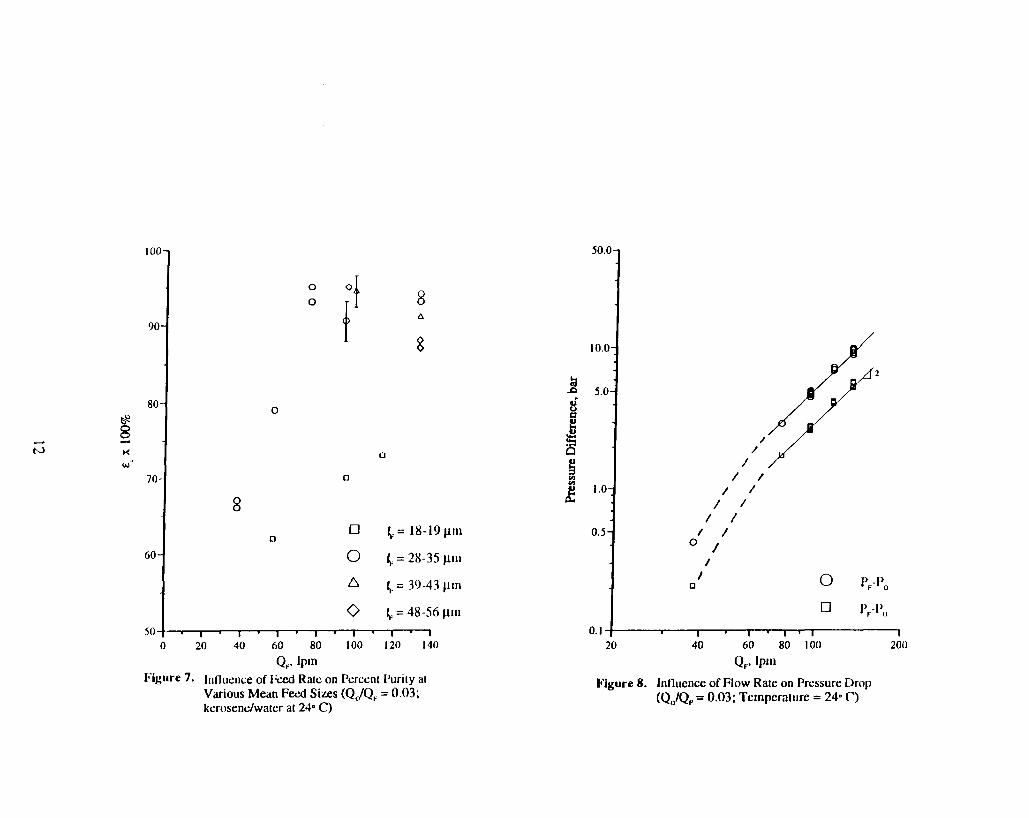
Figure 7 gives the dependence of the underflow purity coefficient E, on the feed flow rate for a fixed split ratio of QdQF = 0.03. Each symbol without a bar represents the result of one experiment. The symbols with vertical bars represent the average value of three or more experiments. The spread in the data is shown by the vertical bars representing one standard deviation fiom the average value on either side. The study included feed distributions with mean sizes between 20 microns and 60 microns. Figure 7 differentiates the performance according to flow rate and feed particle size. For P F = 19 microns, E , rises continuously. For 28 microns I QF I 35 microns. E, shows a plateau at Q F = 75 Ipm (or uF = 5.8 m / s ) . For large particles (a , > 48 microns), the % purity actually decreases from 34% to 86% as QF increases from 95 lpm (u, = 7 . 3 d s ) to 130 Ipm (u, = 10.2 m/s). Thus, the results show that the separation performance decreases for QF > 100 Ipm (> 860 BWPD) if the mean feed size a , exceeds 40 microns.
Figure 8 shows the pressure drop/flow rate characteristics of the hydrocyclone studied. The spiit ratio was fixed at QdQF = 0 03 for all the measurements. The pressures were measured by Bourdon type precision gages installed within 30 cm to 60 cm of the feed and underflow ports. The overflow pressure gage was about 150
6
cm from the overflow orifice. As expected, for Q F 2 75 lpm, the data show a quadratic dependence of the pressure difference on the flow rate. Over the range studied, (P, - P,)/(P, - PJ was constant and approximately equal to 1.7. Note that for QF < 60 lpm, the pressure drop and the separation performance decrease signrficantly (see Figures 7 and 8).
CONCLUSIONS
For stable kerosene in water dispersions at mom temperature, the commercial CT-hydrocyclone defined by Figure 1 has an P,, cut-size of about 12 microns for QF = 95 lpm and QdQ, L 0.03. The relatively low stable overflow rate and low cut-size associated with this separator potentially makes this unit operation an effective clurijier/thickener for dilute oily waste streams containing stable oil drops with a mean particle size larger than 30 microns. However, because the !Iso cut-size for this design increases as the mean feed size increases beyond 20 to 25 microns (see Figure 6), proposed methods to increase drop size for deoiling hydrocyclones may not provide the incremental increase in separation performance anticipated by scaling theories. This drop breakup phenomenon is also expected to impact other hydrocyclone designs.
ACKNOWLEDGEMENTS
The authors acknowledge with thanks the hnding of this research by the Michigan State University Foundation and the Hydrocyclone Development Consortium.
REFERENCES
1.
2.
3.
4.
5 .
6.
Meldrum N., "Hydrocyclone: A Solution to Produced Water Treatment", presented at the 19th Annual Offshore Technology Conference. Houston, TX, 1987.
Regehr, H.U., "A Study of Phase Separation in Disperse Systems by Means of Hydrocyclones", Forsch. Arb. Ing. Wes., 28B, 11-27, 1962.
Bohnet, M., "Separation of Two Fluids in a Hydrocyclone," Chemie-Ing- Tech. 41, 381-387 (1969).
Rietema. K., "Performance and Design of Hydrocyclones - I, 11,111, and IV", Chem. Eng. Sci., 15, 298-325 (1961).
Bradley, D.. The ff\)drocvcione, Pergamon Press, London, 1965.
Colman D.A. and Thew, M.T., "Correlation of Separation Results from Light Dispersion Hydrocvclones", Chem. Eng. Res. Des. 61, 233 (1983).
7
7 .
8.
9.
10.
11.
12.
13.
14.
Colman, D.A., "The Hydrocyclone for Separating Light Dispersion", Ph.D. Dissertation, Department of Mechanical Engmeering, Southampton University, 198 1.
Young, G.A., Wakley, W.D., Taggart. D.L., Andrews, S.L., and Worrell, J.R, "Oil-Water Separation Using Hydrocyciones", presented at the American Filtration Society Symposium, Baton Rouge, LA, Oct. 29, 1990.
Simms, K.M., Zaidi, S.A., Hashmr, K.A., Thew, M.T. and Smyth, I.C., "Testing of the Vortoil Deoliing Hydrocyclone Using Canadian Offshore Crude Oil", in the proceedings of the 4th International Conference on Hydrocyciones, Southampton, England, Kluwer Acedemic Publishers, London (1992).
Dvorak, RG., "Separation of Light Dispersion in Long Hydrocyclones", M.S. Thesis, Department of Chemical Engmeering, Michigan State University, 1989.
Ah, S.K., Yang, Z.C., Foss, J.F., and Petty, C.A., "The Separation Performance of Long Hydrocyclones with an Annular Feed Entry", presented at the 4th International Conference on Hydrocyclones, Southampton, UK, September 23-25, 1992.
Svarovsky, L., Hydrocyclones, Holt, 1984.
Jones, P.S., "A Field Comparison of Static and Dynamic Hydrocyclones", presented at the 65th Annual Technical Conference, SPE, New Orleans, LA, September 23-26, 1990.
Choi, M.S., "Hydrocyclone Produced Water Treatment for Offshore Developments", presented at the 65th SPE Annual Techcal Conference. New Orleans, LA, September 23-26, 1990.
8
ri J
L f
0
9
c 0
0 i
0 F d , e , )
0 Underflow, d ”, c, = p, = 668 ppin
cw = C ,,, = 1 18 ppin
E, = 0.82
. . 0 .
” 0 . @ a @ @ ’ 0.”- ”! . I I . .” I I
IO -
t3?
8 60- K w’
50-
i 40
/ I
I I 8
1
30i 20 f I 1 I I 1
0.00 0.02 0.04 0.06 0.08 0.10
QJQF Figure 4. Influence of Overflow Rate on I’ercent [’wily
(Q, = 95 Ipin; kerosene in water at 240 C; mean particle size of the feed is approximately 22 microns)
80
c c
0 0
0
0
0
B o clco 0 %o
0 00 0
0 10 20 30 40 50 60 70 4, rnicrons
Figure 5. Influence of Feed Size on Percent Purity (Q, = 95 Ipm; QJQ, = 0.03 foro 'and 0.05 for 0: kerosene/water at 240 C )
0
O0
0 0 0 0
0 0
l ' l ' l ' l ' l ' l ' i 10 20 30 40 50 60 70
4- Figure 6. Influence of Feed Size on Cut-Size
(Q, = 95 Ipm; QJQ, = 0.03 foro mid 0.05 for 0; Temperature = ?lo C1)
c w
5 0 . ,
1 O(
9c
80
c(
K u=
70
60
r 1 - I w 1 * I I - I I
8 ’ ’ 8 A
50.0-
10.0-
9 5.0- 5
2 5
1.01
1
0
0
8 0
0
0 A
0
c = 18-19 pin
= 28-35 11111
1, = 39-43 pin
b = 48-56 pin
O ” 1
I / O /
/ I
0 0 PF-Po
0 P,-P, 0. I I,
20 40 60 80 100 200
QF. bin Figure 8. Influeiice of Flow Rate on Pressure Drop