Page 1
A Phenomenological Theory of Electrosorption
Gary Anthony Attard
Department of Physics
The Oliver Lodge Laboratory
University of Liverpool
Liverpool L69 7ZE
e-mail: [email protected]
ABSTRACT
A phenomenological theory of electrosorption is presented based upon notions of local
charge and local electronic polarisability (Friedel oscillations). The strong link between the
extent and nature of ionic and molecular adsorption at an electrode surface and the uv-
absorption properties displayed by such molecular entities in an aqueous solution is
emphasised. The theory may be used to predict, in certain cases the extent of ionic
adsorption at the potential of zero charge (PZC) and, also, to rationalise recent results
pertaining to metal underpotential deposition (UPD) processes on single crystal electrodes.
Page 2
1.
Introduction
The precise nature of the interphase between an electronic conductor and an
electrolyte remains, even after almost a century of intensive scientific research, the central
problem in electrochemical science [1]. This assertion is made in the full knowledge that the
distribution of charges and solvent molecules within the interphasial region and their
dependence upon potential, charge, pH and ionic strength will fundamentally determine all
measurements/transformations carried out via an electrochemical process. However, even a
cursory glance at the copious amounts of literature relating to the thermodynamics and
kinetics [2-5] of electrified interfaces will reveal that the situation is not straightforward.
One of the most contentious issues arising from these studies may be summarised as
follows:-
What are the forces involved in the specific adsorption of ions and, in particular,
how are these ions bonded to an electrode surface?
A working definition of specific adsorption has been put succinctly by Bockris and
Habib:-
"The specific adsorption at the interface between an electronic and ionic conductor is
the adsorption which is in excess or deficit of the amount which would be expected to be
present in the interface from simple Coulombic considerations [1]."
That is, there is an added dimension to the bonding involved in specific adsorption
over and above any electrostatic interaction and which, as yet, remains unresolved. In this
paper, an attempt will be made to address some of the difficulties which exist concerning
physical models of specific adsorption and its major themes, of ionic hydration [6 - 7],
"contact" adsorption [8], partial charge transfer [9 - 10] and donor-acceptor properties of
metal-ion pairs [11].
This paper will be in three parts: firstly, an exposition will be given of a new model
of adsorption based upon local electronic polarisability and local charge; predictions based
2
Page 3
upon this model will then be tested against past, present and newly-emerging data pertaining
to specific adsorption. Second, the consequences of extending the model in a general way to
adsorption processes associated with underpotential deposition will be examined. Finally, the
relative success of the new model for the interpretation and prediction of electrosorption
behaviour with respect to presently-accepted notions of specific adsorption will be discussed.
It is hoped that a coherent, semi-quantitative picture of adsorption at electrode surfaces may
thus emerge.
2. Experimental
A limited number of electrochemical experiments were performed in support of the present
study. These involved cyclic voltammetric measurements of Pt{111} and PtPd{111} bulk
alloy single crystal electrodes. The experimental apparatus together with the preparation
procedures used for manufacturing single crystal electrodes have all been described
previously as has the sources and purity of all reagents used [12 - 14]. All electrolytes were
prepared using pure water obtained from a Milli-Q water system [12] and the flame-
annealing method of Clavilier [15] was utilised to produce clean, well-defined electrode
surfaces. All copper underpotential deposition measurements used a copper wire in contact
with the electrolyte as a reference electrode.
3. Results and discussion
3.1 The Basic Elements
3.1.1 The ion
Figure 1 (a) shows schematically what happens when a negative point charge
approaches a metallic conductor [16].
3
Page 5
(c)
Figure 1: (a) Charge oscillations as a result of a test charge approaching a metal surface
in vacuum. (b) The same situation assuming electronic substrate mediated interactions
for ions approaching an electrode surface. (c) Enhancement of amplitude of Friedel
oscillation for case of cations and anions. The ovoid shape of the iodide and caesium
ions represents the magnitude and direction of the polarisation induced by the local
charge at the surface. The magnitude of the local Friedel oscillation amplitude is in turn
represented by the sign and size of the ‘segment’ in (b) at the surface.
As the test charge approaches the metal surface in vacuum, charge oscillations are
established extending both across the surface and into the bulk and these are referred to
as Friedel oscillations [17 - 18]. In an analogous situation whereby an anion approaches
a metal electrode, because of the dipoles and monopoles that are present in the electrical
double layer, it may be envisaged that the amplitude of the Friedel oscillation at the
surface may be enhanced/stabilised by these species as depicted in figure 1(b) in which
charge displacement takes place laterally across the surface of the electrode with
polarised water dipoles or monopoles stabilising displaced charge. The concept of
electronic substrate mediated interactions is already well established in surface science
studies of adsorption at single crystal surfaces [19]. Similarly for a cation, the same
configuration may be attained but with the polarised water molecules orientated in the
5
Page 6
opposite direction (Figure 1 (c)). This may be thought of as a monopole or dipole
stabilised Friedel oscillation.
In this representation, the degree of ion adsorption will depend upon three factors:
(i) the polarisability of the ion;
(ii) the ability of the polarised solvent molecule to stabilise displaced charge;
(iii) the ability of the metal to localise charge at the ion adsorption site (amplitude of the
Friedel oscillation).
Factor (i) is a function of several variables but both ab initio calculations [20 - 23] and
experimental measurements [24 - 27] of the polarisability of halide ions
have demonstrated that, indeed, the polarisability of the halides increases in the order:
F- < Cl- < Br- < I-
which also happens to reflect the strength of specific adsorption displayed by these ions.
However, when oxyanions are considered, the correlation of specific adsorption with
polarisability breaks down. According to experiments using well-ordered Pt{111}
electrodes, the relative shift in the potential of the "butterfly peak" [28] is a function of the
strength of specific adsorption. If this is correct, the order of specific adsorption should be:
ClO4−
≈ F- < HSO4−
≤ H2PO4−
< C1- < Br- < I- …….(1)
Similarly, calculations of the polarisabilities of the oxyanions in the gas phase indicate that
they exhibit far greater polarisabilities than gas phase chloride ions [29 - 30], as expected
since oxyanions contain many more constituent atoms! Hence, specific adsorption seems not
to be explicable in terms of simple molecular polarisation. However, if one assumes that the
total polarizability of an oxyanion is comprised of individual contributions from each of the
N-O, S-O and P-O bonds (i.e. a localisation of polarizability defined by total polarizability
divided by number of N-O, S-O or P-O bonds) then the values obtained do fit the
electrochemical trend [29]. One of the factors which does influence the polarisability of a
molecule or ion is the difference in energy between the highest occupied molecular orbital
6
Page 7
(HOMO) and the lowest unoccupied molecular orbital (LUMO) [30]. A proxy for this
energy difference is the uv-absorption maxima of aqueous ions.. Therefore, it was thought
interesting to plot the specific adsorption of the halides [31] versus their uv absorption
maxima in aqueous solution [27] (Figure 2).
Figure 2: A plot of specific adsorption of anions at mercury electrodes as a function of uv-
absorption maximum of the ion. Data for y-axis obtained from references 24 – 27, 32 - 33
and the x-axis data taken from reference 31. All uv-adsorption maxima relate to charge
transfer to solvent transitions (CTTS).
As expected, a monotonic increase in specific adsorption is observed as νmax increases. If one
now uses this curve to read off the specific adsorption of bisulphate and dihydrogen
phosphate ions based on their uv-absorption maxima in aqueous solution, excellent
agreement is found with that predicted by the trend outlined in (1).
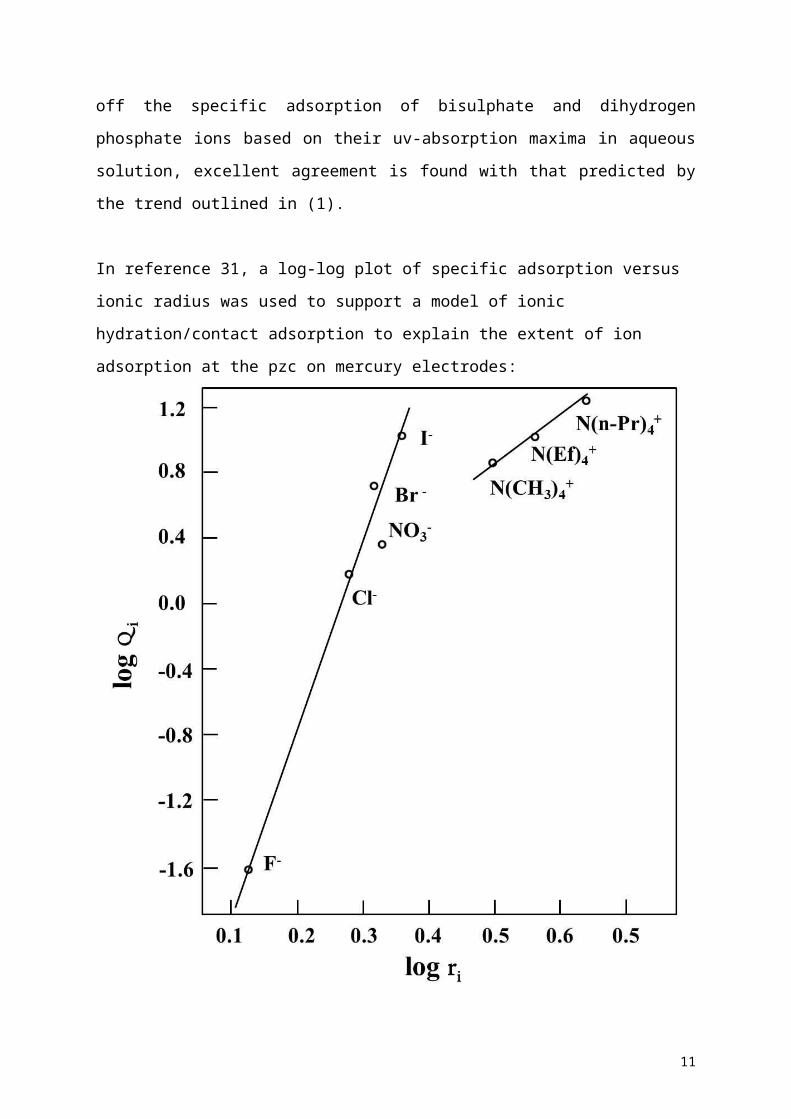
In reference 31, a log-log plot of specific adsorption versus ionic radius was used to support a
model of ionic hydration/contact adsorption to explain the extent of ion adsorption at the pzc
on mercury electrodes:
7
Page 8
Figure 3: A log-log plot of specific adsorption versus ionic radius. Data reproduced from
reference 31.
However, for selected ions for which the polarizability is known, a plot of polarizability
versus specific adsorption (not log-log as above) gives an excellent linear relationship (figure
4):
8
Page 9
Figure 4: Plot of polarizability at a mercury electrode versus specific adsorption for the halide
ions. Polarisability data taken from reference 27.
Interestingly, in reference 31, where the values of specific adption (S) for the halides
were obtained, the rather high values of S quoted for the alkyl ammonium cations did not
seem to correspond to S predicted on the basis of the uv data (methyl, ethyl and propyl
ammonium cations all give rise to νmax values above 53,000 cm-1 which, from Figure 2, would
indicate negligible cation adsorption at the PZC of mercury). However, it should be stressed
that the data in Figure 2 relate to 0.1 M aqueous solutions of ions in the absence of a
strongly adsorbing counter ion. In reference 31, the ionic surface excesses of the alkyl
ammonium ions at zero metal charge were derived from measurements using the iodide salts.
Frumkin demonstrated that the kinetics of many electrochemical reactions are influenced by
the presence of strongly adsorbed ions contained in the double layer [34]. The effects on the
reaction rate of having two strongly adsorbing ionic species was explained using a model of
"ion bridging pairs" formed on the electrode surface in which the distance between the
reacting anion and the cation which is its next nearest neighbour must be taken into account.
That is, enhanced adsorption of cations and anions at the PZC is to be expected if both ions
can specifically adsorb. Therefore, all uv data reported in the present work relate to fluoride
9
Page 10
solutions of the alkyl ammonium cation where such effects as ion pairing at the metal
electrode are expected to be minimal. Later, it will be speculated why mixed anion and cation
layers should be more stable, so long as both ions specifically adsorb. The relevance of this
phenomenon to underpotential deposition will also be demonstrated.
In summary, so long as one knows the νmax for a particular ion (or better, the local
polarizability), it is possible to use Figures 2 and 4 to predict quantitatively the surface excess
of the ion at the PZC of the mercury electrode for a 0.1 M solution not containing strongly
adsorbed counter ions. In reference 35, at 0.1 M, the surface ionic excess of ethyl ammonium
cations at the PZC of mercury is reported and is almost zero as predicted (using ν max for this
ion) but in contradiction to the value of S reported for the iodide salt.
The majority of the uv-absorption maxima in aqueous solution reported in Figure 2
were of the charge transfer to solvent (CTTS) type [32]. It was interesting to note that, when
those ions which give rise to either n or some other intramolecular type of transition
were considered, without exception such ions decomposed into smaller molecular fragments
when in contact with an electrode. So, for example, perchlorate anions generate a uv-
absorption peak "at > 55.5 x 103 cm-1'' [36] which has been assigned as an intramolecular
transition. Perchlorate dissociates on many transition metal surfaces to give ultimately
adsorbed chloride ions [37 - 39]. Similarly, NO3−
, NO2−
, CO32−
and IO4−
give rise to n
or intramolecular transitions and all dissociate into molecular fragments when in contact
with transition metal electrodes [40 - 41]. However, other molecular ions such as bisulphate,
dihydrogen phosphate and acetate, which only generate CTTS-type uv-absorption peaks are
known to be quite stable at electrode surfaces.
Finally, before leaving Figure 2 entirely, it is worth commenting on the fact that the curve
levels off at approximately 65,000 cm-1 indicating that any ion giving rise to a uv-absorption
maxima at values in this range should display extremely weak specific adsorption. Hence, the
relatively poor extent of specific adsorption displayed by alkali and alkali earth cations may
now be readily explained on the basis of the very large energy required for a np6 → (n + l)s
transition [42] and low polarisabilities. In addition, according to figure 4, any ion with a local
polarizability of less than 2.8 Å3 will not specifically adsorb on Hg under the conditions of
reference 31. It is emphasised here that it is not being claimed that excited states (as would be
produced by an incident photon) are being generated at an electrode, rather the influence of
10
Page 11
the electric field polarises the ion such that contributions to the total wave function describing
the electron distribution on the ion are weighted in favour of (unoccupied) excited states
relative to the electronic distribution encountered in the absence of a strong electric field (this
would account also for the strong correlation of anion stability with the nature of the excited
states mentioned earlier). This point will be elaborated later in section 3.2.3. Hence, it is
predicted that anions that undergo CTTS uv excitations (e.g. acetate, sulphate) will not
dissociate at electrode surfaces whereas those that exhibit more repulsive/anti-bonding
excited states (nitrate, perchlorate, carbonate) will tend to undergo molecular fragmentation.
3.1.2 The metal surface
Since localisation of charge is the overriding concern of this paper, what should one
expect of a given ion adsorbing on a particular metal? In terms of localisation of charge, d-
band metals will clearly be better than sp metals (sp bands display significant dispersion
whereas d- bands are relatively "flat"). For both the localisation of positive charge (anion
adsorption) and negative charge (cation adsorption) scaling of specific adsorption with the d-
band occupancy of electrons or holes respectively is expected. Therefore, the strength of
anion adsorption is predicted to follow the trend (Table 1):-
Hg, Bi, Ga, Pb < Ag, Cu, Au < Pd ≤ Pt < Rh < Ir < Ru (anion adsorption)
- localisation of positive charge
Hg, Bi, Ga, Pb < Ag, Cu, Au < Ru < Ir≤ Rh < Pt ≤ Pd (cation adsorption)
- localisation of negative charge
Indeed, many studies, including for example those by Frumkin and co-workers utilising
thermodynamic relationships [2], Wieckowski et al., by means of radio-tracer measurements
[43] and Attard et al. using chemical probes of local potentials of zero total charge (PZTC)
[44] have in general verified these trends at least as far as the transition metals are concerned,
although the positions of Pd and Pt should be reversed. However, it has been reported
previously [45] that, for a given anion (iodide), the strength of specific adsorption on the sp
metals is:
Hg > Bi > Pb > Cd > Ga …. (2).
11
Page 12
Although the strong effect of water desorption has been proposed as the overriding
factor in determining this trend in ionic adsorbability [45], could charge localisation also
account for the experimental findings? Table 1 outlines the band filling and d-band width of
both sp and transition metal surfaces [46]. For transition metals in the same group relatively
little variation in the d-band electronic population is exhibited. However, as one descends the
group, the width of the d-band varies. So, for example, the d-band populations of Ni, Pd and
Pt are 8.97, 8.96 and 8.74 respectively. However, Ni gives rise to a rather narrow band width
in relation to Pd and Pt. That is, the d-band electrons are very much more localised for nickel
and, within the present model, nickel should give rise to extremely strong anionic adsorption.
So strong, in fact, that adsorbed water may also be polarised such that an irreversibly
adsorbed oxide is formed. In a similar vein, although palladium possesses a marginally higher
electronic population than platinum and, therefore, might be expected to adsorb anions less
strongly, the narrower d-band of Pd compared to Pt would lead to a greater propensity to
localise charge. Hence, it is proposed that a balance between electron population in a band
and the ability of the band to localise charge (band width) should ultimately govern the
“adsorbability” of a particular ion. In fact, the quantity (10 – d-band occupancy)/d-band
width (see Table 1) gives a rather good descriptor of anion adsorption strength and also water
interactions for Pt, Rh, Pd, Ir etc as also concluded in a slightly different manner by Norskov
et al [47]. Continuing this theme for the sp metals as a group [48 - 49], by taking the ratio of
p-electron density to s-electron density in the sp-band, it is possible to reproduce the trend
predicted in (2), at least for Ga < Cd < Pb < Bi (see Table 2). (The greater the proportion of p
character, the greater is the ability of the metal to localise charge). It must be remembered
that the large jump in p/s charge in going from lead to bismuth should be tempered by the
greater filling of the sp band for bismuth resulting in very low concentrations of charge
carriers [49]. A prediction made using the present model (Table 2), on the basis of p and s
contributions to the sp band, would be that for a given ion under identical conditions of
concentration and pH, the trend in metal-ion interaction would be:
Ga < Zn < In < Tl < Cd < Pb < Bi
Mercury was found not to follow such a trend in that, of the available band structure
calculations [50], it seems that for the liquid phase at STP, the occupied sp band is typically
70-80% s-character. However, Hg differs from all other sp metals in that its filled d-band cuts
across the bottom of the sp band leading to significant d-sp mixing [51]. This has been
confirmed by photoemission [52]. Hence, although the ratio of s to p character in the sp band
12
Page 13
of mercury would suggest weak anion adsorption, we speculate that mixing of sp and d-band
components enhances the ability of Hg to localise charge such that, of the sp metals, it
displays the strongest anion adsorption. In summary, the ability to localise charge at a metal
surface may be thought of as a measure of the polarisability of the metal in an analogous
fashion to the isolated ion and may even relate to the magnitude of Friedel oscillations
generated for a given adsorbate, although at present, this point remains a speculation.
However, there are a number examples in the literature of surface structure determining the
amplitude of a Friedel oscillation whereby close-packed surfaces appear to generate Friedel
oscillation amplitudes somewhat greater than their more open counterparts [53 - 54]. Again,
the mechanism of differential strengths of anion adsorption at different surface sites may
therefore possibly be explicable in terms of this phenomenon.
For example, it is now well-documented that, for a given metal and ion, the strength
of specific adsorption depends upon the coordination of the atoms (for example in inhibiting
electrosorption of oxide) in the surface of the electrode, i.e. for an f.c.c. metal, the order of
anion adsorption strength is:
{111} > {100} > {110} [55]
It is well understood from surface physics that reduction in the coordination of surface
atoms in pure metals will result in an excess electron surface charge. The extent of this
charge redistribution being greater the more open is the surface. An experimental
manifestation of this effect is the initial state contribution to the core level shift observed by
X-ray photoemission [56]. Hence, the electronic population of the surface d-band is expected
to be greater than that of the bulk. Since the order of surface coordination for f.c.c. metals is:
{110} < {100} < {111}
the order of surface d-band filling should be:
{110} > {100} > {111}
But it has been postulated earlier that the extent of anion adsorption should scale with
electron population of the band. If this is correct, then for a given f.c.c. metal the {111}
close-packed surface (because of its smaller electron population relative to all other surface
geometries), should display the greatest amount of anion adsorption in accordance with
experimental findings. This is a quite general finding - a close-packed surface of a particular
metal should display greater anion adsorption than a more open surface since such a surface
is relatively the most depleted of electronic charge (c.f. the Friedel oscillation amplitudes
being greatest for close-packed surfaces [53 - 54]). Confirmation of this prediction as far as
cations are concerned may be gleaned from experimental observations of Zn2+ UPD on single
13
Page 14
crystal platinum electrodes [57]. Minor changes in the hydrogen adsorption region are
observed for Pt{111} and Pt{100} in the presence of 10 -4 M ZnSO4 whereas, for Pt{110},
significant UPD of Zn2+ ions is reported. As expected, the enhanced electronic charge density
of the open {110} face in relation to the more close-packed orientations would give rise to
enhanced cation adsorption at a fixed electrode potential. Observation of UPD may indeed
simply reflect the larger magnitude of the Friedel oscillations generated by the zinc cation
adsorption on Pt{110} compared to Pt{111}.
3.1.3 Global and local charge and specific adsorption
Drawing all of these threads together - the local polarisability of the anion, the local
polarisability of the metal and also the strength of the solvent dipole/polarisability towards
stabilising the displaced charge - it is now possible to rationalise both specific adsorption or
"superequivalent" adsorption [58] (the notion of negatively charged ions adsorbing on
ostensibly negatively charged electrode surfaces) within a simple framework.
Figure 5 shows schematically the relationship between the shift in the PZC of a metal
in three different situations: (a) in the absence of specific adsorption (E2); (b) in the presence
of chloride (E3) and (c) in the presence of iodide (E4).
(a)
14
Page 15
(b)
(c)
Figure 5 Local values of PZC for anions shifting to more negative potentials as
polarisability of the anion increases. The possibility of water adsorption sites ‘close to’ and
‘away from’ the anion co-existing on the surface is highlighted. (a) No specific adsorption of
anions, (b) specific adsorption of chloride, (c) specific adsorption of chloride and iodide.
It should be noted that the entire charge distribution of the system involving solvent
dipoles, metal polarisability and anion polarisability constitutes the specific adsorption bond
15
Page 16
(all three are concerted processes) with E1 > E2 > E3 > E4. Clearly the shift in the PZC to
negative potentials caused by the presence of chloride (E2-E3) and that caused by the presence
of iodide (E2-E4) (with (E2-E3) > (E2-E4)) reflects explicitly the amount of local polarisation.
Ideas such as these have already been expressed by Ross in relation to stepped surfaces [59],
although the localisation of displaced charge by H2O molecules (or cations) was not
mentioned by this author. Nonetheless, in the opinion of the present author, the notion of a
local potential of zero charge proposed previously by Ross is absolutely correct and has been
explored in detail in another paper [44].
Capacitance and electrocapillarity measurements are macroscopic probes of electron
distribution and their limitation is that they cannot sense local values of PZC. Thus, just as
one may define the charge at a macroscopic surface in the following way [60]:
Q = Qsθs all sites s
where Qs is the local charge and θs is the coverage of sites of a particular type (steps,
terraces, point defects) so too may one do the same, for a {111} f.c.c. single crystal (all sites
equivalent), and assign sites as being at, near to, or far away from, an adsorbed anion. The
net excess charge in this system is always measured using capillarity or capacitance
experiments. However, if one uses chemical probes of local PZC, one may distinguish readily
between the differently charged sites [61]. In reference 61, data for submonolayer coverages
of palladium on Pt{111} being probed by N2O are discussed in relation to CO displacement
measurements of the same surfaces. The N2O reduction current maxima correspond to the
local PZTC of clean Pt{111} sites (0.34V vs. Pd/H) and pseudomorphic Pd{111} islands
(0.1V vs. Pd/H). This means that above 0.34 V the surface is positively charged at all anion
adsorption sites. However, between 0.1 V and 0.34 V, although the Pt{111} anion adsorption
sites are negatively charged (E < E Q=0Pt (111)
) the palladium island anion sites remain
positively charged (E > EQ=0Pd
). Only below 0.1V does one find that the whole surface is
negatively charged.
This is in accordance with the fact that the work function of Pt > Pd [62 - 63]. If it were
possible to measure the capacitance or electrocapillarity displayed by Pd on Pt{111} it should
be found that the PZTC measured would be a global average and would lie between 0.1 V
16
Page 17
and 0.34 V, i.e. when the negative charge on the Pt islands was exactly balanced by the
positive and negative charges on the palladium. This indeed is found to be the case as
determined using CO charge displacement [61] and this idea is illustrated schematically in
figure 6.
Figure 6. The electrode as a ‘patchwork’ of locally charged states for Pd islands deposited on
Pt{111}[61]. The local pzc of the Pd and Pt areas are indicated by the vertical dotted lines.
The arrows indicate the flow of current associated with anion adsorption/desorption at Pt and
Pd sites.
Hence, one may now interpret the determination of PZC by capacitance and
electrocapillarity in a slightly different way. Figure 7 illustrates that it is possible for an
electrode to carry a net excess negative charge although locally, for example at the site of
anion adsorption, the metal may still actually be positively charged.
17
Page 18
Figure 7 Interpretation of PZC as both a macroscopic and local effect by measurement
of surface charge and surface excess of anions (notated on the y-axis as ΓI-)
It is not until sufficiently negative potentials have been reached necessary to
"neutralise" the local excess positive charge at the anion site that complete desorption of
anions will be observed. Hence, we highlight once again that the unusual idea of negative
charges adsorbing on negatively charged surfaces (even if the electrolyte responds by
balancing the charge and maintaining electroneutrality [64]) need not be invoked to explain
specific or “superequivalent” adsorption. An alternative interpretation of "superequivalent"
adsorption would simply be that, although the total excess charge on an electrode may be less
than zero, locally if anions are still adsorbed, there is an excess local positive charge at the
anion adsorption site. As a corollary to this, the second element to the theory may now be
stated:
3.2 The Postulates of the Theory
The following postulates are listed to interpret specific adsorption:
(i) Anions will only adsorb on a locally positively charged site, i.e. when E ≥ EQ=0local
(ii) Cations will only adsorb on a locally negatively charged site, i.e. when E ≤ EQ=0local
18
Page 19
A third postulate which has not as yet been discussed may be stated as follows:-
(iii) The three stages of ionic adsorption at electrode surfaces are:-
non-specific adsorption specific adsorption chemisorption.
In what follows, the criteria for deciding whether or not an ion is specifically
adsorbed will be described and the transformations necessary to facilitate passage from one
adsorption state into another will be discussed. A strong analogy will be drawn with the idea
of "precursor" states in gas/solid interactions [65].
From postulate (i), it is clear that as long as an anion "sees" a negatively charged
surface, it cannot specifically adsorb. This will be the working definition of "non-specific"
adsorption. To illustrate how this idea works, comparison of HSO 4−
specific adsorption at a
Pt electrode and the case of specific adsorption being absent is discussed. At pH = 1, the
PZTC of Pt/HSO4−
lies in the hydrogen adsorption region [2] (region A in Figure 8).
Figure 8 Schematic diagram comparing the cases of specific and non-specific anion
adsorption on the CV of polycrystalline Pt. For the case of specific adsorption, a mixture of
19
Page 20
sites is highlighted, namely those local to the specifically adsorbed anion and those that are
not.
These potentials are associated with when anions commence adsorbing. As the
electrode potential is made positive of the PZTC, one reaches the double layer region (region
B). We ascribe this region to simultaneous adsorption of anions and re-orientation of water
molecules. If no anions were adsorbing, as E exceeded EQ=0local
, the water molecules would
eventually change their configuration from mainly hydrogen atoms bonded to electrode (E <
EQ=0local
(region A)) to mainly oxygen atoms bonded to the surface (E >EQ=0local
(region B)).
However, as discussed previously, the action of the co-adsorbed anions which specifically
adsorb is to cause (locally) reorientation of water molecules from oxygen down to hydrogen
down in order to stabilise displaced negative charge (enhance Friedel oscillation amplitude),
even though E > EQ=0. Hence, a mixture of water molecules in different bonding
configurations (“close to” and “away from” the adsorbed anion) are predicted to co-exist in
the double layer region. Furthermore, because polarised molecules are being discussed, it
should be noted that if both chloride and sulphate were present, the strength of adsorption of
the HSO4−
and C1- ions will increase as potential increases but to different extents due to
the difference in polarizability of the ions. The on-set of oxide formation corresponds to
the local PZC of the oxide surface [2] and is associated with the fact that some of the water
molecules adsorbed at the surface are highly polarised with their oxygen atoms bonded to the
surface (excess local surface positive charge for H2O molecules bonded to sites not in the
vicinity of the anion). We suggest that at sufficiently positive potentials, the water molecule
dissociates to form a proton which is desorbed from the double layer and a specifically
adsorbed hydroxide ion. However, if the electrode potential is made slightly more positive of
the on-set of oxygen adsorption, an irreversible electron transfer from the specifically
adsorbed hydroxide to the metal takes place with the formation of both surface and place-
exchanged Pt-OH species (i.e. the electron has shifted from the hydroxide anion onto the
metal). It has been demonstrated by Frumkin that the electrode side of the interface bears a
net negative charge after electrosorbed oxide is formed in accordance with this assertion [2].
Hence, although the electrode potential is increasing, the surface itself is negatively charged.
As more and more place-exchanged Pt-OH is formed, the adsorbed HSO 4−
(or chloride)
anions must desorb by postulate (i) (the surface increasing bares a negative charge) - this
20
Page 21
phenomenon has actually been observed experimentally using in situ radio tracer methods
[66]. The whole adsorption process is summarised in Figure 8.
It is reported [67] also that Cl- delays the on-set of oxide formation relative to HSO 4−
on platinum and this may readily be rationalised within the present model by the fact that one
needs to be able to re-orientate many more H2O molecules from a "hydrogen down" to an
"oxygen down" configuration when Cl- is adsorbed compared to HSO4−
, to produce a given
amount of adsorbed oxide. This causes the on-set of oxide formation to shift to more positive
potentials. To obtain the amount of polarisation necessary to make H2O molecules generate
an oxide phase, a more positive potential is required to dissociate sufficient H2O molecules
(remember adjacent to the chloride, water is actually polarised by a negative charge excess of
the Friedel oscillation). When the extent of anion polarisation is larger, it can lead to very
large overpotentials for oxide adsorption. So, for example, on Pt {111} in 0.5 M H2SO4, the
on-set of oxide adsorption is delayed until 1.2V (RHE) [28]. Evidently, the combination of a
close-packed transition metal surface and a strongly adsorbing anion (associated with larger
Friedel oscillation and water in the ‘disfavoured’ orientation) inhibits oxide formation.
If one now applies similar arguments to a fluoride ion, it is expected to be negligibly
adsorbed in the double layer on the basis of its extremely large HOMO LUMO energy
gap / low polarisability. Nonetheless, given enough polarisation (high enough positive
electric field) or a substrate such as Pd, Ir or Rh which can localise positive charge more
readily than platinum, it too will specifically adsorb. In the Supplementary Information
section we show a CV of fluoride specifically adsorbing on a Pd adlayer on Pt{111}.
The difficulty for specific adsorption of F- on Pt is that, when the potential is
sufficiently positive to cause significant F- adsorption, the polarised H2O molecules referred
to earlier generate an oxide layer which, of course, leads to a negatively charged surface i.e.
as far as fluoride ions are concerned, their specific adsorption will remain negligible (in the
double layer region due to low intrinsic polarisability) or non-existent (in the oxide region
because the oxide bears an excess negative charge) i.e. fluoride is essentially non-specifically
adsorbed at all potentials. The same argument (in reverse) holds for cations such as Na+ in
that, when the electrode is sufficiently negatively charged to cause polarisation of the cation,
the solvent (H2O) is generating H2 gas since the HOMO LUMO gap on H2O is relatively
much smaller [25 - 26] and its polarisability exceeds that of the alkali metal cation, even
though a metal such as Pt should be very good at localising excess negative charge. However,
21
Page 22
recent work using Pt{110}(highest propensity to localise negative charge of the three basal
planes) has demonstrated weak specific adsorption of sodium cations under some
experimental conditions [68]).
Therefore, the strength of specific adsorption for a particular anion may be thought of
as a continuous polarisation of the anion/metal/solvent system extending over a range of
potential from the local PZC of the clean surface to the on-set of oxide formation. Unlike for
metal-vacuum interfaces, this means that it is unlikely that a single, adsorption strength could
be assigned to species adsorbing at the electrochemical double layer, rather a gradation in
values as a function of potential should be expected.
To summarise, if either the local polarisability of the metal electrode is small or the
HOMO LUMO energy is large/polarizability small (or both!) an anion will exhibit very
little specific adsorption although even the most "non-specifically" adsorbed anion should
display some adsorption so long as E > EQ=0local
. This process will cease when the surface
bears a net negative charge such as when an oxide layer or a hydrogen monolayer is formed
[2].
3.2.1 The role of pH in specific adsorption
The strength of specific adsorption is actually pH dependent. That is, at low pH, a
chloride anion will strongly specifically adsorb on a platinum electrode for example whereas,
at high pH, this anion is essentially non-specifically adsorbed [69]. Even iodide gives rise to
such behaviour. Irreversible adsorption of iodide ions from an acidic solution onto a Pt{111}
electrode will block almost all hydrogen underpotential deposition (Hupd) since a strongly
chemisorbed layer of iodine is formed [70] (see later). However, if the same experiment is
performed at high pH, hydrogen underpotential deposition proceeds irrespective of iodide
ions being present in the solution [71]. Furthermore, the voltammogram reported for this
system is rather similar to that of Pt{111} in sulphuric acid in the region of initial iodide
adsorption [15] - anomalous spike included! The similarity is even more striking if one
compares the voltammetry of Pt{111} in 0.1M H2SO4 and bromide adsorption on Pt{111} at
pH = 10 [71].
These experimental findings pose two questions:
22
Page 23
1 If ionic hydration is a critical factor in determining the strength of specific adsorption,
how shall this be affected by pH?
2 Why should a "universality" in the voltammetry of Pt{111} with regard to anion
adsorption be found which is a function of pH?
If we take question (1) first of all, in the opinion of the author, ionic hydration is not affected
by pH and so cannot be a major factor in determining the strength of specific adsorption.
Other experimental data, particularly radio-tracer measurements of anion adsorption and
exchange with the solution [72 - 73] have demonstrated that solvation is a dynamic process.
Water molecules are attached and detached from the central ion with corresponding rate
constants. On the electrochemical time scale, the collisions of the anion-water complexes
with the electrode are frequent and the probability that there will be a direct contact of the
"naked" or "partially naked" anion with the metal is high irrespective of charge density on the
ion. Therefore, can local polarisation explain these phenomena? Evidently the absolute
energy of the HOMO and LUMO levels of a halide should be independent of pH. Hence, the
local polarisability of the anion should remain the same. Let us suppose that we can
deconvolute the two independent processes that contribute to the specific adsorption of an ion
(S) discussed so far and assign them a value that we shall call f:
f 1 = local polarizability of anion
f 2 = local polarizability of metal
If this is indeed correct, then the specific adsorption strength S may be expressed as:
specific adsorption = S = f1(local polarisability) x f2(local polarisability) strength in aqueous solution of anion of metal.
……….(2)
If the "butterfly" peak voltammetry displayed by I- ions at pH = 13 behaves in the same way
as HSO4−
ions at pH = 1 on Pt{111}, because the butterfly peak is a measure of S, it follows
that:
S(I-, pH = 13) = S(HSO4−
, pH = 1) ...…… (3)
But from (2), we can substitute for S:
23
Page 24
f1(I-) x f2(Pt{111}, pH = 13) = fl(HSO4−
) x f2(Pt{111}, pH = 1)
But fl(I-) > f1(HSO4−
)!
In order to maintain equality between S in both cases, the only conclusion that can be drawn
is that:
f2(Pt{111}, pH = 13) < f2(Pt{111}, pH = 1) …….(4)
What (4) represents within the model is that the local polarisibility of Pt{111} is a function of
pH. No experimental data or theoretical calculation regarding this point exists. However, if
local polarisability of the metal is linked to d-band occupancy (see earlier), then the model
predicts that there is a relative decrease in the surface electronic population of the d-band on
Pt{111} as pH decreases (resulting in an increased ability to localise excess positive charge
on the metal side of the double layer). This would manifest itself as Cl - (aq) ions being more
strongly adsorbed in acidic aqueous media whereas less adsorption would be found when
alkaline conditions prevailed. For I- in acid, chemisorbed iodide layers are formed whereas at
high pH, strong specific adsorption is observed [71, 74]. It is interesting to note that from the
work of Frumkin and Petrii, both polycrystalline Pt and Rh in 0.1 M KC1 under alkaline
conditions carry a negative surface free charge at all potentials [1]. It is predicted that, if 0.1
M KI was used as the background electrolyte in these experiments instead of KC1, for Pt at
least, a positive surface free charge under certain values of electrode potential would be
obtained even at high pH. A summary of how the surface excess of an anion should vary with
pH on Pt is given in Figure 9 and also its relation to the voltammetry of Pt.
24
Page 25
Figure 9 Schematic representation of changes in the extent of chloride adsorption (Γ)
as a function of pH on polycrystalline platinum. PZC = local pzc of chloride site in figure 5.
To conclude this section, the "universality" of the voltammetry of Pt{111} may be
explained on the basis of transformations between non-specifically and specifically adsorbed
states, the degree of specific adsorption being a function of both f l and f2. The prediction
being that, if for a particular metal-anion pair the product of fl and f2 is similar, a similar
voltammogram should be obtained. The voltammetry under acidic conditions of Ir{111} [38]
and Rh{111} [43] as should recent work on bimetallic PtPd{111} and PtAg{111} surfaces
and chloride adsorption on Pt{111} [74 - 76] should be consulted regarding this point. In the
Supplementary Information section, our own data on sulphate adsorption on PtPd{111}
alloys and chloride specific adsorption on Pt{111} are compared showing almost identical
voltammetric behaviour. That is, by tuning the electronic structure of platinum to be more
like palladium (narrowing of d-band), sulphate behaves like chloride on Pt{111}.
3.2.3 Description of transformation between specific and chemisorbed state of
ions
The remaining question which needs to be answered is how an anion passes from a
specifically adsorbed state into a chemisorbed state? The classic example of this behaviour is
25
Page 26
iodide adsorption on Pt [71]. In particular, reference should be made to the work of Hubbard
[69] and Abruna [74] in this regard. In order to explain chemisorption in the electrochemical
context, it is necessary to invoke ideas first proposed in relation to adsorption at solid
surfaces from the gas phase and then to modify these ideas slightly in the light of new
calculations as to the effect of strong electric fields on the HOMO LUMO energy on a
particular anion.
The physics of charge neutralisation [78], particularly in relation to ion scattering [79]
is now well developed. When an ion approaches a surface its energy levels may shift and
broaden due to interactions with the electron bands of the solid. This interaction can be
composed of at least three components i.e. Van der Waals interactions, overlap of electronic
wave functions (covalency) and a Coulombic image force of attraction. Although Hagstrum
[80] has shown that the polarisability of a cation is so small that the Van der Waals forces are
negligible for the range of energies encountered in ion scattering spectroscopy [81], this is
not the case when an anion or a polarisable cation approaches an electrode surface.
According to the present proposal, the specifically adsorbed state is a manifestation of
dispersion forces which are accentuated by the high degree of charge localisation engendered
by the presence of polar solvent molecules. Nonetheless, the formation of a "surface
molecule" between an incoming ion and the surface is now accepted as an essential element
of charge neutralisation mechanisms including promotion of electrons into 'molecular
orbitals' generated as a consequence of ion surface collision. Therefore, the relative energy
separation between electrons at the Fermi level (f) and an electron energy level on the ion
() determines the ease with which resonant neutralisation can proceed, i.e. if |f - o| is
"small", equilibration of charge between ion and surface is favourable [79]. If the hole state
on a cation or neutral, for example, lies well below the valence band, resonance neutralisation
is not possible since electron tunnelling through a large barrier is less probable than between
two shallow levels. Since electrons with energy e below the vacuum level, i.e. at the Fermi
level have the smallest barrier to penetrate, these are the electrons involved in charge
neutralisation by resonant exchange. Furthermore, if level broadening () is greater than |f -
o|, some overlap with f may occur such that charge transfer can proceed giving rise to
covalency in the ion-surface bond. Before trying to describe schematically why specifically
adsorbed states ("occupied" LUMO levels) may be stable relative to complete charge transfer
from ion to metal, some ab initio calculations describing the effect of a strong electric field
on the polarisability of a chloride ion in the gas phase are presented [82]. This is because
quantum calculations of ions approaching a surface in the gas phase tend not to include the
26
Page 27
effect of strong electric fields as would happen for an anion approaching an electrode surface.
From Table 2 it is evident that a downshift in both the HOMO and LUMO level of C1- occurs
depending on the strength of the electric field. Of greater significance however is the fact that
the LUMO level is downshifted in energy to a much greater extent than the HOMO level, i.e.
as the electric field strength is increased, the HOMO → LUMO energy gap decreases. In the
present model, this would represent enhanced contribution from states in the LUMO level
such that the strength of specific adsorption (local polarisability) should increase in
proportion to the electric field strength. This effect has been incorporated into figure 10 in
order to explain the behaviour of the energy levels appropriate to specific adsorption and how
transformation into a "chemisorbed" state arises. We define two important energy separations
relevant to this discussion:
= |f - o| for the partially filled electron state in the LUMO level,
and
= |f - o| for the partially filled hole state in the HOMO level.
27
Page 28
Figure 10 Changes in electronic energy states on an anion as a function of distance in the
electrical double layer. Distance in this case also corresponds to a potential dependent change
in the charged state of the electrode. For E < EQ = 0, the anion is non-specifically adsorbed
whereas for E > EQ = 0, the anion begins to specifically adsorb (postulate 1). Γ is the
broadening of a discrete energy level on the anion as a consequence of interaction with
electrons in the surface of the metal.
As the chloride ion approaches the electrode, there is a downshift and broadening in the
HOMO and LUMO energy levels. In addition, specific adsorption commences depending on
the separation in the HOMO and LUMO energies. Since the filled p6 HOMO level on the
aqueous ion is well-removed in energy from f in the aqueous phase [32, 33] and continually
downshifts in energy, as it approaches the electrode, the hole state generated as a
consequence of specific adsorption cannot decay via resonant exchange since is large.
Similarly, at distances far away from the electrode, or when the electric field strength is
small, the electron population of the LUMO level is also stable since is large. However, as
the LUMO level is strongly downshifted in energy due to both interaction with the electron
bands on the solid and the presence of a large electric field, the broadening of the LUMO
state becomes greater than |f - o|. This means that resonant neutralisation may occur with
depopulation of the LUMO level and electron transfer to the metal. At sufficiently large
values of , it may be seen that complete transfer of electronic charge from the ion to
themetal results.
In summary:-
E1 E2
C1-(aq) C1-
(aq) C1 + e
(non-specifically (specifically (chemisorbed) (on metal) adsorbed) adsorbed) E1 < E2
28
Page 29
If a cation is now considered (figure 11), in contrast to anions, the LUMO levels are at
extremely high energies with respect to the vacuum level [42] such that their interaction with
the Fermi level electrons will be negligible i.e. is very large. However, is much closer in
energy to the Fermi energy of the electrons on the metal and is upshifted in energy as the
cation approaches the surface due to image potential effects [79].
Figure 11 Changes in electronic energy states on a cation as a function of distance in the
electrical double layer. Distance in this case also corresponds to a potential dependent change
in the charged state of the electrode. For E > Eσ = 0, the cation is non-specifically adsorbed
whereas for E < EQ = 0, the cation begins to specifically adsorb (postulate 2). Γ is the
broadening of a discrete energy level on the cation as a consequence of interaction with
electrons in the surface of the metal.
Thus, although, as for Cl-, polarisation of the cation results, dependent on the HOMO →
LUMO energy gap, as specific adsorption proceeds, the interaction of the partially filled hole
29
Page 30
state on the HOMO level with the Fermi electrons dominates the charge neutralisation
process ( > | f - o|). The net reaction taking place is thus:
E1 E2
Cs(aq )+
Cs+ Cs + hole(non specifically (specifically (chemisorbed) (on metal) adsorbed) adsorbed) E2 < E1
If chemisorption is defined as when covalency between ion and metal begins, strictly,
this takes place when f-
However, if f- , charge neutralisation cannot occur even though polarisation
on the ion leading to promotion from HOMO to LUMO levels is efficient. That is, although
the notion of "partial electrovalency" as discussed by Lorenz [9, 10], Vetter and Schultz [83]
and others [84, 85] is almost certainly taking place when f - for f - no
electron transfer from the specifically adsorbed ion to the metal is expected. That is, specific
adsorption may be thought of as ranging (as a function of increasing potential) from a
polarised ion interacting with a polarised metal locally without any electron transfer to (as
electron transfer becomes more feasible) a depolarisation of both anion and metal following
electron transfer. However, according to this interpretation, the transfer of electrons to the
metal occurs via occupation of virtual states created as a result of ion adsorption at the
surface. Using the above description of "specific" and chemisorption behaviour, one may
now rationalise the reported dependence of PZC on two electronically different metals, Hg
and Pt [86] in the presence of iodide. Strong specific adsorption of iodide on Hg leads to a
negative shift in the PZC relative to the clean surface [45]. This is because in order to
"neutralise" the excess positive charge at the iodide specific adsorption site, a more negative
electrode potential is required such that desorption takes place when E<EQ=Olocal/I−
(postulate
1). In contrast, for iodide strongly chemisorbed on Pt, radio-tracer measurements of surface
excess quantities show that the PZC shifts to more positive potentials relative to the clean
surface [86]. As recognised by Frumkin [1], this means that the electron from the iodide must
reside on the metal side of the interface in this case such that the surface bears a negative
charge with respect to the electrolyte (like an oxide), the adsorbed iodine of course being
neutral and covalently bonded to the surface. The reason iodide is only specifically adsorbed
on Hg is due to the small value of f2 (Pt in contrast has a partially filled d-band so exhibits a
larger value of f2). Similarly, for the cation Tl+, although "normally", specifically adsorbed
30
Page 31
cations give rise to a positive shift in PZC relative to the clean surface (see, for example, the
adsorption of alkyl ammonium cations) [1], on platinum, complete charge transfer from Pt to
T1+ takes place such that a metallic T1 overlayer is formed with an excess positive charge on
the Pt [86]. For Tl+ on Pt, a negative shift in PZC is reported in accordance with expectations
[1].
What has just been described is an example of the underpotential deposition of one
metal upon another [87]. Can the model shed some light on processes associated with the
electrochemical deposition of metals?
3.3 Underpotential deposition in terms of localised charges and polarisabilities
Certainly two points need to be stressed:
(A) According to postulate (ii), cations will only adsorb on a locally negatively charged
site, i.e. when E<EQ=Olocal
.
(B) From the previous discussion, specific adsorption of cations shifts EQ=0 to more
positive potentials whereas chemisorption ( f- ) tends to shift the PZC in the
opposite direction. Hence does one observe such behaviour in relation to underpotential
deposition?
According to the model, the strongest specific adsorption of anions will take place on
close-packed surfaces. Therefore, we take as an example copper UPD on Pt{111} since data
has already been published in relation to this system for many different types of anion and
also this surface should give rise to large effects [88 - 92]. Figure 12 shows schematically the
UPD stripping peak of copper on Pt{111} as a function of anion type at constant anion
concentration. The critical parameter to be discussed is "t", the separation between the two
UPD peaks.
31
Page 32
(a)
(b)
Figure 12 Schematic representation of copper UPD in acidic aqueous media on
Pt{111} in terms of local charges for (a) sulphate and (b) chloride containing electrolyte.
Reference electrode is copper wire in contact with the electrolyte (10-3 M copper perchlorate
in 0.1 M sulphuric acid and 10-3 M copper perchlorate in 0.1 M sulphuric acid + 10-3 M NaCl
respectively). At potential E a continuous monolayer of copper is formed. At potential A, no
copper is adsorbed although interaction of copper cations with surface water associated with
32
Page 33
the anion is indicated by the dashed line. The co-adsorbed copper-anion adlayer transforming
into a single copper monolayer via place exchange of the anion by copper is based on
reference 90.
At potential "A", if one compares the situation of C1- and HSO4−
:
EQ=0H 2O (Cℓ−)
> EQ=0
H 2O (HSO4− )
i.e. at the co-adsorbed H2O site, for a given potential, the H2O site associated with
specifically adsorbed C1- is much more negatively charged than for HSO4−
. This site will be
the preferential adsorption site for the aqueous copper cation. By postulate (ii), this means
that the onset of cation adsorption should take place at more positive potentials in the
presence of C1- as compared to HSO4−
. From Figure 12, this is indeed seen to be the case.
Cation adsorption will result in a co-adsorption layer in which a synergistic charge
delocalization will cause both anion and cation to be more strongly adsorbed (potential B).
Theoretical and experimental results [88 - 90, 93] confirm the presence of co-adsorbed anion
and cation layers on {111} surfaces at this stage of deposition. The present theory predicts
why these co-adsorbed layers should be stable. However, to displace the C1 - anion
completely, by postulate (i):
E < EQ=0Cℓ−
But clearly, based on polarisability:
EQ=0Cℓ−
< EQ=0HSO
4−
Hence t (Cl-) > t (HSO4−
)
i.e. the overpotential required to desorb the C1- from a co-adsorbed anion and cation layer is
much greater than that needed to displace HSO4−
. Thus t is (according to the model) a direct
measure of the local polarisation of the anion in the co-adsorbed adlayer and is largest for
chloride relative to bisulphate. However, why should t decrease as one changes to the more
polarisable Br- ion [88]? The answer lies in the fact that if on the LUMO of the Br- is > f-
then chemisorption commences, that is charge transfer from the bromide to the metal is
33
Page 34
facilitated. Accordingly, this corresponds to a depolarisation of the co-adsorbed layer and a
decrease in t. In the limit of iodide adsorption, complete charge transfer from the iodide to the
metal means that t is negligibly small and only one UPD peak may be observed. This is also
the case for other strongly adsorbed anions [93]. However, if copper UPD was carried out at
higher pH, the model predicts that an increase in t will occur as charge is transferred back
from the metal to the iodide due to a decrease in the ability of Pt{111} to localise positive
charge on the anion adsorption site (see earlier). The analogy of this situation with "ion
bridging pairs" should also be noted [34].
3. Discussion of the present model in relation to previous theories of specific adsorption.
It was Grahame who originally postulated that ions contained in the inner layer are
specifically adsorbed [94]. He assumed that specific adsorption involved covalent bonding
between the adsorbed anion and the electrode. However, Levine et. al rejected this proposal
[95]. These workers suggested that the image energy was the origin of specific adsorption.
Calculations by Bockris indicated that the image force was too small to account for specific
adsorption [96]. Bockris also rejected the notion of covalent bonding as the primary
component of the specific adsorption bond [96]. Instead, he supposed that the degree and type
of ionic solvation were predominant in determining the strength of specific adsorption.
According to Bockris, the concept of covalency should be discounted on the grounds that, for
the halide series at least, their specific adsorption on mercury was the reverse of the Hg-
halide bond energy in the gas phase. Hence low hydration was seen as a necessary condition
for specific adsorption to occur. However, contradicting this view, Armstrong [97] reported
the very strong specific adsorption of the sulphide ion on mercury in spite of the fact the
sulphide is strongly hydrated. Also, measurements in aqueous solution have shown that the
weakly solvated PF6−
ion is only slightly adsorbed on mercury [98].
Hence, both in terms of the present theory and previous studies, the notion of
desolvation and "contact adsorption" being a necessary condition for specific adsorption to
take place seems incorrect. An article by Barclay [99] attempted to rationalise specific
adsorption in terms of soft and hard acids and bases (SAHB).
Barclay invoked Jorgensen's [100] view of "hardness" as being associated with "low
polarisability and isolated electronic ground states" whereas softness implied "high
polarisability and low-lying electronic states". The metal surface was assumed as having
34
Page 35
properties of a "soft acid" (metals in zero valent states are soft). In essence the specific
adsorption bond was considered to be more akin to a "donor-acceptor" complex and soft-soft
interactions would lead to strong specific adsorption whereas hard-hard interactions (at
potentials far removed from the metal PZC) would generally be ionic in nature. Hence, for
the halides, the order of specific bond strength should not be explained in terms of the free
energy of covalent bond formation:
M(g) + 1/2X2(g) → MX(g) (a)
but rather as a donor-acceptor complex:
M+(g) + X-(g) → MX(g) (b)
The free energy changes derived from reaction (b) do follow the expected trends in specific
adsorption [99].
The parallels with the present discussions are obvious. Barclay's ideas of specific
adsorption in terms of a SAHB are essentially the same as those expressed here although at a
microscopic level, the importance of co-adsorbed water, the effect of the electric field, and
the relevance of electronic band structure was not discussed. Within the present context also,
"partial covalency" is possible under well defined conditions as described previously. For
ions whose energy levels do not straddle the Fermi energy of the metal electrons, the specific
adsorption state is associated with intra molecular reorientation of electrons on the anion
and on the metal separately.
Conclusion
A phenomenological theory of electrosorption has been presented based on notions of
local charged states on the electrode and local polarisability of the adsorbate. A number of
double layer processes may readily be rationalised within the model and quantitative
predictions of the extent of ion adsorption at the PZC of mercury electrodes may be made
based on the UV absorption of the ion in aqueous solution. The nature of the UV absorptions
(intramolecular of CTTS) exhibited by an aqueous ion may also be used to predict its
molecular stability in contact with an electrode. It is suggested that the model provides a
rational basis for understanding much electrosorption behaviour and, in a future paper, will
also be invoked to predict electrocatalytic trends and understanding of adsorption processes
associated with neutral molecules [101].
35
Page 36
Acknowledgements
Fruitful discussions during the writing of this paper with A. Wieckowski, Juan Feliu,
Nenad Markovic, R. Parsons and T. Vandernoot are acknowledged. Thanks also to Jin-Chao
Dong for assistance in preparing the figures.
References
1. Comprehensive Treatise of Electrochemistry: Volume 1 eds. J.O.M. Bockris, B.
Conway and E. Yeager, (Plenum, New York, 1980).
2. A.N. Frumkin, N.A. Balashova and V.E. Kazarinov, J. Electrochem. Soc., 113 (1966)
1011.
3. D.C. Grahame and R.B. Whitney, J. Am. Chem. Soc., 64 (1942) 1548.
4. A. Frumkin, O. Petri, A. Kossaya, V. Entina and V. Topolev, J.
Electroanal. Chem., 16 (1968) 175.
5. S. Trasatti, Zeit. Physikal. Chem. Neue Folge, 98 (1975) 75.
6. J.O.M. Bockris and P.P.S. Saluja, J. Phys. Chem., 76 (1972) 2140.
7. H. Wroblowa, Z. Kovac and J.O.M. Bockris, Trans. Farad. Soc. 61, (1965) 1523.
8. Modern Electrochemistry, J.O.M. Bockris and A.K.N. Reddy, Plenum, New York,
1970.
9. W. Lorenz and G. Salie, Z. Phys. Chem. (Leipzig) 218 (1961) 259.
10. W. Lorenz, Phys. Chem., 224 (1963) 145.
11. D.J. Barclay, J. Electroanal. Chem., 28 (1970) 443.
12. R.W. Evans, G.A. Attard, J. Electroanal. Chem. 345 (1993) 337.
13. D.J. Watson and G.A. Attard, Electrochim. Acta, 46 (2001) 3157.
14. F.J. Vidal-Iglesias, A. Al-Akl, D. Watson and G.A. Attard, J. Electroanal. Chem.,
611 (2007) 117.
15. J. Clavilier, R. Faure, G. Guinet, R. Durand, J. Electroanal. Chem., 107 (1980) 205.
16. M.W. Finnis, Surf. Sci., 241, (1991) 61.
17. J. Villain, M. Lavagna, P. Bruno, Comptes Rendus Physique, 17 (2016) 276.
18. B. Chatterjee, K. Byczuk, J. Phys.: Conference Series 592 (2015) 012059.
19. P. Han, P. S. Weiss, Surf. Sci. Reports, 67 (2012) 19.
20. S. Kucharski, Y.S. Lee, G.D. Purvis and R. Bartlett, Phys. Rev. A, 29 (1984) 1619.
21. G. Dierksen and A. Sadlej, Chem. Phys. Letts., 84 (1981) 390.
22. E. Bichoutskaia and N. C. Pyper, J. Phys. Chem. C, 111 (2007) 9548.23. P. Jungwirth and D. J. Tobias, J. Phys. Chem. A, 106 (2002) 379.
36
Page 37
24. K. Fajans, Z. Phys. Chem. B, 24 (1934) 103.
25. K. Fajans, J. Phys. Chem., 74 (1970) 3407.
26. S. Yoo, Y. A. Lei, X. C. Zeng, J. Chem. Phys., 119 (2003) 6083.27. H. Coker, J. Phys. Chem., 80 (1976) 2084.
28. J. Clavilier, A. Rodes, K. E1 Achi and M.A. Zamakhari, J. Chim. Phys., 88 (1991)
1291.
29. P. Salvador, J. E. Curtis, D. J. Tobias, P. Jungwirth, Phys. Chem. Chem. Phys., 5
(2003) 3752.
30. S.T. Howard, G.A. Attard and J.F. Lieberman, Chem. Phys. Letts., 238 (1995) 180.
31. T.N. Anderson and J.O.M. Bockris, Electrochim. Acta., 9 (1964) 347.
32. M.J. Blandamer and M.F. Fox, Chem. Rev., 70 (1970) 59.
33. G. Stein and A. Treinin, Trans. Faraday Soc., 55 (1959) 1091.
34. A.N. Frumkin, Trans. Faraday Soc., 55 (1959) 156.
35. G.J. Ogilby, Ph.D. Thesis, University of Bristol, 1966.
36. J. Barrett, Ph.D. Thesis, University of Manchester, 1959.
37. G. Horanyi and I. Bakos, J. Electroanal. Chem., 331 (1972) 727.
38. A. Ahmadi, E. Bracey, R.E. Evans and G. Attard, J. Electroanal. Chem., 350 (1993)
297.
39. C.K. Rhee, M. Wasberg, P. Zelenay and A. Wieckowski, Catalysis Letts., 10 (1991)
149.
40. O. Petrii and T. Safonova, J. Electroanal. Chem., 331 (1992) 897.
41. E. Morallon, J. Vazquez, A. Aldaz and J. Clavilier, J. Electroanal. Chem., 316 (1991)
263.
42. Charlotte Moore, Atomic Energy Levels, Circular of the National Bureau of
Standards, Circular 467, (1958), ed. A.V. Astin.
43. A. Wieckowski, P. Zelenay and K. Varga, J. Chim. Phys., 88 (1991) 1247.
44. G.A. Attard and A. Ahmadi, J. Electroanal. Chem. 389 (1995) 175.
45. S. Trasatti, J. Electroanal. Chem., 65 (1975) 815.
46. M. Brejnak and P. Modrak, Surf. Sci., 247 (1991) 215.
47. B. Hammer, J.K. Norskov, Surf. Sci., 343 (1995) 211.
48. D.A. Papaconstantopoulos, Handbook of the Band Structure of Elemental Solids,
(Plenum, New York, 1986).
49. X. Gonze, J.P. Michenaud and J.P. Vigneron, Phys. Rev. B., 41 (1990) 11 827.
50. L.F. Mattheiss and W.W. Warren, Phys. Rev. B, 16 (1977) 624.
37
Page 38
51. S.C. Keeton and T.L. Loucks, Phys. Rev., 152 (1966) 548.
52. R.W. Joyner, M.W. Roberts and K. Yates, Surf. Sci., 87 (1979) 501.
53. J.M. Li, Jianjun Wang, Q. Sun, Yu Jia, Physica B, 406 (2011) 2767
54. Jia-Jun Tang, Xiao-Bao Yang, LiuZhang Ou Yang, Min Zhu, Yu-Jun Zhao, J. Phys.
D: Appl. Phys., 47 (2014) 115305.
55. M. Bamboa-Aldeco, E. Herrero, P. Zelenay and A.Wieckowski, J. Electroanal. Chem,
348 (1993) 451.
56. W.F. Egelhoff, Surf. Sci. Repts., 6 (1987) 253.
57. S. Taguchi, A. Aramata, M.A.Quaiyyum and M. Enyo, J. Electroanal. Chem., 374
(1994) 275.
58. A.N. Frumkin and A.S. Titievaskaya, Zh. Fiz. Khim., 31 (1957) 485.
59. P.N. Ross, J. Chem. Phys., 88 (1991) 1353.
60. G. Valette and A. Hamelin, J. Electroanal. Chem., 45 (1973) 301.
61. G.A. Attard, O. Hazzazi, P.B. Wells, V. Climent, E. Herrero, J.M. Feliu, J.
Electroanal. Chem., 568 (2004) 329.
62. R. Vanselow and X.Q.D.Li, Surf. Sci. Letts., 262 (1992) L200.
63. M. Methfessel, D. Hennig and M. Scheffler, Phys. Rev. B., 46 (1992) 4816.
64. J.O.M. Bockris and M.A. Habib, Z. Phys. Chem. Neue Folge, 98 (1973) 43.
65. H. Kang and W.H. Weinberg, Surf. Sci.,299/300, (1994) 755.
66. G. Horanyi and W. Wieckowski, J. Electroanal. Chem., 294 (1990) 267.
67. B.E. Conway, D.M. Kovait, J. Chem. Soc., Faraday Trans., 77 (1981) 2341.
68. G.A. Attard, K. Hunter, E. Wright, J. Sharman, R. Martinez-Hincapie, J.M. Feliu, J.
Electroanal. Chem., 793 (2017) 137.
69. F. Lu, G.Salaita, H. Baltruschat and A.T. Hubbard, J. Electroanal.Chem.,222 (1987)
305.
70. J. Clavilier, R. Albalat, R. Gomez, J.M. Orts and J.M. Feliu, J.Electroanal. Chem.,
360 (1993) 325.
71. E. Morallon, J. Vazquez and A. Aldaz, J. Electroanal. Chem., 334 (1992) 323.
72. P. Zelenay and A. Wieckowski, J. Electrochem. Soc., 139 (1992) 2552.
73. P. Zelenay, M. Gamboa-Aldeco, G. Horanyi and A. Wieckowski, J.Electroanal.
Chem., 357 (1993) 307.
74. J.H. White and H.D. Abruna, J. Phys. Chem., 92 (1988) 7131.
75. N. Garcia-Araez, V. Climent, E. Herrero, J. Feliu, J. Lipkowski, J. Electroanal.
Chem., 576 (2005) 33.
38
Page 39
76. J. Clavilier, L.H. Klein, A. Vaskevich, A.A. El-Shafei, J. Chem. Soc. Farad. Trans.,
92 (1996) 3777.
77. T.J. Schmidt, N.M. Markovic, V.Stamenkovic, P.N. Ross, G.A. Attard, D.J. Watson,
Langmuir, 18 (2002) 6969.
78. D.P. Woodruff, Nucl. Inst. and Methods., 194 (1982) 639.
79. S.R. Kasi, H. Kang, C.S. Sass and J.W. Rabalais, Surf. Sci. Repts., 10 (1989) 1
80. H.D. Hagstrum, Phys. Rev., 96 (1954) 336.
81. W. Heiland and E, Taglauer, Nucl. Instr. and Methods, 132 (1976) 535.
82. S. Howard, (private communication). The basis sets used in these calculations were
the same as those in reference 21.
83. J.W.Schulze and K.J. Vetter, J. Electroanal. Chem., 44 (1973) 63.
84. R. Parsons, Advances in Electrochemistry and Electrochemical Engineering, eds:
C.W. Tobias and P. Delahay, Vol. 7, Interscience publishers (1970) New York.
85. B.B. Damaskin, Elektrokhimiya, 5 (1969) 771.
86. T. Ya. Kolotyrkin, O.A. Petrii and V.E. Kazarinov, Elektrokhimiya, 10 (1974) 1352.
87. D.M. Kolb, Advances in Electrochemistry and Electrochemical Engineering, 11
(1978) 125.
88. J.H. White, H.D. Abruna, J. Phys. Chem., 94 (1990) 894.
89. L. Blum and D.A. Huckaby, J. Electroanal. Chem., 375 (1994) 69.
90. R. Gomez, J. M. Feliu and H.D. Abruna, J. Phys. Chem.,98 (1994) 5514. 68.
91. N. Markovic, P.N. Ross, Langmuir, 9 (1993) 580.
92. M. S. Zei, K. Wu, M. Eiswirth, G. Ertl, Electrochim. Acta, 45 (1999) 809.
93. E. Herrero, L. J. Buller and H. D. Abruna, Chem. Rev., 101 (2001) 1897.
94. D.C. Grahame, Chem. Rev., 41 (1947) 441.
95. S. Levine, G.M. Bell and D. Calvert, Can. J. Chem., 40 (1962) 518.
96. J.O.M. Bockris, M.A.V. Devanathan and K. Muller, Proc. Roy. Soc., London, 274A
(1963) 55.
97. R.D. Armstrong, D.F. Porter and H.R. Thirsk, J. Electroanal. Chem., 16 (1968) 219.
98. E.R. Nightingale, Chemical Physics of Ionic Solutions, Wiley (1966) New York.
99. D.J. Barclay, J. Electroanal. Chem., 19 (1968) 318
100. C.F.K. Jorgensen, Structure and Bonding, 1, (1966) 234.
101. G.A. Attard (to be published).
39
Page 40
Table 1
Metal d-bandpopulation
d-bandwidth/e V
(10 - d-bandpopulation)/ d-band width
Ni* 8.97 3.7 - - 0.278
Cu* 9.91 2.8 - - 0.032
Ru* 7.24 8.6 - - 0.321
Rh* 7.99 7.1 - - 0.283
Pd* 8.97 5.5 - - 0.187
Ag* 10.00 3.6 - - 0.000
Ir* 7.65 9.2 - - 0.255
Pt* 8.74 7.3 - - 0.173
Au* 9.89 5.3 - - 0.021
s-electronpopulationof sp-band
p-electronpopulationof sp-band
p/s ratioin sp-band
Ga** - - 2.19 0.65 0.2968
In** - - 2.03 0.92 0.4532
T1** - - 1.71 1.04 0.6080
Zn** - - 1.22 0.47 0.3852
Cd** - - 1.07 0.75 0.7009
Pb** - - 2.18 1.81 0.8303
Bi*** - - 1.99 3.01 1.512
* Data taken from Reference 46.
** Data taken from Reference 48.
*** Data taken from Reference 49 and integrated.
40
Page 41
Table 2
Calculation of the Effect of Electric Field Strength on
HOMO and LUMO Levels of Gas Phase Chloride Ion*
Field/au HOMO/a.u. LUMO/a.u. GAP/cm-1
0 -0.1503 +0.0566 45411
0.001 -0.1503 +0.0544 44928
0.003 -0.1504 +0.0414 42097
0.005 -0.1506 +0.0230 38102
** 0.01 -0.1516 -0.0291 26887
** 0.02 -0.1564 -0.1385 3929
* Basis sets used in the calculation are identical to those in Reference 21.
** Fields of 0.001 a.u. and above are extremely large ( > 5 x 10⁹ Vm-1)
41