Department of Civil and Environmental Engineering The University of Michigan College of Engineering Ann Arbor, MI 48109-2125 INDEPENDENT STUDY REPORT INNOVATIVE HYBRID REINFORCED CONCRETE—SPECIAL SEGMENT FRAME FOR HIGH SEISMIC ZONE by Shih-Ho Chao
This gives the following dead loads: For typical floor (for weight calculations) =58.3+3+7+20 =88.3 psf For roof =58.3+3+7+7 =75.3 psf Live Load
Typical Floor =50 psf Roof =20 psf Building envelope =124’×94’ Floor slab envelope (for dead load calculations) =122’×92’ Floor slab envelope (for live load calculations) =120’×90
Dead Load due to Exterior Wall (full structure) Total Load =0.025× (5’×12’)×2× (124+94) =654 kips
22
1/10 goes to the ground and is not considered =65.4 kips 1/5 goes to the four floors =130.8 kips 1/10 goes to roof =65.4 kips
Dead Load due to Parpet on Roof (full structure) Total Load =0.025× (42/12) 2× × (124+94) =38.15 kips Live Load Reduction Factor
)1525.0(2A
R += (2.1)
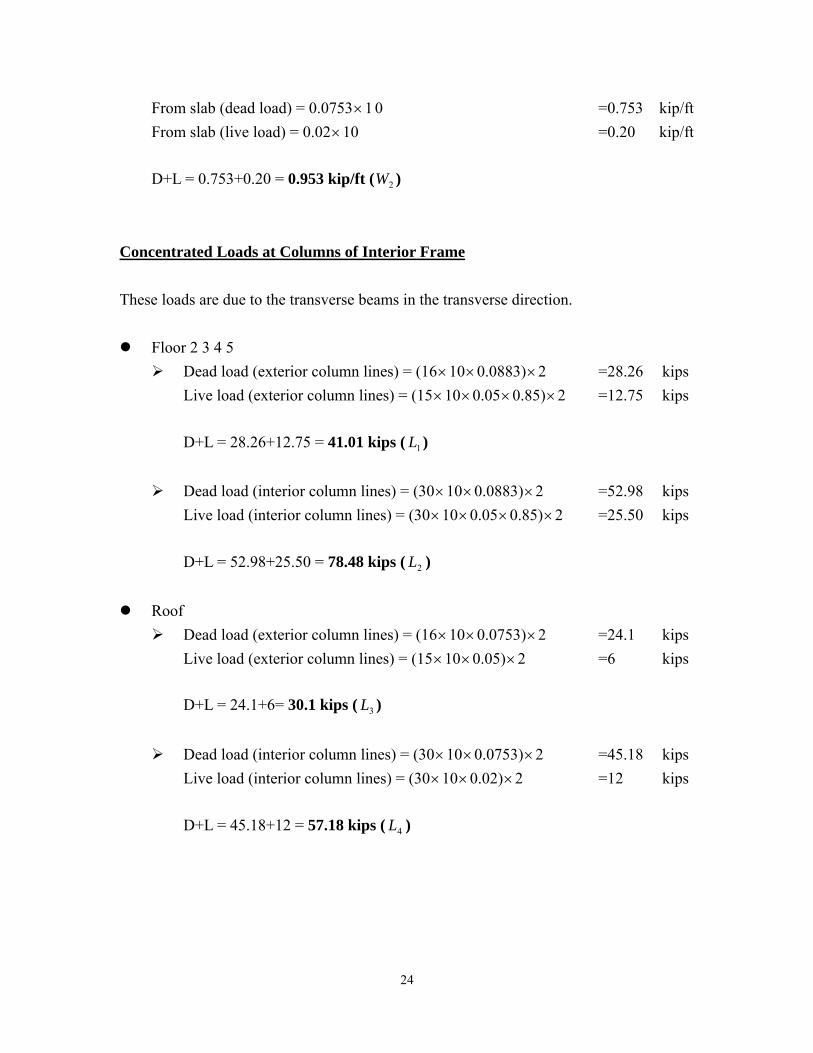
2A = two times the tributary area for beam; four times the tributary area for column For +M 30’×20’ R=0.85 ⇒ −M 60’×20’ R=0.7 ⇒ In this study, using R=0.85 for all elements. All the proportion is according to the interior frame. Beam Load Calculations The beams take the dead and live loads of a 10 ft. tributary.
RESULTS OF INELASTIC PUSH-OVER AND DYNAMIC ANALYSES
4.1 INELASTIC PUSH-OVER ANALYSES
The push-over analyses were performed by pushing both the RC-SMRF and
RC-SSF up to 3% of roof drift. As can be seen in Figure 4-1, in addition to the plastic
hinges formed in the column bases of the RC-SMRF, plastic hinges also formed in the
columns of the third and fourth levels. No inelastic activities occurred in the upper levels.
On the contrary, Figure 4-2 shows that there was no plastic hinges developed in the
columns except for the column bases in the RC-SSF. Furthermore, special segments in
every level entered into inelastic range in the form of buckling and yielding of brace
members, developing plastic hinges in the chord members, and developing plastic hinges
in the vertical members. The RC-SSF has higher redundancy over the RC-SMRF since it
has several lateral-resisting subsystems to dissipate the earthquake-induced energy.
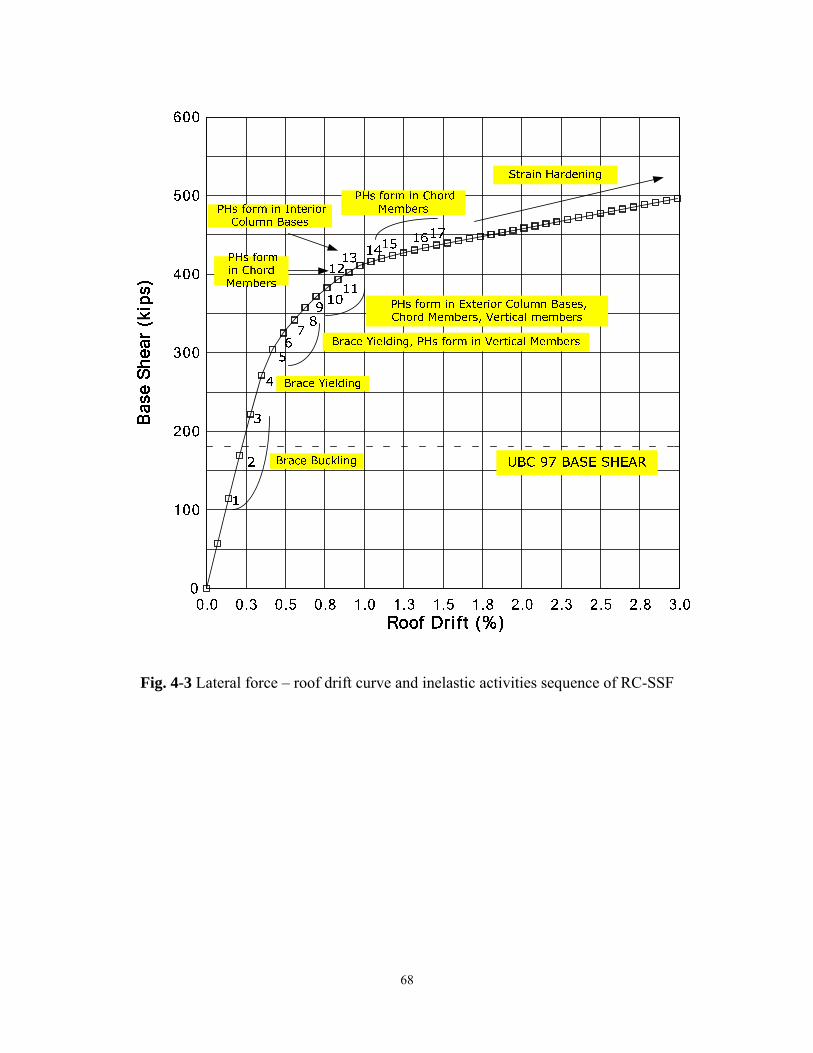
Figures 4-2 and 4-3 provide detail of this characteristic. As can be seen, when the lateral
forces gradually increased, brace members in all floors buckled in the early stage
followed by the yielding of brace members. Then, plastic hinges formed in the exterior
column bases, chord and vertical members of the special segments in all floors. After 1%
roof drift, the plastic hinges of the interior column bases developed. The plastic hinges
continued forming in the chord members up to about 1.5 roof drift; afterward the whole
frame entered strain-hardening stage. Note all the reinforced concrete beams remained
elastic at the end of push-over analysis. All the inelastic activities were confined in the
special segments except for the column bases.
65
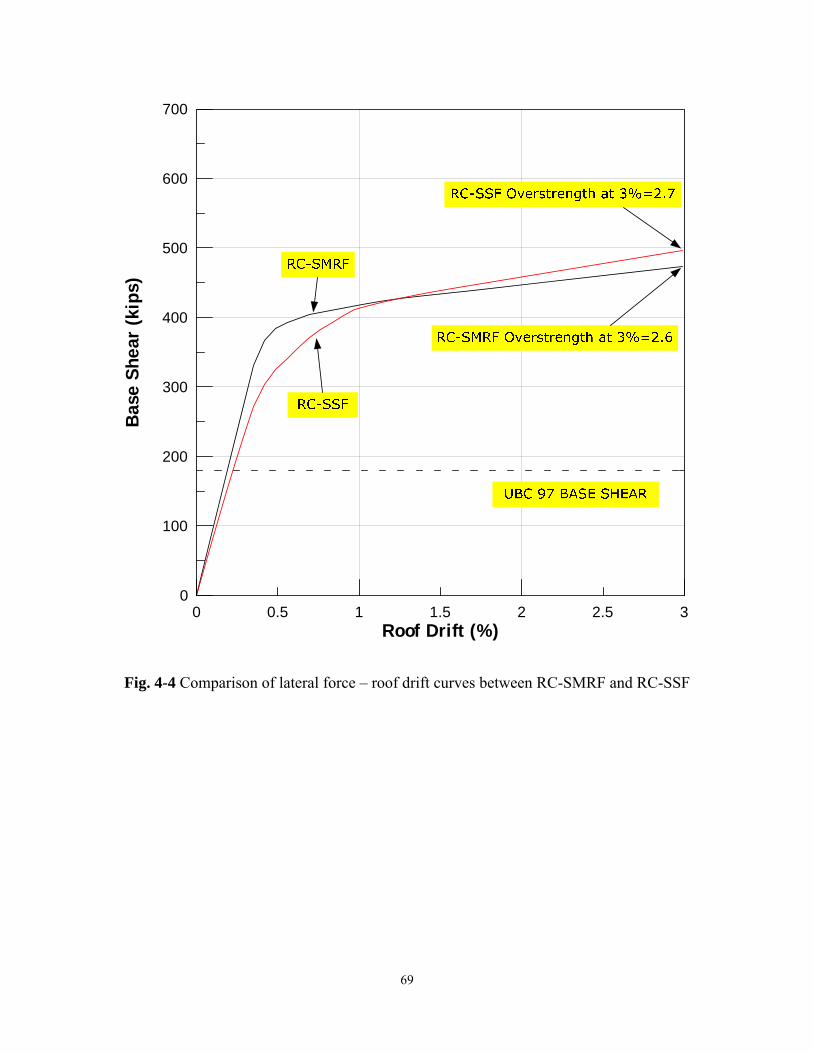
Figure 4-4 compared these two systems and it can be shown that they have almost
identical ultimate strength and system overstrength. The initial global stiffness of RC-SSF
is slight lower than the stiffness of RC-SMRF because of the buckling and yielding of the
brace members in the early stage. Comparison of the story drifts in the push-over process
of these two systems was shown in Figure 4-5. When the roof drift increased, the inelastic
activities concentrated in the lower levels of the RC-SMRF while the inelastic activities
uniformly distributed throughout the height of the RC-SSF. The lower levels of the
RC-SMRF have larger interstory drifts than other upper levels, thus increasing the
possibility of collapse due to P-delta effect. The reason why the story drifts of the
RC-SSF are uniform is that the upper levels participate in energy-dissipation from the
beginning of the push-over analysis so that the special segments of each level can share
the energy. In fact, the first buckled brace members were in the highest level. On the
other hand, the upper levels of the RC-SMRF remained elastic at the end of the analysis.
It has to be addressed that the design of the most top level beams of the RC-SMRF were
governed by the minimum reinforcement ratio; that is, the strength of the beam has
reached the lower bound. It is unlikely to force the upper beams to yield earlier by
weaken the beam strength.
66
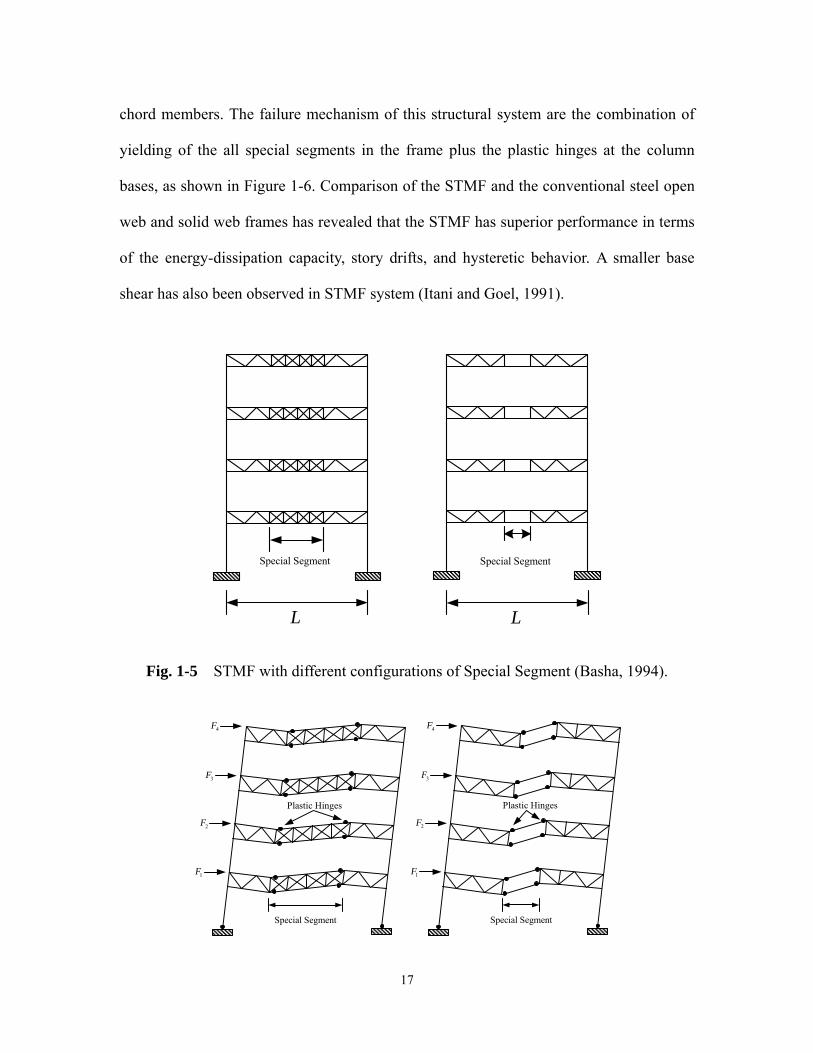
Fig. 4-1 Plastic hinges distribution of RC-SMRF at 3% roof drift
Fig. 4-2 Inelastic activities distribution and sequence of RC-SSF at 3% roof drift
(Numbers represent the sequence of the inelastic activities)
67
Fig. 4-3 Lateral force – roof drift curve and inelastic activities sequence of RC-SSF
68
0.5 1.5 2.50 1 2 3Roof Drift (%)
0
100
200
300
400
500
600
700B
ase
Shea
r (k
ips)
Fig. 4-4 Comparison of lateral force – roof drift curves between RC-SMRF and RC-SSF
69
Comparison of Interstory Drift between RC-SMRF and RC-SSF
RC-SMRF
RC-SSF
Comparison of Interstory Drift between RC-SMRF and RC-SSF
RC-SMRF
RC-SSF
Comparison of Interstory Drift between RC-SMRF and RC-SSF
RC-SMRF
RC-SSF
Fig. 4-5 Comparison of interstory drift changes between RC-SMRF and RC-SSF form
1% roof drift to 3% roof drift
70
4.2 INELASTIC DYNAMIC ANALYSES
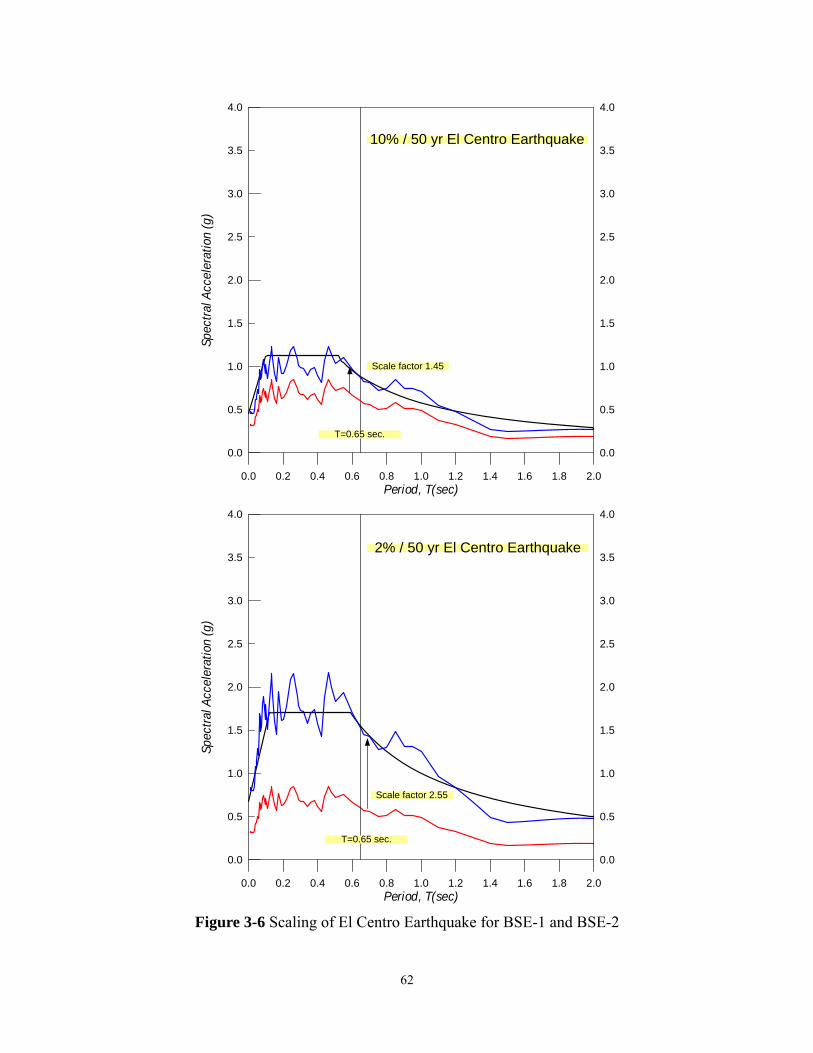
4.2.1 10%/50 yr El Centro Earthquake (Design Level Earthquake)
As mentioned in Chapter 3, the study buildings were designed for the design level
earthquake which has a mean recurrence period of 475 years (10% in 50 year). According
to the current design philosophy, the plastic activities are intended to occur mainly in
beams rather than columns. However, as can be seen in Figure 4-6, many plastic hinges
still formed in the column ends of the RC frame. The reasons contribute to this behavior
have been discussed in Chapter 1. It is easy to perceive the contrast between the seismic
behavior of RC-SMRF and RC-SSF by comparing the results from nonlinear dynamic
analyses in Figures 4-6 and 4-7. The RC-SSF behaved well because: first, all the inelastic
activities were confined in the special segments except for the column bases. Second,
beam ends remained elastic during the earthquake. Third, the plastic rotation demand in
the column bases is considerably smaller than the demand in the column bases of the
RC-SMRF. This is not only due to a stronger column that resulted from the plastic design,
but due to the contribution of the special segment as a “ductile fuse”. Parametric study
has shown that even though the RC-SMRF has the same column sections as the RC-SSF,
the plastic rotation demand is still slightly larger than the demand in the RC-SSF.
Figure 4-8 shows the floor displacements time history while the interstory drifts of
each level are show in Figure 4-9. Apparently, for the RC-SSF, each level has almost
identical interstory drift during the entire earthquake. However, the interstory drifts are
slightly larger in the lower levels of the RC-SMRF. Roof displacement time-history and
the absolute maximum interstory drifts are shown in Figure 4-10 and 4-11.
71
Fig. 4-6 Distribution of damage in the RC-SMRF subjected to design level (10% 50 yr)
El Centro Earthquake (Numbers represent the plastic rotation demand)
Fig. 4-7 Distribution of damage in the RC-SSF subjected to design level (10% 50 yr) El Centro Earthquake (Numbers represent the plastic rotation demand)
72
Fig. 4-8 Floor displacement time-history of RC-SMRF and RC-SSF subjected to design level (10% 50 yr) El Centro Earthquake
73
Fig. 4-9 Interstory drift time-history of RC-SMRF and RC-SSF subjected to design level (10% 50 yr) El Centro Earthquake
74
Fig. 4-10 Comparison of roof displacement between RC-SMRF and RC-SSF subjected
to design level (10% 50 yr) El Centro Earthquake
Comparison of Interstory Drift between RC-SMRF and RC-SSF
RC-SMRF
RC-SSF
Fig. 4-11 Comparison of interstory drift between RC-SMRF and RC-SSF subjected to
design level (10% 50 yr) El Centro Earthquake
75
4.2.2 2%/50 yr El Centro Earthquake (Maximum Considered Earthquake)
The maximum consider earthquake, which has a mean recurrence period of 2475
years, is used in the analysis to evaluate the capacity of the building for preventing
collapse although the frames were designed for earthquake event with a mean recurrence
period of 475 years. Therefore, more severe damage is expected.
The lower three levels of the RC-SMRF showed the potential story mechanism
which can be seen in Figure 4-12. Note that all the plastic hinges in one story did not
happen in the same instantaneous time. On the other hand, the performance of RC-SSF
was quite well and only minor inelastic activities occurred in some column ends (see
Figure 4-13). Floor displacement time histories for both frames were compared in Figure
4-14. Figure 4-15 shows that the interstory drifts in the lower levels (maximum about
3.5%) are larger than those in the upper levels, which in turn could cause the collapse in
the lower levels. Roof displacement time-history and the absolute maximum interstory
drifts are shown in Figure 4-16 and 4-17. Again, the RC-SSF exhibited very uniform
interstory drifts while the drift of the RC-SMRF was concentrated in the lower lever.
76
Fig. 4-12 Distribution of damage in the RC-SMRF subjected to maximum considered (2% 50 yr) El Centro Earthquake (Numbers represent the plastic rotation demand)
Fig. 4-13 Distribution of damage in the RC-SSF subjected to maximum considered (2%
50 yr) El CentroEarthquake (Numbers represent the plastic rotation demand)
77
Fig. 4-14 Floor displacement time-history of RC-SMRF and RC-SSF subjected to maximum considered (2% 50 yr) El Centro Earthquake
78
RC-SMRF2ND
3RD
4TH
5TH
ROOF
0 10 20 30 4
Time (sec)0
-5
-3
-1
1
3
5
-4
-2
0
2
4
Inte
rsto
rey
Drif
t(%
)
Fig. 4-15 Interstory drift time-history of RC-SMRF and RC-SSF subjected to maximum considered (2% 50 yr) El Centro Earthquake
79
Fig. 4-16 Comparison of roof displacement between RC-SMRF and RC-SSF subjected
to maximum considered (2% 50 yr) El Centro Earthquake
Comparison of Interstory Drift between RC-SMRF and RC-SSF
RC-SMRF
RC-SSF
Fig. 4-17 Comparison of interstory drift between RC-SMRF and RC-SSF subjected to
maximum considered (2% 50 yr) El Centro Earthquake
80
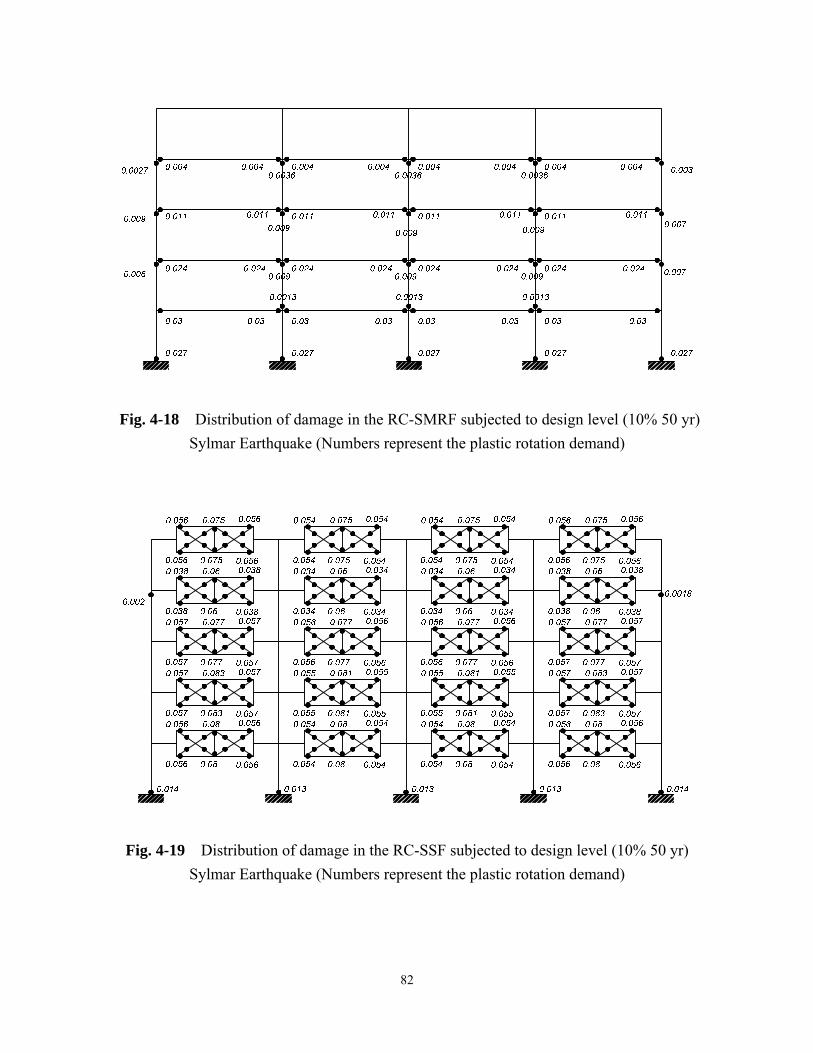
4.2.3 10%/50 yr Sylmar Earthquake (Design Level Earthquake)
As can be seen in Figure 4-18, although the plastic hinges spread in the RC-SMRF,
there was no potential story mechanism formed. The RC-SSF exhibited superior
performance with minor plastic activities in the columns. Figure 4-20 shows that the
RC-SMRF has significant residual interstory drifts, which primarily resulted from the
column hinging occurred in the RC-SMRF. On the other hand, as can be seen in Figures
4-21, 4-22, and 4-23, RC-SSF remained uniform interstory drift and small residual
displacement under a design level near-fault earthquake. The excellent performances such
as immediate reoccupancy, minor damage can be expected.
81
Fig. 4-18 Distribution of damage in the RC-SMRF subjected to design level (10% 50 yr)
Sylmar Earthquake (Numbers represent the plastic rotation demand)
Fig. 4-19 Distribution of damage in the RC-SSF subjected to design level (10% 50 yr)
Sylmar Earthquake (Numbers represent the plastic rotation demand)
82
Fig. 4-20 Floor displacement time-history of RC-SMRF and RC-SSF subjected to design level (10% 50 yr) Sylmar Earthquake
83
Fig. 4-21 Interstory drift time-history of RC-SMRF and RC-SSF subjected to design level (10% 50 yr) Sylmar Earthquake
84
Roo
fD
ispl
acem
ent
(in)
Fig. 4-22 Comparison of roof displacement between RC-SMRF and RC-SSF subjected
to design level (10% 50 yr) Sylmar Earthquake
Comparison of Interstory Drift between RC-SMRF and RC-SSF
RC-SMRF
RC-SSF
Fig. 4-23 Comparison of interstory drift between RC-SMRF and RC-SSF subjected to
design level (10% 50 yr) Sylmar Earthquake
85
4.2.4 2%/50 yr Sylmar Earthquake (Maximum Considered Earthquake)
Compare to the maximum considered El Centro Earthquake, it is evident that
maximum considered Sylmar Earthquake led to much higher plastic rotation demand,
especially in the lower levels which can be seen in Figure 4-24 and 4-25. The seismic
behavior of both frames can be investigated in Figure 4-26, 4-27, 4-28, and 4-29. Under
this earthquake, some potential story mechanism occurred in both frames. However, the
plastic rotation demands in the columns of the RC-SSF were relatively smaller than those
in the RC-SMRF. Note that the plastic rotation demands in the chord members and
vertical members of RC-SSF were very large which will cause those members to fail.
This large demand resulted because that this frame was designed for the 2% in 50 year
event. If the chord or the vertical members fail during the earthquake, it can jeopardize
the structure. This will be discussed later.
86
Fig. 4-24 Distribution of damage in the RC-SMRF subjected to maximum considered (2% 50 yr) Sylmar Earthquake (Numbers represent the plastic rotation demand). Note this frame was designed for 10% in to year event only.
Fig. 4-25 Distribution of damage in the RC-SSF subjected to maximum considered (2% 50 yr) Sylmar Earthquake (Numbers represent the plastic rotation demand). Note this frame was designed for 10% in to year event only. The larger plastic rotation demand would have led to failure.
87
Fig. 4-26 Floor displacement time-history of RC-SMRF and RC-SSF subjected to maximum considered (2% 50 yr) Sylmar Earthquake
88
Fig. 4-27 Interstory drift time-history of RC-SMRF and RC-SSF subjected to maximum considered (2% 50 yr) Sylmar Earthquake
89
Roo
fD
ispl
acem
ent
(in)
Fig. 4-28 Comparison of roof displacement between RC-SMRF and RC-SSF subjected
to maximum considered (2% 50 yr) Sylmar Earthquake
Comparison of Interstory Drift between RC-SMRF and RC-SSF
RC-SMRF
RC-SSF
Fig. 4-29 Comparison of interstory drift between RC-SMRF and RC-SSF subjected to
maximum considered (2% 50 yr) Sylmar Earthquake
90
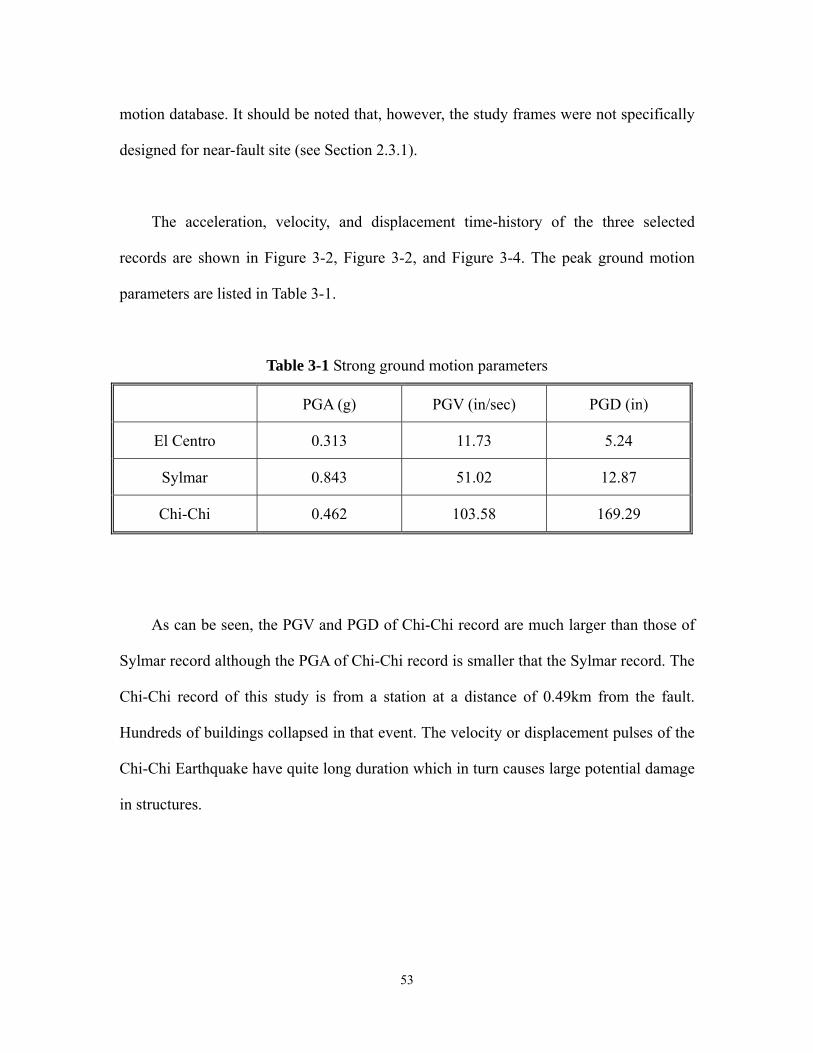
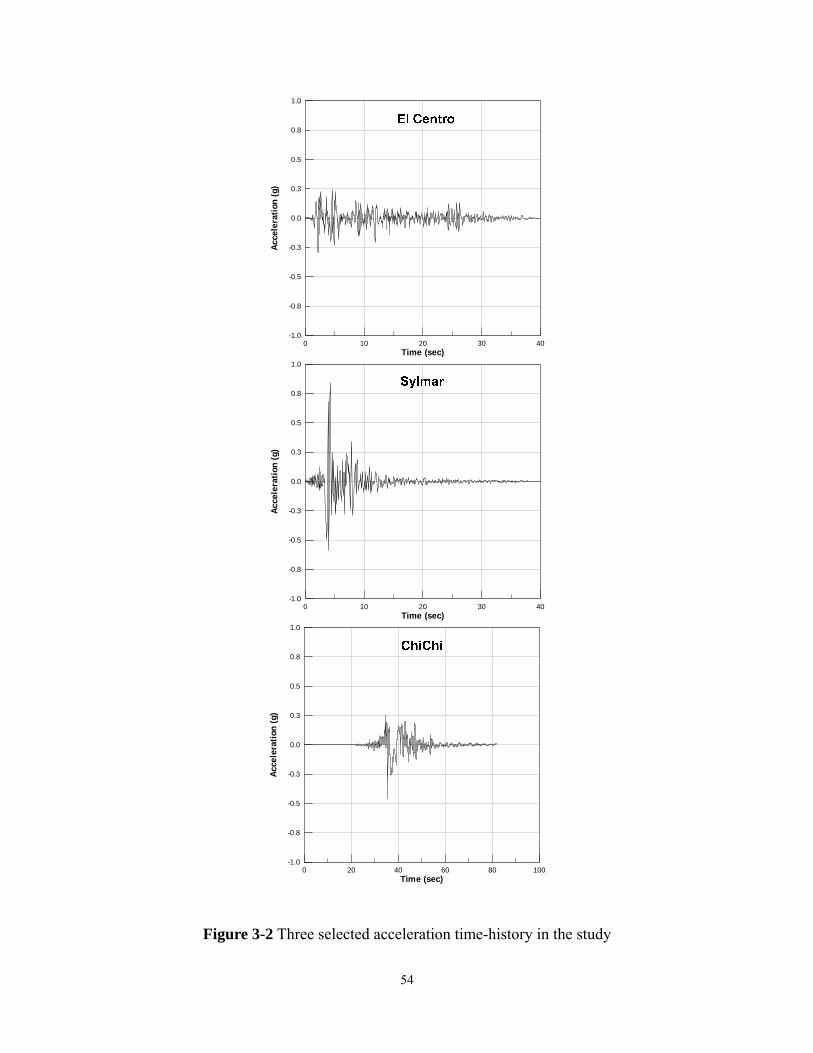
4.2.5 10%/50 yr Chi-Chi Earthquake (Design Level Earthquake)
The record used in this study can be categorized as a very near-fault earthquake
since the distance from the station to the fault is only 0.49 km. Only the design level
earthquake was used in this study because the study frames were designed for 10% in 50
year event without near fault effect (Section 2.3.1). The 10% in 50 year Chi-Chi event is
expected cause severe damage. As mentioned in Chapter 3, the near-source impulse tends
to concentrate the inelastic behavior in the lower floors of buildings because the upper
floors do not have sufficient time to response. This behavior can be easily seen in Figure
4-30. In the RC-SMRF, the lower two levels have rather large plastic rotation demands,
which are about twice the demand under the maximum considered Sylmar Earthquake
(Figure 4-24). Note that in this study the peak ground displacement of the Chi-Chi record
is about 13 times that of the Sylmar record.
On the other hand, the plastic rotation demands in the upper level are even smaller
than the demands when subjected to the design level El Centro Earthquake (Figure 4-6).
As can be seen in Figures 4-32 and 4-33, the lower levels have significantly large
interstory drifts, which could have led to the collapse of the RC-SMRF. However, the
drifts of the upper levels were quite small. Apparently, the upper levels have no time for
response, because most of the input energy was absorbed only by the lower two levels.
This shows a unique characteristic of very near source earthquakes. Another concern
relates to the plastic rotation at the beam ends. As discussed in Chapter 1, plastic hinges
in the beam ends lead to yielding penetration into the beam-column joints. This in turn
could cause the slippage of the reinforcement and thus increase the lateral drift. Very
91
large plastic rotation demands can be found in the lower level beam ends (Figure 4-30),
which could be particularly detrimental to the beam-column joints of the RC-SMRF. Note
these values are used to illustrate the significant damaging of a near-fault event; a real
element cannot sustain such large rotation demand.
The RC-SSF could have performed better under the demands of this very near
source earthquake (Figure 4-31) if the steel elements can sustain the very large rotation
demand. No plastic hinge developed in the beam ends, which diminished the possibility
of failure in the beam-column joints. Furthermore, all columns remained elastic except
for the column bases, and the plastic rotation demands in the column base were
significantly smaller than those in the RC-SMRF. On the other hand, the large plastic
rotation demand in the column bases of the RC-SMRF resulted in very large drift in the
first floor, which might have been one of the primary causes of the collapse of many
reinforced concrete structures in the 1999 Chi-Chi event (See Figures 4-34, 4-35).
By accounting for the near-fault effect in the design process, the RC-SSF can be a
potential candidate for the high seismic zone especially in locations vulnerable to
near-field earthquakes, because of its unique energy-dissipation characteristic. The
inelastic activities of the RC-SSF can be uniformly spread to the special segment in each
level because all the special segments participate in the energy-dissipation process in the
early stages of the lateral deformation of the RC-SSF. Therefore, the inelastic activities
would not be concentrated only in the lower levels.
92
Fig. 4-30 Distribution of damage in the RC-SMRF subjected to design level (10% 50 yr) Chi-Chi Earthquake (Numbers represent the plastic rotation demand). Note rotation demand values are used to illustrate the significant damaging of a near-fault event; a real element cannot sustain such large rotation demand.
Fig. 4-31 Distribution of damage in the RC-SSF subjected to design level (10% 50 yr) Chi-Chi Earthquake (Numbers represent the plastic rotation demand) Note rotation demand values are used to illustrate the significant damaging of a near-fault event; a real element cannot sustain such large rotation demand.
93
Fig. 4-32 Comparison of roof displacement between RC-SMRF and RC-SSF subjected
to design level (10% 50 yr) Chi-Chi Earthquake
Comparison of Interstory Drift between RC-SMRF and RC-SSF
RC-SMRF
RC-SSF
Fig. 4-33 Comparison of interstory drift between RC-SMRF and RC-SSF subjected to
design level (10% 50 yr) Chi-Chi Earthquake
94
Fig. 4-34 Collapse of a reinforced concrete building during the Chi-Chi Earthquake. Note that the building collapsed due to the failure of the first floor columns without
failure in other floors (photographed by Shih-Ho Chao)
Fig. 4-35 Collapse of a reinforced concrete building during the Chi-Chi Earthquake due
to the failure of first floor columns (photographed by Shih-Ho Chao).
95
CHAPTER 5
DISCUSSION AND CONCLUSIONS
5.1 DISCUSSION
As mentioned in Chapter 3, the length of special segment and how many X-panels in
the special segment play a very important role in the behavior of the RC-SSF. A shorter
special segment would place higher ductility demand on each element in the segment. As
can be seen in the data from dynamic analysis of the 2%/50 year (i.e. return period 2475
year) Sylmar Earthquake, the required plastic hinge rotation is about 0.1 radian in the
chord member when experiencing an interstory drift of 3%. The Chi-Chi Earthquake also
requires a extreme high plastic rotation demand.
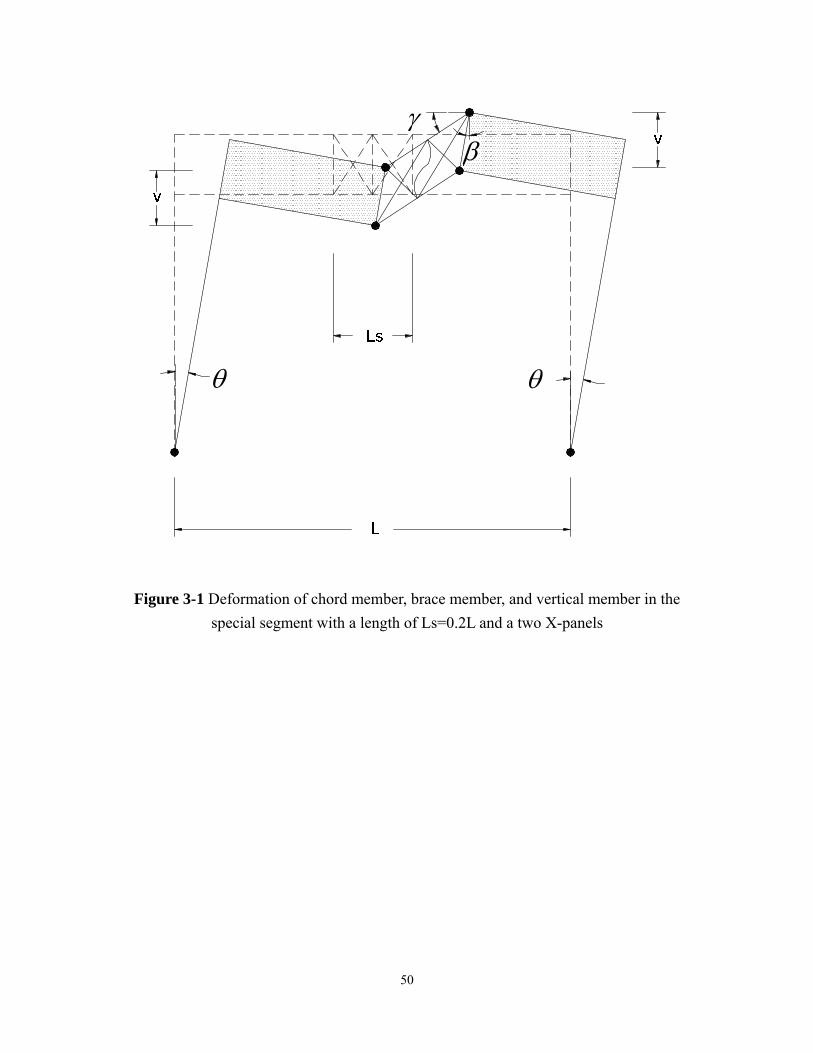
The mechanism in a special segment can be shown as Figure 3-1. When the story
moves laterally to a drift angleθ , plastic hinges are formed at the ends of the segment.
The segment rotates and results in a relative vertical displacement . The vertical
displacement could be expressed as the function of story drift, bay length, and the length
of special segment by assuming the interface of the special segment and reinforced beam
is rigid:
v
)( sLLv −=θ (5-1)
The approximate plastic rotation demand on the chord can be derived as follows:
96
θβγ ⋅=+=sL
LR (5-2)
The length difference of a buckled brace can be derived by the geometric relationship:
)2
cos()(2)()( 2'2 θπ⋅−⋅⋅=−
s
sbb L
LdnLLL (5-3)
where n is the number of panels, d is the vertical distance between the upper and lower
chord members; Ls is the length of the special segment; L is the bay length, θ is the
relative story drift. represents the diagonal length in one panel; is the diagonal
length after deformation.
bL 'bL
From the equation (5-1) it is clear that when the length of special segment increases,
the relative vertical displacement v decreases which translates into less rotation of the
segment, thereby reducing the ductility demand. It also can be found from equation (5-2),
the rotation ductility demand can be reduced once the ratio of (L/Ls) decreases. That is, a
longer special segment would reduce the rotation ductility demand in the chord members.
In equation (5-3), if the bay length L and the segment length Ls are keep unchanged,
the only way to reduce the ductility demand in brace member is to increase the number of
panels, i.e., n.
97
A special segment with a length of 0.2L and two X-panels and a special segment
with a length 0.4L and four X-panels can be compared in Figure 3-1 and Figure 5-1. As
can be seen in Figure 5-1, the plastic rotational demand R1 (= 11 βγ + ), the vertical
displacement, and the elongated and shortened length are all diminished.
For a steel chord member, instability such as lateral torsional buckling or Flange
local buckling would occur before a higher plastic hinge rotation could be reached. Once
the instability occurs, the segment would fail and in turn jeopardize the whole building.
Thus, in order to assure the performance of the RC-SSF, the ductility demand in the
segment should be kept under some limitation. A parametric study conducted by Itani and
Goel (1992) suggested that a range of 0.25L~ 0.5L for length of the special segment
should be generally satisfactory and a four X-panels segment would be preferred, because
of the increased redundancy. By using 0.5L for the special segment in a RC-SSF located
in high seismic zone vulnerable to near-field earthquake could be very suitable. Moreover,
lower ductility demand in brace members would be expected by using four X-panels
instead of two X-panels.
Using a strong chord member or brace member to reduce the ductility demand
instead of using a longer special segment is not suggested. Since the design of member
outside the special segment is intended to be kept in the elastic range, the required
strength could be quite large when a small amount strength is increased in the elements of
special segment. Excess strength can be costly as other members of the frame are sized to
ensure that the special segment is the weakest portion of the frame.
98
With respect to the vertical member, its main function is to transfer shear force. The
strength of this member would not influence the strength of other members outside the
special segment. However, if it is too weak, it could fail. Therefore, a stronger section
could be used for the vertical member to prevent the failure.
1γ
1β
Fig. 5-1. Deformation of chord member, brace member, and vertical member in the special segment with a length of Ls=0.4L and a four X-panels
99
5.2 CONCLUSIONS
1. If the design parameters are the same, the proposed RC-Special Segment Frame
(RC-SSF) generally performs better than the conventional RC moment frame in many
aspects. Nonlinear dynamic analysis results show that, the majority of the input
energy would be absorbed by the special segment, thus keeping the beams and
column in the elastic range. Since inelastic behavior does not develop in the beam end,
the longitudinal reinforcement of beams will remain elastic, thus preventing yielding
from penetrating into the beam-column joints. Therefore, special reinforcement in the
beam ends and beam-column joints could be reduced and this would increase
constructability.
2. RC-SSF has relatively smaller and very uniform story drifts from lower level floors to
upper level floors, thus reducing the possibility of concentration of energy absorption
in any individual floor level (The design process used for the RC-SSF also
contributed to this result). The possibility of a story mechanism would also be
diminished. The unique seismic behavior of the RC-SSF is the consequence that the
special segments participate in the energy-dissipation process in the early stages of
the deformation of the RC-SSF. This occurs by means of uniform buckling and
yielding of the brace members in each floor.
3. The plastic hinges developed in the column base are inevitable for both RC-SMRF
and RC-SSF; however, the plastic rotation demand in the RC-SSF is generally smaller
in the column bases than in the RC-SMRF.
100
4. Repair after a major earthquake is easier in RC-SSF than in RC-SMRF because the
damage is generally confined only within the members in the special segments, which
locate at the midway of beams. On the other hand, damage in the RC-SMRF occurs in
the beam ends and the beam-column joints, where are usually not readily accessible
for repairing work due to presence of transverse beams and floor slab.
5. The adoption of special segments with 0.4L~0.5L and four X-diagonal panels is
recommended for high seismic zone locations that are vulnerable to the near-field
earthquakes. This may reduce the ductility demand in all the members of the special
segment. Further analyses and large-scale experiments should be performed to verify
the analyses and suggestions in this study.
101
BIBLIOGRAPHY
1. Abdel-Fattah, Bahjat; Wight, J. K. (1987), “Study of Moving Beam Plastic Hinging Zones for Earthquake-Resistant Design of R/C Buildings,” ACI Structural Journal (American Concrete Institute), v 84 n 1 Jan-Feb, 31-39
and Commentary (ACI318-99/ACI318R-99),” American Concrete Institute, Detroit. 3. Al-haddad, M. S., and Wight, J. K. (1988), “Relocating beam plastic hinging zones
for earthquake resistant design of reinforced concrete buildings,” ACI Structural Journal (American Concrete Institute), v 85 n 2 Mar-Apr, 123-133
4. American Institute of Steel Construction (1994), AISC-LRFD, “Load and Resistance
Factor Design,” Chicago, Illinois. 5. American Institute of Steel Construction (1997), “Seismic Provisions for Structural
Steel Building,” AISC, Chicago, Illinois. 6. American Institute of Steel Construction (2002), “Seismic Provisions for Structural
Steel Building (Draft),” AISC, Chicago, Illinois. 7. Basha, H., and Goel, S.C. (1994), “Seismic Resistant Truss Moment Frames with
Ductile Vierendeel Segment,” Report UMCEE 94-29, Dept. of Civ. & Env. Engrg., Univ. of Michigan, Ann Arbor, Michigan.
8. Bolt, B. A. (1996), “From earthquake acceleration to seismic displacement,” Wiley,
New York, 49pages. 9. Bruneau, M., Uang, C. -M. (1998), Whittaker, A., Ductile Design of Steel Structures,
McGraw-Hill. 10. Dooley, K. L, and Bracci, J. M. (2001), “Seismic Evaluation of Column-to-Beam
Strength Ratios in Reinforced Concrete Frames,” ACI Structural Journal (American Concrete Institute), v 98 n 6.
102
11. Ehsani, M. R., and Wight, J. K. (1985), “Effect of Transverse Beams and Slab on
Behavior of Reinforced Concrete Beam-to-Column Connections,” ACI Structural Journal (American Concrete Institute), v 82 n 2 Mar-Apr, 188-195
12. FEMA (2000), “Prestandard and Commentary for the Seismic Rehabilitation of
Buildings (FEMA 356),” Federal Emergency Management Agency, Washington, D. C.
13. French, C.W., and Moehle, J. P. (1991), “Effect of floor slab on behavior of
slab-beam-column connections,” Special Publication (SP-123), American Concrete Institute.
14. Goel, Subhash C.; Itani, A. (1994), “Seismic behaviour of open-web truss-moment
frames,” Journal of Structural Engineering, ASCE, 120 (6), 1763-1780. 15. Goel, S. C., and Itani, A. (1994), “Seismic Resistant Special Truss Moment Frames,”
Journal of Structural Engineering, ASCE, 120 (6), 1781-1797. 16. Goel, S. C., and Leelataviwat, S. (1998), “Seismic Design by Plastic Method,”
Engineering Structures, Elsevier Science, 20 (4-6), 465-471. 17. International Conference of Building Officials (1997), “Uniform Building Code,”
Volume 2, Whittier, Calif. 18. Itani, A. M., and Goel, S. C. (1991), “Earthquake Resistance of Open Web Framing
Systems,” Report UMCEE 91-21, Dept. of Civ. & Env. Engrg., Univ. of Michigan, Ann Arbor, Michigan.
19. Jain, A. K., Goel, S. C., and Hanson, R .D. (1978), “Hysteresis Model for Steel
Members Subjected to Cyclic Buckling and Cyclic End-Moments and Buckling—User’s Guide for EL9 and EL10 of Drain 2D,” Report UMCEE 78-6, Dept. of Civ. & Env. Engrg., Univ. of Michigan, Ann Arbor, Michigan.
20. Kramer, S. L. (1996), “Geotechnical earthquake engineering,” Prentice Hall, N. J.,
653 pages.
103
21. Lee, H.S. (1996), “Revised Rule for Concept of Strong-Column Weak-Girder
Design,” Journal of Structural Engineering, ASCE, 122 (4), 359-364. 22. Lee, S. Y., and Lee, D.G. (1994), “Effects of gravity load on seismic response of
multistory buildings,” Engineering Structures, v 16 n 6 Aug, 445-454 23. Leelataviwat, S., Goel, S. C., and Stojadinović, B. (1997), “Steel Moment Frames
with Ductile Girder Web Opening,” Engineering Journal, AISC, 34 (4), 115-125. 24. Leelataviwat, S. (1998), “Drift and yield mechanism based seismic design and
upgrading of steel moment frames,” Ph.D. Thesis, University of Michigan, Ann Arbor.
25. Leelataviwat, S., Goel, S. C., and Stojadinović, B. (1998), “Seismic design by plastic
method,” Engineering Structures, v 20 n 4-6 Apr-Jun, 465-471 26. Liao, W. –I., Loh, C. H., and Wan, S. (2001), “Earthquake responses of RC moment
frames subjected to near-fault ground motions,” The Structural Design of Tall Buildings, v10 n3, 219-229.