250
Department of CSE, MIT, Manipal

Department of CSE, MIT, Manipal

Department of CSE, MIT, Manipal

Department of CSE, MIT, Manipal
Imagine that you are
1. Sales manager for a large retail organization.
2. Productivity manager
3. Petroleum minister
4. Supply chain manager
5. Customer retention manager
6. Customer care manager
7. Education minister
8. Chief of hospital and have
9. HR manager BI tool with you.
10. Restaurant owner What you will
11. LIC branch head do to improve
12. Printing press owner existing s/m.
13. TV channel owner
14. Film maker
15. Owner of Airline

Department of CSE, MIT, Manipal
Department of CSE, MIT, Manipal

Department of CSE, MIT, Manipal

Department of CSE, MIT, Manipal

Department of CSE, MIT, Manipal

Department of CSE, MIT, Manipal
BUSINESS INTELLIGENCE
AND ITS APPLICATIONS

Department of CSE, MIT, Manipal

Department of CSE, MIT, Manipal
Imagine
• Imagine that you are the sales manager
for a large retail organization and that you
were able, within some probability, to
predict how much money each of your
customers was going to spend and which
products each was going to purchase over
the next six months.

Department of CSE, MIT, Manipal
Imagine
• As the productivity manager, imagine that
you could figure out which production
teams within your organization build the
highest quality products.

Department of CSE, MIT, Manipal
Imagine
• imagine that, as the broker negotiating
electricity generation and delivery
contracts for a region of the Country, you
were able to predict with relative accuracy
what the demand for electricity would be
for the next 90 days.

Department of CSE, MIT, Manipal
Imagine
• imagine that you are in charge of
managing your company's supply chain
and that you could determine which of
your vendors provides the highest-quality
products the quickest.

Department of CSE, MIT, Manipal
Imagine
• let's say you are the customer retention
manager for a credit card company and
you can identify customers about to cut up
their credit card a month before they do
so.

Department of CSE, MIT, Manipal

Department of CSE, MIT, Manipal

Department of CSE, MIT, Manipal
Why Business Intelligence?
• Increased profitability
• Decreased costs
• Improved customer relationship
management
• Decreased risk

Department of CSE, MIT, Manipal
Few Questions
• How many customers do you have?
• For each product, how many were sold
over the last 12 months?
• Who are your 20 best customers?
• What is the value of any particular
customer?
• Who are your 20 best suppliers?

Department of CSE, MIT, Manipal
The Information Asset
• Although a significant amount of money has been
invested in attempts at building and launching B I
frameworks and applications, most of that money has
been spent in infrastructure, whereas very little has been
invested in managing and exploiting a valuable corporate
asset~a company's data. In fact, the concept of business
intelligence is so poorly defined that a manager's
expectations are set based on what that manager is told
by the last software tool vendor. Because of lack of focus
or the absence of clear success criteria, many data
warehousing implementations have been delayed or
scrapped altogether because the actual BI
implementations deliver far short of their expectations.

Department of CSE, MIT, Manipal
definition of BI
• a set of tools and methodologies designed
to exploit actionable knowledge
discovered from the company's
information asset.

Department of CSE, MIT, Manipal
Purpose
• Anybody involved in the BI process is
concerned about the ability to exploit
information in a way that can improve the
way a business (or any organization)
operates.

Department of CSE, MIT, Manipal
Drawbacks
• Unfortunately,
the disparate perceptions of what BI is and
how the knowledge derived through BI can
be used often leads to project failure.

Department of CSE, MIT, Manipal

Department of CSE, MIT, Manipal

Department of CSE, MIT, Manipal
Why BI fails
• The amorphous understanding of what BI
methods and products could do resulted in
an absence of a proper value proposition
on behalf of the business sponsor.
• The scope of the project was not fully
understood, causing delays in delivering to
the business sponsor.
• Insufficient technical training prevented
developers from getting software products
to do what the vendors said they do.

Department of CSE, MIT, Manipal
Why BI fails
• Poor understanding of technology
infrastructure led to poor planning and
scheduling.
• Business users were unable to trust
results due to poor data quality.
• The lack of a clear statement of success
criteria, along with a lack of ways to
measure program success, led to a
perception of failure.
Department of CSE, MIT, Manipal
BI DEFINITION(Complete)
• The processes, technologies, and tools
needed to turn data into information,
information into knowledge, and
knowledge into plans that drive profitable
business action. Business intelligence
encompasses data warehousing, business
analytic tools, and content/knowledge
management.
Department of CSE, MIT, Manipal
Conclusion from definition
• A BI practice is more than just a collection
of tools. This means that without the
processes and the right people, the tools
are of little value.
• The value of BI is realized in the context of
profitable business action. This means that
if knowledge that can be used for
profitable action is ignored, the practice is
of little value.

Department of CSE, MIT, Manipal

Department of CSE, MIT, Manipal

Department of CSE, MIT, Manipal
Data
• Data is a collection of raw value elements
or facts used for calculating, reasoning, or
measuring. Data may be collected, stored,
or processed but not put into a context
from which any meaning can be inferred.

Department of CSE, MIT, Manipal

Department of CSE, MIT, Manipal

Department of CSE, MIT, Manipal

Department of CSE, MIT, Manipal
Information
• Information is the result of collecting and
organizing data in way that establishes
relationships between data items, which
thereby provides context and meaning.

Department of CSE, MIT, Manipal
Knowledge
• Knowledge is the concept of
understanding information based on
recognized patterns in a way that provides
insight to information.

Department of CSE, MIT, Manipal
Turning Data into Information
• The process of turning data into
information can be summarized as the
process of determining what data is to be
collected and managed and in what
context. A good example is the process of
designing a database that models a real-
world set of entities, such as parties, which
is a frequently used term that refers to
people and organizations, along with the
roles taken on by those parties.

Department of CSE, MIT, Manipal
Turning Information into
Knowledge• We accumulate piles of information, which
are then analyzed in many different ways
until some critical bits of knowledge are
created. What makes that knowledge
critical is that it can be used to form a plan
of action for solving some business
problem.

Department of CSE, MIT, Manipal
Turning Knowledge into
Actionable Plans• If you are using BI for micromarketing,
finding the right customer for your product
is irrelevant if you do not have a plan to
contact that customer. If you are using BI
for fraud detection, finding the pattern of
fraud is of little value if your organization
does not do something to prevent that
fraudulent behavior.

Department of CSE, MIT, Manipal

Department of CSE, MIT, Manipal

Department of CSE, MIT, Manipal
Types of Digital Data
• Structured
• Semi structured
• Unstructured

Department of CSE, MIT, Manipal
Types of Digital Data
80
10
10
Data Division
Unstructured data
semi structured data
Structured data

Department of CSE, MIT, Manipal
Unstructured Data
• This the data which does not conform to a
data model.
• Eg:- memos, chat rooms, power point
presentations, images, videos, letters,
researches, white papers, body of an e-
mail, etc.

Department of CSE, MIT, Manipal
Semi-structured data
• This is the data which does not conform to
a data model but has some structure.
Eg:- XML, HTML etc.
Meta data for this data is available but is not
sufficient

Department of CSE, MIT, Manipal
Structured data
• This is the data which is in an organized
form.
• Eg:- Data stored in data bases.

Department of CSE, MIT, Manipal
Structured Data
Good Life Health Care Patient Index
Card
Patient ID <> Date <>
Nurse Name <>
Patient Name <> Patient Age <>
Body Temperature <> Blood Pressure <>

Department of CSE, MIT, Manipal
Data being exchanged in the
following form• Doctors or nurses notes in an electronic
report
• Email sharing information about
consultation or investigation
• Surveillance system report.
• Narrative portion of electronic medical
records.
• Investigative reports
• Chat rooms

Department of CSE, MIT, Manipal
Characteristics of Structured
data• Conforms to a data model
• Data is stored in the form of rows and
columns. Eg:-Relational database
• Data resides in a fixed fields within a
record or a file
• Definition, format, and meaning of data is
explicitly known
• Attributes in a group are the same
• Similar entities are grouped.

Department of CSE, MIT, Manipal
Sources of structured data
• Databases
• Spread sheets
• SQL
• OLTP systems

Department of CSE, MIT, Manipal
Ease with structured data
• Storage
• Scalability
• Security
• Update and delete

Department of CSE, MIT, Manipal
Ease of retrieval of structured
data• Retrieving information
• Indexing and searching
• Mining data
• BI Operations

Department of CSE, MIT, Manipal

Department of CSE, MIT, Manipal
characteristics of Unstructured
data• Does not conform to any data model.
• Cannot be stored in the form of rows and
columns as in a database.
• Not in any particular format or sequence.
• Not easily usable by a program.
• Does not follow any rule or semantics.
• Has no easily identifiable structure.

Department of CSE, MIT, Manipal
Sources of unstructured data
• Web pages
• Memos
• Videos
• Images
• Body of an email
• Word document
• Power point presentations
• Chats, reports, white papers and surveys

Department of CSE, MIT, Manipal

Department of CSE, MIT, Manipal

Department of CSE, MIT, Manipal
How to manage Unstructured
Data• Indexing
• Tag/Metadata
• Classification/Taxonomy
• Content Addressable Storage(CAS)

Department of CSE, MIT, Manipal
Challenges faced while storing
unstructured data• Storage Space
• Scalability
• Retrieve information
• Security
• Update and delete
• Indexing and searching

Department of CSE, MIT, Manipal
Solutions to storage challenges
of Unstructured Data• Changing format
• Developing new hardware
• Storing in RDBMS/BLOBS
• Storing in XML format
• Content Addressable Storage(CAS)

Department of CSE, MIT, Manipal
Changing Format
• Unstructured data may be converted into
formats which are easily managed, stored
and searched.
• IBM is working on a project which will
convert audio and video into text.

Department of CSE, MIT, Manipal
Developing new hardware
• New h/w needs to be developed to support
unstructured data. It may either
complement the existing storage devices
or may be standalone for unstructured
data.

Department of CSE, MIT, Manipal
Storing in RDBMS/BLOBS
• Unstructured data may be stored in
relational databases which support
BLOBs. Metadata about an image or video
can be stored in a RDBMS.

Department of CSE, MIT, Manipal
Storing in XML format
• When unstructured data is stored in XML
format some structure is added to it using
tags and elements.
Department of CSE, MIT, Manipal
Content Addressable Storage
• It organizes files based on their metadata
and assigns unique name to every object
stored in it. The object is retrieved based
on its content and not its location. It is
used extensively to store e-mails etc.

Department of CSE, MIT, Manipal
Challenges faced while extracting
information from stored unstructured data
• Interpretation
• Classification/taxonomy
• Indexing
• Deriving meaning
• File formats
• tags

Department of CSE, MIT, Manipal
Interpretation
• Unstructured data is not easily interpreted
by conventional algorithms.

Department of CSE, MIT, Manipal
Classification/Taxonomy
• Different naming conventions followed
across the organization make it difficult to
classify data.

Department of CSE, MIT, Manipal
Indexing
• Designing algorithms to understand the
meaning of the documents and then
tagging or indexing them accordingly is
difficult.

Department of CSE, MIT, Manipal
Deriving meaning
• Computer programs cannot automatically
derive meaning/structure from
unstructured data.

Department of CSE, MIT, Manipal
File formats
• Increasing number of file formats makes it
difficult to interpret data.

Department of CSE, MIT, Manipal
Tags
• As the data grows, it is not possible to put
tags manually.

Department of CSE, MIT, Manipal
Possible solutions
TAGS• Unstructured data can be stored in a
virtual repository and be automatically
tagged. Documentum is one such
solution.

Department of CSE, MIT, Manipal
Possible solutions -Text Mining
• Text mining tools help in grouping as well
as classifying unstructured data and assist
in analyzing by considering grammar,
contexts, synonyms etc.

Department of CSE, MIT, Manipal
Possible solutions- Application
Platforms• Application platform like XOLAP help
extract information from email and XML
based documents.
Department of CSE, MIT, Manipal
Possible solutions-
Classification/Taxonomy• Taxonomies within the organization can be
managed automatically to organize data in
hierarchical structures.

Department of CSE, MIT, Manipal
Possible solutions- Naming
conventions/Standards• Following naming conventions or
standards across an organization can
greatly improve storage, retrieval, index
and search

Department of CSE, MIT, Manipal

Department of CSE, MIT, Manipal
UIMA (figure Previous slide)
• Unstructured Information Management
Architecture (UIMA) is an open source
platform from IBM which integrates
different types of analysis engines to
provide a complete solution for knowledge
discovery from unstructured data.
Department of CSE, MIT, Manipal
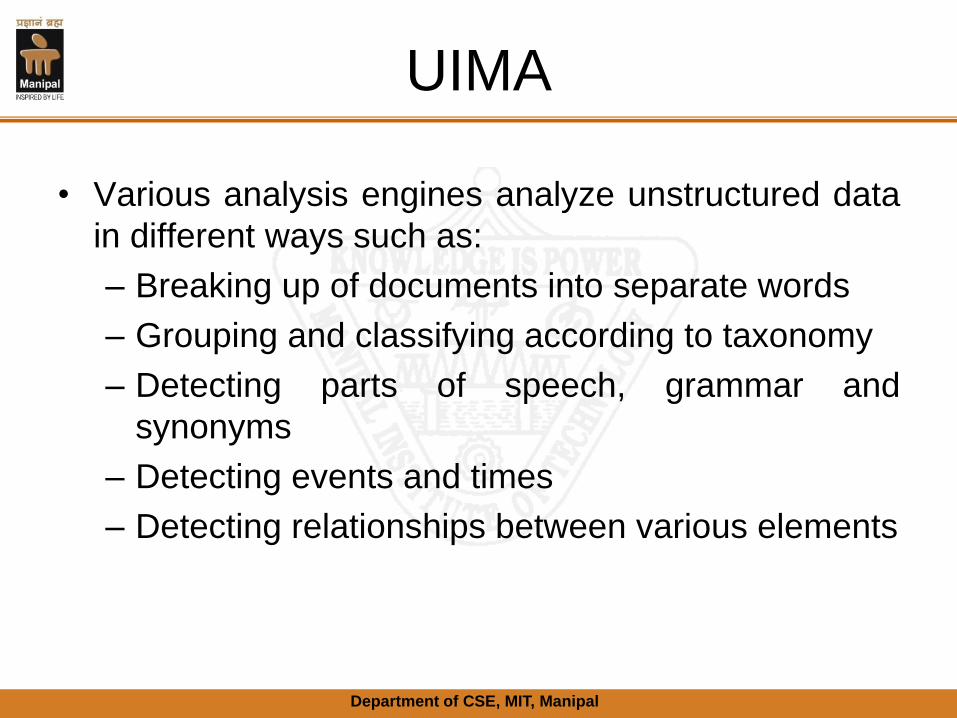
UIMA
• Various analysis engines analyze unstructured data
in different ways such as:
– Breaking up of documents into separate words
– Grouping and classifying according to taxonomy
– Detecting parts of speech, grammar and
synonyms
– Detecting events and times
– Detecting relationships between various elements

Department of CSE, MIT, Manipal
Characteristics of Semi
Structured data• Does not conform to a data model but
contains tags and elements(meta data).
• Cannot be stored in the form of rows and
columns.
• Data described by the tags and elements
is stored.
• Not sufficient metadata.
• Attributes in a group may not be the same.
• Similar entities are grouped.

Department of CSE, MIT, Manipal
Good Life Health Care Patient Report
Card
Patient ID <> Date <>
Nurse Name <> Doctor Name <>
Patient Name <> Patient Age <>
Body Temperature <> Blood Pressure <>
Diagnosis (notes)
Conclusion (notes)

Department of CSE, MIT, Manipal
Sources of semi-structured data
• XML
• TCP/IP packets
• Zipped files
• Binary Executable
• Mark-up languages
• Integration of data from heterogeneous
sources.

Department of CSE, MIT, Manipal
Integration of data sources

Department of CSE, MIT, Manipal
How to manage semi structured
data• Schemas
• Graph based data model
• XML

Department of CSE, MIT, Manipal
Schemas
• These can be used to describe the
structure of data. schemas define the
constraints on the structure, content of the
document etc.
• Drawbacks being as requirement change
data changes changing the schema.

Department of CSE, MIT, Manipal
Graph based data models
• These can be used to describe data. The
relationships and hierarchies are
represented in the form of a tree like
structure where the vertices contain the
object or entity and the leaves contain
data.

Department of CSE, MIT, Manipal
XML
• It allows the user to define the tags to
store data in hierarchical or nested forms.
Schemas in XML are not tightly coupled to
underlying data.

Department of CSE, MIT, Manipal
Challenges faced in storing
semi structured data• Storage cost
• RDBMS
• Irregular and partial structure
• Implicit structure
• Evolving schemas
• Distinction between schema and data.

Department of CSE, MIT, Manipal
Possible solution for storing
semi structured data• XML
• RDBMS
• Special purpose DBMS
• OEM

Department of CSE, MIT, Manipal

Department of CSE, MIT, Manipal
OEM
• IN Object Exchange Model objects are the
entities, labels are the attributes and leaf
contains the data.
• Indexing and searching a graph based
data model is easier and quicker as it is
easy to traverse to the data.

Department of CSE, MIT, Manipal
Challenges faced while extracting
information from semi structured data
• Flat files
• Heterogeneous sources
• Incomplete / irregular structure

Department of CSE, MIT, Manipal
Possible solutions for extracting information from
semi structured data
• Indexing
• OEM
• XML
• Mining tools

Department of CSE, MIT, Manipal
Possible solutions for extracting information from
semi structured data
• Indexing data in a graph based model
enables quick search.
• OEM stores data in graph based data
model which is easier to index and search
• XML allows data to be arranged in a
hierarchical or tree like structure which
enables indexing and searching
• Mining tools search data based on graphs
schemas structures etc.

Department of CSE, MIT, Manipal
Intranet
Applications
B2B
APPLICA
TIONS
BUSINESS LOGIC
RDBMSRDBMS

Department of CSE, MIT, Manipal
XML
• Standard for exchanging the data over the
web.
• It enables separation of content(XML) and
presentation(XSLT)
• Document Type Descriptors(DTD’s)
provide partial schemas for XML
document.

Department of CSE, MIT, Manipal
XML
• It is written in plain text.
• It is independent of hardware and
software.
• It is designed to store and transport the
data over the internet.
• Users can define tags to store data.
• XML has no predefined tags.
• Data can exist without schema and
schema can be added later.

Department of CSE, MIT, Manipal
Difference between semi
structured and structured dataName Email
Donald duck [email protected],
First name: Sachin
Last name: Tendulkar
Mickey Mouse [email protected]

Department of CSE, MIT, Manipal
Structured representation
First name Last name Email Id Alternate Email
Id
Donald Duck [email protected] donald@disneyla
nd.com
Sachin Tendulkar sachin@indiacrick
et.com
sachin@parliment
.in
Micky Mouse mickey@disneyla
nd.com

Department of CSE, MIT, Manipal
INTRODUCTION TO OLTP AND
OLAP

Department of CSE, MIT, Manipal
On-Line Transaction Processing
• Point Of Sale (POS)

Department of CSE, MIT, Manipal
Product master table
Column name Data type and
length
Constraint Description
PID Character,7 Primary key Not null and
unique
Product Name Character,35 Not null Name of the
product must be
specified
P description Character,50 Not null Description must
be there.
Unit Price Numeric 8,2 The price per unit
of the product
Qty in stock Numeric 5 The units of the
product in stock

Department of CSE, MIT, Manipal
Possible operations in OLTP
• Insert
• Update
• Delete

Department of CSE, MIT, Manipal
Possible queries which OLTP
can answer• Search for a particular customer record
• Retrieve the unit price of a particular
product.

Department of CSE, MIT, Manipal
Advantages of an OLTP system
• Simplicity
• Efficiency

Department of CSE, MIT, Manipal
Challenges of an OLTP system
• Security: An OLTP requires concurrency
control (locking) and recovery
mechanisms (logging)
• OLTP system data content not suitable for
decision making: Detailed Current data is
not suitable for decision making.

Department of CSE, MIT, Manipal
The queries that OLTP cannot
answer• Which product to introduce?
• Which customer segments for new
products?
• How much discount should they offer?
• Should different discounts be given to
different customer segments?
• How to zero in on its most consistent sales
person?

Department of CSE, MIT, Manipal
On-Line Analytical Processing
(OLAP)• In OLAP data is held in the multi
dimensional form rather than the relational
form.

Department of CSE, MIT, Manipal

Department of CSE, MIT, Manipal

Department of CSE, MIT, Manipal
TABLE
Section Product
Category
YearQuarter SalesAmount
Men Accessories Q1 3000.50
Men Accessories Q2 1000.50
Men Accessories Q3 3500.50
Men Accessories Q4 2556.50
Women Accessories Q1 1250.50
Women Accessories Q2 1000.50
Women Accessories Q3 1500.50
Women Accessories Q4 1556.50

Department of CSE, MIT, Manipal
TABLE
Section Product
Category
YearQuarter SalesAmount
Kid Accessories Q1 1234.50
Kid Accessories Q2 5678.50
Kid Accessories Q3 1233.50
Kid Accessories Q4 1567.50
Infant Accessories Q1 1555.50
Infant Accessories Q2 2000.50
Infant Accessories Q3 3425.50
Infant Accessories Q4 1775.50

Department of CSE, MIT, Manipal
TABLE
Section Product
Category
YearQuarter SalesAmount
Men Clothing Q1 2000.50
Men Clothing Q2 1230.50
Men Clothing Q3 1456.50
Men Clothing Q4 3567.50
Women Clothing Q1 4536.50
Women Clothing Q2 2345.50
Women Clothing Q3 3200.50
Women Clothing Q4 1550.50

Department of CSE, MIT, Manipal
Table
Section Product
Category
YearQuarter SalesAmount
Kid Clothing Q1 1000.50
Kid Clothing Q2 6789.50
Kid Clothing Q3 8889.50
Kid Clothing Q4 7676.50
Infant Clothing Q1 2345.50
Infant Clothing Q2 2000.50
Infant Clothing Q3 3456.50
Infant Clothing Q4 5564.50
Department of CSE, MIT, Manipal
Answer these question
• What is sales amount for– Men
– Women
– Kid
– Infant
– Accessories
– Clothing
– Q1
– Q2
– Q3
– Q4

Department of CSE, MIT, Manipal
One dimensional data by
sectionSection Sales Amount
Men 18313.00
Women 16941.00
Kid 34070.00
Infant 22124.00

Department of CSE, MIT, Manipal
One dimensional data
Product Category Sales Amount
Accessories 33837.00
Clothing 57611.00
Year Quarter Sales Amount
Q1 16924.00
Q2 22046.00
Q3 26663.00
Q4 25815.00

Department of CSE, MIT, Manipal
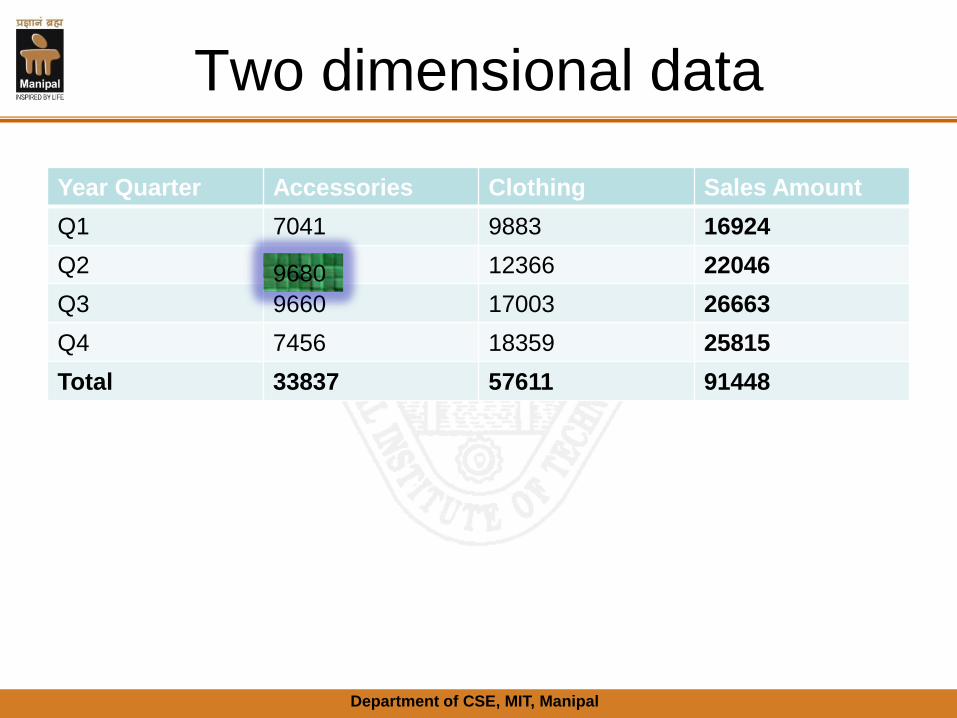
Two dimensional data
Year Quarter Accessories Clothing Sales Amount
Q1 7041 9883 16924
Q2 9680 12366 22046
Q3 9660 17003 26663
Q4 7456 18359 25815
Total 33837 57611 91448
Department of CSE, MIT, Manipal
Two dimensional data
Year Quarter Accessories Clothing Sales Amount
Q1 7041 9883 16924
Q2 9680 12366 22046
Q3 9660 17003 26663
Q4 7456 18359 25815
Total 33837 57611 91448
9680

Department of CSE, MIT, Manipal
Two dimensional data
Year Quarter Accessories Clothing Sales Amount
Q1 7041 9883 16924
Q2 9680 12366 22046
Q3 9660 17003 26663
Q4 7456 18359 25815
Total 33837 57611 91448
12336

Department of CSE, MIT, Manipal
Two dimensional data
Year Quarter Accessories Clothing Sales Amount
Q1 7041 9883 16924
Q2 9680 12366 22046
Q3 9660 17003 26663
Q4 7456 18359 25815
Total 33837 57611 91448
22046

Department of CSE, MIT, Manipal
Three Dimensional data
Product
Category
Year
Quarter
Men Women Kid Infant Total
Accessori
es
Q1 3000.5 1250.5 1234.5 1555.5 7041
Q2 1000.5 1000.5 5678.5 2000.5 9680
Q3 3500.5 1500.5 1233.5 3425.5 9660
Q4 2556.5 1556.5 1567.5 1775.5 7456
Clothing Q1 2000.5 4536.5 1000.5 2345.5 9883
Q2 1230.5 2345.5 6789.5 2000.5 12366
Q3 1456.5 3200.5 8889.5 3456.5 17003
Q4 3567.5 1550.5 7676.5 5564.5 18359
Total 18313 16941 34070 22124 91448

Department of CSE, MIT, Manipal
Answer the question
• Which section has purchased the highest
Accessories in the second quarter. What is
the amount?

Department of CSE, MIT, Manipal
Three Dimensional data
Product
Category
Year
Quarter
Men Women Kid Infant Total
Accessori
es
Q1 3000.5 1250.5 1234.5 1555.5 7041
Q2 1000.5 1000.5 5678.5 2000.5 9680
Q3 3500.5 1500.5 1233.5 3425.5 9660
Q4 2556.5 1556.5 1567.5 1775.5 7456
Clothing Q1 2000.5 4536.5 1000.5 2345.5 9883
Q2 1230.5 2345.5 6789.5 2000.5 12366
Q3 1456.5 3200.5 8889.5 3456.5 17003
Q4 3567.5 1550.5 7676.5 5564.5 18359
Total 18313 16941 34070 22124 91448
5678.5

Department of CSE, MIT, Manipal
Typical Application of OLAP
• Budgeting
• Sales forecasting
• Sales reporting
• Business process management etc.

Department of CSE, MIT, Manipal
Queries that an OLAP s/m can
process• What will be the future sales trend for
accessories in the kids section
• Given the customers buying pattern, will it
be profitable to launch product “XYZ” in
the kid’s section
• What impact will a 5% increase in the
price of products have on the customers?

Department of CSE, MIT, Manipal
Advantages of an OLAP system
• Multidimensional data representation
• Consistency of information
• Provides single platform for all information
and business needs – planning,
budgeting, forecasting, reporting and
analysis.
• Fast and interactive ad hoc exploration.

Department of CSE, MIT, Manipal

Department of CSE, MIT, Manipal
Different OLAP Architecture
• Multidimensional OLAP
• Relational OLAP
• Hybrid OLAP

Department of CSE, MIT, Manipal
Multidimensional OLAP
• In MOLAP, data is stored in
multidimensional cube.
• The storage is in proprietary format and
not in the relational database.

Department of CSE, MIT, Manipal
Advantages of MOLAP
• Fast data retrieval
• Optimal for slicing and dicing
• Can perform complex calculations. All
calculations are pre-generated when the
cube is created.

Department of CSE, MIT, Manipal
Disadvantages of MOLAP
• Limited in the amount of data that it can
handle. The reason being as all
calculations are pre–generated when the
cube is created , it is not possible to
include a large amount of data in the cube
itself. The cube however can be derived
from the large amount of data.
Department of CSE, MIT, Manipal
Disadvantages of MOLAP
• Additional investment in human and
capital resources may be required as the
cube proprietary and might not exist in the
enterprise.

Department of CSE, MIT, Manipal
ROLAP
• In ROLAP data is stored in relational
database. In essence, each action of
slicing and dicing is equivalent to adding
“where” clause in the SQL statement.

Department of CSE, MIT, Manipal
ROLAP Advantages
• Can handle large amount of data.(limited
only by the data size of the underlying
database).
• Can leverage functionalities inherent in the
relational database.

Department of CSE, MIT, Manipal
Disadvantages
• Difficult to perform complex calculations
using SQL.
• Performance can be slow. As each
ROLAP report is essentially an SQL query
in the relational database.

Department of CSE, MIT, Manipal
HOLAP
• It combines the advantages of MOLAP
and ROLAP. Additional operation called
drill through is supported.

Department of CSE, MIT, Manipal
OLTP vs. OLAP

Department of CSE, MIT, Manipal
Feature OLTP OLAP
Focus Data in Data out
Source of data Operational/transactional
data
Data extracted from
various operational data
sources , transformed
and loaded into the data
warehouse
Purpose of data Manages(controls and
executes) basic business
tasks
Assists in planning,
budgeting, forecasting
and decision making
Data contents Current data. Far too
detailed- not suitable for
decision making
Historical data. Has
support for
summarization and
aggregation. Stores and
manages data at various
level of granularity, there
by suitable for decision
making
Inserts and Updates Very frequent updates
and inserts
Periodic updates to
refresh the data
warehouse

Department of CSE, MIT, Manipal
Feature OLTP OLAP
Queries Simple queries, often
returning fewer records
Often complex queries
involving aggregations
Processing speed Usually returns fast Queries usually take a
long time(several hours)
to execute and return
Space requirements Relatively small,
particularly when
historical data is either
purged or archived
Comparatively huge
because existence of
aggregation structures
and historical data.
Data base design Typically normalized
tables. OLTP s/m adopts
ER model
Typically de-normalized
tables; uses star or snow
flake schema
Access Field level access Typically aggregated
access to data of
business interest
Operations Read/write Mostly read

Department of CSE, MIT, Manipal
Feature OLTP OLAP
Back up and recovery Regular backup of
operational data are
mandatory. Requires
concurrency
control(locking) and
recovery mechanisms.
Instead of regular
backups, data
warehouse is refreshed
periodically using data
from operational data
sources.
Indexes Few Many
Joins Many Few
Derived data and
aggregate
Rare Common
Data structures Complex Multi dimensional

Department of CSE, MIT, Manipal
OLTP and OLAP
• OLTP helps in the execution of day-to-day
operations of an organization.
• OLAP helps in decision making

Department of CSE, MIT, Manipal
Data Models for OLTP and
OLAP• An OLTP s/m usually adopts an ER model
whereas an OLAP system adopts either a
star or snowflake model.

Department of CSE, MIT, Manipal
Data Model for OLTP
• Refer to pdf

Department of CSE, MIT, Manipal
ER DIAGRAM
• The company you work for wants to
digitize their time cards. You have been
asked to design the database for
submitting and approving time cards. Draw
the database ER diagram with the
following information:

Department of CSE, MIT, Manipal
ER DIAGRAM
• A timecard should have hours worked and
date submitted
• Each timecard is associated with exactly
one employee
• Each timecard should have a unique id
• Each timecard has a status: it is either
approved, not approved, or pending
• Each employee has a unique id

Department of CSE, MIT, Manipal
ER DIAGRAM
• Each employee has a name and address.
• Each employee submits a time card every
pay period. i.e. In 1 year, they will submit
multiple time cards
• Each employee either has direct deposit or
physical check as their method of payment
• Each employee is associated with exactly
one manager

Department of CSE, MIT, Manipal
ER DIAGRAM
• Each manager has a unique id and a
name
• Each manager is in charge of multiple
employees
• Each manager approves time cards for
multiple employees

Department of CSE, MIT, Manipal

Department of CSE, MIT, Manipal
Data Model for OLAP
• A multidimensional model can exist in the
form of star schema, snow flake schema
or galaxy schema.
Department of CSE, MIT, Manipal
Dimensions and facts
• Dimension is a perspective or entity with
respect to which an organization wants to
keep records.
• Facts are numerical measures/quantities
by which we want to analyze relationships
between dimensions.
• Example:-total sales amount, quantity,
discount.

Department of CSE, MIT, Manipal

Department of CSE, MIT, Manipal

Department of CSE, MIT, Manipal

Department of CSE, MIT, Manipal

Department of CSE, MIT, Manipal

Department of CSE, MIT, Manipal

Department of CSE, MIT, Manipal

Department of CSE, MIT, Manipal

Department of CSE, MIT, Manipal

Department of CSE, MIT, Manipal
Pivot

Department of CSE, MIT, Manipal
Drill Across

Department of CSE, MIT, Manipal
Drill through

Department of CSE, MIT, Manipal
ERP

Department of CSE, MIT, Manipal

Department of CSE, MIT, Manipal
ERP Benefits
• Consistency and reliability of data across
various units of the organization
• Stream lining the transactional process
• A few basic reports to serve the
operational needs.

Department of CSE, MIT, Manipal

Department of CSE, MIT, Manipal
BI Applications
• Customer Analytics
• Human Capital Productivity Analytics
• Business Productivity Analytics
• Sales Channel Analytics
• Supply Chain Analytics
• Behavior Analysis

Department of CSE, MIT, Manipal

Department of CSE, MIT, Manipal

Department of CSE, MIT, Manipal

Department of CSE, MIT, Manipal

Department of CSE, MIT, Manipal

Department of CSE, MIT, Manipal

Department of CSE, MIT, Manipal
Customer Analytics
• A common, overused term is customer relationship
management (CRM), which has become a buzzword
implying an all-encompassing magic bullet to turn all
contacts into customers and all customers into great
customers. The magic of CRM is actually based on a
number of customer analytic functions that together help
people in a company better understand who their
customers are and how to maximize the value of each
customer. The results of these analytics can be used to
enhance the customer's experience as well.
Department of CSE, MIT, Manipal
Aspects of Customer Analytics
• Customer profiling
• Targeted marketing
• Personalization
• Collaborative filtering
• Customer satisfaction
• Customer lifetime value
• Customer loyalty
– These aspects benefit the sales, marketing,
and service organizations as they interact with
the customers.
Department of CSE, MIT, Manipal
Customer profiling
• The bulk of marketing traditionally casts a wide
net and hopes to capture as many individuals as
possible. Companies are realizing that all
customers are not clones of some predefined
market segment but are thinking individuals. To
this end, customer analytics encompass the
continuous refinement of individual customer
profiles that incorporate demographic,
psychographic, and behavioral data about each
individual.

Department of CSE, MIT, Manipal
Targeted marketing
• Knowledge of a set of customer likes and
dislikes can augment a marketing
campaign to target small clusters of
customers that share profiles. In fact,
laser-style marketing is focused directly at
individuals as a by-product of customer
analytics.

Department of CSE, MIT, Manipal
Personalization
• As more business moves online, the browser acts
as a proxy for the company's first interface with the
customer.
• Personalization, which is the process of crafting a
presentation to the customer based on that
customer's profile, is the modern-day counterpart to
the old-fashioned salesperson who remembers
everything about his or her individual "accounts."
Web site personalization exploits customer profiles
to dynamically collect content designed for an
individual, and it is meant to enhance that
customer's experience.

Department of CSE, MIT, Manipal
Collaborative filtering
• We have all seen e-commerce Web sites that suggest
alternate or additional purchases based on other
people's preferences. In other words, the information on
a Web page may suggest that "people who have
purchased product X also have purchased product Y.“
These kinds of suggestions are the result of a process
called collaborative filtering, which evaluates the
similarity between the preferences of groups of
customers. This kind of recommendation generation
creates relatively reliable cross-sell and up-sell
opportunities.

Department of CSE, MIT, Manipal
Customer satisfaction
• Another benefit of the customer profile is
the ability to provide customer information
to the customer satisfaction
representatives. This can improve these
representatives' ability to deal with the
customer and expedite problem resolution.

Department of CSE, MIT, Manipal
Customer lifetime value
• How does a company determine who their
best customers are? The lifetime value of
a customer is a measure of a customer's
profitability over the lifetime of the
relationship, which incorporates the costs
associated with managing that relationship
and the revenues expected from that
customer. Customer analytics incorporates
metrics for measuring customer lifetime
value.

Department of CSE, MIT, Manipal
Customer loyalty
• It is said that a company's best new
customers are its current customers. This
means that a company's best opportunities
for new sales are with those customers
that are already happy with that company's
products or services. Customer analytics
help.

Department of CSE, MIT, Manipal
Human Capital Productivity
Analytics• Call center utilization and optimization.
• Production effectiveness.
Department of CSE, MIT, Manipal
Call center utilization and
optimization• When a company's management realizes
that inbound calls are likely to be from
unsatisfied customers, making them stew
on the phone is not going to improve
customer satisfaction. In the more
advanced cases, quick access to
customer profile information may also
affect the level of support provided to each
customer

Department of CSE, MIT, Manipal
Production effectiveness
• This includes evaluating on-time
performance, labor costs, production yield,
etc., all as factors of how staff members
work. This information can also be
integrated into an information repository
and analyzed for value.

Department of CSE, MIT, Manipal
Business Productivity Analytics
• Defect analysis
• Capacity planning and optimization
• Financial reporting
• Risk management
• Just-in-time
• Asset management and resource planning

Department of CSE, MIT, Manipal
Sales Channel Analytics
• Marketing
• Sales performance and pipeline

Department of CSE, MIT, Manipal
Marketing
• Both the ability to fine-tune a marketing program and the
ability to determine marketing effectiveness can be
derived through sales channel analytics. A typical
iterative process would be to identify a marketing
strategy based on an analysis of a clustering of
customers by profile and then to implement that strategy.
The effectiveness of the strategy will ripple through the
sales channel data, which can then be used to compare
the actual results with expectations. The degree to which
those expectations are met (or exceeded) can be fed
back into the analytical processing to help determine
new strategies.

Department of CSE, MIT, Manipal
Sales performance and pipeline
• Data associated with the sales staff can be
analyzed to identify variables that affect
the efficiency of the sales cycle, such as
individual sales staff member, region,
industry, contact people, contact times,
and contact frequency.

Department of CSE, MIT, Manipal
Supply Chain Analytics
• Supplier and vendor management
• Shipping
• Inventory control
• Distribution analysis
Department of CSE, MIT, Manipal
Supplier and vendor
management• Many organizations are unable to identify
who their vendors are or how many vendors
are supplying products or services. Supply
chain analytics allow a company's
management to track performance and
reliability by supplier, evaluating and rating
the quality of the products supplied, as well
as help to optimize supplier relationships with
respect to spending, procurement, and risk.
Department of CSE, MIT, Manipal
Shipping
• There are different methods by which a company delivers
its products to its customers, each with its own cost
schedule. For example, it may be more expensive to ship
products by air than by truck, but the products will arrive at
the destination faster if shipped by air. A company can
minimize its delivery costs by being able to select the most
efficient delivery method for any specific business
arrangement, but knowing whether the products can be
available within the right time schedule is a difficult
problem, especially if your production depends on external
suppliers. Therefore, merging supplier and inventory
information with productivity data lets management
accurately determine the best way to move product.

Department of CSE, MIT, Manipal
Inventory control
• Maintaining an inventory of commodity products that
exhibit volatile pricing and limited useful life creates a
market risk if those products cannot be used before their
obsolescence. Alternatively, we would not want to keep
the shelves empty, because parts are needed to build
the products that are in the order and fulfillment cycle.
Between the sales channel information, the productivity
data, and the supply chain data, it is possible to make
more precise predictions about inventory requirements. It
is also possible to determine the best way to quantify
and mitigate risk, especially through the development of
financial products (such as barrier options) to limit
financial losses.

Department of CSE, MIT, Manipal
Distribution analysis
• Imagine that your company has a large number of retail outlets, a
smaller number of regional warehouses, and a very small
number of factories. The optimal distribution model would
arrange for the delivery of the exact number of products from
each factory to its closest warehouses so that each warehouse
could deliver the exact number of products to each of the retail
stores. Unfortunately for both companies and customers, this
optimal distribution is pretty rare. If a company can predict
demand for specific products within certain areas, though, the
managers cannot only distribute the product to the right locations
in the right quantities, but also minimize shipping costs by
ramping up product creation at the factories most economically
geographically located at a rate that matches the consumer
demand.

Department of CSE, MIT, Manipal
Behavior Analysis
• Purchasing trends
• Web activity
• Fraud and abuse detection
• Customer attrition
• Social network analysis

Department of CSE, MIT, Manipal
Purchasing trends
• Behavior analytics can be used to identify
purchasing patterns that indicate a
growing trend that can be used to adjust a
company's reaction to customer trends.
• toy sales around winter holiday time.

Department of CSE, MIT, Manipal
Web activity
• In the world of e-commerce, the ability to
draw and maintain customers to a Web
site and then encourage them to commit to
purchasing products is not only critical to
success, but also much more difficult than
doing the same in a brick and mortar
environment.

Department of CSE, MIT, Manipal
Fraud and abuse detection
• Fraudulent (or abusive) behavior frequently
is manifested in patterns. For example,
there are many popular health insurance
fraud schemes involving making claims with
inflated charges or practitioners prescribing
expensive medications or procedures that
may not be necessary. Behavior analytics
can be used to seek out patterns of
suspicious behavior by provider,
geographical region, agent, etc.

Department of CSE, MIT, Manipal
Customer attrition
• Another serious problem for many
businesses is customer attrition, when a
company's customers decide they no
longer want to remain affiliated with that
company.
Department of CSE, MIT, Manipal
Social network analysis
• Sometimes it is important to identify relationships
between specific entities within a system and to analyze
their behavior as a group. For example, a component of
criminal intelligence is finding collections of individuals
whose individual behavior may be nondescript yet who
act suspiciously as a group. This kind of analytical
processing is valuable to law enforcement, regulatory
compliance (think of insider trading), marketing (consider
viral marketing, which is a strategy that encourages
individuals to pass your marketing message to all of their
contacts), as well as sales optimization (by finding a
contact path of people to find the right audience).

Department of CSE, MIT, Manipal

Department of CSE, MIT, Manipal
Information Sources before
dawn of BI• Marketing research
• Statistical data
• Management reporting
• Market survey

Department of CSE, MIT, Manipal
Marketing research
• It is about understanding the customers,
the competitors, the products, the
changing market dynamics etc.

Department of CSE, MIT, Manipal
Statistical data
• This is essentially about unraveling hidden
pattern, spotting trends, etc. through
proven mathematical techniques for
understanding raw data.

Department of CSE, MIT, Manipal
Management reporting
• IT team prepares the report.

Department of CSE, MIT, Manipal
Market Survey
• Enterprises also employ third-party
agencies to conduct consumer surveys
and competitive analysis. They also use
benchmark data to understand their
strength, weaknesses and specific market
opportunities they could exploit as well as
risks that might reduce their revenue or
market share.

Department of CSE, MIT, Manipal
Important features of Business
Intelligence• Fact based decision making
• Single version of truth
• 360 degree perspective on your business
• Virtual team members on the same page.

Department of CSE, MIT, Manipal

Department of CSE, MIT, Manipal

Department of CSE, MIT, Manipal

Department of CSE, MIT, Manipal
Evolution of BI and role of DSS, EIS, MIS, and
digital dashboards
• In olden days whenever a question is
asked management information team used
generate a new report. The new report
involves all phases of SDLC.

Department of CSE, MIT, Manipal
Drawback of management
information system• Long delay between the request for and
delivery of reports.
• Inaccurate figures as the data would have
been copied to a new schema while IT
applications could be updating there own
databases resulting in multiple versions of
truth.
• The report copy can answer only one
question

Department of CSE, MIT, Manipal
Drawback of management
information system• Executives requirements would have
changed by the time the report is taken to
them, resulting in dissatisfaction of the
service delivered.

Department of CSE, MIT, Manipal
BI solutions
• Ad hoc reporting( for individual decision
makers)
• Decision Support System(DSS) (run day
to day operations)
• Executive Information system(EIS)

Department of CSE, MIT, Manipal
Executive Information
system(EIS)• It supports decision making at senior
management level i.e. strategic decisions.
• It provides easy access to internal as well
as external data.
• EIS focuses on KPI.

Department of CSE, MIT, Manipal
ERP VS. BI
ERP BI
OLTP S/m OLAP
Data warehouse not present Data warehouse is part of BI
Static reports Dynamic reports

Department of CSE, MIT, Manipal
BI for past, present and future

Department of CSE, MIT, Manipal
BI Component Framework

Department of CSE, MIT, Manipal
BI component framework
• BI component framework is divided into
three major layers
– Business layer
– Administration and operation layer
– Implementation layer

Department of CSE, MIT, Manipal
Business layer
• This layer consists of four components
– Business requirements
– Business value
– Program management
– Development

Department of CSE, MIT, Manipal
Business requirements
• Business requirement consists of
– Business drivers
– Business goals
– Business strategies

Department of CSE, MIT, Manipal
Business drivers
• These are the impulses that initiate the
need to act. A few examples of business
drivers are changing workforce, changing
labour laws, changing economy, changing
technology etc.

Department of CSE, MIT, Manipal
Business goals
• These are the target to be achieved in
response to business drivers.
• Examples:- increased productivity,
improved market share, improved profit
margins, improved customer satisfaction,
cost reduction etc.

Department of CSE, MIT, Manipal
Business strategies
• These are the planned course of action
that will help achieve the set goals.
• Examples:-outsourcing, partnerships,
customer retention program, employee
retention program, competitive pricing etc.

Department of CSE, MIT, Manipal
Business Value
• When a strategy is implemented against
certain goals, then certain costs are
involved. The business value can be
measured in terms of
– Return On Investment(ROI)
– Return On Asset(ROA)
– Total Cost of Ownership(TCO)
– Total Value of Ownership(TVO)

Department of CSE, MIT, Manipal
Program Management
• Program management ensures smooth
functioning of the entire program. It
involves people, projects and priorities.

Department of CSE, MIT, Manipal
Development
• The process of development consists of
– Database/data warehouse development
– Data integration system development
– Business analytics development

Department of CSE, MIT, Manipal
Administration and operation
layer• This layer consists of four components
– BI architecture
– BI and DW operations
– Data resource administration
– Business applications

Department of CSE, MIT, Manipal
BI architecture components
• Data
– Should follow design standards
– Must have a logically apt data model
– Metadata should be of high standard

Department of CSE, MIT, Manipal
BI architecture components
• Integration
– Follow processing standards
– Data must be consistent
– Performed according to business semantic
and rules

Department of CSE, MIT, Manipal
BI architecture components
• Information
– Usable and findable as per requirements

Department of CSE, MIT, Manipal
BI architecture components
• Technology
– Must be accessible.
– It should have good UI.
– Should support analysis, decision making and
storage management.

Department of CSE, MIT, Manipal
BI architecture components
• Organization
– Consists of different roles and responsibilities
like management, development, support and
usage roles.

Department of CSE, MIT, Manipal
BI and DW operations
• Security
• Configuration management
• Database management

Department of CSE, MIT, Manipal
Data Resource Administration
• Data governance
• Metadata management

Department of CSE, MIT, Manipal
Data governance
• It is technique for controlling data quality. It
is used to assess, improve, manage and
maintain information.

Department of CSE, MIT, Manipal
Meta data management
• Meta data is data about data.
• It is further subdivided into
• Business Metadata
• Process metadata
• Technical metadata
• Application metadata

Department of CSE, MIT, Manipal
Technical Metadata
• Data locations
• Data formats
• Data sizes
• Data types
• Indexing
• Data Structures

Department of CSE, MIT, Manipal
Process Metadata
• Transformation rules
• Data cleansing rules
• ETL audit trail
• Data quality audit

Department of CSE, MIT, Manipal
Application Metadata
• Data access history

Department of CSE, MIT, Manipal
Business Metadata
• Structure and hierarchy of data
• Ownership of data
• Definition of business metrics

Department of CSE, MIT, Manipal
Business Applications
• Decision Support System(DSS)
• Executive Information System(EIS)
• OLAP
• Data mining

Department of CSE, MIT, Manipal
Implementation layer
• Data Warehousing
• Information services

Department of CSE, MIT, Manipal
Who is BI for?
• BI for management
• Operational BI
• BI for process improvement
• BI for performance improvement
• BI to improve customer experience

Department of CSE, MIT, Manipal
BI Users
• Casual Users
• Power Users

Department of CSE, MIT, Manipal
BI ROLES
Program Roles Project roles
BI program manager Business manager
BI data architect BI Business Specialist
BI ETL architect BI Project manager
BI technical architect Business requirement analyst
Meta Data Manager Decision support Analyst
BI administrator BI designer
ETL specialist
Data administrator

Department of CSE, MIT, Manipal
References
• David Loshin, “Business Intelligence”, Morgan Kaufmann
Publishers, 2003
• Mike Biere, “Business Intelligence for the Enterprise”,
2nd edition, IBM Press,2003.
• R N Prasad, Seema Acharya, “Fundamentals of
Business Analytics”, Wiley India, 2011


