Page 1
Department of Economics
Working Paper Series Religion, Social Capital, and Business
Bankruptcy in the United States, 1921-1932
By:
Bradley A. Hansen & Mary Eschelbach Hansen
No. 2008-15
Fall 2008
http://www.american.edu/cas/econ/workpap.htm
Copyright © 2008 by Bradley A. Hansen and Mary Eschelbach Hansen. All rights reserved. Readers may make verbatim copies of this document for non-commercial purposes by any means, provided that this copyright notice appears on all such copies.
Page 2
2
Religion, Social Capital, and Business Bankruptcy in the
United States, 1921-1932
Bradley A. Hansen & Mary Eschelbach Hansen
Abstract
We consider the value of social capital that derives from membership in a church. American states with larger churchgoing populations had lower business bankruptcy rates from 1921 to 1932, and states in which the churchgoing population was concentrated in few churches had business bankruptcy rates that were lower still. Both voluntary and involuntary bankruptcy were lower in states with higher church membership. The evidence suggests that church membership acted on bankruptcy through a safety net mechanism and not solely through indicating a preference for honoring commitment. Key words: business bankruptcy, church membership, social capital JEL classification: N22, N82, K29
Page 3
Religion, Social Capital, and Business Bankruptcy in the United States, 1921-1932
Bradley A. Hansena
Mary Eschelbach Hansenb
Abstract: We consider the value of social capital that derives from membership in a church.
American states with larger churchgoing populations had lower business bankruptcy rates from
1921 to 1932, and states in which the churchgoing population was concentrated in few churches
had business bankruptcy rates that were lower still. Both voluntary and involuntary bankruptcy
were lower in states with higher church membership. The evidence suggests that church
membership acted on bankruptcy through a safety net mechanism and not solely through
indicating a preference for honoring commitment.
Keywords: business bankruptcy, church membership, social capital
aDepartment of Economics, University of Mary Washington, Fredericksburg, VA, USA.
Corresponding author: [email protected] .
bDepartment of Economics, American University, Washington, DC, USA.
1
Page 4
Introduction
A businessman fell into financial difficulty, not through dishonesty or mismanagement,
but because of the failure of a large manufacturer with whom he associated. When his insolvency
was imminent he went to his church to pray. On the way he confided in a fellow member of his
congregation. His story was passed on to another who ensured that the man did not fail. 1 Of
course, the story was intended to illustrate the efficacy of prayer, but a modern reader might
divine a different message: The businessman’s church membership provided social capital that
enabled him to avoid bankruptcy. Church members are connected to each other through their
common beliefs and activities, and church membership is associated with both increased group
coherence and increased group-to-group connections (Curry 2003). Connections to others
through the church may therefore provide a social safety net that reduces the incidence of
bankruptcy, which improves outcomes for the individual and reduces macroeconomic volatility
for all. We consider whether this social capital interpretation of church membership is consistent
with evidence on the incidence of bankruptcy among businessmen in the early twentieth century.
The term social capital is used in a number of disciplines, but there is no universally
accepted definition. Most often social capital refers to assets that yield benefits that arise from
membership in a group or connections to other people. Connections are a form of capital
because, like physical or human capital, connections can be used to produce something of value.
There are at least two distinct approaches to the identification and measurement of social capital
(Portes 2000). One approach emphasizes social capital as an asset for groups. The other approach
focuses on social capital’s benefits for individuals.
2
Page 5
Researchers who view social capital primarily as an asset of groups look for a positive
relationship between trust or civic-mindedness and economic performance (Fukuyama 1996;
Guiso, Sapienza and Zingales 2004; Knack and Keefer 1997; Knack and Zack 2001; Putnam
2000). Researchers who view social capital primarily as an asset of an individual look for the
benefit that an individual obtains through membership in a group or network. For example,
group membership increases opportunities for employment and promotion (Burt 1997;
Granovetter 1973; Laird 2006) and the earnings of small businesses (Gomez and Santor 2001).
Assessing the value of social capital has proven to be difficult regardless of the view.
Studies that focus on the benefits to groups use geographical cross-sections and proxy social
capital by using measures of trust, cooperation, or civic participation (Knack and Keefer 1997;
La Porta et al. 1997). However, the proxy measures are themselves only hypothesized to be
associated with a stock of social capital. For example, trust is not social capital itself but is one
of the presumed outcomes of investment in social capital. Studies that focus on the benefit to the
individual are more likely to employ a case study approach to show, for example, how
connections enable individuals to obtain employment and promotion (Granovetter 1973; Burt
1997). While case studies use direct observations of social capital stock, the weakness of the
approach is the difficulty of generalization.
Business historian Pamela Walker Laird (2006) bridges the two views through narrative
accounts of individuals and groups who benefited from their connections, whether deliberately
formed or not. Our study of church membership and bankruptcy in the United States also
bridges the two views of social capital and the two approaches to its quantitative measurement
by including a direct measure of connections in a regression analysis that compares economic
performance across space and time. We use panel regression to measure the influence of church
3
Page 6
membership on the bankruptcy rate among merchants and manufacturers across U.S. states from
1921 to 1932, controlling for differences in economic conditions and legal rules between the
states. Our measure of economic performance bridges the two approaches to social capital
analysis because bankruptcy reflects an outcome both for an individual and for the economy. In
general, the benefits of social capital do not accrue to everyone equally because insiders to a
group may exclude others. From the perspective of the individual, this is true for bankruptcy as
well. However, all members of a community benefit from lower instances of bankruptcy
because lower bankruptcy rates enhance the functioning of credit markets, increase
macroeconomic stability, and promote economic growth.
We find that states with higher rates of church membership and states with higher
concentrations of church membership by religious denomination had lower rates of business
bankruptcy. Connection to a church group conveys benefits; connection to a larger church group
conveys additional benefits. The result holds regardless of whether the churches were Catholic
or Protestant, suggesting that theological and organizational differences between the two were
not important in this regard. The result also holds when we separate voluntary bankruptcy (cases
initiated by the debtor) from involuntary bankruptcy (cases initiated by creditors), suggesting
that church membership does not affect bankruptcy only through a commitment or values effect,
but that church membership protects against financial failure through some other means. We
credit a social capital mechanism.
Religion, economic activity, and bankruptcy
The literature on the relationship between religion and economic behavior contains three
types of analyses: (1) those that examine the influence of specific beliefs on economic behavior,
4
Page 7
(2) those that examine the influence of the level of religiosity on behavior and outcomes, and (3)
those that credit social capital from church membership with improved outcomes for members.
The first of the three types is most familiar. In his 1905 classic The Protestant Ethic and
the Spirit of Capitalism Max Weber (1958) argued that the Protestant Reformation caused a
change in mentality that promoted the development of capitalism. Weber’s thesis has been much
criticized; for example, a prominent scholar of the economics of religion recently pointed out
that “the most noteworthy feature of the Protestant Ethic thesis is absence of empirical support”
(Iannacconne 1998, 1474). Nevertheless, the search for the influence of theology on economic
performance continues. For example, economic historian Marc Egnal (1998) argues that
Protestantism was more supportive of growth in North America because it was more consistent
with public support for education than was Catholicism. Economist Timur Kuran (1997) is
among many who argue that underdevelopment in Islamic societies is explained in part by
religious beliefs. Others look for a relationship between expressed religiosity and economic
behavior. Economist Jonathan Gruber (2005), for instance, finds that greater religious
participation is associated with higher incomes, higher education, less welfare receipt, and less
divorce.
Religious beliefs could influence bankruptcy through influencing choices regarding
borrowing, lending, or the enforcement of debt contracts, but our empirical results are more
consistent with the arguments of other applied microeconomists and others who suggest that
church membership represents high “connectibility” (Laird 2006) of members and that networks
built around churches have effective dynamics. These economists acknowledge that the decision
to join a church is unlikely to be motivated primarily by anticipation of economic gain, but that
membership provides benefits beyond the spiritual or psychic. They find that church going
5
Page 8
reduces the demand for government-provided social insurance (Scheve and Stasavage 2006) and
reduces the impact of decreases in income on happiness and consumption (Dehejia, Deleire, and
Luttmer 2007). Sociologists have examined the group dynamics of churches to confirm that,
while there are differences between congregations, church membership enhances both bonding
(within group) and bridging (between groups) social capital (Curry 2003).
Individual membership in a church could provide a safety net that enables business
people to get through times of economic distress without having to resort to the bankruptcy
court. Creditors may be reluctant to pursue debt collection aggressively against debtors who are
members of the same church. Further, larger church groups could confer greater benefits on
their members. A larger church could provide more business contacts and reduce transactions
costs among a wider membership. Note, however, that we do not have documentary evidence on
the specific mechanisms through which church membership reduces bankruptcy. Also note that
the impetus for our historical inquiry comes from modern studies of the social capital and church
membership, not historical studies. Yet if a relationship between church membership and
business bankruptcy exists, American business history should be a particularly fruitful place to
look for it. Moreover, thinking of this relationship in terms of social capital offers historians a
useful tool for that search. Relative to other developed countries, the United States exhibits high
levels of church membership and participation. As Robert Putnam observes, “Churches and
other religious organizations have a unique importance in American civil society” (Putnam 2000,
65).
Empirical analysis
6
Page 9
Today bankruptcy filings are overwhelmingly voluntary personal, not business,
bankruptcy cases. The situation was different in the 1920s and 1930s. In each year prior to 1934
business bankruptcy cases accounted for between 31 and 49 percent of all cases.2 The majority
of business bankrupts in the 1920s were merchants and manufacturers whose small businesses
were organized as proprietorships.
The federal law on bankruptcy that was in effect during the 1920s and 1930s was, with
some amendments, the Bankruptcy Act of 1898. As is the case with many federal statutes, states
determined some details, such as what assets were exempt from liquidation in bankruptcy. These
details varied considerably between states. Credit laws and economic conditions varied between
states as well. A large literature seeks to explain the modern and historical effects of laws and
economic conditions on personal bankruptcy rates across states, but there is no consensus view.3
Social factors, including social capital, have been relatively neglected in the bankruptcy
literature. An exception is work by sociologist Frank Buckley and lawyer Margaret Brinig
(1998), who argue that the recent boom in bankruptcy may be the result of a “decline in social
sanctions for promise-breaking and the loss of a sense of shame one feels when such values are
internalized” (p. 189). They hypothesize that traditional values regarding commitment lower the
bankruptcy rate by increasing the stigma of bankruptcy, and they find that an increase in the
percentage of a population that is Catholic lowers the personal bankruptcy rate. They play down
the role of the church in social capital formation. Ours is the first study to consider the
connection between church membership and business bankruptcy.
To estimate the influence of church membership on business bankruptcy rates we use a
panel of state-level data for the years 1921-1932. The number of bankruptcy cases filed, by
occupation, is reported in the Annual Reports of the Attorney General (U.S. Dept. of Justice,
7
Page 10
various years). Availability of data dictates the specific end points of our study. The 1933
amendments to the Bankruptcy Act changed the method of collecting and reporting data, with
the result that cases were not reported by occupation at the state level from 1933 to 1939.
Nonetheless, the period for which data are available is well-suited for the study because there
were few substantive changes in the federal law, because the period contains both booms and
busts, and because there was substantial variation in the business bankruptcy rates between
states.
An average of 227 merchants and 16 manufacturers appeared in bankruptcy court in the
average state-year (Table 1). Almost two-thirds of the merchants filed voluntary bankruptcy
petitions; as debtors they petitioned the court to begin bankruptcy proceedings and order the
cessation of collection efforts. Just over half of bankrupt manufacturers filed voluntary petitions.
We define the bankruptcy rate for merchants as the number of merchant bankrupts relative to the
number of business concerns (in thousands) reported in the annual Reference Book published by
Dun and Bradstreet and reproduced in the Statistical Abstracts of the United States (U.S. Bureau
of the Census, various years). We define the bankruptcy rate for manufacturers relative to the
number of manufacturing firms in thousands enumerated in the U.S. Census (University of
Virginia Geospatial and Statistical Data Center n.d.).
Figure 1 shows the national rates of business bankruptcy from 1921-1932. The
bankruptcy rate among merchants was about two per 1,000 business concerns in 1921 and rose to
6.4 in 1924; the bankruptcy rate among manufacturers also began at two per 1,000 firms and rose
to 5.3 in 1925. The rise in bankruptcy corresponded to an increase in new business formation
during the post-war recovery. The rates for both types of businesses fluctuated within a
relatively narrow band until the series was discontinued in 1932. Note that the business
8
Page 11
bankruptcy rate did not fluctuate much during the early years of the Great Depression, even
though the raw number of bankruptcies rose. In the average state-year the bankruptcy rate among
merchants was 5.4 (Table 1), among manufacturers it averaged 4.5.
Table 2 shows the bankruptcy rate in the states where the rates were highest and where
the rates were lowest on average across years. The rate among merchants was lowest in New
Hampshire (2.0) and highest in Georgia (15.8). The rate among manufacturers was lowest in
New Mexico (0.4) and highest in West Virginia (9.8). There is no geographic pattern in the
rates, suggesting that more than regional economic trends determine bankruptcy. There is plenty
of room for other factors, including church membership, to influence the state rates.
The original sources of our data on church membership are surveys of churches
conducted at ten year intervals (U.S. Dept. of Commerce and Labor 1930, 1940). We interpolate
the annual observations assuming a constant percentage rate of change. The highest rate of
church membership was in Utah (73 percent) and the lowest in Nevada (24 percent). To
anticipate the discussion of the statistical results: if we find that the coefficient on church
membership is negative, we will take this to mean that church going builds social capital that, in
turn, reduces bankruptcy in the state.
We compare results using the percent of the state population that is Roman Catholic to
results using the percent of the state population that belongs to any religious body. If Buckley
and Brinig (1998) are correct, Roman Catholic cultural values decrease bankruptcy. If, on the
other hand, any church membership provides a source of insurance, then greater membership of
the population of a state in any congregation reduces bankruptcy rates. Forty-three percent of the
population of the average state was churchgoing. The population of the average state included
about 15 percent Catholics (see Table 1). The variation, of course, is quite large. Only about
9
Page 12
one-half of one percent of the populations of Georgia and South Carolina were Catholic, while
Catholics comprised over 30 percent of the populations of Connecticut, Massachusetts, New
Hampshire, New Mexico, and Rhode Island.
We suspect that greater religious concentration may decrease bankruptcy by providing
the financially troubled churchgoer access to a relatively larger social network. In order to test
this, we use the surveys of churches to compute a Herfindahl index of religious concentration in
the churchgoing population.4 The index measures the size of the membership of individual
religious denominations relative to the size of the church-going population. Let the number of
people in all congregations of a single denomination be called nd. Then the share of that
denomination in the churchgoing population is Cnd . We compute the index for each state-year as
the sum of the squares of the share of each denomination’s membership in the churchgoing
population of the state: ∑ ⎟⎠⎞
⎜⎝⎛=
d
d
Cnh
2
. The index would equal one if all churchgoers in the state
belong to the same denomination of church. A low value of the index would indicate that the
population is equally spread across denominations. The average of all observations of the index
was 0.25; the index had a standard deviation of 0.213 (Table 1). The index fell from 0.26 to 0.24
during the early twenties and remained steady thereafter. The state with the greatest degree of
religious concentration, of course, was Utah. States in the South and Midwest had low degrees
of religious concentration. For example, the average index across years for Arkansas was 0.14
and for Indiana it was 0.12. To once again anticipate the discussion of the results: We expect the
coefficient on the index to be negative if membership in larger or more homogeneous groups
increases the social capital value of church membership.
10
Page 13
We also control for the size of the urban population in the states (U.S. Bureau of the
Census 1944). We expect degree of urbanization to be positively correlated with the bankruptcy
rate because credit may be more readily available in urban areas or because relatively
anonymous urban debtors may feel less stigmatized from filing for bankruptcy. In the average
state-year observed, almost 46 percent of the population was urban (Table 1). The other
economic indicators included in the regressions are the level and growth in per capita state
income (Flood 1998). We expect the level of per capita income in a state to be associated with a
greater supply of credit, greater indebtedness, and therefore a higher bankruptcy rate. Annual
income growth over the period averaged -6.8 percent (Table 1). We also include the ratio of bank
loans to aggregate state income (Flood 1998), a balance sheet indicator. More outstanding debt
increases the likelihood of bankruptcy, all other things equal. The ratio of loans to state income
was, on average, 0.4 (Table 1).
Finally, we consider differences in state bankruptcy and credit laws. We include the level
of homestead and personal exemptions (National Association of Credit Men, various years).
Homestead exemptions varied from zero to $8,000. Personal exemptions ranged from zero to
$2,000. The number of observations in the regressions is limited by the availability of the data
on state law. Some states are lost to the study mainly because the way personal exemptions are
described in state laws make them non-comparable. We find, however, no statistically
significant difference between states included in the regression and those excluded.
State usury laws may affect the supply of credit, indebtedness, default, and bankruptcy.
Most states defined separately the maximum interest rate that could be stated in a contract and
the rate that a creditor was allowed to charge when the rate was not explicitly stated in a contract.
We include both (Robinson and Nugent 1935; Ryan 1924). The maximum stated rate ranged
11
Page 14
from 6 to 30 percent, while the maximum rate if no rate was stated ranged from five to eight
percent. It is not clear to what extent the restrictions were actually binding (Ryan 1924), but to
the extent that usury limits were binding, they inhibited the ability of lenders to respond to
increased risk by increasing interest rates. Consequently, they were likely to reduce the supply of
formal credit available and reduce the bankruptcy rate.
A regression framework with a set of state dummy variables would allow us to estimate
the effect of church membership on the bankruptcy rate while reducing bias from excluding
unmeasured variables correlated with location in a state. However, because state bankruptcy
exemption and usury laws did not change much over time, the effects of the laws cannot be
estimated in a basic framework. A variable for any state law would be correlated with the state-
specific effect. We therefore use an augmented procedure recently developed in quantitative
political economy (Pluemper and Troeger 2007).5 The procedure allows us to control for state-
specific effects while still capturing the effect of state laws by estimating the regression in three
stages.
The first stage of the estimation procedure identifies the state-specific effect as the part of
the mean of the state bankruptcy rate that cannot be explained by time-varying variables (such as
state church membership and state income). The second stage estimates the effect of the
unchanging laws on the state-specific effects themselves. In other words, the second stage
answers the question: how much of the variation in the state averages is accounted for by state-
to-state differences in law? In the third stage the results from the second stage are used to re-
estimate the model using ordinary least squares regression. The procedure yields the desired
estimates of the effects of the effects of church membership and state law while reducing omitted
variable bias.6
12
Page 15
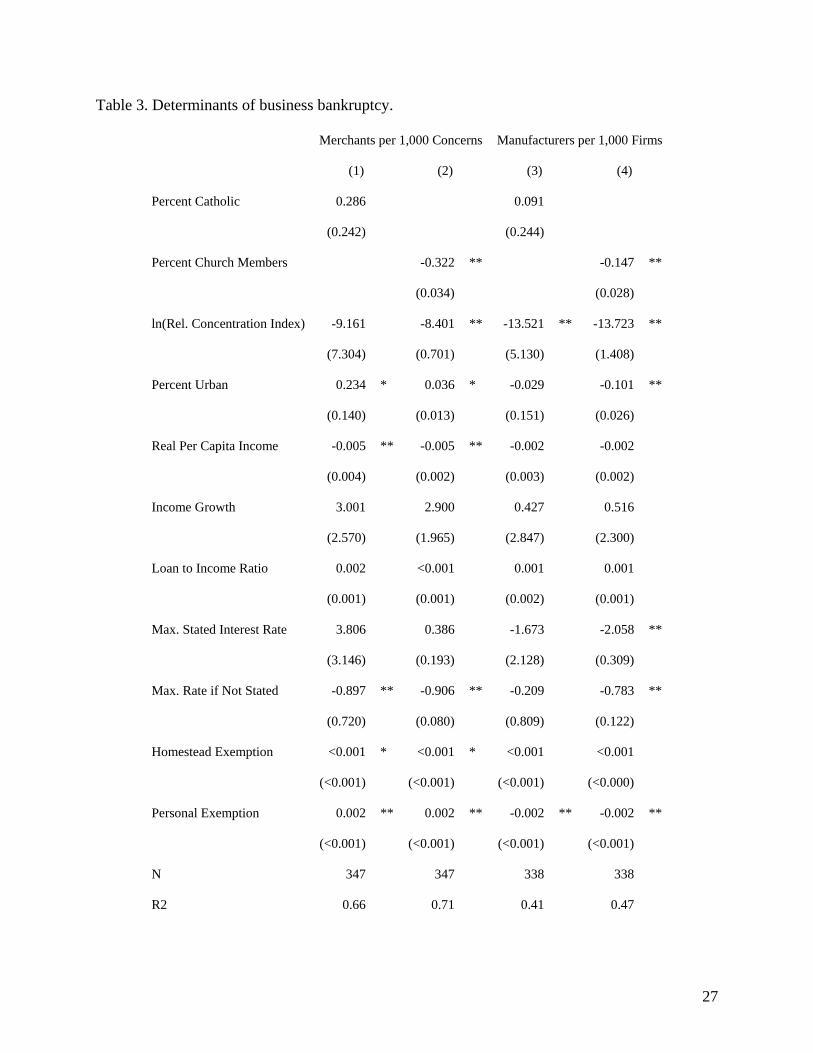
Table 3 shows the results of the augmented regression procedure. The dependent
variable in the first two columns of Table 3 is the merchant bankruptcy rate per 1,000 business
concerns in the state-year. The dependent variable in the second two columns is the bankruptcy
rate of manufacturers per 1,000 manufacturing firms in the state. The first specification for each
type of business includes the percent of the population that claimed membership in the Catholic
Church; the second specification includes instead the percent of the population that claimed
membership in any church. The results show that the size of the Catholic population in a state
did not have an effect on bankruptcy that is statistically different from zero, but the size of the
churchgoing population had a negative and statistically significant effect on the bankruptcy rate
for both merchants and manufacturers. In other words, an increase in church membership of ten
percentage points was associated with about three fewer merchant bankruptcies per 1,000
concerns. The effect of church membership on bankruptcy among manufacturers was only about
half as large, but it remained statistically different from zero.
Thus, the greater the proportion of the population that belonged to a religious group—
regardless of the specific beliefs of the group—the lower was the business bankruptcy rate. This
provides historical evidence in favor of the social safety net hypothesis discussed above. Church
going provided valuable social capital to the individual by providing a place to turn in bad times,
or by providing a network of connections that improved the chances of success, or both in
varying degrees. All participants in the economy gained from churchmembers’ mutual support
because lower bankruptcy rates improved credit market functioning. Further research is needed
to confirm the exact mechanism, but we suspect that a lower business bankruptcy rate in the state
increased the supply of credit to businesses in the state, and thereby increased business
investment and growth, making the state less vulnerable to economic downturn.7
13
Page 16
Moreover, when the churchgoing population of a state was more concentrated into a few
denominations, that concentration further reduced the bankruptcy rate. The coefficient on the
natural logarithm of the index of religious concentration is statistically significant and large in
each specification of Table 3. A one percent increase in the index is associated with 8.5 fewer
merchant bankruptcies per 1,000 concerns and about 13.5 fewer manufacturer bankruptcies per
1,000 firms. Of course, a one percent increase in the index would represent tens of thousands of
people switching from one church denomination to another. We do not observe a change this
large for any state over this time period, and as a result, the large variation between states drives
the results. Consider the differences between Arkansas, Texas, and Oklahoma which were in the
bottom quartile of the index of religious concentration (indicating that their churchgoing
populations belonged to the greatest diversity of churches), and Louisiana and Arizona, which
were in the highest quartile of the index. The merchant bankruptcy rate was 7.8 in Arkansas but
5.1 in Louisiana; it was 6.2 in Texas and 7.0 in Oklahoma but 4.7 in Arizona. This reinforces the
conclusion that churchgoing buildt social capital. In states where a larger proportion of the
population belonged to one denomination, church membership offered more connections and a
sturdier safety net.
The more urban states had higher bankruptcy rates among merchants but lower
bankruptcy rates among manufacturers. That the signs differ by type of business indicates that,
in the context of business bankruptcy, this variable contains no information about social capital.
This contrasts with Buckley and Brinig’s study of personal bankruptcy, in which residents of
more urban states had more anonymity, felt less stigma, and were therefore more likely to file for
bankruptcy. Our results indicate that for businesses, urban concentration reflects the differences
in the economic characteristics of urban and rural environments. For example, there may be a
14
Page 17
higher rate of merchant business formation in urban areas, leading to more bankruptcies among
merchants, as discussed above. Alternatively, urban merchants may have more access to credit
than rural merchants, so they may have higher debt loads, more default, and more bankruptcy.
Of the other economic variables included in the estimation, only real per capita income
had a measurable impact on bankruptcy. Higher state income was negatively associated with the
bankruptcy rate of merchants, but not manufacturers. The effect was small. An increase in
income of $200 could be expected to reduce the bankruptcy rate by one per 1,000 business
concerns.8 The coefficient on income growth was positive but not statistically different from
zero; the positive sign indicates that business bankruptcy may go up when the economy is
expanding and go down when the economy is contracting, but we cannot be confident in this
result. The ratio of bank loans to state income does not appear to have affected the bankruptcy
rate in the state.
Usury laws, especially laws governing the maximum interest rate that can be charged if
no rate is specified in the debt contract, had an effect on business bankruptcy. A higher
maximum interest rate was associated with a lower bankruptcy rate. That the effect was
statistically significant indicates that the laws were binding on the credit market: if the
equilibrium interest rate was below the maximum, then the maximum rate would not have any
measured effect. The negative sign of the coefficient indicates that higher interest rates reduced
the quantity of business credit demanded, decreasing indebtedness and bankruptcy.
Some state laws that limited the assets that could be liquidated in bankruptcy proceedings
also influenced the bankruptcy rate. Consider the homestead exemption, which is the part of the
value of the home of the debtor that could not be liquidated. In states with a more generous
homestead exemption there was a higher bankruptcy rate. This indicates that the increase in
15
Page 18
demand for credit due to the exclusion of assets from liquidation in bankruptcy was greater than
the accompanying decrease in supply of credit. A more generous personal exemption was
associated with a higher rate of bankruptcy among merchants, but a lower rate of bankruptcy
among manufacturers. Investigation of the difference is outside the scope of the current paper,
but would contribute to the wider literature on the determinants of bankruptcy rates.
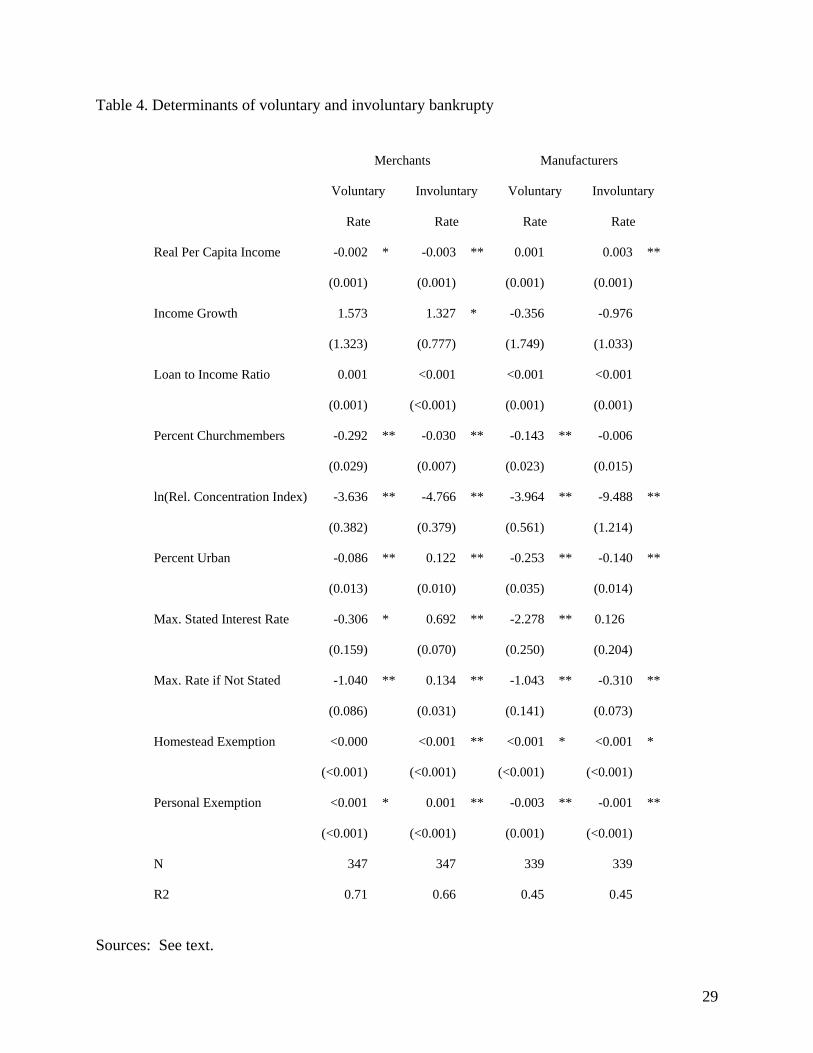
To further examine the likelihood that church membership has value as social capital, as
opposed to simply representing values that prize commitment, we estimate the regressions
separately for voluntary and involuntary bankrupts. Recall that involuntary petitions are brought
to bankruptcy court by creditors seeking liquidation of assets. In contrast, a debtor may
voluntarily petition the court to suspend collection efforts by creditors. In the context of business
bankruptcy, if church membership represents mainly values, then we expect greater church
membership to be associated with a lower voluntary bankruptcy rate but not necessarily with a
lower involuntary bankruptcy rate. The results after disaggregating the bankruptcy rate into the
voluntary rate and involuntary rate for each type of business are shown in Table 4. In each
specification, the extent of church membership was negatively associated with business
bankruptcy, and in four of the five specifications the coefficient is statistically significant. Note
that the coefficient on church membership is statistically significantly larger for the voluntary
rates than the involuntary rates. The results thus do not invalidate the idea that church members
prize commitment. But it is also possible that there are other systematic differences between
voluntary and involuntary petitioners, such as differences in balance sheets, that could have
affected the results at the state level. For example, involuntary bankrupts may have had more
out-of-state creditors and therefore may have derived less benefit from church-related social
16
Page 19
capital, which would be more likely to have been local. Only archival research could reveal such
differences.
That church membership provides access to a safety net is further confirmed by the effect
of greater religious concentration. Greater religious concentration was associated with fewer
bankruptcies in every case; the effect of the relative size of the denomination’s membership on
involuntary bankruptcy was larger than its effect on voluntary bankruptcy, though not
statistically significantly so. Further research is needed to confirm this preliminary result.
Conclusion
Church going is unlikely to be driven by its value as an investment in social capital.
However, in addition to the spiritual or psychic value of church membership, and regardless of
the specific teachings of the church, church going provides tangible benefits to church members
and their communities. In this paper we demonstrate that states with larger church-going
populations had lower business bankruptcy rates, even after controlling for economic conditions
and differences in state bankruptcy and credit laws.
The percent of a state’s population that belonged to any church was negatively correlated
with business bankruptcy at the state level. Further, church membership was negatively
correlated with both voluntary and involuntary bankruptcy among businesses. In states with
larger church-going populations, fewer creditors pursued liquidation of debtors’ assets through
the courts. It does not seem that specific church teachings regarding lending, borrowing, or
honoring commitment can explain how church membership reduced business bankruptcy.
Instead, church going seems to have connected members to a network of other people and
resources, giving members access to a safety net that reduced the likelihood that they needed to
17
Page 20
seek the protection of the bankruptcy court. The effectiveness of the church-related safety net
was enhanced in states where church membership was concentrated in a small number of
religious denominations. This implies that the within-group connections fostered by the church
were especially important, though church membership may also have provided a bridge to
assistance outside the debtor’s own denomination.
In addition to the substantive contribution of this studyto business history, we make a
methodological contribution to the literature on social capital. By studying bankruptcy rates, we
bridge approaches that emphasize social capital as a group asset, on the one hand, and as an
individual asset, on the other. . The first approach has been pursued mainly through statistical
analysis; the second approach mainly through case studies. We bridge the two approaches by
considering a direct measure of connections (church membership) as the independent variable in
a regression analysis that compares the bankruptcy rate across states and across time. The
bankruptcy rate is particularly useful for this methodological purpose; it is a statistic that
represents an aggregation of economic outcomes for individuals but also contains information
about the broader economic well-being of communities.
In closing, we emphasize again that our study of bankruptcy confirms that the social
capital accumulated through church membership has benefits that go beyond the individual
businessman, the congregation, or even the population of church-goers. Connectedness reduces
bankruptcy rates, which reduces the cost of credit, improves credit market functioning, increases
macroeconomic stability, and promotes economic growth. Connectedness benefits all.
References
18
Page 21
Bernanke, Ben. 1983. Nonmonetary effects of the financial crisis in propagation of the great
depression. American Economic Review 73: 257-76.
Buckley, Frank, and Margaret Brinig. 1998. The bankruptcy puzzle. Journal of Legal Studies
27: 187-208.
Burt, Ronald S. 1997. The contingent value of social capital. Administrative Science Quarterly
42(2): 339-365.
Christian Advocate and Journal. May 24, 1855.
Curry, Janel. 2003. “Social Capital and Societal Vision: A Study of Six Farm Communities in
Iowa. In Religion as Social Capital, Corwin Smidt (ed.) (Waco, TX: Baylor University
Press), 139-152.
Dehejia, Rajeev, Thomas Deleire, and Erzo F.P. Luttmer. 2007. Insuring consumption and
happiness through religious organizations. Journal of Public Economics 91: 259-279.
Egnal, Marc. 1996. Divergent paths: How culture and institutions have shaped North American
growth. New York: Oxford University Press.
Field, Alexander J. 2001. Bankruptcy, debt, and the macroeconomy: 1919-1946. Research in
Economic History 20: 99-133.
Flood, Mark D. 1998. United States historical data on bank market structure, 1896-1955
[Computer file]. ICPSR version. Montreal, Quebec: Mark D. Flood, Concordia
University [producer]. Ann Arbor, MI: Inter-university Consortium for Political and
Social Research [distributor].
Fukuyama, Francis. 1996. Trust: The social virtues and the creation of prosperity. New York:
Simon and Schuster.
19
Page 22
Gomez, Rafael, and Eric Santor. 2001. Membership has its privileges: The effect of social
capital and neighborhood characteristics on the earnings of microfinance borrowers. The
Canadian Journal of Economics 34: 943-966.
Granovetter, Mark. 1973. The strength of weak ties. American Journal of Sociology 78: 1360-
1380.
Gruber, Jonathan. 2005. Religious Market Structure, Religious Participation and Outcomes: Is
Religion Good for You? Advances in Economic Analysis and Policy 5: Article 5.
Available at http://www.bepress.com/bejeap/advances/vol5/iss1/art5.
Guiso, Luigi, Paolo Sapienza, and Luigi Zingales. 2004. The role of social capital in financial
development. The American Economic Review 94:526-556.
Hansen, Bradley Allen, and Mary Eschelbach Hansen. 2007. Path dependence in the
development of U.S. bankruptcy law, 1880-1938. Journal of Institutional Economics 3:
203-225.
Iannacconne, Larry. 1998. Introduction to the economics of religion. Journal of Economic
Literature 36: 1465-1496.
Knack, Stephen and Philip Keefer. 1997. Does social capital have an economic payoff? A
cross-country investigation. Quarterly Journal of Economics 112: 1251-1288.
Knack, Stephen, and Paul Zack. 2001. Trust and growth. Economic Journal 111: 295-
321.
Kuran, Timur. 1997. Islam and underdevelopment: An old puzzle revisited. Journal of
Institutional and Theoretical Economics 153: 41-71.
La Porta, Rafael,Florencio Lopez de Silanes, Andre Shleifer, and Robert Vishny. 1997. Trust in
large organizations. American Economic Review 87: 333-38.
20
Page 23
Laird. Pamela Walker. 2006. Pull: Networking and success since Benjamin Franklin.
Cambridge: Harvard University Press.
National Association of Credit Men (1930, 1935, 1938). Credit manual of commercial laws.
New York: National Association of Credit Men.
Pluemper, Thomas, and Vera E. Troeger, Vera E. 2007. Efficient estimation of time-invariant
and rarely changing variables in finite sample panel analyses with unit fixed effects.
Political Analysis. 15(1): 124-139.
Portes, Alejandro. 2000. The two meanings of social capital. Sociological Forum 15: 1-12.
Putnam, Robert D. 2000. Bowling alone: The collapse and revival of American community.
New York: Simon and Schuster.
Robinson, Louis N., and Rolf Nugent. 1935. Regulation of the small loan business. Russell
Sage: New York.
Ryan, Franklin W. 1924. Usury and usury Laws. Boston: Houghton Mifflin.
Scheve, Kennteth, and David Stasavage. 2006. The political economy of religion and social
insurance in the United States, 1910-1939. Studies in American Political Development
20: 132-159.
U.S. Bureau of the Census. Various years. Statistical abstract of the United States. GPO:
Washington, DC. http://www.census.gov/compendia/statab/past_years.html (accessed
June 23, 2006).
U.S. Department of Commerce and Labor, Bureau of the Census. 1930. Census of religious
bodies 1926, part I: Summary and detailed tables. GPO: Washington, D.C. ONLINE.
The Association of Religion Data Archives, http://www.thearda.com/, (accessed June 23,
2006).
21
Page 24
U.S. Department of Commerce and Labor, Bureau of the Census. 1940. Census of religious
bodies 1936, part I: Summary and detailed tables. GPO: Washington, D.C. ONLINE.
The Association of Religion Data Archives, http://www.thearda.com/, (accessed June 23,
2006).
U.S. Department of Justice. Various years. Annual report of the Attorney General of the United
States. Washington, DC: GPO.
University of Virginia Geospatial and Statistical Data Center. N.D. United States historical
census data browser. ONLINE. University of Virginia.
http://fisher.lib.virginia.edu/census/ (accessed August 2004).
Weber, Max 1958. The Protestant Ethic and the Spirit of Capitalism. New York: Charles
Scribner’s Sons.
22
Page 25
Table 1. Descriptive statistics (all states)
State-
Years
Observed
Mean Standard
Deviation
Business Bankruptcy
Merchants
Voluntary Petitions 608 158.1 193.9
Involuntary Petitions 608 68.7 121.3
Rate per 1,000 Concerns 585 5.39 3.53
Manufacturers
Voluntary Petitions 582 13.8 21.3
Involuntary Petitions 607 12.5 29.7
Rate per 1,000 Firms 554 4.50 3.52
Church Membership
Catholics (% of Pop.) 564 15.1 12.0
Church Members (% of Pop.) 576 43.3 10.7
Herfindahl Index of Religious Concentration 576 .25 .15
Economic Indicators
Urban (% of Pop.) 588 45.7 21.3
Per Capita Income (1920$s) 576 461.6 185.7
Annual Income Growth (%) 576 -6.8 14.8
Ratio of Bank Loans to State Income 576 .40 .14
State Laws
23
Page 26
Homestead Exemption ($) 588 2420 2251
Personal Exemption ($) 409 654 544
Max. Stated Interest Rate 540 9.4 3.8
Max. Rate if Not Stated 612 6.3 0.8
Sources: See text.
24
Page 27
Table 2. Highest and lowest business bankruptcy rates
Merchant Bankruptcies
per 1,000 Concerns
Manufacturing Bankruptcies
per 1,000 Firms
NH 2.0 NM 0.4
UT 2.8 WY 0.8
WA 2.8 MT 0.9
IN 2.8 AZ 1.2
ID 2.9 ND 1.4
RI 3.0 NV 1.5
CO 3.0 MD 1.6
KS 3.2 SD 1.8
OR 3.2 ME 2.0
Ten
Lowest
Rates
WY 3.2 CO 2.2
VA 7.3 MS 6.2
OK 7.5 GA 6.6
MA 7.6 MO 6.7
AR 7.8 IL 6.7
FL 8.7 NY 6.8
AL 9.9 OR 7.0
SC 10.1 MA 8.0
CT 10.4 DE 8.0
Ten
Highest
Rates
MS 12.7 TN 8.1
25
Page 28
GA 15.8 WV 9.8
Source: See text.
26
Page 29
Table 3. Determinants of business bankruptcy.
Merchants per 1,000 Concerns Manufacturers per 1,000 Firms
(1) (2) (3) (4)
Percent Catholic 0.286 0.091
(0.242) (0.244)
Percent Church Members -0.322 ** -0.147 **
(0.034) (0.028)
ln(Rel. Concentration Index) -9.161 -8.401 ** -13.521 ** -13.723 **
(7.304) (0.701) (5.130) (1.408)
Percent Urban 0.234 * 0.036 * -0.029 -0.101 **
(0.140) (0.013) (0.151) (0.026)
Real Per Capita Income -0.005 ** -0.005 ** -0.002 -0.002
(0.004) (0.002) (0.003) (0.002)
Income Growth 3.001 2.900 0.427 0.516
(2.570) (1.965) (2.847) (2.300)
Loan to Income Ratio 0.002 <0.001 0.001 0.001
(0.001) (0.001) (0.002) (0.001)
Max. Stated Interest Rate 3.806 0.386 -1.673 -2.058 **
(3.146) (0.193) (2.128) (0.309)
Max. Rate if Not Stated -0.897 ** -0.906 ** -0.209 -0.783 **
(0.720) (0.080) (0.809) (0.122)
Homestead Exemption <0.001 * <0.001 * <0.001 <0.001
(<0.001) (<0.001) (<0.001) (<0.000)
Personal Exemption 0.002 ** 0.002 ** -0.002 ** -0.002 **
(<0.001) (<0.001) (<0.001) (<0.001)
N 347 347 338 338
R2 0.66 0.71 0.41 0.47
27
Page 30
Sources: See text. Notes: Robust standard errors in parentheses. * indicates statistically significant at the ten
percent level; ** indicates statistically significant at the five percent level. Year effects included
in estimation but not reported.
28
Page 31
Table 4. Determinants of voluntary and involuntary bankrupty
Merchants Manufacturers
Voluntary
Rate
Involuntary
Rate
Voluntary
Rate
Involuntary
Rate
Real Per Capita Income -0.002 * -0.003 ** 0.001 0.003 **
(0.001) (0.001) (0.001) (0.001)
Income Growth 1.573 1.327 * -0.356 -0.976
(1.323) (0.777) (1.749) (1.033)
Loan to Income Ratio 0.001 <0.001 <0.001 <0.001
(0.001) (<0.001) (0.001) (0.001)
Percent Churchmembers -0.292 ** -0.030 ** -0.143 ** -0.006
(0.029) (0.007) (0.023) (0.015)
ln(Rel. Concentration Index) -3.636 ** -4.766 ** -3.964 ** -9.488 **
(0.382) (0.379) (0.561) (1.214)
Percent Urban -0.086 ** 0.122 ** -0.253 ** -0.140 **
(0.013) (0.010) (0.035) (0.014)
Max. Stated Interest Rate -0.306 * 0.692 ** -2.278 ** 0.126
(0.159) (0.070) (0.250) (0.204)
Max. Rate if Not Stated -1.040 ** 0.134 ** -1.043 ** -0.310 **
(0.086) (0.031) (0.141) (0.073)
Homestead Exemption <0.000 <0.001 ** <0.001 * <0.001 *
(<0.001) (<0.001) (<0.001) (<0.001)
Personal Exemption <0.001 * 0.001 ** -0.003 ** -0.001 **
(<0.001) (<0.001) (0.001) (<0.001)
N 347 347 339 339
R2 0.71 0.66 0.45 0.45
Sources: See text.
29
Page 32
Notes: Robust standard errors in parentheses. * indicates statistically significant at the ten
percent level; ** indicates statistically significant at the five percent level. Year effects included
in estimation but not reported.
30
Page 33
Figure 1. Business bankruptcy rates, 1921-1932
0
1
2
3
4
5
6
7
1921 1922 1923 1924 1925 1926 1927 1928 1929 1930 1931 1932
Ban
krup
tcie
s per
1,0
00 C
once
rns o
r Firm
s
Merchant Rate
Manufacturer Rate
Voluntary Manufacturer Rate
Voluntary Merchant Rate
Source: See text.
31
Page 34
32
stssststst uLXCr
ACKNOWLEDGEMENTS
We thank Jeremy Atack, Robert D. Putnam, and David Skeel for their comments on earlier
drafts. Pamela Laird made invaluable editorial contributions. Remaining errors, of course,
belong to us.
Endnotes
1 Christian Advocate and Journal, May 24, 1855. Tolles (1948) discusses how Quakers dealt
with the insolvency of their members.
2 For a discussion of changes in the relative significance of business and wage earner (personal)
bankruptcy, see Hansen and Hansen (2007).
3 For a summary of the empirical literature on personal bankruptcy rates, see Hansen and Hansen
(2007).
4 The Herfindahl index (also called the Herfindahl-Hirshman index) was developed in the
literature on anti-trust economics. There the index is used to measure the size of individual firms
relative to the size of the industry, and it used as an indicator of the amount of competition
among firms in an industry.
5 Because the bankruptcy rate can be thought of as the number of filings out of the population of
people who might file, we also considered a binomial regression specification. The binomial
specification does not fit our data well.
6 The full model is εγββα +++++= 21
1
, where rst is the business bankruptcy
rate in each state s and year t. The vector Cst includes our measures of church membership and
β is the estimate of primary interest. The vector Xst includes economic variables, and Lst
Page 35
33
describes the laws of each state. Year effects are included. The augmented procedure requires
that we assume that the state-specific effect us is correlated with at least one of the variables in C
or X and one of the variables in L.
7 See Bernanke (1983) and the counterargument in Field (2001).
8 $200 is about equal to one standard deviation in our observations of state income, expressed in
1920 dollars. $200 in 1920 dollars is equivalent to about $2,000 in 2007, with adjustments for
inflation made using the Consumer Price Index.