111
ACTION PLAN FOR RESTORATION & CONSERVATION OF POLLUTED RIVER STRETCHES IN BIHAR Department of Environment, Forest & Climate Change, Govt. of Bihar
ACTION PLAN
FOR
RESTORATION & CONSERVATION
OF
POLLUTED RIVER STRETCHES
IN
BIHAR
Department of Environment, Forest & Climate Change,
Govt. of Bihar
CONTENTS
Sl. No.
Content
Page No.
1. Background. 1-2 2. Bihar: An overview. 3-4 3. River Ganga & its Tributaries. 4-5 4. Initiatives for Conservation of River Ganga. 5-6 5. Water Quality Monitoring Network in Ganga Basin. 6-10 6. Polluted River Stretches in Bihar. 11-14 7. Sewage/Domestic Waste Water Management in ULBs located
in the Polluted River Stretches. 14-46
8. Industrial Pollution along the Polluted River Stretch. 47-48 9. Ground Water Status of Bihar. 48-49 10. Crop Diversification & Drip Irrigation. 49-50 11. Forestry & Plantation Activities along River Ganga and its
Tributaries in Bihar. 50-54
12. Action Plan for Open Defecation Free (ODF). 54 13. Status & Action Plan for Solid Waste, Plastic Waste, Bio-
Medical Waste, e-Waste and Hazardous Waste Management. 54-55
14. Comprehensive Action Plan for Restoration & Conservation of Polluted River Stretches in Bihar.
56-64
Annexure-1: Water Quality Status of River Ganga (2009-2018).
65
Annexure-2: Year Wise Water Monitoring Data of the Ganga.
66-76
Annexure-3: Year Wise Water Quality Monitoring Data of other Polluted River Stretches.
77-83
Annexure-4: Monitoring Reports of Individual Drains. 84-105 Annexure-5: Physical & Financial Target of Agriculture
Road Map 2017-18 to 2021-22. 106
Annexure-6: Constitution of RRC Bihar. 107-108


1
1. BACKGROUND
Water is one of the most essential requisites that nature has provided to sustain life on earth. Without water there would be no life. Population growth, rapid development and indiscriminate and excessive use of water have resulted in great depletion and deterioration of water resources. Water bodies are being polluted by discharge of sewages, industrial effluents and run-off water of the catchment area. Therefore, it is a clarion call to take necessary initiatives to maintain & restore the sanctity of water bodies. The Hon'ble NGT, Principal Bench, New Delhi registered application no. 673/2018 on the basis of news item dated-17.09.2018 authored by Sri Jacob Koshy titled in "The Hindu" under the heading "More river stretches are now critically polluted: CPCB''. According to news item CPCB identified a total of 302 polluted river stretches in the country during 2015 which have since increased to 351. The polluted river stretches have been divided into five priority categories i.e. I, II, III, IV & V.
Priority I BOD greater than or equal to 30 mg/L Priority II BOD between 20-30 mg/L Priority III BOD between 10-20 mg/L Priority IV BOD between 06-10 mg/L Priority V BOD between 03-06 mg/L
Out of 302 polluted river stretches those identified in the State of Bihar are river Sirisia at Raxaul (Priority-III), Parmar along Jogbani (Priority-V), Punpun at Fatuha (Priority-V), Ramrekha at Harinagar (Priority-V), Sikrahna at Narkatiaganj Priority-V) and Ganga (Priority-V). The Hon'ble NGT in its order dated-20.09.2018 directed all the States to prepare action plan within two months for making all the polluted river stretches fit at least for bathing purposes (i.e. BOD <3mg/L and FC <500 MPN/100ml) within six months from the date of finalization of the action plans. In compliance of the order, River Rejuvenation Committee (RRC) has been constituted by the Department of Environment, Forest & Climate Change, Govt. of Bihar vide notification no. 1412(E), dated-31.12.2018 which includes Director, Ecology & Environment, Department of Environment, Forest & Climate Change, Govt. of Bihar; Special Secretary, Urban Development & Housing Department, Govt. of Bihar; Director Industries, Department of Industry, Govt. of Bihar & Member Secretary, Bihar State Pollution Control Board, Patna as members. Meetings of the River Rejuvenation Committee (RRC) were held on 07.01.2019 and 30.01.2019 to formulate action plan while including the

2
components as desired by the Hon'ble NGT for the aforesaid polluted river stretches in Bihar. The Hon'ble NGT has directed that the action plan shall include following components:-
A Identification of Polluting Sources a. Industrial Pollution Control. i. Inventorisation of Industries. ii. Categories of industry & effluent quality. iii. Treatment of effluents, compliance with standards and mode
of disposal of effluent. iv. Regulatory regime.
b. Channelization, treatment, utilization & disposal of treated domestic sewage.
i. Identification of towns in the catchment of river and estimation of quantity of sewage generated and existing sewage treatment capacities to arrive at the gap between the sewage generation and treatment capacities.
ii. Storm water drains now carrying sewage & sullage joining river and interception & diversion of sewage to STP
iii. Treatment and disposal of septage and controlling open defecation.
iv. Identification of towns for installing sewerage system and sewage treatment plants.
B River catchment /Basin Management -controlled ground water extraction and periodic quality assessment. i. Periodic assessment of ground water resources and regulation
of ground water extraction by industries particularly in over exploited and critical zones/ blocks.
ii. Ground water re-charging/rain water harvesting. iii. Periodic ground water quality assessment and remediation
actions in case of contaminated ground water tube wells/bore wells or hand pumps.
iv. Assessment of the need for regulation use of ground water for irrigation purposes.
C Flood Plain Zone i. Regulating activities in flood plain zone. ii. Management of Municipal, Plastic, Hazardous, Bio-medical and
Electrical and Electronic wastes. iii. Greenery development-plantation plan
D Ecological/Environmental Flow (E-Flow) i. Issues relating to E-Flow. ii. Irrigation practices.
E Such other issues which may be found relevant for restoring water quality to the prescribed standards.

3
2. BIHAR: AN OVERVIEW
Bihar is bounded by Nepal in north, Jharkhand in the south, West Bengal in the east and Uttar Pradesh in the west. The Bihar plain is divided into two unequal halves by Ganga which flows from west to east. It occupies a total geophysical area of 94,163 km2 and has a population of 10.41Crores (10,40,99,452) as per census 2011. Out of total population of Bihar, 11.29% people live in urban areas and 88.71% in rural areas. The physical and administrative features of the State are presented as hereunder:- Features:
Particulars Census 2011 Census 2001 Approximate Population 10.41 Crores 8.3 Crores Actual Population 104,099452 82,998,509 Population Growth 25.42 % 28.43 % Percentage of total population of India
8.60% 8.07%
Rural Area (km2) 92,257.51 92,257.51 Urban Area(km2) 1095.49 1095.49 Total Area (km2) 94163 94163 Density/km2 1106 881 Rural Population 88.71% (92,341,436) 74,316,709 Urban Population 11.29% (11,758,016) 86,81,800
Administrative Units:
Divisions 9 Districts 38 Sub-divisions 101 CD blocks 534 Panchayats 8471 Number of Revenue Villages 45103 Number of Towns 130 Urban Local Bodies Municipal Corporation (12) Municipal Council (45) Municipal Nagar Panchayat (86)
143
There are no significant industrial establishments on the main stem of river Ganga. Water quality of Ganga in Bihar indicates the presence of higher value of bacteriological population (Total Coliform and Faecal coliform) indicating the sewage/domestic waste water as the main source of its pollution. Restoration plan of water quality of Ganga includes laying of sewers, interception and diversion of sewage flowing through drain and setting up of sewage treatment plants (STPs), river front development,

4
catchment area treatment (including plantation) construction and improvement of bathing ghats, setting of electric crematoria and low cost sanitation facilities. The desired results have not been achieved so far due to slow-implementation of sewer line and setting up of STPs in the towns located on the bank of River Ganga. The quality of Sikrahan/Budhi Gandak and its sub-tributaries (Ramrekha, Harbaura and Sirsia) and other tributaries of river Ganga also indicate presence of higher values of bacteriological population (Total Coliform and Faecal coliform) indicating sewage/domestic waste water as the main source of its pollution. The Harbaura and Ramrekha join Sikrahna river near Lauriya in West Champaran district. These rivers are small rivers having low flow during lean season. Sirsia river originates in Nepal and enters Bihar at Raxaul, East Chamapran district. Similarly Parmar river also originates in Nepal and enters at Jogbani in Araria district. Sirsia river is already polluted by the time it enters Indian Territory. 3. RIVER GANGA & ITS TRIBUTARIES
The River holy Ganga is the lifeline of northern India. Govt. of India has given the status of National River to the Ganga. In Bihar, Ganga traverses a distance of 425 km from Chausa (Buxar) to downstream of Kahalgaon (Bhagalpur). The main tributaries of river Ganga are Gandak, Budhi Gandak, Ghaghra, Bagmati, Kamla-Balan, Koshi, Mahananda, Karmnasa, Son & Punpun. These tributaries contribute to the flow of Ganga in Bihar stretch and play significant role in maintaining wholesomeness (Nirmal Dhara and Aviral Dhara) of the holy river. Budhi Gandak: The Budhi Gandak River System is a tributary of the Ganga. The Budhi Gandak originates from the hilly area of West chamapran district of Bihar in Indian Territory and enters in Chautarwa Chaur near Bisambharpur, West Champaran, Bihar. The river flows through West Champaran, East Champaran, Muzaffarpur, Samstipur, Begusarai and Khagaria districts of Bihar. It outfalls in the Ganga river near Khagaria. It is also known as Sikrahana in its upper stretch of West Champaran and East Champaran districts. The total catchment area is 12021sq.km, out of which 9601 sq.Km lies in Bihar and rest in Nepal. The total length of the river is 320km. The Ramrekha, Harbaura, Sirsia and Bagmati (partially) are the tributaries of the Sikrahna/Budhi Gandak.

5
Ramrekha: The Ramrekha originates from hilly area and enters in the plains of West Champaran district at Ramangar (Harinagar) and joins Sikrahana just down-stream to Lauria. It is a very small river. Harbaura: The Harbaura originates from hilly area and enters in the plains of West Champaran district of Bihar near Gaunaha-Manguraha. It passes though Narkataiganj town and joins with Balaur and finally outfalls in Sikrahana river just down-stream to Lauria at Matmariya-Beglochana mauza which is approx. 0.5 Km in western side of Lauriya-Narkatiaganj road bridge. Sirsia: The Sirsia river originates in Nepal and enters East Champaran district of Bihar at Raxaul in Indian territory. It finally outfalls in Sikrahana river in East Champaran district. It is a tributary of Sikrahana. Parmar: The Parmar river originates from hilly areas of Nepal and enter at Jogbani of Araria district. This river joints Mahananda at Jokihat of Araria district. Two small rivers namely Khadam and Kisley which also originates in Nepal join Parmar river at village Haziganj and Bhimsena. Both the villages are very near to Jogbani within 1Km from the ' No Man's land'. Punpun: The Punpun River is a tributary of the Ganga. It originates in Palamu district of Jharkhand and flows through Aurangabad, Jahanabad and Patna districts of the Bihar. The Punpun originates on the Chota Nagpur Plateau, at an elevation of 300m. The river mostly flows in a north-east direction and joins the Ganga at Fatuha, 25km downstream of Patna. The 200km long river is mostly rain fed and carries little water in the dry season. However, during rains, the Punpun often causes heavy flood damages east of Patna city. The catchment area of the Punpun is 8,530sq.km. 4. INITIATIVES FOR CONSERVATION OF RIVER GANGA
Earlier, Many initiatives such as Ganga Action Plan (GAP), National Ganga River Basin Authority (NGRBA) Plan where initiated to ensure effective abatement of pollution and conservation of the River Ganga by adopting a river basin approach for comprehensive planning and management. Govt. of India has given the status of National River to the Ganga. A vision of Nirmal and Awiral Dhara under "Namami Gange" Mission is to be achieved by ensuring management of municipal sewage, rural sewage, control of industrial discharges & other proposed plans for

6
Ganga Rejuvenation including its all tributaries. Recently, an Integrated Ganga Conservation Mission called "Namami Gange" has been set up by the Ministry of Water Resources, River Development & Ganga Rejuvenation (MOWR, RD & GR), GoI. Ministry of Water Resources River Development and Ganga Rejuvenation, Govt. of India has constituted the National Ganga Council under The River Ganga (Rejuvenation, Protection & Management) Authorities Order, 2016. National Mission for Clean Ganga (NMCG) is the implementation wing of Namami Gange Programme. In compliance of the aforesaid order State Ganga Rejuvenation, Projection & Management Committee (State Ganga Committee) has been constituted by the State Govt. under chairmanship of Chief Secretary of Govt. of Bihar as a State Nodal Agency for the implementation of the provisions of the aforesaid order and for effective abatement of pollution and rejuvenation, protection and management of the River Ganga and its tributaries. 5. WATER QUALITY MONITORING NETWORK IN GANGA BASIN
Bihar State Pollution Control Board is regularly monitoring the water quality of river Ganga at 33 different locations in addition with the its tributaries at 53 locations, ponds at 02 locations & lakes at 03 locations and ground water at 70 locations in the State of Bihar. Water Quality monitoring is carried out under National Water Quality Monitoring Program (NWMP) sponsored by CPCB. There are total 161 water quality monitoring stations under NWMP. The details of the monitoring stations are shown at Table-1 to 4.The Water Quality criteria is shown at Table-5.
Table-1 Surface Water quality Monitoring
River/Lake/Ponds No. of Sampling Points Frequency of
Sampling Present
Ganga 33 Monthly Tributaries 53 Monthly Ponds 02 Monthly Lakes 03 Monthly

7
Table-2 Existing Water Quality Monitoring Stations on River Ganga
Sl. no.
Place No. of Sampling
Points
Location Frequency
Present
1. Buxar 04 D/S Karamnasha confluence ,(Chausa), U/S Buxar, (Ramrekha ghat), D/s Buxar (Ganga bridge) and U/S Jail Ghat (D/S confluence of Thora River)
Monthly
2. Chapra 02 Doriganj, Maa Ambika Sthan, Aami, Dist-Saran
Monthly
3. Danapur 01 Near Pipapul Monthly 4. Patna 09 U/S, Patna (Kurji), Gandhi
Ghat (NIT), Gulbi Ghat, D/S Patna (Gaighat), Malsalami, Fatuha Triveni Ghat (U/S confluence of Punpun river), Kewla Ghat (U/S confluence of Punpun river), Bakhtiyarpur-Tajpur Proposed Road Bridge, at Athmalgola & Kachchi Dargah-Bidupur proposed Road Bridge
Monthly
5. Barh 03 Uma Nath Ghat, Barh, U/S NTPC, Barh intake point, D/S NTPC Paithani Chak, Bind toli, Barh.
Monthly
6. Mokama 02 U/s Mokama (Mahadeo Sthan Ghat) & D/s Mokama (Rajendra Bridge, Simariya Ghat)
Monthly
7. Barhiya 01 Barhiya Monthly 8. Munger 02 U/s Munger (Steamer Ghat)
and D/s Munger (KasthHarni Ghat)
Monthly
9. Sultanganj 02 U/s Sultanganj & D/s Sultanganj
Monthly

8
10.
Bhagalpur 03 U/s Bhagalpur (Barari Ghat), D/s Bhagalpur (Ganga Bridge) and Champa Nagar, Bhagalpur.
Monthly
11. Kahalgaon 02 Jahaj Ghat and Cremation Ghat
Monthly
12 Bhojpur 02 Aarah-Chapra Road Bridge & Water intake point Mauzampur, Barhara Block.
Total 33
Table-3 Water Quality Monitoring Stations of Tributaries of River Ganga. Sl. No.
River/ Ponds
No. of Sampling
Points
Sampling Locations Frequency
1. Sone 06 Banjari, Nasiriganj, Bahiara, Indrapuri Dam (Dehari-on- Sone), Koelwar and Dehri on sone Road Bridge
Monthly
2. Ghaghara 01 Revilganj Monthly 3. Gandak 05 Dumaria Ghat, Rewa
Ghat, Sonepur, U/S Hajipur (Road Bridge) and D/S Hajipur (Konhara Ghat)
Monthly
4. Punpun 03 Patna-Fatuha Road Bridge, Patna-Gaya Rail Bridge at Punpun, Kinzer Road Bridge
Monthly
5. Sikhrahna 04 Lauriya, Chanpatia, Lal Parsa & Lauriya-Narktiaganj Road Bridge.
Monthly
6. Daha 05 Siwan (Rajendra Bridge), U/s Sasamusa, D/s Sasamusa, Itwa bridge (Gopalganj-Mirganj Road), Mirganj.
Monthly

9
7. Sirsia 02 Raxaul-Birganj Check Post, &KoiriaTola
Monthly
8. Dhons 01 Saharghat (Madhubani-Madhwapur Road Bridge)
Monthly
9. Parmar 01 Jogbani Monthly 10. Harbaura 02 Narkatiaganj U/s & D/s
Near Rail Bridge Monthly
11. Ramrekha 02 Harinagar U/s & D/s Monthly 12. Budhi-
Gandak 05 Samstipur Road Bridge,
U/s Muzaffarpur Road Bridge, Akhara Ghat (Muzaffarpur), Lalbagia & Khagaria Roard Bridge.
Monthly
13. Manusmar 02 Riga U/s & D/s Monthly 14. Koshi 03 Kurshaila bridge
(Katihar), Medhepura & Birpur.
Monthly
15. Kamla 04 Benipatti (Madhubani), Goshala ghat (Darbhanga), Jaynagar, Jeevach Ghat, Darbhanga.
Monthly
16. Mahananda 01 Thakurganj-Kishanganj Road Bridge
Monthly
17. Bagmati 04 Muzaffarpur-Sitamarhi Road Bridge, Darbhanga-Samastpur Road Bridge, U/S Darbhanga and D/S Darbhanga (On second stream of Bagmati)
Monthly
18. Kohra 02 U/s Kohra Rajghat, Manjhaulia D/s Kohra Rajghat, Manjhaulia
Monthly
Total 53

10
Table-4 Water Quality Monitoring of Pond and Lakes
Sl. No.
Ponds No. of Sampling
Points
Sampling Locations
Frequency
1. Motijheel, Lake 01 Motihari Monthly 2. KanwarLake 01 Majhaul,
Begusarai Monthly
3. Sinkandarpur Lake
01 Muzaffarpur Monthly
4. DighiTalab, 01 Gaya Monthly 5. SurajKund 01 Gaya Monthly
Total 05 Table-5
Primary Water Quality Criteria for Various Uses Quality Class (Use Class)
Designated best use Parameter
pH Dissolved Oxygen (D.O.) mg/L Min.
Bio-Chemical Oxygen Demand (B.O.D.)
mg/L Max.
Total Coliform MPN/10
0ml Max.
A Drinking water source without conventional treatment but after
disinfections
6.5-8.5 6 2 50
B Outdoor bathing organized
6.5-8.5 5 3 500
C Drinking water source with conventional
(treatment followed by disinfections)
6.0-9.0 4 3 5000
D Propagation of Wild life, fisheries
6.5-8.5 4 - -
E Irrigation, Industrial Cooling, Controlled
Waste Disposal
6.5-8.5 - - -
Primary Water Quality Criteria for bathing
pH 6.5 to 8.5 Dissolved Oxygen (DO) 5 mg/L or more Biochemical Oxygen Demand (BOD) 3 mg/L or less Fecal Coliform 2500 MPN/100mL
11
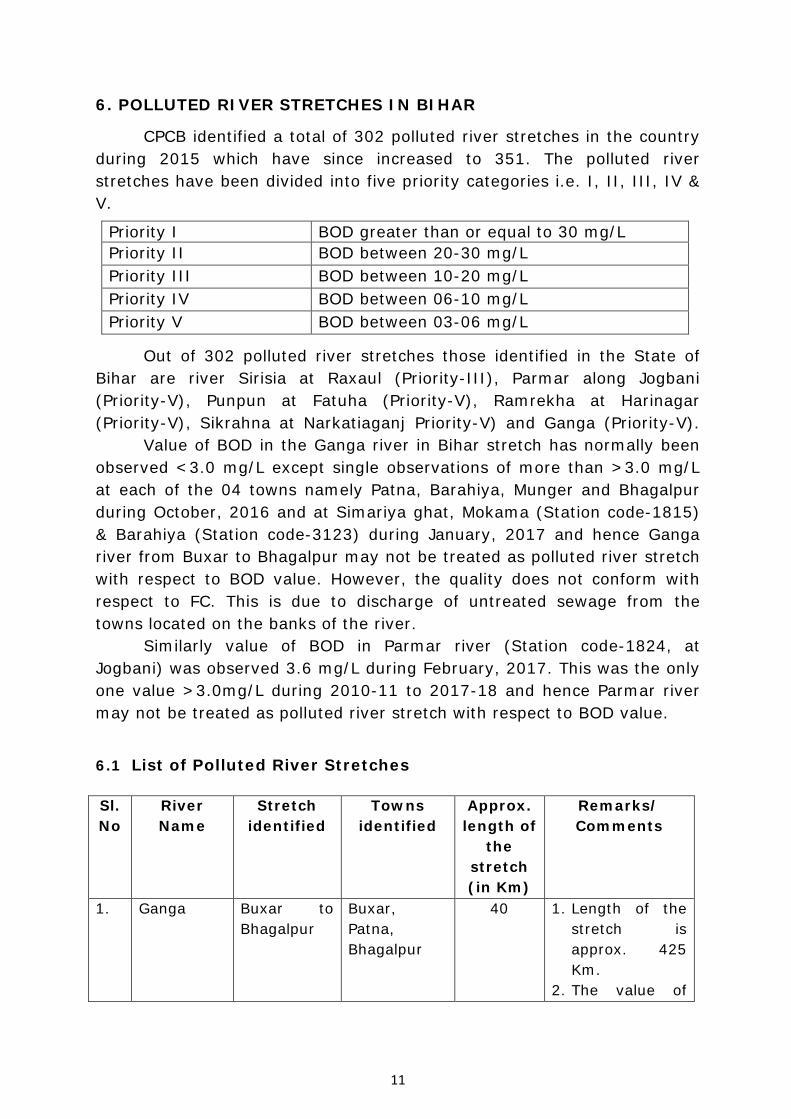
6. POLLUTED RIVER STRETCHES IN BIHAR
CPCB identified a total of 302 polluted river stretches in the country during 2015 which have since increased to 351. The polluted river stretches have been divided into five priority categories i.e. I, II, III, IV & V.
Priority I BOD greater than or equal to 30 mg/L Priority II BOD between 20-30 mg/L Priority III BOD between 10-20 mg/L Priority IV BOD between 06-10 mg/L Priority V BOD between 03-06 mg/L
Out of 302 polluted river stretches those identified in the State of Bihar are river Sirisia at Raxaul (Priority-III), Parmar along Jogbani (Priority-V), Punpun at Fatuha (Priority-V), Ramrekha at Harinagar (Priority-V), Sikrahna at Narkatiaganj Priority-V) and Ganga (Priority-V). Value of BOD in the Ganga river in Bihar stretch has normally been observed <3.0 mg/L except single observations of more than >3.0 mg/L at each of the 04 towns namely Patna, Barahiya, Munger and Bhagalpur during October, 2016 and at Simariya ghat, Mokama (Station code-1815) & Barahiya (Station code-3123) during January, 2017 and hence Ganga river from Buxar to Bhagalpur may not be treated as polluted river stretch with respect to BOD value. However, the quality does not conform with respect to FC. This is due to discharge of untreated sewage from the towns located on the banks of the river. Similarly value of BOD in Parmar river (Station code-1824, at Jogbani) was observed 3.6 mg/L during February, 2017. This was the only one value >3.0mg/L during 2010-11 to 2017-18 and hence Parmar river may not be treated as polluted river stretch with respect to BOD value.
6.1 List of Polluted River Stretches
Sl. No
River Name
Stretch identified
Towns identified
Approx. length of
the stretch (in Km)
Remarks/ Comments
1. Ganga Buxar to Bhagalpur
Buxar, Patna, Bhagalpur
40 1. Length of the stretch is approx. 425 Km.
2. The value of
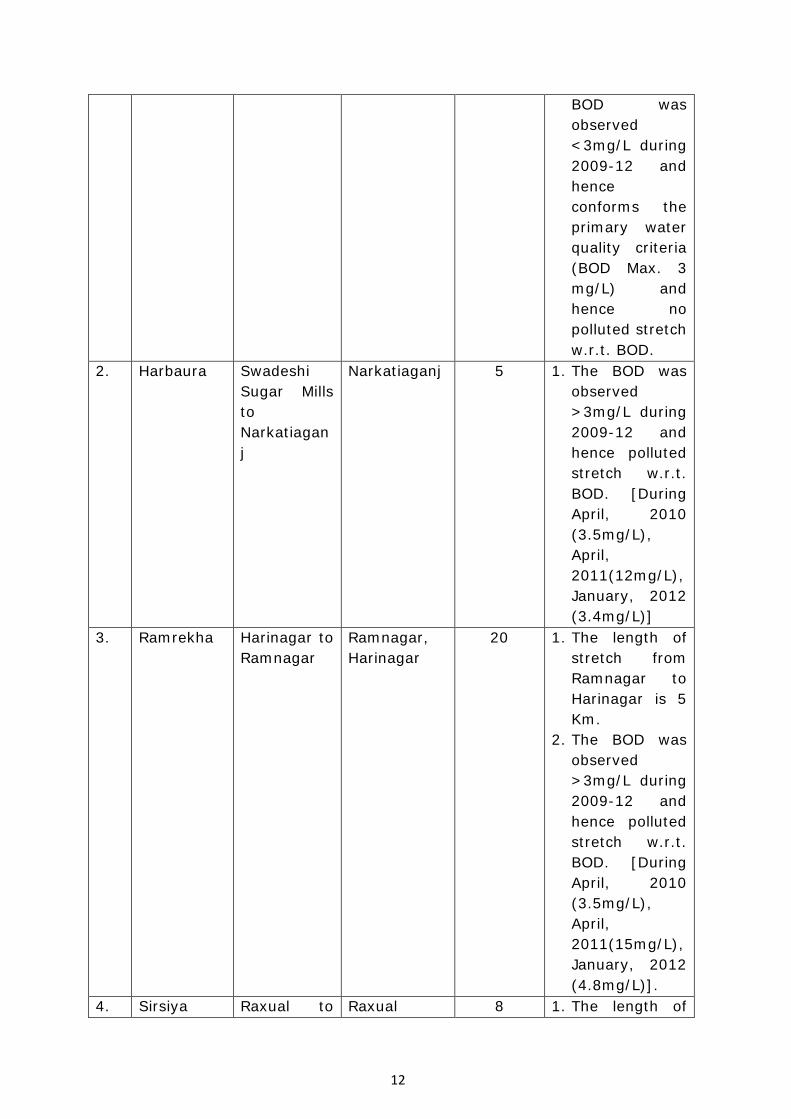
12
BOD was observed <3mg/L during 2009-12 and hence conforms the primary water quality criteria (BOD Max. 3 mg/L) and hence no polluted stretch w.r.t. BOD.
2. Harbaura Swadeshi Sugar Mills to Narkatiaganj
Narkatiaganj 5 1. The BOD was observed >3mg/L during 2009-12 and hence polluted stretch w.r.t. BOD. [During April, 2010 (3.5mg/L), April, 2011(12mg/L), January, 2012 (3.4mg/L)]
3. Ramrekha Harinagar to Ramnagar
Ramnagar, Harinagar
20 1. The length of stretch from Ramnagar to Harinagar is 5 Km.
2. The BOD was observed >3mg/L during 2009-12 and hence polluted stretch w.r.t. BOD. [During April, 2010 (3.5mg/L), April, 2011(15mg/L), January, 2012 (4.8mg/L)].
4. Sirsiya Raxual to Raxual 8 1. The length of

13
Koiriya Tola (Raxual)
stretch from Raxual to Koriya Tola is 2 Km.
2. The BOD was observed >3mg/L during 2009-12 and hence polluted stretch w.r.t. BOD. [During October, 2009 (3.5mg/L)April, 2010 (3.4mg/L), July, 2010(8mg/L), January, 2011 (8.4mg/L), April, 2011 (15 mg/L, October, 2011 (10 mg/L), January, February, March, 2012 (9,12,10mg/L respectively)].
5. Punpun Fatuha Fatuha & Patna
1 1. River gets polluted due to discharge of untreated sewage/waste water from Patna through Badshahi Nala.
2. The BOD was observed >3 mg/L (4 mg/L during March, 2018)
6. Parmar Jogbani Jogbani 2 1. BOD is observed <3 mg/L. There was only one

14
observation >3 mg/L (3.6mg/L during February, 2017)
7. Sewage/domestic waste water management in ULBs located in the polluted river stretches 7.1 ULBs located on polluted rivers (other than Ganga)
7.1.1 Raxaul Nagar Parisad: Total geographical area of Raxaul Nagar Parishad is 5.82 km2 with 8794 households and population of 55536 as per census 2011. Population density of the city is 9542 persons per km2. There are 25 wards in the city, among them ward no.04 is the most populous ward with population of 3235 and ward no.06 is the least populous ward with population of 1286. The source of water supply is ground water. Drainage/Sewerage System& STP: There are three (3) drains namely Drain at Naga Road, Drain at Chhatiaya Ghat, Drain near Custom Check Post Bridge. The total sewage/waste water discharges through aforesaid drains have been assessed to 7.88 MLD. There is no sewerage network & STP for sewage management at Bagha Nagar Parisad area. The details of the drains are hereunder:-
Sl. No.
Name of drain Average flow
(MLD)
Recipient Sewage/waste water Quality
1. Drain at Naga Road, Shivpuri Mohalla, Raxaul
6.03 Sirsiya River pH: 7.04 BOD: 62 mg/L COD:232 mg/L TSS: 38 mg/L
2. Drain at Chhatiaya Ghat, near Railway Bridge, Raxaul
3.1 Sirsiya River pH: 7.25 BOD: 9 mg/L COD: 44 mg/L TSS: 36 mg/L
3 Drain near Custom Check Post Bridge, Raxaul
5.76 Sirsiya River pH: 7.31 BOD: 16 mg/L COD: 60 mg/L TSS: 38 mg/L
Total 14.89

15
7.1.2 Narkatiaganj Nagar Parishad, Narkatiaganj: Total geographical area of Narkatiaganj Nagar Parishad is 11 km2 with 7883 households and population of 49507 as per census 2011. There are 25 wards in the city, among them 13 is the most populous ward with population of about 3556 and 07 is the least populous ward with population of 642.The Population density of the city is 4517 persons per km2. The source of water supply is ground water.
Drainage/Sewerage System& STP: There are three (3) drains namely (i) Domestic Waste Water/Sewage drain, passing near power grid of Sugar Mill, (ii) Dhum Nagar Mandir drain & (iii) Nehar drain, Near Hardiya. The aforesaid Domestic Waste Water/Sewage drain, passing near power grid of

16
Sugar Mill, & Dhum Nagar Mandir drain joins Harbaura river and Nehar drain, Near Hardiya, disperses in low lying area. The total sewage/waste water discharges through aforesaid drains have been assessed to 14.591 MLD. There is no sewerage network & STP for sewage management at Narkatiaganj Nagar Parishad area. The details of the drains are hereunder:-
Sl. No.
Name of drain Average flow
(MLD)
Recipient Sewage/waste water Quality
1. Domestic Waste Water/Sewage drain, passing near power grid of Sugar Mill
6.736 Harbaura River pH: 6.59 BOD: 22 mg/L COD: 80 mg/L TSS: 53 mg/L
2. Dhum Nagar Mandir drain
4.215 Harbaura River pH: 6.59 BOD: 38 mg/L COD: 148 mg/L TSS: 78 mg/L
3. Nehar drain, Near Hardiya
3.640 Low Lying Area and Found Dry after 3.5 KM
pH: 6.62 BOD: 24 mg/L COD: 84 mg/L TSS: 26 mg/L
Total 14.591
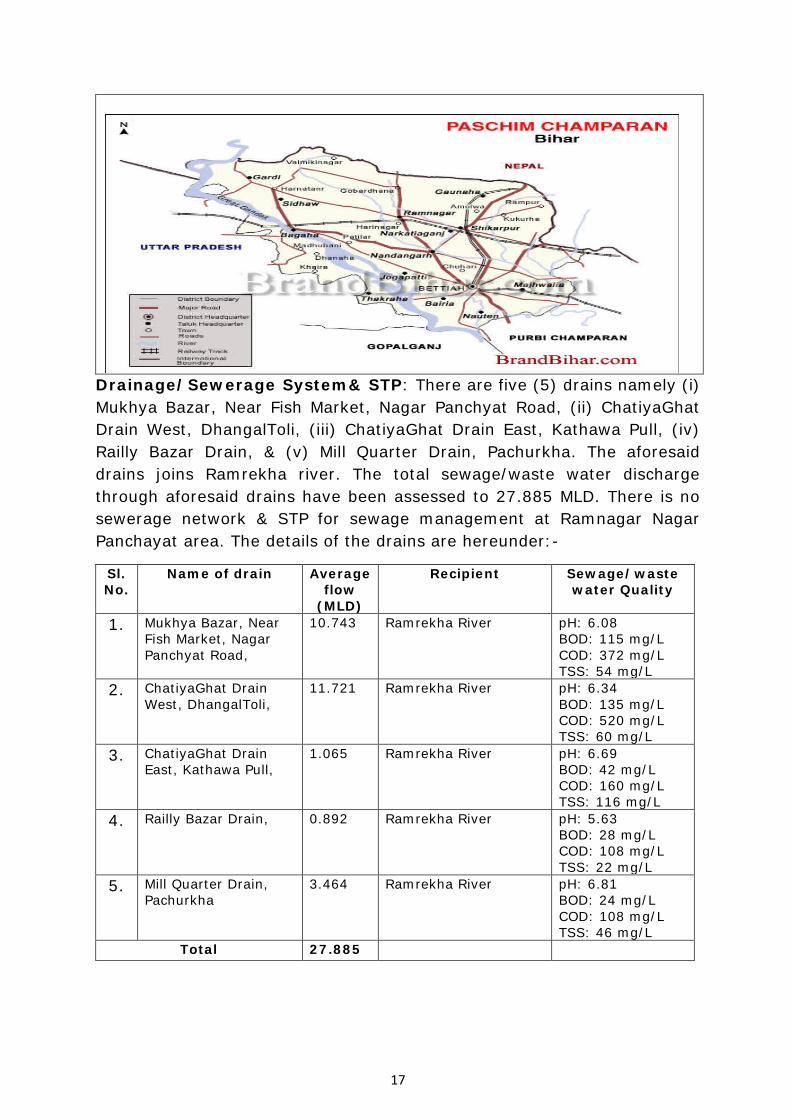
7.1.3 Ramnagar Nagar Panchayat: Total geographical area of Ramnagar Nagar Panchayat is 16.2km2 with 9123 households and population of 48411 as per census 2011. Population density of the city is 2988 persons per km2. There are 23 wards in the city, among them ward no. 20 is the most populous ward with population of 4220 and ward no. 17 is the least populous ward with population of 925. The source of water supply is ground water.
17
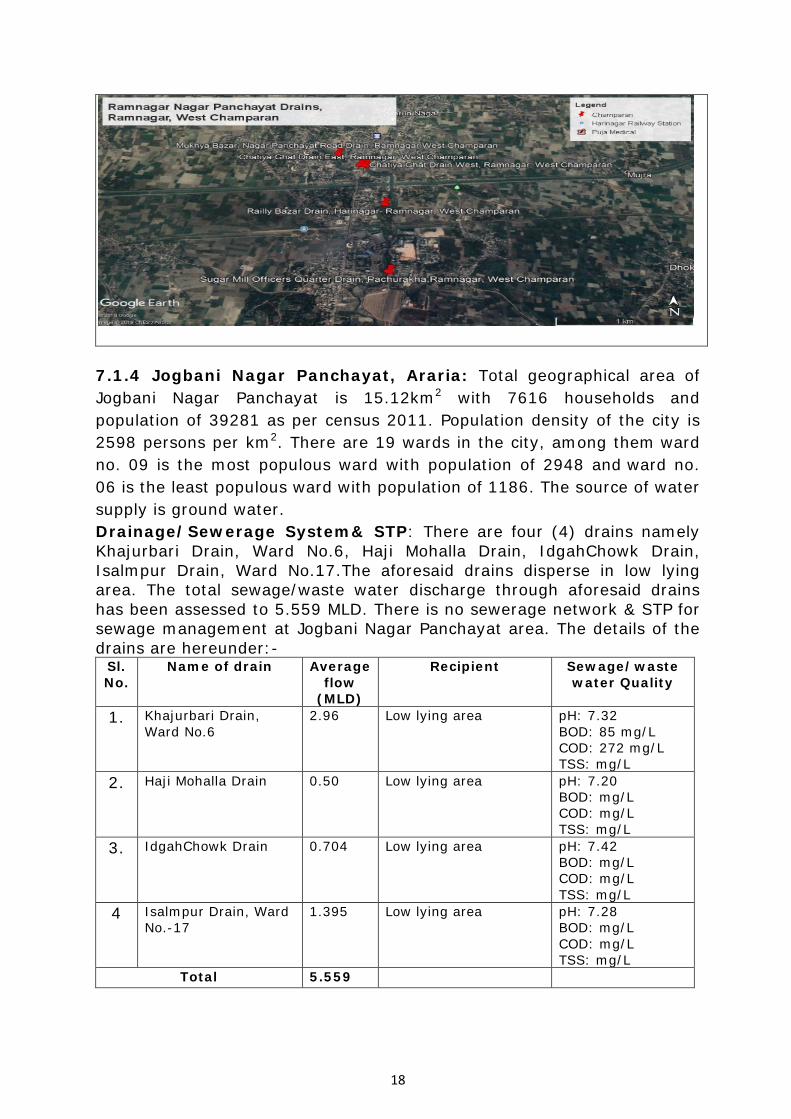
Drainage/Sewerage System& STP: There are five (5) drains namely (i) Mukhya Bazar, Near Fish Market, Nagar Panchyat Road, (ii) ChatiyaGhat Drain West, DhangalToli, (iii) ChatiyaGhat Drain East, Kathawa Pull, (iv) Railly Bazar Drain, & (v) Mill Quarter Drain, Pachurkha. The aforesaid drains joins Ramrekha river. The total sewage/waste water discharge through aforesaid drains have been assessed to 27.885 MLD. There is no sewerage network & STP for sewage management at Ramnagar Nagar Panchayat area. The details of the drains are hereunder:-
Sl. No.
Name of drain Average flow
(MLD)
Recipient Sewage/waste water Quality
1. Mukhya Bazar, Near Fish Market, Nagar Panchyat Road,
10.743 Ramrekha River pH: 6.08 BOD: 115 mg/L COD: 372 mg/L TSS: 54 mg/L
2. ChatiyaGhat Drain West, DhangalToli,
11.721 Ramrekha River pH: 6.34 BOD: 135 mg/L COD: 520 mg/L TSS: 60 mg/L
3. ChatiyaGhat Drain East, Kathawa Pull,
1.065 Ramrekha River pH: 6.69 BOD: 42 mg/L COD: 160 mg/L TSS: 116 mg/L
4. Railly Bazar Drain, 0.892 Ramrekha River pH: 5.63 BOD: 28 mg/L COD: 108 mg/L TSS: 22 mg/L
5. Mill Quarter Drain, Pachurkha
3.464 Ramrekha River pH: 6.81 BOD: 24 mg/L COD: 108 mg/L TSS: 46 mg/L
Total 27.885
18
7.1.4 Jogbani Nagar Panchayat, Araria: Total geographical area of Jogbani Nagar Panchayat is 15.12km2 with 7616 households and population of 39281 as per census 2011. Population density of the city is 2598 persons per km2. There are 19 wards in the city, among them ward no. 09 is the most populous ward with population of 2948 and ward no. 06 is the least populous ward with population of 1186. The source of water supply is ground water. Drainage/Sewerage System& STP: There are four (4) drains namely Khajurbari Drain, Ward No.6, Haji Mohalla Drain, IdgahChowk Drain, Isalmpur Drain, Ward No.17.The aforesaid drains disperse in low lying area. The total sewage/waste water discharge through aforesaid drains has been assessed to 5.559 MLD. There is no sewerage network & STP for sewage management at Jogbani Nagar Panchayat area. The details of the drains are hereunder:-
Sl. No.
Name of drain Average flow
(MLD)
Recipient Sewage/waste water Quality
1. Khajurbari Drain, Ward No.6
2.96 Low lying area pH: 7.32 BOD: 85 mg/L COD: 272 mg/L TSS: mg/L
2. Haji Mohalla Drain 0.50 Low lying area pH: 7.20 BOD: mg/L COD: mg/L TSS: mg/L
3. IdgahChowk Drain 0.704 Low lying area pH: 7.42 BOD: mg/L COD: mg/L TSS: mg/L
4 Isalmpur Drain, Ward No.-17
1.395 Low lying area pH: 7.28 BOD: mg/L COD: mg/L TSS: mg/L
Total 5.559

19
7.1.5 Fatuha Nagar Parishad: Total geographical area of Fatuha Nagar Parishad is 4.9 km2 with 8182 households and population of 50475 as per census 2011. Population density of the city is 10400 persons per km2. There are 23 wards in the city, among them Ward no. 06 is the most populous ward with population of 3549 and Ward no. 10 is the least populous ward with population of 977.The source of water supply is ground water. Drainage/Sewerage System& STP: There are seven (7) drains namely Kali Ghat, samaspur, Makshudpur Drain (East of Bindheshwari Ghat), Makshudpur Drain (West of Bindheshwari Ghat), Kataiya Ghat, Devanti Ghat, Mastana Ghat, Bakipur Gorakh Drain. The total sewage/waste water discharges through aforesaid drains have been assessed to 9.22 MLD. There is no sewerage network & STP for sewage management at Fatuha Nagar Parisad area. The details of the drains are hereunder:-
Sl. No.
Name of drain Average flow
(MLD)
Recipient Sewage/waste water Quality
1. Kali Ghat, samaspur 0.72 Meeting to Ganga pH: 5.70 BOD: 17 mg/L COD: 64 mg/L TSS: 80 mg/L
2. Makshudpur Drain (East of Bindheshwari Ghat)
0.37 Meeting to Ganga pH: 5.67 BOD: 52 mg/L COD: 176 mg/L TSS: 54 mg/L

20
3. Makshudpur Drain (West of Bindheshwari Ghat)
1.10 Meeting to Ganga pH: 5.82 BOD: 46 mg/L COD: 164 mg/L TSS: 88 mg/L
4. Kataiya Ghat 0.64 Meeting to Ganga pH: 5.80 BOD: 50 mg/L COD: 168 mg/L TSS: 56 mg/L
5. Devanti Ghat 2.30 Meeting to Ganga pH: 6.77 BOD: 19 mg/L COD: 68 mg/L TSS: 272 mg/L
6. Mastana Ghat 1.14 Meeting to Ganga pH: 5.94 BOD: 42 mg/L COD: 160 mg/L TSS: 96 mg/L
7. Bakipur Gorakh Drain 2.95 Meeting to Punpun pH: 6.41 BOD: 85 mg/L COD: 268 mg/L TSS: 54 mg/L
Total 9.22
7.1.6 ABSTRACT OF POLLUTED RIVER STRETCHES(EXCEPT GANGA)
Sl. No. Name of ULBs
Number of Drains
Identified
Total Flow in
MLD
Recipients/ Polluted River
Stretch 1. Raxaul Nagar Parishad,
Raxaul 3 14.89
(15) Sirsiya River
2. Narkatiaganj Nagar Parishad, Narkatiaganj
3 14.59 (15)
Harbaura River
3. Ramnagar Nagar Panchyat, Ramnagar
5 27.88 (28)
Ramrekha River
4. Fatuha Nagar Parishad, Patna
7 9.22 (09)
Ganga River & Punpun
5. Jogbani Nagar Panchayat, Araria
4 2.74 (03)
Low lying Area

21
Presently, identified drains carry storm water as well as sewage/domestic waste water generated from towns/ULBs.
7.1.7 Status of Sewerage Network & STP and Action Plan for Sewage Management in Polluted River Stretch(except Ganga)
There is no any sewerage network and Sewage Treatment Plant (STP) in the ULBs of polluted river stretch basin. Department of Urban Development & Housing, Govt. of Bihar (Bihar State Ganga River Conservation and Programme Management Society (BGCMC) is the executive agency for the installation and operation & maintenance of STPs for treatment of sewage/untreated domestic sewage generated from different cities in Bihar. In pursuance of BSPCB, BGCMC has directed BUDCO for preparation of DPR for sewage management for the ULBs namely Raxaul, Narkatiaganj, Ramnagar-Harinagar and Jogbani located in the polluted river stretch basin. DPR will be prepared by April, 2019 and will be sent to NMCG for sanction. After approval of DPR the work will completed by June, 2021. A scheme of I&D and STP of 07 MLD capacity has been approved for Rs. 35.49 Cr. for Fatuha. Tender floated. The expected time of completion of the project is December, 2020.
7.2 Sewage/Domestic Waste Water Discharge into the Ganga
Sl. No. Name of ULBs
Number of Drains
Identified
Total Flow in
MLD
Recipients/ Polluted River
Stretch 1. Buxar Nagar Parishad 07 31.55 (32) Ganga 2. Patna Municipal Corporation 19 628 Ganga & Punpun 3. Bhagalpur Municipal
Corporation 15 123.9
(124) Ganga
4. Munger Municipal Corporation
01 21.5 (21) Ganga
5. Chapra Municipal Corporation
01 4.87(5) Ghaghara
6. Bakhtiyarpur Nagar Parishad
01 4.3 (4) Ganga
7. Barh Nagar Parishad 07 9.13 (9) Ganga & low lying area
8. Danapur Nagar Parishad 01 8.16(8) Ganga 9. Fatuha Nagar Parishad 07 9.22(9) Ganga & Punpun 10. Mokama Nagar Parishad 04 7.17 (7) Ganga 11. Sultanganj Nagar Parishad 01 1.7 (2) Ganga 12. Barhiya Nagar Panchayat 03 5.66 (6) Low lying area 13. Dighwara Nagar Panchayat 02 1.57(2) Ganga 14. Maner Nagar Panchayat 03 13.3 (13) Sone river->
Ganga river

22
7.2.1 Buxar Nagar Parisad, Buxar: Total geographical area of Buxar Nagar Parisad is 5.16km2 with 14010 households and population of 102861 as per census 2011. Population density of the city is 19934 persons per km2. There are 11 wards in the city, among them ward no. –16 is the most populous ward with population of 5021 and ward no. -23 is the least populous ward with population of 1626. The source of water supply is ground water.
Drainage/Sewerage System& STP: There are Seven (7) drains namely ChhotiSaripur Drain, Hospital Road Drain, Sati Ghat Drain, Bangla Ghat Drain, Tadka Drain, Nath Baba Mandir Drain, Sohnipatti Drain. The total sewage/waste water discharges through aforesaid drains have been assessed to 31.55 MLD. There is no sewerage network & STP for sewage management at Buxar NagarParisad area. The details of the drains are hereunder:-
Sl. No.
Name of drain Average flow
(MLD)
Recipient Sewage/waste water Quality
1. ChhotiSaripur Drain 5.87 Ganga River pH: 6.08 BOD: 26 mg/L COD: 96 mg/L TSS: 68 mg/L
2. Hospital Road Drain 3.82 Ganga River pH: 6.42 BOD: 36 mg/L COD: 128 mg/L TSS: 64 mg/L
3. Sati Ghat Drain 6.29 Ganga River pH: 6.63 BOD: 72 mg/L COD: 224 mg/L TSS: 62 mg/L
4. Bangla Ghat Drain 1.80 Ganga River pH: 6.64

23
BOD: 70 mg/L COD: 212 mg/L TSS: 78 mg/L
5. Tadka Drain 8.23 Ganga River pH: 6.85 BOD: 74 mg/L COD: 224 mg/L TSS: 54 mg/L
6.
Nath BabaMandir Drain 4.23 Ganga River pH: 6.79 BOD: 15 mg/L COD: 68 mg/L TSS: 56 mg/L
7. Sohnipatti Drain 1.31 Ganga River pH: 6.79 BOD: 15 mg/L COD: 68 mg/L TSS: 56 mg/L
Total 31.55 7.2.2 Patna Muncipal Corporation, Patna: Total geographical area of Patna Municipal Corporation is approx. 110 km2 with 223088 households and population of 1684222 as per census 2011. The Patna Municipal Corporation is divided into 75 wards, which is managed through 5 circles namely New Capital (Total no. wards 16: ward no. 3,4,9-19, 21,28, 37, covering area Bailey Road area, Boring Road area, Khajpura area, Kurji area, Indrapuri Area, Rajiv Nagar area, Station area and Gandhi Maidan Marg); Kankarbagh(Total wards no. 11: 29-35, 44-46, 55, Covering area New By Pass road area, Kankarbagh road area, Chirayatard railways bridge area, Bhootnath Road area and Saidpur area); Bankipur circle (Total no. wards: 12: 36, 38-43, 47-51, covering area Ashok Rajpath area, Saidpur main drain area, Bakerganj area, Gandhi Ghat area and Bari path area); Patna city (Total no. wards: 20: 52-54, 56-72, Covering area Gaighat, Dundi Bazar area, Mahatma Gandhi Setu road area, New Bypass road area, Patna Ghat area and MaalGodam) and Patliputra (Total no. wards: 16: 1,2, 5-8, 20, 22, 22A, 22B, 22C, 23-27, covering area Patliputra colony, Digha, Kurji and Mainpura). The source of domestic water supply is ground water. The city of Patna is one of the oldest continuously inhabited places in the world with the Patna Municipal Corporation (PMC) extending between the Latitude: 25°33'22''- 25°39'2'' North and Longitude: 85°31'12''- 85°15'5'' East. The elevation of the city is 519 meters above the mean sea level. It is a river borne town, located on the right bank (southern bank) of the Ganga. Punpun River joins Ganga it some 12 kms, east at Fatwa. Patna extends up to 21.3 kms in length (east to west) and 10.2 kms in breadth (north to south). Patna, being the capital of Bihar is a metropolis having some regional importance. It is the administrative focus of the entire state, besides being the District head quarter, Divisional and State administration. It is the head quarter of local administration, Judiciary and Legislature.

24
Drainage/Sewerage System & STP: The sewerage system has not been fully developed presently, The storm water drainages carry sewage and mostly flow from south to north and fall into river Ganga. There is a proposal to develop proper sewerage system in the city and then entire sewage will be diverted to STPs through respective network for treatment. Presently, city has four STPs of 109 MLD capacity (Beur-35MLD, Saidpur- 45MLD, Pahari- 25 MLD and Karmalichak- 04 MLD). These are under-utilized and treating all together only 61 MLD of sewage. It has been assessed that Patna city requires STPs of around 350 MLD capacity. (Beur-43 MLD, Saidpur-60 MLD, Pahari- 60MLD, Karmalichak- 37 MLD, Digha- 100 MLD &Kankarbagh- 50 MLD). The total proposed length of network is about 1000 Km. The proposed Patna Sewerage system has been divided into six different zones, such as Digha, Beur, Kankarbagh, Saidpur, Pahari &Karmalichak. After implementation of sewerage scheme of these zones will cater to the sewerage problems of entire 75 wards of Patna Municipal Corporation area. The sewerage scheme of Beur, Saidpur, Pahari and Karmalichak will be completed by 2020 where as Digha&Kankarbagh will be completed by 2021. Present status of the project is as follows:- There are 19 drains discharging sewage/domestic waste water to river Ganga. It is to be noted that significant drains of Patna namely Rajapurpul drain, Mandiri(Bans ghat drain) & Anta Ghat drain joins together to form a single common combined sewage/waste water channel and joins Ganga river near Kalighat, ahead TR BanarjeeGhat, Patna. The aforesaid drains discharge approx. 628 MLD (566 MLD sewage/waste water to river Gagna and 62 MLD to Punpun River). Out of 19 drains, 11 drains are having very low flow less than 1 MLD. The details of the drains are hereunder:-
Patna Municipal Corporation, Patna:
Sl. No.
Name of drain Average flow
(MLD)
Recipient Sewage/waste water Quality
1. DighaGhat Drain (Canal)
134 River Ganga pH:7.59 BOD:23 mg/L COD:88 mg/L TSS:92 mg/L
2. Kurji Drain 65 River Ganga pH:7.63 BOD:34 mg/L COD:120 mg/L TSS:42 mg/L
3. RajapurPul Drain 128 River Ganga pH: 7.88 BOD:16 mg/L COD:68 mg/L TSS:84 mg/L
4. Mandiri (Bans Ghat) Drain
148 River Ganga pH: 7.10 BOD:54 mg/L

25
COD:184 mg/L TSS: 44 mg/L
5. Anta Ghat Drain 43 River Ganga pH: 7.40 BOD:75 mg/L COD:232 mg/L TSS: 44 mg/L
6. Krishna Ghat Drain (Pump House)
River Ganga pH: 7.33 BOD:80 mg/L COD:272 mg/L TSS: 10 mg/L
7. BarharwaGhat 0.042 River Ganga pH: 7.48 BOD: 60 mg/L COD:184 mg/L TSS: 14 mg/L
8. Rani Ghat Drain 0.072 River Ganga pH:7.42 BOD:44 mg/L COD:152 mg/L TSS: 36 mg/L
9. GhaghaGhat 0.032 River Ganga pH: 7.37 BOD: 60 mg/L COD:216 mg/L TSS:48 mg/L
10. Masjid Ghat Drain 0.05 River Ganga pH:7.22 BOD:90 mg/L COD:268 mg/L TSS: 52 mg/L
11. LoharwaGhat Drain 0.039 River Ganga pH: 7.34 BOD:75 mg/L COD:240 mg/L TSS: 58 mg/L
12. Goshaighat Drain 0.06 River Ganga pH:7.49 BOD:60 mg/L COD:184 mg/L TSS: 50 mg/L
13. BhadraGhat Drain 0.05 River Ganga pH:7.49 BOD:38 mg/L COD:136 mg/L TSS: 42 mg/L
14. NauzarGhat Drain 0.02 River Ganga pH:7.46 BOD:65 mg/L COD:232 mg/L TSS:26 mg/L
15. MittanGhat Drain 48 River Ganga pH:7.43 BOD: 90 mg/L COD:352 mg/L TSS:34 mg/L
16. Badshahi Drain 62 Punpun at Fatuha-> River Ganga
pH: 7.67 BOD:38 mg/L COD:124 mg/L TSS:26 mg/L
17. GaiGhat Drain 0.06 River Ganga pH:7.53 BOD:44 mg/L COD:156 mg/L TSS:78 mg/L
18. MahavirGhat Drain 0.04 River Ganga pH: 7.61 BOD:24 mg/L

26
COD:100 mg/L TSS: 16 mg/L
19. BaluGhat Drain 0.04 River Ganga pH:7.34 BOD:90 mg/L COD:284 mg/L TSS: 54 mg/L
Total 628.505 20. RajapurPul drain +
Mandiri drain+ Anta ghat drain combined sewage /waste water channel and joining Ganga river near Kalighat,
319 River Ganga
7.2.3 Bhagalpur Municipal Corporation, Bhagalpur: Total geographical area of Bhagalpur Municipal Corporation is 30 km2 with 58361 households and population of 400146 as per census 2011.Population density of the city is 13263 persons per km2. There are 51 wards in the city, among them Bhagalpur Ward No 33 is the most populous ward with population of about 11 thousand and Bhagalpur Ward No 32 is the least populous ward with population of 4645.
Drainage/Sewerage System& STP: There are fifteen (15) drains namely Adampur Drain, Hathiya Drain near intake well, Surkhikal Drain, Sakhichand Drain, BarariGhat Drain, Neel Kothi Drain, PipaliDham drain-1&2, KuppaGhat Drain, Koyla Ghat, HathiyaNala, Near Tilkamnajhi University, STP Drain, SahebganjMiyabari Drain, ChampaNala -1, ChampaNala -2. The aforesaid drains discharge sewage/domestic waste

27
water into Ganga River directly. The total sewage/waste water discharge through aforesaid drains has been assessed to 123.9 MLD.
Presently, there is no sewerage network and operational STP (earlier had a STP of 11 MLD capacity) for sewage management at Bhagalpur Municipal Corporation area. There is proposal of sewerage network and STP of 65 MLD capacity under NamamiGange Project. Cost of the project is 254.13 core. It is expected to be completed by December, 2020 as reported by HD&HD, Govt. of Bihar. The details of the drains are hereunder:-
Bhagalpur Municipal Corporation, Bhagalpur:
Sl. No.
Name of drain Average flow (MLD)
Recipient Sewage/waste water Quality
1. Adampur Drain 18.91 Ganga River pH:7.55 BOD:15mg/L COD:68mg/L TSS:62mg/L
2. Hathiya Drain near intake well
7.54 Ganga River pH: 7.76 BOD:09 mg/L COD:56 mg/L TSS:48 mg/L
3. Surkhikal Drain 13.10 Ganga River pH: 7.63 BOD:32mg/L COD:120mg/L TSS: 70mg/L
4. Sakhichand Drain 12.69 Ganga River pH:7.58 BOD:10mg/L COD: 56mg/L TSS:62mg/L
5. BarariGhat Drain, near Vikramshila Bridge, Bhagalpur
6.61 Ganga River pH:7.40 BOD:17mg/L COD:80mg/L TSS: 38mg/L
6. Neel KothiGhat Drain, Bhagalpur
1.91 Ganga River pH:7.45 BOD:20mg/L COD:92mg/L TSS: 68mg/L
7. pipalliDham Drain-I, Bhagalpur
0.7 Ganga River pH:7.86 BOD:14 mg/L COD:60 mg/L TSS: 56 mg/L
8. PipalliDham Drain-II, Bhagalpur
1.49 Ganga River pH:7.55 BOD:10 mg/L COD:56 mg/L TSS: 62 mg/L
9. KuppaGhat Drain 4.43 Ganga River pH:6.58 BOD:08 mg/L COD:40 mg/L TSS: 36 mg/L
10. Koyla Ghat 7.63 Ganga River pH: 7.72 BOD:125 mg/L COD:380mg/L TSS:192mg/L
11. HathiyaNala, Near Tilkamnajhi University
22.66 Ganga River pH: 7.69 BOD:145mg/L COD:468mg/L TSS:160 mg/L
12. STP Drain, Bhagalpur 1.77 Ganga River pH: 7.85 BOD:130mg/L COD:412mg/L
28
TSS: 142mg/L 13. SahebganjMiyabari
Drain 4.51 Ganga River pH: 7.94
BOD:32mg/L COD:108mg/L TSS:118mg/L
14. ChampaNala -1 11.57 Ganga River pH: 7.26 BOD:95mg/L COD:304mg/L TSS: 138mg/L
15. ChampaNala -2 8.38 Ganga River pH: 7.37 BOD:42mg/L COD:144mg/L TSS: 78mg/L
Total 123.9 7.2.4 Munger Municipal Corporation:
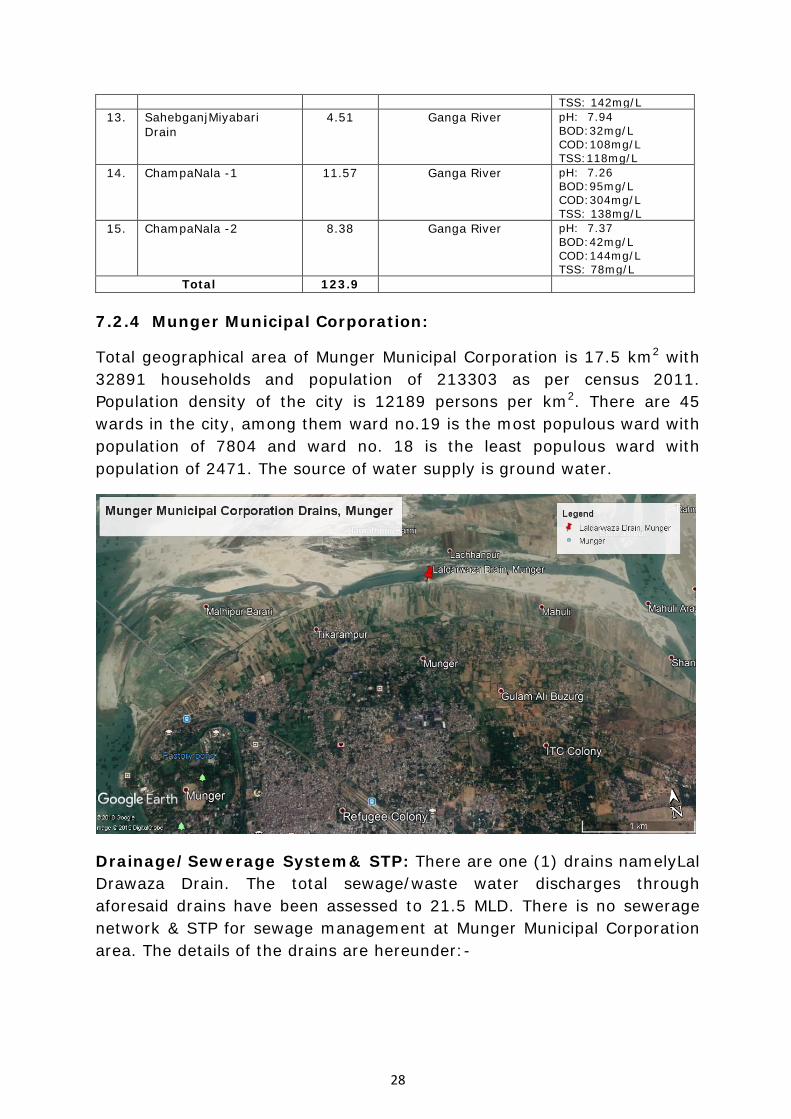
Total geographical area of Munger Municipal Corporation is 17.5 km2 with 32891 households and population of 213303 as per census 2011. Population density of the city is 12189 persons per km2. There are 45 wards in the city, among them ward no.19 is the most populous ward with population of 7804 and ward no. 18 is the least populous ward with population of 2471. The source of water supply is ground water.
Drainage/Sewerage System& STP: There are one (1) drains namelyLal Drawaza Drain. The total sewage/waste water discharges through aforesaid drains have been assessed to 21.5 MLD. There is no sewerage network & STP for sewage management at Munger Municipal Corporation area. The details of the drains are hereunder:-

29
Munger Nagar Nigam, Munger:
Sl. No.
Name of drain Average flow
(MLD)
Recipient Sewage/waste water Quality
1. Lal Drawaza Drain 21.5 Meeting to Ganga pH: 7.73 BOD: 14 mg/L COD: 60 mg/L TSS: 32 mg/L
Total 21.5
7.2.5 Chhapra Municipal Corporation:
Total geographical area of Chhapra Municipal Corporation is 16.96km2 with 32585 households and population of 202,352as per census 2011. Population density of the city is 11931 persons per km2. There are 45 wards in the city, among them Chhapra Ward No 28 is the most populous ward with population of 7552 and Chhapra Ward No 22 is the least populous ward with population of 2285. The source of water supply is ground water.
Drainage Map of Chapra Municipal Corporation
Drainage/Sewerage System& STP: There is only one (1) drain namely KhanuaNala, discharges sewage/domestic waste water into Ghaghara river and many low lying water logged area was also identified which receives sewage water of adjacent households. The total sewage/waste water discharge through aforesaid drain has been assessed to 4.87 MLD. Presently, there is no sewerage network and STP for sewage management at Chapra Municipal Corporation area. DPR is under preparation as reported by HD&HD, Govt. of Bihar. The details of the drains are hereunder:-

30
Chhapra Municipal Corporation: Sl. No.
Name of drain Average flow
(MLD)
Recipient Sewage/waste water Quality
1. Khanua Nala 4.87 Ghaghara River pH:7.57 BOD:32 mg/L COD:120 mg/L TSS:68 mg/L
Total 4.87
7.2.6 Bakhtiyarpur Nagar Parisad, Patna:Total geographical area of Bakhtiyarpur Nagar Parisad is 13.18 km2 with 7786 households and population of 47897 as per census 2011. Population density of the city is 3634 persons per km2. There are 20 wards in the city, among them Ward no. – 19 is the most populous ward with population of 4509 and Ward no. - 02 is the least populous ward with population of 1267.The source of water supply is ground water.
Drainage/Sewerage System& STP: There are one (1) drains namely Raghopur-Dagar Drain.The total sewage/waste water discharges through aforesaid drains have been assessed to 4.3 MLD. There is no sewerage network & STP for sewage management at Bakhtiyarpur NagarParisad area. The details of the drains are hereunder:-
7.2.7 Barh Nagar Parisad, Patna:
Total geographical area of Barh Nagar Parisad is 4.5 km2 with 9310 households and population of 61470 as per census 2011. Population density of the city is 13660 persons per km2. There are 27 wards in the city, among them Ward no. - 03is the most populous ward with population of 5306 and Ward no. - 21 is the least populous ward with population of 1093. The source of water supply is ground water.
Sl. No.
Name of drain Average flow
(MLD)
Recipient Sewage/waste water Quality
1. Raghopur-Dagar Drain 4.3 Meeting to Ganga pH: 5.58 BOD: 36 mg/L COD: 132 mg/L TSS: 62 mg/L
Total 4.3
31
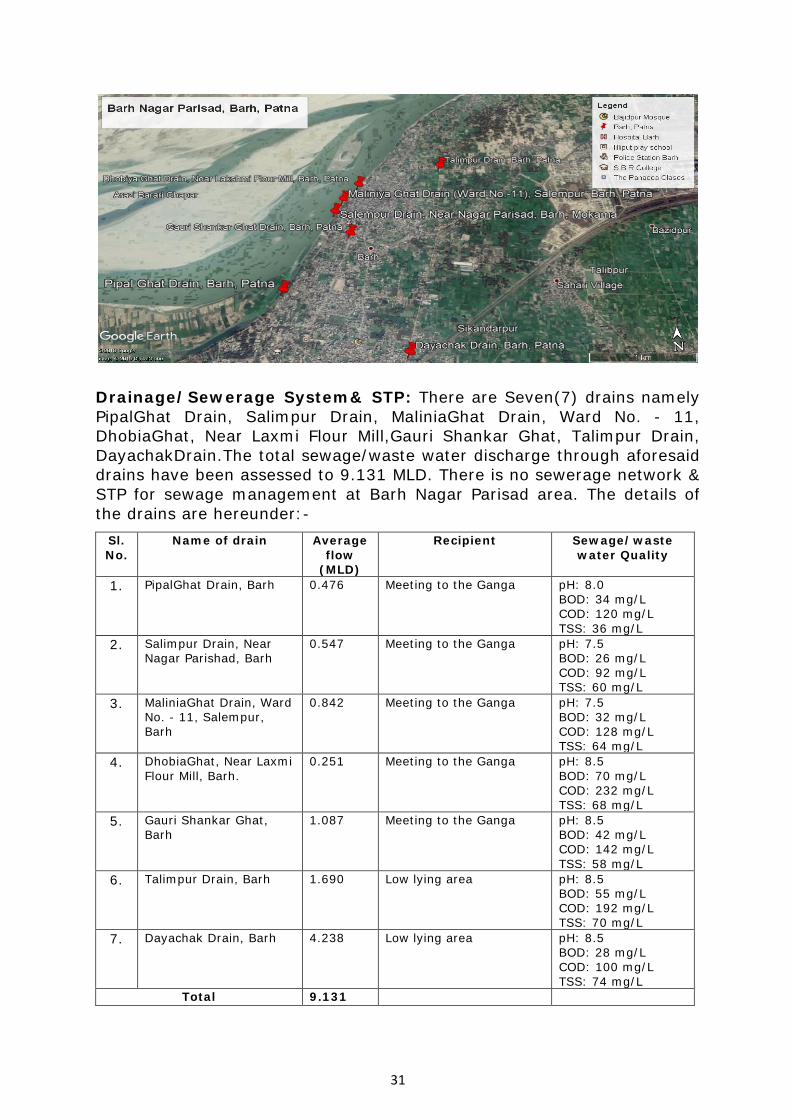
Drainage/Sewerage System& STP: There are Seven(7) drains namely PipalGhat Drain, Salimpur Drain, MaliniaGhat Drain, Ward No. - 11, DhobiaGhat, Near Laxmi Flour Mill,Gauri Shankar Ghat, Talimpur Drain, DayachakDrain.The total sewage/waste water discharge through aforesaid drains have been assessed to 9.131 MLD. There is no sewerage network & STP for sewage management at Barh Nagar Parisad area. The details of the drains are hereunder:-
Sl. No.
Name of drain Average flow
(MLD)
Recipient Sewage/waste water Quality
1. PipalGhat Drain, Barh 0.476 Meeting to the Ganga pH: 8.0 BOD: 34 mg/L COD: 120 mg/L TSS: 36 mg/L
2. Salimpur Drain, Near Nagar Parishad, Barh
0.547 Meeting to the Ganga pH: 7.5 BOD: 26 mg/L COD: 92 mg/L TSS: 60 mg/L
3. MaliniaGhat Drain, Ward No. - 11, Salempur, Barh
0.842 Meeting to the Ganga pH: 7.5 BOD: 32 mg/L COD: 128 mg/L TSS: 64 mg/L
4. DhobiaGhat, Near Laxmi Flour Mill, Barh.
0.251 Meeting to the Ganga pH: 8.5 BOD: 70 mg/L COD: 232 mg/L TSS: 68 mg/L
5. Gauri Shankar Ghat, Barh
1.087 Meeting to the Ganga pH: 8.5 BOD: 42 mg/L COD: 142 mg/L TSS: 58 mg/L
6. Talimpur Drain, Barh 1.690 Low lying area pH: 8.5 BOD: 55 mg/L COD: 192 mg/L TSS: 70 mg/L
7. Dayachak Drain, Barh 4.238 Low lying area pH: 8.5 BOD: 28 mg/L COD: 100 mg/L TSS: 74 mg/L
Total 9.131
32
7.2.8 Danapur Nagar Parisad,Patna: Total geographical area of Danapur Nagar Parisad is 16.41 km2 with 27486 households and population of 182429 as per census 2011. Population density of the city is 11117 persons per km2. There are 40 wards in the city, among them ward no. –07 is the most populous ward with population of 10000 and ward no. - 09 is the least populous ward with population of 1559. The source of water supply is ground water.
Drainage/Sewerage System& STP: There are one (1) drains namelyDanapur Cant. Drain. The total sewage/waste water discharges through aforesaid drains have been assessed to 8.16 MLD. There is no sewerage network & STP for sewage management at Dananpur Nagar Parisad area. The details of the drains are hereunder:-
Sl. No.
Name of drain Average flow
(MLD)
Recipient Sewage/waste water Quality
1. Danapur Cant. Drain 8.16 Meeting to Ganga River pH: 7.66 BOD: 24 mg/L COD: 84 mg/L TSS: 62 mg/L
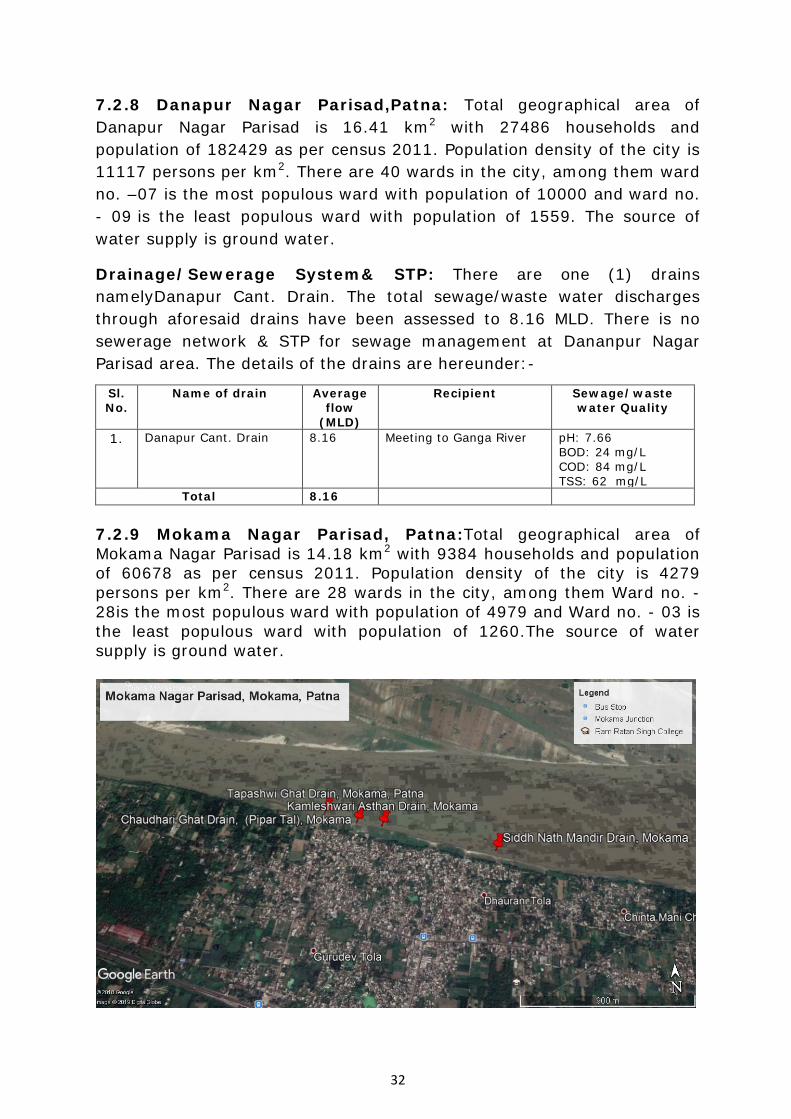
Total 8.16 7.2.9 Mokama Nagar Parisad, Patna:Total geographical area of Mokama Nagar Parisad is 14.18 km2 with 9384 households and population of 60678 as per census 2011. Population density of the city is 4279 persons per km2. There are 28 wards in the city, among them Ward no. - 28is the most populous ward with population of 4979 and Ward no. - 03 is the least populous ward with population of 1260.The source of water supply is ground water.

33
Drainage/Sewerage System& STP: There are Four(4) drains namely TapashwaiGhat, Chaudhary Ghat Drain, KamleshwariAsthan Drain &SiddhnathMandir.The total sewage/waste water discharge through aforesaid drains have been assessed to 7.174 MLD. There is no sewerage network & STP for sewage management at Mokama Nagar Parisad area. The details of the drains are hereunder:-
Sl. No.
Name of drain Average flow
(MLD)
Recipient Sewage/waste water Quality
1. TapashwaiGhat, Mokama
6.024 Meeting to Ganga pH: 8.5 BOD: 20 mg/L COD: 72 mg/L TSS: 26 mg/L
2. Chaudhary Ghat, Pipal Tal, Mokama
0.171 Meeting to Ganga pH: 7.5 BOD: 42 mg/L COD: 148 mg/L TSS: 72 mg/L
3. KamleshwariAsthan Drain, Mokama
0.962 Meeting to Ganga pH: 7.5 BOD: 14 mg/L COD: 64 mg/L TSS: 48 mg/L
4. SiddhnathMandir, Mokama
0.017 Meeting to Ganga pH: 8.5 BOD: 18 mg/L COD: 64 mg/L TSS: 36 mg/L
Total 7.174
7.2.10 Sultanganj Nagar Parisad, Bhagalpur: Total geographical area of SultanganjNagarParisad is 12.29 km2 with 9410 households and population of 52892 as per census 2011. Population density of the city is 4304 persons per km2. There are 25 wards in the city, among them ward no.-16 is the most populous ward with population of 3366 and ward no.-03 is the least populous ward with population of 1167. The source of water supply is ground water.

34
Drainage/Sewerage System& STP: There are one (1) drains namely Masjid ghat Drain. The total sewage/waste water discharges through aforesaid drains have been assessed to 1.7 MLD. There is no sewerage network & STP for sewage management at SultanganjNagarParisad area. The details of the drains are hereunder:-
Sl. No.
Name of drain Average flow
(MLD)
Recipient Sewage/waste water Quality
1. Masjid ghat Drain 1.7 Meeting to Ganga pH: 7.76 BOD: 14 mg/L COD: 64 mg/L TSS: 34 mg/L
Total 1.7
7.2.11 Barahiya Nagar Panchayat, Lakhisarai:
Total geographical area of Behea Nagar Panchayat is 27 km2 with 7798 households and population of 43032 as per census 2011. There are 24 wards in the city, among them 19 is the most populous ward with population of about 2881 and 15 is the least populous ward with population of 799.The Population density of the city is 1621 persons per km2. The source of water supply is ground water.
Drainage/Sewerage System& STP: There are three(3) drains namely Gangtri drain, Railway Khanra drain and BodhnagarDobha Pull drain. The aforesaid drains disperses in low lying area. The total sewage/waste water discharge through aforesaid drains have been assessed to 5.668 MLD. There is no sewerage network & STP for sewage management at Barahiya Nagar Panchayatarea. The details of the drains are hereunder:-

35
Sl. No.
Name of drain Average flow
(MLD)
Recipient Sewage/waste water Quality
1. Gangtri drain 1.426 Drain disperses in low lying area
pH: 6.52 BOD: 70 mg/L COD: 232 mg/L TSS: 116mg/L
2. Railway Khanra drain 3.863 Drain disperses in low lying area
pH: 6.66 BOD: 48 mg/L COD: 168 mg/L TSS: 108 mg/L
3. BodhnagarDobha Pull drain
0.379 Drain disperses in low lying area
pH: 6.80 BOD: 32 mg/L COD: 100 mg/L TSS: 78 mg/L
Total 5.668
7.2.12 Dighwara Nagar Panchayat Saran: Total geographical area of Dighwara Nagar Panchayat is 13.27km2 with 6169 households and population of 32741 as per census 2011. Population density of the city is 2467 persons per km2. There are 18 wards in the city, among them ward no. –05 is the most populous ward with population of 3705 and ward no.10 is the least populous ward with population of 970. The source of water supply is ground water.
Drainage/Sewerage System& STP: There are two (2) drains namely BeerpurBhual NH-19 Drain and Shankarpur Road Nala.The aforesaidDrains disperse in Lowlying area.The total sewage/waste water discharges through aforesaid drains have been assessed to 1.57 MLD. There is no sewerage network & STP for sewage management at Dighwara Nagar Panchayatarea. The details of the drains are hereunder:-
Sl. No.
Name of drain Average flow
(MLD)
Recipient Sewage/waste water Quality
1. BeerpurBhual NH-19 Drain, Dighwara
1.15 Ganga River pH: 6.75 BOD: 80 mg/L COD: 276 mg/L TSS: 132mg/L
2. Shankarpur Road Nala, Ward-15, Dighwara
0.42 Ganga River pH: 7.19 BOD:60 mg/L COD:196 mg/L TSS:102 mg/L
Total 1.57 7.2.13 Maner Nagar Panchayat, Patna:Total geographical area of Maner Nagar Panchayat is 12.00 km2 with 6562 households and population of 40068 as per census 2011. Population density of the city is 3339 persons per km2. There are 19 wards in the city, among them Ward

36
no. – 13 is the most populous ward with population of 3351 and Ward no. - 06 is the least populous ward with population of 1286.The source of water supply is ground water.\
Drainage/Sewerage System& STP: There are Three(3) drains namely Maner Bazar Drain, Ram Nagina Singh College Drain, Ram GhatDrain.The total sewage/waste water discharge through aforesaid drains have been assessed to 13.5 MLD. There is no sewerage network & STP for sewage management at Maner Nagar Panchayatarea. The details of the drains are hereunder:-
Sl. No.
Name of drain Average flow
(MLD)
Recipient Sewage/waste water Quality
1. Maner Bazar Drain, Infront of Machhli Market, Maner, Patna
3.55 Ganga River pH: 7.26 BOD: 140 mg/L COD: 496 mg/L TSS: 52 mg/L
2. Ram Nagina Singh College Drain, Maner, Patna
7.59 Sone River Stream/Canal-> Ganga River
pH: 7.67 BOD: 46 mg/L COD: 160 mg/L TSS: 88 mg/L
3 Ram Ghat Drain, Maner, Patna
2.36 Sone River Stream/Canal-> Ganga River
pH: 7.89 BOD: 145 mg/L COD: 472 mg/L TSS: 68 mg/L
Total 13.5
37
7.2.14 Status of Sewerage Network & STP and Action Plan for Sewage Management in Polluted River Stretch along the Ganga
Sl. No.
Name of the ULBs
Action Plan
1. Patna Municipal Corporation, Patna
PMC, Patna (Area: 100 Sq km, Population: 16,84,222- as per Census, 2011, No. of Wards: 75, Length:25 Km along the Ganga river, Water supply source: Ground water) is located on the south bank of river Ganga. The public water supply systems consist of tube wells, pumping water directly to distribution mains on an intermittent basis, across the entire town in addition with private tube wells. Drainage/Sewerage System & STP: The sewerage system has not been developed presently. The storm water drainages are carrier of sewage and mostly flow from south to north and fall into river Ganga. There is a proposal to develop proper sewerage system in the city and then entire sewage will be diverted to STPs through respective network for treatment. Presently, city has four STPs of 109 MLD capacity (Beur-35 MLD, Saidpur-45 MLD, Pahari-25 MLD and Karmalichak-04 MLD). These are under-utilized and treating all together only 64MLD of sewage. This is due to the lesser inflow of sewage from sewerage network due to improper repair and maintenance resulting in silting, dumping of garbage/ solid waste debris, damage pipes & main holes. It has been assessed that Patna city requires STPs of around 350 MLD (Beur-43 MLD, Saidpur-60 MLD, Pahari-60 MLD, Karmalichak-37 MLD, Digha-100 MLD & Kankarbagh-50 MLD) capacities. The proposed Patna sewerage system has been divided into six different Zones, such as Digha, Beur, Kankarbagh, Saidpur, Pahari and Karmalichak. After implementation of sewerage schemes of these zones entire 75 wards of PMC will be covered. The sewerage scheme of Beur, Saidpur, Pahari and Karmalichak will be completed by 2020 whrereas Digha & Karmalichak will be completed by 2021. Present status of project is as follows:-

38
Proposed Sewerage System and STPs at Patna
Sl. no.
Location of STPs
Installed capacity (MLD)
Proposal for
expan-sion
Cost of Project
Sewerage Network
(km)
Cost of Project
Status
a. Beur, Patna
35 MLD 43 MLD 68.16 180.00 225.77 1. STP & Sewerage Network: Work is in progress. Project will be completed by 2020.
b. Saidpur, Patna
45 MLD 60 MLD 184.93 177.45 268.63 1. STP & Sewerage Network: Work is in progress. Project will be completed by 2020.
c. Pahari, Patna
25MLD 60 MLD 191.62 88.00 184.86 1. STP & Sewerage Network: Agreement done on 09.05.2018. Work is in progress. Project will be completed by 2020.
116.00 356.37
d. karmali-chak, Patna
04 MLD 37 MLD 77.04 96.54 277.42 1. STP: Work is in progress. Project will be completed by 2020.
2. Sewerage Network: Agreement done on 11.05.2018. Work is in progress. Project will be completed by 2020.
Total 109MLD 200MLD e.
Digha, Patna
- 74 MLD - 291.00 619.00 for both
work
1. STP & Sewerage Network: Tender received on 09.10.2018. Project will be completed by 2021.
f. Kankar-bagh, Patna
- 34 MLD - 155.2 356.8 for both
work
STP & Sewerage Network: Tender received on 09.10.2018. Project will be completed by 2021.

39
3. Municipal Corpora-tion, Chapra
Municipal Corporation, Chapra (Area: 16.9 Sq KM, Population: 201597- as per Census, 2011, No. of Wards: 44, Length: 10 Km along the Ganga river, Water supply source: Ground water) is located on the north bank of Ghaghara-Ganga junction.
Drainage/Sewerage System& STP: There are 7 drainage zones. Out of these 7 drainage basins, the runoff from the catchment area of 2 zone flows into the river Ghaghara. The runoff from 5 remaining zones flows into the river Ghaghara with channel gates and pumping arrangements of sullage to treatment work at Gheghta village. Some of the areas are not connected with drainage system. There is no proper sewage system. The sewage goes to low lying area and water bodies. A scheme comprising I&D of these nala with STP of 32 MLD capacity has been prepared with a view to treat the sewage following through the nalas. The DPR has been submitted for approval on 21.08.2018. Work will be completed by August, 2020. The details of drains and their outfall points are hereunder:-
Drain
no.
U/S Points D/S points Length
(Km)
Direction of flow
DA-1 Gudri Mod Chaur 1.80 From Gudri Mod towards east along NH-19 till Jail and thereupon North from there vai Railway Culvert to Chaur
DA-2 South of Hanuman Madnir
DA-1 0.70 From South of Hanuman Mandir towards North, discharging to DA-1
DA-3 Town Post Office
DA-1 0.90 From town post officer towards north and discharging to DA-1
DA-4 Nehru Stadium
Chaur 0.67 Flowing East and then North towards Municipality Mod, via Railway Culvert to Chaur
DA-5 Kali Bari Balika
DA-4 0.95 Flowing South and connecting to DA-4
Sl. No.
Name of the ULBs
Action Plan
2. Nagar Parishad, Buxar
Nagar Parishad, Buxar (Area: 8.7Sq KM, Population: 102861- as per Census, 2011, No. of Wards: 34, Length:12km along the Ganga river, Water supply source: Ground water) is located on the south bank of river Ganga. Drainage/Sewerage System& STP: There are 5 drains namely Tadka Nala (Covering part areas of ward no.26, 27 &28), Sewak Nala (Covering part areas of ward no.27 & 28), Kawaldaha Nala (Covering part areas of ward no. 09, 10 & 11), Hosptial Nala (Covering part areas of ward no. 18, 19 & 23), Ambedkar Chauwk to DM Office Nala (Covering part areas of ward no. 11). Presently, sewage of towns flow to Ganga river. There is proposal ofsewerage network of 95.5 Km length and STP of 16 MLD capacity. The cost of the project is 74.95 Cr. Due to insignificant progress work order in process of termination.

40
Vidyalaya
DA-6 Salempur Ghagra 0.90 From Salempur towards south till canal (Khanua Nala)
DA-7 Salempur Low lying area near Rly. St.
0.95 From Salempur towards north up-to low lying water body (Khanua Nala)
DA-8 Gandhi Chowk
Low lying water body near Nanda LalTola
0.95 From Gandhi Chowk towards north east.
DA-9 Gandhi Chowk
Low lying area near Bhikari Chowk
1.70 East of Gandhi Chowk along NH-19
Length of major drains 9.52
Proposed STP:8 MLD capacity. Approval of NMCG & DPR is awaited.
4. Nagar Parishad, Danapur. Nizamat
Nagar Parishad, Danapur Nizamat (Area: 11.63Sq KM, Population: 18,22,41 as per Census 2011, No. of Wards: 40, Length: 6 Km along the Ganga river, Water supply source: Ground water) is located on the south bank of river Ganga.
Drainage/Sewerage System& STP: There are 4 drains namely Nahar (Patna Canal), Dev Nala (Court Drain), Shahpur Nala & Chitnava Nala. The Patna canal locks at Ganga river. Dev Nala is a major storm water drain passing through core area of the town and cantonment area and joins the Ganga river at cantonment area. At present there is no sewerage network and STP. A scheme comprising I&D of these nala with STP of 10 MLD capacity has been prepared with a view to treat the sewage following through the nalas. The DPR has been submitted for approval on 23.08.2018. Work will be completed by September, 2020.
5. Nagar Pancha-yat, Sonepur
Nagar Panchayat, Sonepur (Area: 8.27Sq KM, Population: 37736 as per Census, 2011, No. of Wards: 21, Length: 9 Km along the Ganga river, Water supply source: Ground water) is located on the bank of river Gandak (East) and River Mahi (South).
Drainage/Sewerage System& STP: Total existing channel 11 of 9.22Km length. Discharge-193m3/hour (4.63 MLD). Presently, there is no sewerage system. All the discharge outlets go to low lying area and water bodies. The details of drains and their outfall points are hereunder:-
SN
.
Dra
inag
e C
han
nel
s
Len
gth
Km
Cat
chm
ent
area
(W
ard
)
flow
Ou
tfal
l p
oin
ts
DA-1 Rabindranath Tagore School
4.00 3 14.44-18.81 Mahi river
DA-2 Ward boundary 3-4 0.60 3 &4 20.00-22.11 -Do-

41
DA-3 Railway Colony ward-5 0.16 5 12.80-16.91 Agricultural Land
DA-4 Grave Yard, ward 0.70 18 2.23 Mahi river
DA-5 Meena Bazar 0.20 18 39.26-42.46 -Do-
DA-6 Rail Quarter 0.50 5 51.76-57.15 Low land
DA-7 Bihar Tourism 0.50 12 2.41-4.23 -Do-
DA-8 PrathamikVidyalaya 0.10 16 22.11-25.97 -Do-
DA-9 S.D. High School 0.30 14 5.57-7.37 Low land in ward 14
DA-10 NH Adjacent (Only alive in Maunsoon)
2.0 6,11 & 10
NA Canal
DA-11 Agricultural Land 0.16 2 7.54-10.25 Low agricultural land
Proposed STP & sewerage system: A scheme comprising I&D of these nala with STP of 3.5 MLD capacity has been prepared with a view to treat the sewage following through the nalas. Tender floalted on 15.10.2018. Work will be completed by April, 2020.
6. Nagar Panchayat, Dighwara
Nagar Panchayat, Dighwara (Area: 13.27Sq KM, Population: 32739 as per Census, 2011, No. of Wards: 18, Length: 3.3 Km along the Ganga river, Water supply source: Ground water) is located on the bank of river Ganga(South).
Drainage/Sewerage System& STP: Presently, there is no sewerage system. All the discharge outlets go to low lying area and water bodies or Jheel in the southern fringe of the town and ultimately to river Ganga. The details of drains and their outfall points are hereunder:-
S.N
.
Dra
inag
e C
han
nel
s
Len
gth
Km
Cat
chm
ent
area
/war
d
Mea
sure
d
dis
char
ge/
flow
O
utf
all
poi
nts
DA-1 BagahingTola 0.40 1,2 5.75-11.85 Agriculture lan
DA-2 Marchow Baba Mandir 0.35 3,4 8.83-15.07 -Do-
DA-3 Ucromit Madhya Vidylaya
0.65 10,11 & 15 12.78-20.50 -Do-
DA-4 Post office Road 1.50 14,16 9.34-20.13 Jheel
DA-5 Market Area 0.75 7,8 &9 9.12-15.56 low laying area
DA-6 Rajakia Primary School 0.75 8,9 8.98-14.43 Agriculture lan
DA-7 Barbanna 0.42 18 8.86-15.31 Jheel
DA-8 Madhya Vidyalay, Basadpur
0.70 17 6.96-11.07 Low laying are
Proposed STP & sewerage system: A scheme (Approx. 39.04 Cr.) comprising I&D of these nala with STP of 5.4 MLD capacity has been

42
prepared with a view to treat the sewage following through the nalas. The DPR has been submitted for approval on 06.08.2018. Work will be completed by November, 2020.
8. Mokama Municipal Council
Mokama Municipal Council (Area: 14.18Sq KM, Population: 60678 as per Census, 2011, No. of Wards: 28, Length: 7 Km along the Ganga river, Water supply source: Ground water) is located on the bank of river Ganga.
Drainage/Sewerage System& STP: There are 3 out falls drains. At present, Mokama town has no sewerage system. All the sewages outlet into the drain or ultimately to the low lying area and water bodies. It is proposed to intercept the outfall and divert into STP site for further treatment using gravity and pumping station.
The proposed STP & sewerage system: The proposed sewerage system & STP will be constructed near Tapeshwi Sthan, ward no.1 of 7.83 (8) MLD capacity on Sequential Batch Reactor Technology. The project (Rs.53.18crore) has been sanctioned by the NMCG. Tender under process. Work will completed by June, 2020.
9. Bakhtiyapur Nagar Parishad
Bakhtiyapur Nagar Parishad (Area: 13.18Sq KM, Population: 47897 as per Census, 2011, No. of Wards: 27, Length: 3.5 Km along the Ganga river, Water supply source: Ground water) is located on the southern bank of river Ganga.
Drainage/Sewerage System & STP:There are 5 major drains which generate approx. 5.9(6) MLD. At present, Bakhtiyapur town has no sewerage system & STP. All the sewages outlet into the drain or ultimately to the low lying area and water bodies. It is proposed to intercept the outfall and divert into STP site for further treatment. The drains and their discharge points are hereunder :-
Sl. No. Name of the drains Discharge points
1 Station Road Nala Railway Land
2 Station Road to Gumti Par Nala Railway Land
3 ChouhanJi Road Nala Ganga River
7. Nagar Panchayat, Maner
Nagar Panchayat, Maner (Area: 6.5Sq KM, Population: 40068 as per Census 2011, No. of Wards: 19, Water supply source: Ground water) is located at the distance of 7 Km from Ganga.
Drainage/Sewerage System& STP: Presently, there is no sewerage system. All the discharge go to low lying area and water bodies.
The proposed STP & sewerage system: A scheme comprising I&D of these nala with STP has been prepared with a view to treat the sewage following through the nalas. The DPR has been submitted for approval on 02.08.2018. Work will be completed by October, 2020.

43
4 RawaichDagarNala Railway Land
5 purana by-pass Nala Railway Land
The proposed STP & sewerage system:The proposed sewerage system & STP of 4 MLD capacity will be constructed near Dhoba River in ward no.12 near Baldhan Colony. The project DPR has been submitted to NMCG for approval on 24.08.2018. Work will completed by August, 2020.
10. Barh Municipal Council
Barh Municipal Council (Area: 4.5Sq KM, Population: 61470 as per Census, 2011, No. of Wards: 27, Length: 4.5 Km along the Ganga river, Water supply source: Ground water) is located on the bank of river Ganga.
Drainage/Sewerage System& STP: At present, Barh town has no sewerage system. All the sewage outlet into the drain or ultimately to the low lying area and water bodies. It is proposed to intercept the outfall and divert into STP site for further treatment using gravity and pumping station.
The proposed STP & sewerage system: The proposed sewerage system & STP will be constructed near Gas Godown Road of 10.6 (11) MLD capacity on Sequential Batch Reactor Technology.Agreement done on 22.10.2018. Total cost of project is 53.9 Cr. has been approved for the aforesaid scheme Work will be completed by June, 2020.
11. Munger Municipal Council, Munger
Munger Municipal Council, Munger (Area: 17.5Sq KM, Population: 213301 as per Census, 2011, No. of Wards: 45, Length: 5 Km along the Ganga river, Water supply source: Ground water) is located on the southern bank of river Ganga.
Drainage/Sewerage System & STP: There are mainly 3 major drains falling into river Ganga directly out of which the Chandi Sthan drain discharge the waste water generated by the households of approximately 20 wards out of 45 wards. Rest of 25 ward's waste water is discharged by the Chuaa Baag main drain and Sojhi Ghaat outfall drain. At present, there no STP in Munger.
The proposed STP & sewerage system:A revised estimate of the scheme amounting Rs. 294.02 Cr. has been approved for STP of 30 MLD capacity and sewerage network of 143 Km. Work will be completed by September, 2020.

44
12. Sultanganj Municipal Council,
Sultanganj
Sultanganj Municipal Council, Sultanganj (Area: 12.29Sq KM, Population: 52892 as per Census, 2011, No. of Wards: 25, Length: 4 Km along the Ganga river, Water supply source: Ground water) is located on the southern bank of river Ganga.
Drainage/Sewerage System & STP: There are mainly 5 drains (6.40 MLD) namely Krishna GarhNala (1.19 MLD), Dhwja Gali Nala (0.72 MLD), Bishari sthanGopal Road Nala (0.84 MLD), Near Railway Station (1.30 MLD) and AjgaibnathNala (2.35 MLD). Presently, there is no sewerage system. All the sewages outlet into the drain or ultimately to the low lying area and water bodies.
The proposed STP & sewerage system: There is proposal of construction of STP of 10 MLD capacity based on SBR Technology with sewerage network along with construction of sewerage pumping stations. The project (Rs. 60.22 crore) has been sanctioned by NMCG. Agreement done on 14.09.2018. Work will completed by Decemer., 2020.
13. Bhagalpur Municipal
Corporation, Bhagalpur
Bhagalpur Municipal Corporation, Bhagalpur. (Area: 31.17Sq KM, Population: 400148 as per Census, 2011, No. of Wards: 51, Length: 23 Km along the Ganga river, Water supply source: Ganga & Ground water) is located on the southern bank of river Ganga.
Ganga River (17.27 MLD) and Ground water (11.08 MLD) from 51 nos. of tube wells are the source of water supply. Present, demand is 60 MLD. The water supply is managed by PHED, BRJP and BMC.
Drainage/Sewerage System& STP: There are mainly 15 outfall drains in Bhagalpur town which discharge waste water as well as storm water into the river Ganga from West to East. Presently, there is no sewerage system. All the sewages outlet into the drain or ultimately to the low lying area and water bodies.
The proposed STP & sewerage system:A scheme comprising I&D of these nala with STP of 65 MLD capacity has been prepared with a view to treat the sewage following through the nalas. Tender floated. Work will be completed by December, 2020.
14. Nagar Panchayat, Teghara, Begusarai
Nagar Panchayat, Teghara, Begusarai (Area: 26.88Sq KM, Population: 58477 as per Census, 2011, No. of Wards: 25, Length: 3.5 Km along the Ganga river, Water supply source:Ground water) is located on the northern bank of river Ganga.
Drainage/Sewerage System& STP: Presently, there is no sewerage system. Drain the along the station road is not connected to any river. The waste water is discharged to adjacent area of NH28.
The proposed STP & sewerage system:The project DPR for interception and diversion scheme with STP has been submitted to NMCG for approval on 01.08.2018. Works will be completed by September, 2020.

45
15. Nagar Panchayat,
Fatuha, Patna
Nagar Panchayat, Fatuha, Patna (Area: 7.9Sq KM, Population: 50961 as per Census, 2011, No. of Wards: 27, Length: 4 Km along the Ganga river, Water supply source: Ground water) is located on the bank of river Ganga.
Drainage/Sewerage System& STP: There are 5 drains namely Shamshan Ghat to Punpun River covering Ward no. 01, 03, 04 (1.9 MLD); Maharani Ghat to Punpun River covering Ward no. 05, 06, 07, 08 (6.0 MLD); MahraniGhat to Maksudpur main road drain covering ward no. 12 & 13 to 25(1.7 MLD); Chauraha to station road covering ward no.13 & 26(1.55) and Shisamil drain covering ward no.27. Presently, there is no sewerage system and STP.
The proposed STP & sewerage system:The project DPR for interception and diversion scheme with STP has been submitted to NMCG for approval on 23.08.2018. Work will completed by March, 2020.
16. Nagar Panchayat, Barahiya, Lakhisarai
Nagar Panchayat, Barahiya, Lakhisarai (Area: 10.0Sq KM, Population: 43032 as per Census, 2011, No. of Wards: 24, Length: 4 Km along the Ganga river, Water supply source: Ground water) is located on the bank of river Ganga.
Drainage/Sewerage System& STP: There are 5 drains. Presently, there is no sewerage system and STP. All the sewage outlet into the drain or ultimately to the low lying area and water bodies. The details of drains and their recipient are hereunder:-
Sl. No. Name of drain Flow (MLD) Recipient
1 Krishna ChowkNala 0.48 Ganga River
2 Baba DaniMohallaNala 0.52 Ganga River
3 Haha Bangla Tal Nala 1.68 Railway Land
4 Railway Station Nala 0.33 Railway Land
5 Baha Path Nala 2.46 Tal Area
The proposed STP & sewerage system: The project DPR for interception and diversion scheme with STP of 5.4 MLD has been submitted to NMCG for approval 18.10.2018. Work will be completed by December, 2020.
17. Nagar Panchayat, Kahalgaon, Bhagalpur
Nagar Panchayat, Kahalgaon, Bhagalpur (Area: 6.3Sq KM, Population: 33700 as per Census, 2011, No. of Wards: 17, Length: 3 Km along the Ganga river, Water supply source: Ground water) is located on the southern bank of river Ganga.
Drainage/Sewerage System & STP: Presently, there is no sewerage system. All the sewage outlet into the drain or ultimately to the low laying area and water bodies.

46
The proposed STP & sewerage system:A scheme comprising I&D of these nala with STP has been prepared with a view to treat the sewage following through the nalas. The DPR has been submitted for approval on 21.08.2018. Work will be completed by October, 2020.
18. Nagar Panchayat, Manihari
Nagar Panchayat, Manihari (Area: 9400.66Sqm, Population: 26629 as per Census, 2011, No. of Wards: 15, Length: 4 Km along the Ganga river, Water supply source: Ground water) is located on the bank of river Ganga.
Drainage/Sewerage System & STP: There are 5 drains (3 MLD) namely from Bus stand to Railway gumti, from railway gumti to nagar panchayat karyalay, from Rudal Paswan's house to middle school in ward no-2 and from ward no-14 to house of Pappu. Presently, there is no sewerage system and STP. All the sewage outlet into the drain ultimately to the low lying area and water bodies.
The proposed STP & sewerage system:A scheme comprising I&D of these nala with STP has been prepared with a view to treat the sewage following through the nalas. The DPR has been submitted for approval on 06.08.2018. Work will be completed by November, 2020.
19. Nagar Parishad, Jamalpur
Nagar Parishad, Jamalpur (Area: 10.7Sq Km, Population: 105434 as per Census 2011, No. of Wards: 36, Town: 8 Km away from the Ganga river, Water supply source: Ground water) is located on the bank of river Ganga.
Drainage/Sewerage System STP: The total drainage network in Jamalpur municipal area cover 114 Km (pucca- 84Km, Kutcha-30km) only on one side of roads. The natural drainage of the town is from east to west. Drains discharge storm water into nallahs located in the periphery of the town. The storm water drains carry waste water from households as well. The city is 8 km away from the main course of River Ganga. Therefore, no drains fall directly to the river. However, 5 drains of the town fall to the Dakra nallah which eventually meets the River Ganga. Presently, there is no STP.
The proposed STP & sewerage system:A scheme comprising I&D of these nala with STP has been prepared with a view to treat the sewage following through the nalas. The DPR has been submitted for approval . Work will be completed by August, 2020.
20. Nagar Parishad, Khagaria
General: Nagar Parishad, Khagaria (Area: 6.5Sq Km, Population: 49373 as per Census, 2011, No. of Wards: 26, Town: 22km away from the Ganga river, Water supply source: Ground water) is located on the bank of river Ganga. Drainage/Sewerage System: All waste water from the town discharge to the Budhi Gandak River through the main drain along the Maal Godam Road. Presently, there is no STP. The proposed STP & sewerage system: A scheme comprising I&D of these nala with STP of 32 MLD capacity has been prepared with a view to treat the sewage following through the nalas. The DPR has been submitted for approval on 06.08.2018. Work will be completed by August, 2020.

47
8. Industrial Pollution along the Polluted River Stretch
There are 04 molasses based distillery namely M/s Harinagar Sugar Mills Ltd., (Distillery Division), Harinagar, Dist.-West Champaran; M/s New Swadeshi Sugar Mills, (Distillery Division), Narkatiaganj, Dist.- West Champaran; M/s HPCL Bio-Fuels Ltd. (Distillery Division), Lauria, Dist.-West Champaran and M/s HPCL Bio-Fuels Ltd. (Distillery Division), Sugauli, Dist.- East Champaran, 06 sugar mills namely M/s Harinagar Sugar Mills Ltd., Harinagar, Dist.-West Champaran; M/s New Swadeshi Sugar Mills, Narkatiaganj, Dist.-West Champaran; M/s HPCL Bio-Fuels Ltd. (Sugar Division), Laurya, Dist.-West Champaran and M/s HPCL Bio-Fuels Ltd. (Sugar Division), Sugauli, Dist.-East Champaran; M/s Tirupati Sugar Mills, Bagha, Dist.-West Champaran and M/s Manjhaulia Sugar Industries Pvt. Ltd., Manjhaulia, Dist.-West Champaran. The aforesaid industries having potential of causing pollution to the rivers located nearby the industry under the heads of Grossly Polluting Industries (GPIs). All aforesaid industries have installed Effluent Treatment Plant (ETP). Their details are hereunder:-
Status of Grossly Polluting Industries (GPIs)
Sl. No.
Name & Address of the unit
Name of Sector
Product and Production Capacity
Tentative Quantity of
effluent generation
in KLD (Potential)
Details of Discharge Consent
Effluent Treatment System
ZLD/ Discharge Recipient (River/ Land)
Remarks
Issued on Valid up-to
1 M/s Harinagar Sugar Mills Ltd. (Distillery Division), Harinagar, Dist.- West Champaran.
Distillery Ethanol 120 KLD
1000 13.12.2018 12.12.2023 Bio-methanation, Multi Effect Evaporation (MEE), followed by Bio-composting. The unit has developed facility for maintaining zero liquid discharge.
Zero Liquid Discharge system
Operational. This is located on banks of Ramrekha river, a tributary of Sikrahna River
2 M/s New Swadeshi Sugar Mills, (Distillery Division), Narkatiaganj, Dist.- West Champaran
Distillery Ethanol, 60 KLD
600 24.12.2018 31.12.2023 Bio-methanation, MEE, RO, followed by Bio-composting. The unit has developed facility for maintaining zero liquid discharge.
Zero Liquid Discharge system
Operational. This is located on banks of Harbaura river, a tributary of Sikrahna River
3 M/s HPCL Bio-Fuels Ltd., Lauria, Dist.- West Champaran.
Distillery Alcohol 60 KLD
600 29.11.2018 30.09.2023 Bio-methanation, MEE followed by Bio-composting for distillery.
Zero Liquid Discharge system
Operational. This is located nearby Sikrahna river
4 M/s HPCL Bio-Fuels Ltd., Sugauli, Dist.- East Champaran.
Distillery Alcohol 60 KLD
600 23.11.2018 30.09.2023 Bio-methanation, MEE followed by Bio-composting for distillery.
Zero Liquid Discharge system
Operational. This is located approx. 6 km from Sikrahna river
5 M/s HPCL Bio-Fuels Ltd., Lauria, Dist.- West Champaran.
Sugar Sugar. Crushing
Cap. 3500 TCD&
350 29.11.2018 30.09.2023 Activated Sludge Process (ASP) for sugar mill
Land for irrigation.
Operational. This is located nearby Sikrahna river
6 M/s HPCL Bio-Fuels Ltd., Sugauli, Dist.- East Champaran
Sugar Sugar. Crushing
Cap. 3500 TCD&
350 23.11.2018 30.09.2023 Activated Sludge Process (ASP) for sugar mill
Land for irrigation.
Operational. This is located approx. 6 km from Sikrahna river
7 M/s Tirupati Sugar Mills, Bagha, Dist.- West Champaran.
Sugar Sugar. Crushing Cap.5000
TCD
700 11.12.2018 31.12.2023 ETP based on Activated Sludge Process (ASP) up to tertiary level with impervious lagoon for utlizing treated effluent for irrigation.
Land for irrigation.
Operational. This is located nearby Harha river, a tributary of Gandak river.
48
8 M/s Harinagar Sugar Mills Ltd., Harinagar, Dist.- West Champaran.
Sugar Sugar. Crushing
Cap. 10000 TCD
1000 11.12.2018 31.12.2023 ETP based on Activated Sludge Process (ASP) up to tertiary level with impervious lagoon for utlizing treated effluent for irrigation.
Reused in plant and land for
irrigation.
Operational. This is located on banks of Ramrekha river, a tributary of Sikrahna River
9 M/s New Swadeshi Sugar Mills, Narkatiaganj, Dist.- West Champaran
Sugar Sugar. Crushing
Cap. 7500 TCD
750 24.12.2018 31.12.2023 ETP based on Activated Sludge Process (ASP) up to tertiary level with impervious lagoon for utlizing treated effluent for irrigation.
Reused in plant
land and irrigation.
Operational. This is located on banks of Harbaura river, a tributary of Sikrahna River
10 M/s Manjhaulia Sugar Industries Pvt. Ltd, Manjhaulia ,Dist.- West Champaran.
Sugar Sugar. Crushing
Cap. 5000 TCD
700 03.12.2018 30.09.2023 ETP based on Activated Sludge Process (ASP), up to tertiary level with Sand & carbon filtration.
Reused in plant
land and irrigation.
Operational. This is located nearby Kohra river at the distance of 3 Km, a tributary of Sikrahna river.
There is no any GPI on the banks of Sirsia river and Parmar river in Indian Territory. Sirsia river is observed polluted river stretch. This originates in Nepal and enters at Raxaul, East Champaran in Indian Territory. It thus receives polluted water at the entry point. 8.1 COMMON EFFLUENT TREATMENT PLANTs(CETP)
The State is contemplating to have CETPs for the industrial areas: Fatuha (02 MLD) in Patna; Barari (01 MLD) in Bhagalpur; Hajipur (06 MLD) in Vaishali and Bela (05 MLD) in Muzaffarpur). Environmental Clearance (EC) has been accorded by SEIAA for aforesaid proposed CETPs in Bihar. Industries Department has been requested to expedite early setting up of aforesaid CETPs in Bihar. There is no Industrial Cluster/Area/Estate in the polluted river stretches other than that on Ganges, hence no requirement for setting up of CETP in the area. 9. GROUND WATER STATUS OF BIHAR
Central Ground Water Board (Ministry of Water Resources River Development & Ganga Rejuvenation, GoI) carries out periodic assessment of ground water resources of the State of Bihar in consultation with Minor Irrigation Department, GoB. Last assessment was carried out for the year 2017 and publication of the report is awaited. As per report published in 2014 (as on 31.03.2011) and 2017 (as on 31.03.2013) there is no over exploited and critical zone/block in the State of Bihar. The details are hereunder:-
Particulars As on 31.03.2011
As on 31.03.2013
No. of assessment blocks/ units 533 534 Category

49
1. Safe 522 519 2. Semi critical 11 08 3. Critical Nil Nil 4. Over exploited Nil Nil
All 18 assessment blocks/units of West Champaran district having 02 polluted river stretches and all 27 assessment blocks/units of East Champaran district having 01 polluted river stretch were observed in safe category. CGWB scrutinizes the applications for permission for withdrawal of ground water to industries in Bihar as per norms and guidelines of CGWA and forwards to CGWA, New Delhi with recommendation for according NOC. There is no contaminated/affected ground water blocks in the West Champaran & East Champaran districts. CGWA has prepared artificial re-charge master plan for the State of Bihar. However, CGWA does not construct any structure. 10. CROP DIVERSIFICATION & DRIP IRRIGATION Crop diversification is one of the means to minimize the risk due to climate change. It is also adopted for avoiding or minimizing the adverse effects of current system of crop specialization and mono culture for better use of resources, recycling of nutrients and regaining soil fertility. It also provides better economic variability with value added products and improvement of ecology. Changing climatic conditions like erratic and scanty rainfall, depletion of water resources, decline in net sown area and existing cropping pattern are becoming less productive. Cultivators are moving towards crop intensification through mixed cropping and by including high value crops. Department of Agriculture Bihar is promoting cultivation of pulses and coarse cereals under National Food Security Mission and oil seeds under National Mission on oil seeds and palms, as these crops need less water. Crop diversification program is also being implemented in Bihar to diversify the cropping pattern from water guzzling paddy to pulses, oil seeds, maize and agro forestry with the objective of tackling the problem of declining soil fertility and depleting water table in the State. To reduce utilization of water in paddy, water conservation technique like direct seeded rice, system of rice intensification, alternate wetting and drying method, laser and labeling, adoption of short duration and drought tolerant verities, etc are promoted through various crop development programs.

50
In order to enhance water use efficiency in water intensive crop, assistance is given for promotion of water saving tools/ technologies like sprinkler and drip irrigation, creation of farm ponds, efficient delivery and distribution system and adoption of agronomic practices like alternate row/ furrow irrigation, mulching, etc. Pradhan Mantri Krishi Sinchai Yojana also focuses on creating protective irrigation by harnessing rain water at micro level through 'Jal Sanchay' and 'Jal Sinchan' to insure 'Per Drop More Crop'. The state is implementing Pradhan Mantri Krishi Sinchai Yojana (Per Drop More Crop) for development of Micro Irrigation in Bihar during the year 2018-19 with the cost of Rs 133.00 Crore by providing 90% subsidy to all categories of Farmers under Drip Irrigation and 75% Subsidy to all categories of farmers under Sprinkler Irrigation. State Govt. is also implementing community Tube well Scheme for benefit of small and marginal farmers with 100 % subsidy to provide water source for installation of Drip Irrigation System under the State Plan. As Horticultural and Commercial crops like Sugarcane require heavy water during summer season, Drip Irrigation is highly beneficial because about 60% of conventional Irrigation water is saved under this system. The productivity of the crops under this system increases by about 25-30 % while cost of production decreases 30-35% in comparison to Conventional Irrigation System. 11. FORESTRY & PLANTATION ACTIVITIES ALONG RIVER GANGA AND ITS TRIBUTARIES IN BIHAR
The Department of Environment, Forest and Climate Change, Government of Bihar has been carrying out various plantation activities both inside the notified forest areas as well as in the agricultural fields outside the forest areas in the Ganga River Basin, with special emphasis on agroforestry. Increasing Tree Cover: The target for raising plantations both inside the forest area and as well as outside the forest areas in the agricultural fields is guided by the Bihar Krishi Road Map (Bihar Agriculture Road Map) Phase-II for the period 2017-18 to 2021-22. Phase-I of the Bihar Agriculture Road Map had a target of taking the total tree cover (both inside and outside the forest area) from 12.11% in 2012 to 15% by 2017. The Bihar state has successfully achieved the total tree cover target of 15% for the Phase-I of Bihar Agriculture Road Map. For the Phase-II of Bihar Agriculture Road Map for the period

51
2017-18 to 2021-22 a target of 17% total tree cover has to be achieved by 2022. As part of this drive to achieve 17% of green cover in the state, the areas falling along the rivers like Ramrekha (Ramnagar, West Champaran), Sikrahna (Narkatiaganj, West Champaran), Sirisia (Raxaul, East Champaran), Parmar (Jogbani, Araria), Punpun (Fatuah, Patna) and entire stretch of Ganga in Bihar shall be given preference in taking up plantation activities; soil and moisture conservation efforts in the catchment areas (Forest areas) and plantations in the agricultural fields in the form of agro-forestry. The target for the Plantation activities under the Agricultural Road Map, Phase-II, 2017-18 to 2021-22 for the state of Bihar is given in the Annexure I. The forests of Valmiki Tiger Reserve in West Champaran district is the catchment for Ramrekha and forms part of the catchment for Shikrahna river. The Sirisia river in Raxaul in East Champaran district originates from Nepal. These rivers forms part of the Burhi Gandak river, which is a tributary of river Ganga. Parmar river in Jogbani (Araria), Punpun river in Fatuah (Patna) are also drain into the river Ganga. The Forest Depart has been playing an active role in the conservation of these rivers and river banks from soil erosion and degradation due to various factors by taking up soil and moisture conservation activities in the catchment area viz., forests of Valmiki Tiger Reserve along with plantation activities. In the agricultural fields outside the forest area agro-forestry is actively encouraged with financial incentives for growing trees through different plantation activities under various schemes including the Namame Gange – Forestry Intervention for Ganga scheme. Soil and Moisture Conservation works in Catchment Areas of Valmiki Tiger Reserve: Valmiki Tiger Reserve forms the eastern most limit of the Himalayan Terai forests in India. The landscape encompasses foothill ranges of Himalayan Siwaliks with mosaic of cliffs, ridges, gorges, hills, streams and valleys. Situated in Gangetic plains bio-geographic zone of the country, the forest has combination of bhabhar and terai tracks. Criss-crossing and meandering rivers, streams and rivulets feature on these lands. The streams while roaring in monsoon are mostly dry in summer. In order to reduce run-off and conserve moisture for the lean seasons, Forest Department came up with scheme of Soil and Moisture Conservation works on a large scale in 2012-13. Ever since, works have been carried out in 12,869 Ha of forest land with remarkable results downstream. Not only erstwhile dry nalas have water all year round, this has contributed to augmenting the flow in rivers for which these forests serve as Catchment areas.

52
Year Area taken up for SMC works (Ha)
No. of structures
2012-14 3347 632 2014-15 3034 537 2015-16 2992 549 2016-17 2360 396 2018-19 1136 150
Works have been carried out for treatment of existing gullies as also gullies which are in formation stage. Treatment of gully heads has been done using sand bags (geo-bags) and stones/boulders filled crates.
The results of the work done in last 6 years have been very encouraging.
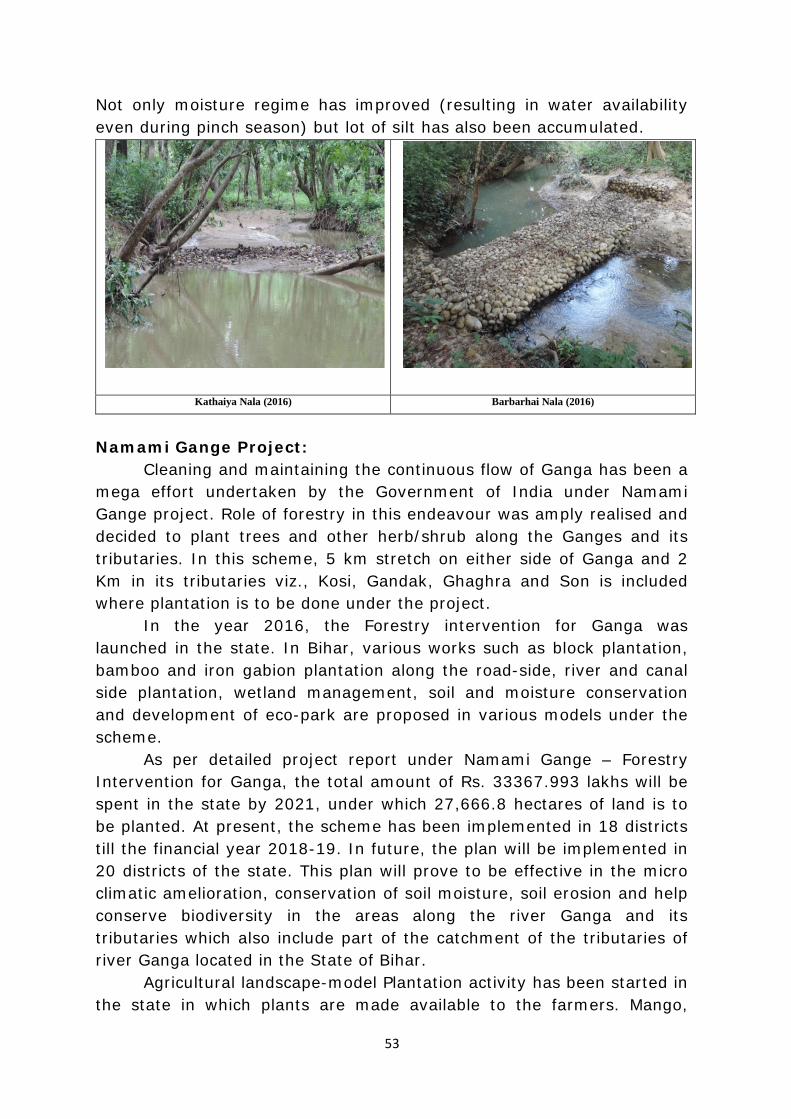
53
Not only moisture regime has improved (resulting in water availability even during pinch season) but lot of silt has also been accumulated.
Kathaiya Nala (2016) Barbarhai Nala (2016)
Namami Gange Project:
Cleaning and maintaining the continuous flow of Ganga has been a mega effort undertaken by the Government of India under Namami Gange project. Role of forestry in this endeavour was amply realised and decided to plant trees and other herb/shrub along the Ganges and its tributaries. In this scheme, 5 km stretch on either side of Ganga and 2 Km in its tributaries viz., Kosi, Gandak, Ghaghra and Son is included where plantation is to be done under the project.
In the year 2016, the Forestry intervention for Ganga was launched in the state. In Bihar, various works such as block plantation, bamboo and iron gabion plantation along the road-side, river and canal side plantation, wetland management, soil and moisture conservation and development of eco-park are proposed in various models under the scheme.
As per detailed project report under Namami Gange – Forestry Intervention for Ganga, the total amount of Rs. 33367.993 lakhs will be spent in the state by 2021, under which 27,666.8 hectares of land is to be planted. At present, the scheme has been implemented in 18 districts till the financial year 2018-19. In future, the plan will be implemented in 20 districts of the state. This plan will prove to be effective in the micro climatic amelioration, conservation of soil moisture, soil erosion and help conserve biodiversity in the areas along the river Ganga and its tributaries which also include part of the catchment of the tributaries of river Ganga located in the State of Bihar.
Agricultural landscape-model Plantation activity has been started in the state in which plants are made available to the farmers. Mango,

54
Litchi, guava and timber species plants have being distributed among the selected farmers, especially among the farmers whose agricultural fields are located within 2 Kms from the Tributaries of river Ganga and 5 Kms from the river banks of river Ganga. Under Agricultural landscape-model Plantation activity a total number of 230657 plants were planted on the farmer’s agricultural field along the river Ganga and along the tributaries of river Ganga within the State.Under ‘Ganga Gram’ activitiy under Namame Gange - Forestry Intervention For Ganga Scheme, plants are planted in a selected village along the river Ganga. This has been taken up as a awareness activity.
The Department of Environment, Forest and Climate Change, Government of Bihar has been striving to achieve the target for tree cover as given under the Bihar Agriculture Road Map: Phase –I: 2017-18 – 2021-22 with the available resources. There will emphasis to achieve the target of tree cover outside the forest areas through agroforestry on a massive scale. The catchments areas, agricultural lands falling on either side of the following rivers viz., Ram Rekha (Ramnagar, West Champaran), Sikrahna (Narkatiaganj, West Champaran), Sirisia (Raxaul, East Champaran), Parmar (Jogbani, Araria), Punpun (Fatuah, Patna) and Ganga will form part of this plantation drive by the department.
12. ACTION PLAN FOR OPEN DEFECATION FREE (ODF)
Sl. No.
Name of City/ULBs Status of ODF
declared
Date of QCI Certificate
Remarks
1 Fatuha Nagar Parishad ODF 31.07.2018 2 Raxaul Nagar Parishad ODF 11.08.2018 3 Jogabni Nagar Panchayat ODF 08.09.2018 4 Ramnagar/Harinagar
Nagar Panchayat ODF 18.09.2018
5 Narkatiaganj Nagar Parishad
Non-ODF Non-ODF To be ODF by May, 2019
13. STATUS & ACTION PLAN FOR SOLID WASTE, PLASTIC WASTE, BIO- MEDICAL WASTE, E-WASTE AND HAZARDOUS WASTE MANAGEMENT
SWM:
Sl. No.
Name of City/ULBs
Waste generation
Total Project Cost
(Rs. in Lakh)
Remarks
1 Fatuha Nagar 27 483.42 DPRs submitted to
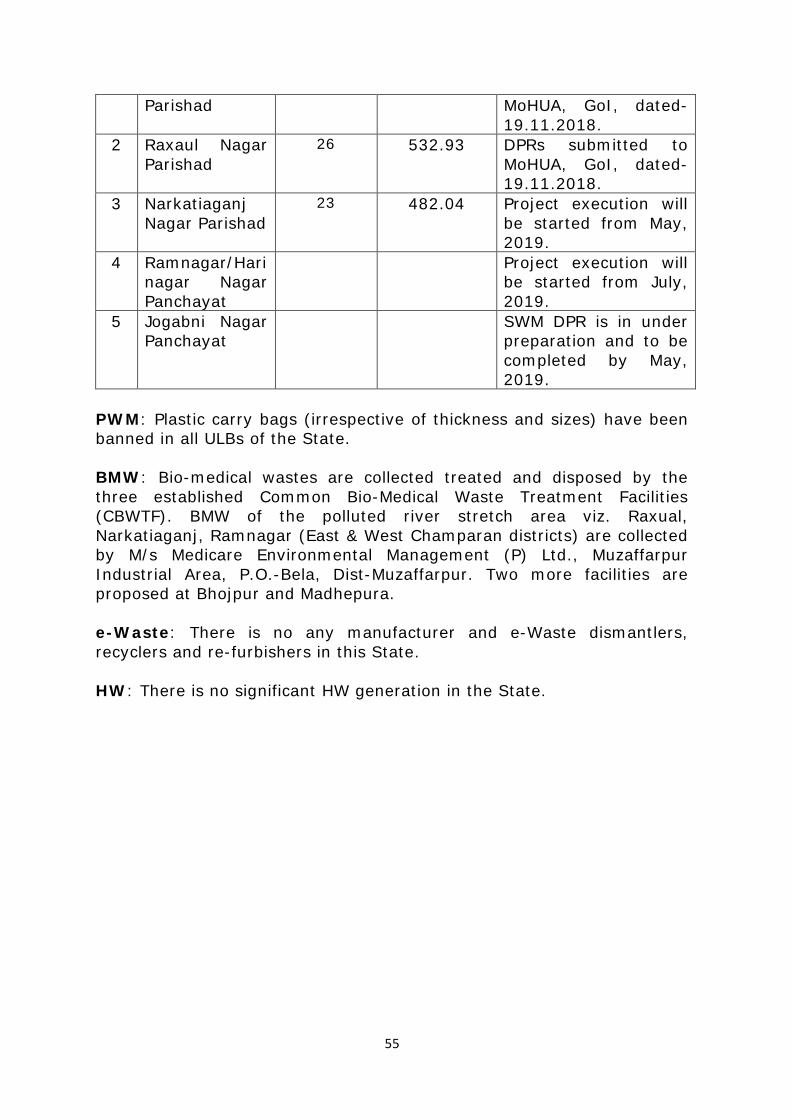
55
Parishad MoHUA, GoI, dated-19.11.2018.
2 Raxaul Nagar Parishad
26 532.93 DPRs submitted to MoHUA, GoI, dated-19.11.2018.
3 Narkatiaganj Nagar Parishad
23 482.04 Project execution will be started from May, 2019.
4 Ramnagar/Harinagar Nagar Panchayat
Project execution will be started from July, 2019.
5 Jogabni Nagar Panchayat
SWM DPR is in under preparation and to be completed by May, 2019.
PWM: Plastic carry bags (irrespective of thickness and sizes) have been banned in all ULBs of the State. BMW: Bio-medical wastes are collected treated and disposed by the three established Common Bio-Medical Waste Treatment Facilities (CBWTF). BMW of the polluted river stretch area viz. Raxual, Narkatiaganj, Ramnagar (East & West Champaran districts) are collected by M/s Medicare Environmental Management (P) Ltd., Muzaffarpur Industrial Area, P.O.-Bela, Dist-Muzaffarpur. Two more facilities are proposed at Bhojpur and Madhepura. e-Waste: There is no any manufacturer and e-Waste dismantlers, recyclers and re-furbishers in this State. HW: There is no significant HW generation in the State.

56
14. Comprehensive Action Plan for Restoration & Conservation of Polluted River Stretches in Bihar.
Sl. No
Action Plan
Imp
lem
enti
ng
A
gen
cy
Status
A Identification of Polluting Sources
BSPCB
a. Industrial Pollution Control.
i. Inventorisation of Industries.
Complied There are 06 sugar mills & 04 molasses based distillery in the basin of identified polluted river stretches falling under GPIs.
ii. Categories of industry & effluent quality.
Distillery & Sugar. These are Grossly Polluting Industries (GPIs) & having potential of causing pollution to the rivers located nearby the industry if there is discharge.
iii. Treatment of effluents, compliance with standards and mode of disposal of effluent.
All identified industries have installed Effluent Treatment Plant (ETP). Distillery units follow Bio-methanation, Multi-Effect-Evaporation (MEE) & Bio-composting mode for treatment and disposal of their effluent. They are maintaining Zero Liquid Discharge (ZLD). Sugar mills have ETP based on Activated Sludge Process (ASP) up to tertiary level with impervious lagoon for utilization of treated effluent for irrigation.
iv. Regulatory Regime
• Implementation of Zero Liquid
BSPCB Complied
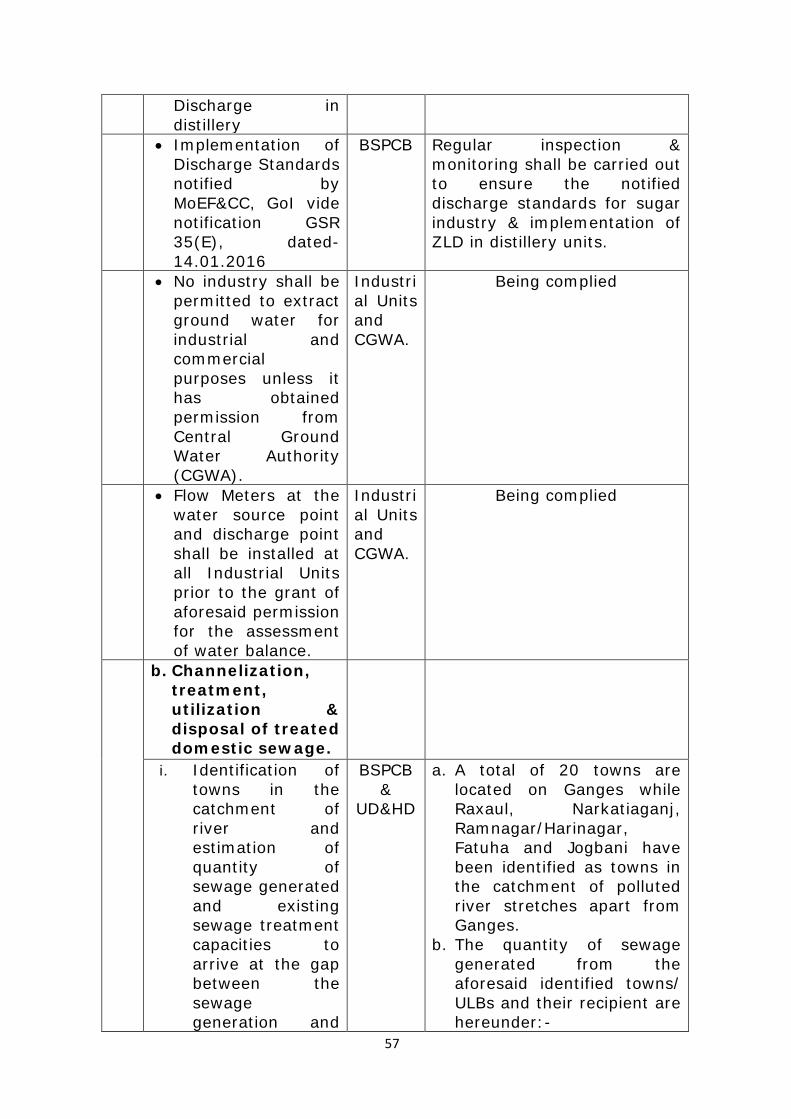
57
Discharge in distillery
• Implementation of Discharge Standards notified by MoEF&CC, GoI vide notification GSR 35(E), dated-14.01.2016
BSPCB Regular inspection & monitoring shall be carried out to ensure the notified discharge standards for sugar industry & implementation of ZLD in distillery units.
• No industry shall be permitted to extract ground water for industrial and commercial purposes unless it has obtained permission from Central Ground Water Authority (CGWA).
Industrial Units and CGWA.
Being complied
• Flow Meters at the water source point and discharge point shall be installed at all Industrial Units prior to the grant of aforesaid permission for the assessment of water balance.
Industrial Units and CGWA.
Being complied
b. Channelization, treatment, utilization & disposal of treated domestic sewage.
i. Identification of towns in the catchment of river and estimation of quantity of sewage generated and existing sewage treatment capacities to arrive at the gap between the sewage generation and
BSPCB &
UD&HD
a. A total of 20 towns are located on Ganges while Raxaul, Narkatiaganj, Ramnagar/Harinagar, Fatuha and Jogbani have been identified as towns in the catchment of polluted river stretches apart from Ganges.
b. The quantity of sewage generated from the aforesaid identified towns/ ULBs and their recipient are hereunder:-

58
treatment capacities
Towns /ULBs
No. of Drains Identifi
ed
Total Flow
in MLD
Recipients /Polluted
River Stretch
Raxaul 3 14.89 (15)
Sirsiya River
Narkatiaganj 3 14.59 (15)
Harbaura River
Ramnagar (Harinagar)
5 27.88 (28)
Ramrekha River
Bagha 4 7.88 (08)
Low lying area
Fatuha 7 9.22 (09)
Ganga River & Punpun
Jogbani 4 2.74 (03)
Low lying Area
c. There is no any sewerage
network and Sewage Treatment Plant (STP) in the ULBs of polluted river stretch basin. In pursuance of BSPCB, BGCMC (UD&HD, GoB) has directed BUDCO for preparation of DPR for I & D and setting up of STP through NEERI for sewage management for the ULBs namely Raxaul, Narkatiaganj, Ramnagar (Harinagar) and Jogbani located in the polluted river stretch basin. DPR will be prepared by April, 2019 and will be sent to NMCG for sanction. After approval of DPR the work will completed by June, 2021.
d. A scheme of I&D and STP of 07 MLD capacity has been approved for Rs. 35.49 Cr. for Fatuha. Tender floated. The expected time of completion of the project is December, 2020.
ii. Storm water drains now carrying sewage & sullage joining river and interception & diversion of sewage to STP
UD&HD Presently, identified drains carry storm water as well as sewage/domestic waste water generated from towns/ULBs (Raxaul, Narkatiaganj, Ramnagar/Harinagar, Fatuha and Jogbani) under polluted

59
river stretch/catchment area as well as from Ganga Front Towns. Presently, there is no sewerage network & STP in the aforesaid towns. UD&HD has prepared action plan for sewerage network and STP for the 20 Ganga Front Towns. DPR is under preparation for towns of polluted river stretches.
iii. Treatment and disposal of septage and controlling open defecation
UD&HD, GoB, PHED, GoB & District Adm.
Fatuha Nagar Parishad, Raxaul Nagar Parishad, Ramnagar Nagar Parishad and Jogbani Nagar Panchayat have been declared ODF. Narkatiaganj Nagar Parishad shall be ODF by May, 2019.
iv. Identification of towns for installing sewerage system and sewage treatment plants.
UD&HD, GoB
Raxaul, Narkatiaganj, Ramnagar/Harinagar, Chanpatia, Fatuha and Jogbani. UD&HD has prepared action plan for sewerage network and STP for the 20 Ganga Front Towns. DPR is under preparation for towns of polluted river stretches.
B River catchment /Basin Management -controlled ground water extraction and periodic quality assessment.
i. Periodic assessment of ground water resources and regulation of ground water extraction by industries particularly in over exploited and critical zones/ blocks.
CGWB Complied 1. Central Ground Water Board
(Ministry of Water Resources River Development & Ganga Rejuvenation, GoI) carry out periodic assessment of ground water resource of the State of Bihar in consultation with Minor Irrigation Department, GoB. Last assessment has been carried out for the year 2017 and publication of the report is awaited. As per report published in 2014 (as

60
on 31.03.2011) and 2017 (as on 31.03.2013) there is no over exploited and critical zone/block in the State of Bihar. The details are hereunder:- Particulars As on
31.03.2011 As on
31.03.2013 No. of assessment blocks/units
533 534
Category 1. Safe 522 519 2. Semi critical
11 08
3. Critical Nil Nil 4. Over exploited
Nil Nil
2. All 18 assessment blocks /units of West Champarna district were observed in safe category.
3. All 27 assessment blocks /units of East Champarna district were observed in safe category.
4. CGWB scrutinizes the applications for permission for withdrawal of ground water to industries in Bihar as per norms and guidelines of CGWA and forward to CGWA, New Delhi with recommendation for according NOC.
ii. Ground water re-charging/rain water harvesting
CGWB &
UD&HD
CGWA has prepared artificial re-charge master plan for the State of Bihar. However, CGWA does not construct any structure. Government of Bihar has notified The Bihar Ground Water (Regulation & Control of Development & Management) Act, 2006 for regulating and management of ground water. The authority may impose stipulated conditions for providing roof top rain water harvesting structures in the building plan in an area of the 1000 Sqm or

61
more while according approval for construction.
iii. Periodic ground water quality assessment and remediation actions in case of contaminated ground water tube wells/bore wells or hand pumps.
CGWB Central Ground Water Board (Ministry of Water Resources River Development & Ganga Rejuvenation, GoI) carry out periodic assessment of ground water resource of the State of Bihar in consultation with Minor Irrigation Department, GoB. There is no contaminated /affected ground water of blocks in the West Champaran & East Champaran districts.
iv. Assessment of the need for regulation use of ground water for irrigation purposes.
Depart. Water Resource, GoB
& Depart.
of Minor Irrigati
on
To be complied
v. Farmers shall be incentivized to adopt agricultural/ irrigation technologies for more efficient use of surface and ground water including adoption of drip irrigation wherever feasible besides, promoting crops diversification to promote less water intensive crops in the Ganga river basin.
Department of Agriculture.
Being complied
C Flood Plain Zone
i. Regulating activities in flood plain zone
ULB
a. The STPs shall not be constructed
UD&HD&
To be complied
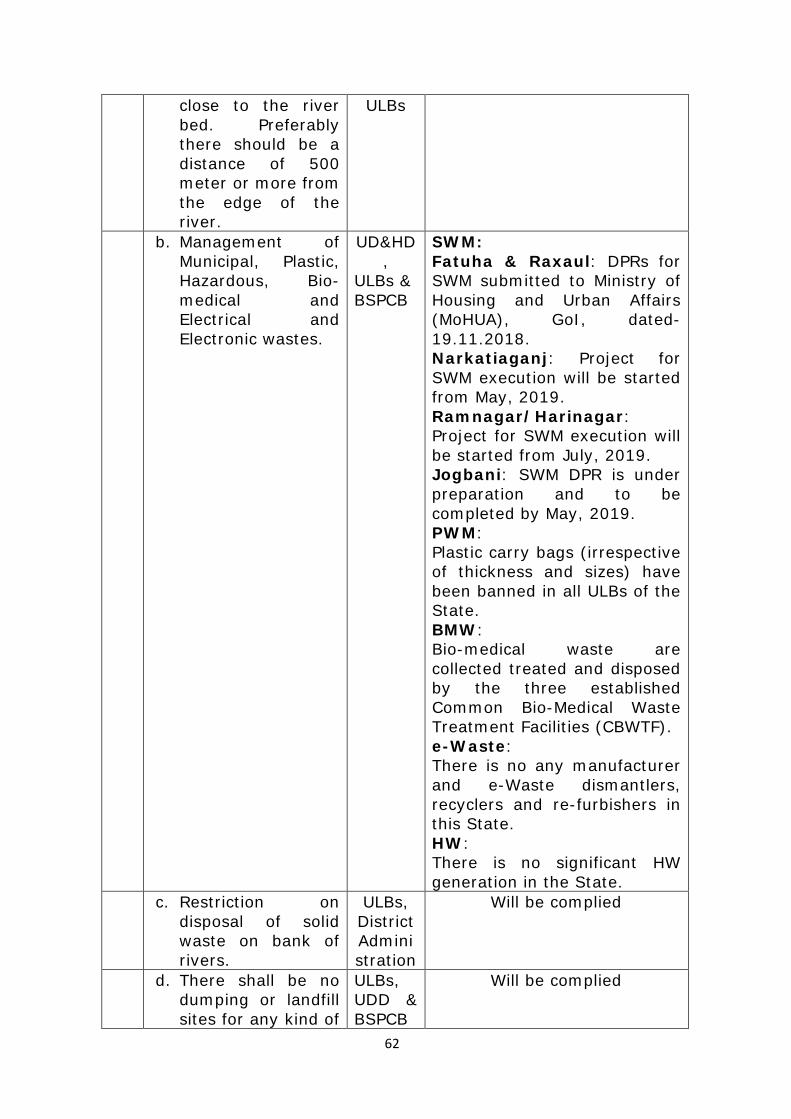
62
close to the river bed. Preferably there should be a distance of 500 meter or more from the edge of the river.
ULBs
b. Management of Municipal, Plastic, Hazardous, Bio-medical and Electrical and Electronic wastes.
UD&HD,
ULBs & BSPCB
SWM: Fatuha & Raxaul: DPRs for SWM submitted to Ministry of Housing and Urban Affairs (MoHUA), GoI, dated-19.11.2018. Narkatiaganj: Project for SWM execution will be started from May, 2019. Ramnagar/Harinagar: Project for SWM execution will be started from July, 2019. Jogbani: SWM DPR is under preparation and to be completed by May, 2019. PWM: Plastic carry bags (irrespective of thickness and sizes) have been banned in all ULBs of the State. BMW: Bio-medical waste are collected treated and disposed by the three established Common Bio-Medical Waste Treatment Facilities (CBWTF). e-Waste: There is no any manufacturer and e-Waste dismantlers, recyclers and re-furbishers in this State. HW: There is no significant HW generation in the State.
c. Restriction on disposal of solid waste on bank of rivers.
ULBs, District Administration
Will be complied
d. There shall be no dumping or landfill sites for any kind of
ULBs, UDD & BSPCB
Will be complied

63
waste irrespective of any technology for waste processing within 500 meter from the edge of river.
e. There shall be no encroachment, unauthorized illegal construction on the banks/ flood plain of major drains, river Ganga and its tributaries. Preferably these area should be utilized for creation of green belt and bio-diversity park etc. (natural fringes of effluent and sewage)
District Administration, Deptt. of Water Resources, Env.& Forest Deptt., Govt. of Bihar.
To be complied
ii. Greenery development-plantation plan
Env.& Forest Deptt., Govt.
of Bihar.
Plantation is being done under Namami Gange Scheme and Krishi Road Map wherein the polluted river stretches will be prioritized.
D Ecological/Environmental Flow (E-Flow)
i. Issues relating to E-Flow
Maintenance of 20% minimum environmental flow of the lean season flow of rivers.
Dept. of Water Resource, GoB
To be complied
ii. Irrigation practices Dept. of
Minor Irrigation &
Agriculture, GoB
Being complied
E Such other issues which may be found relevant for
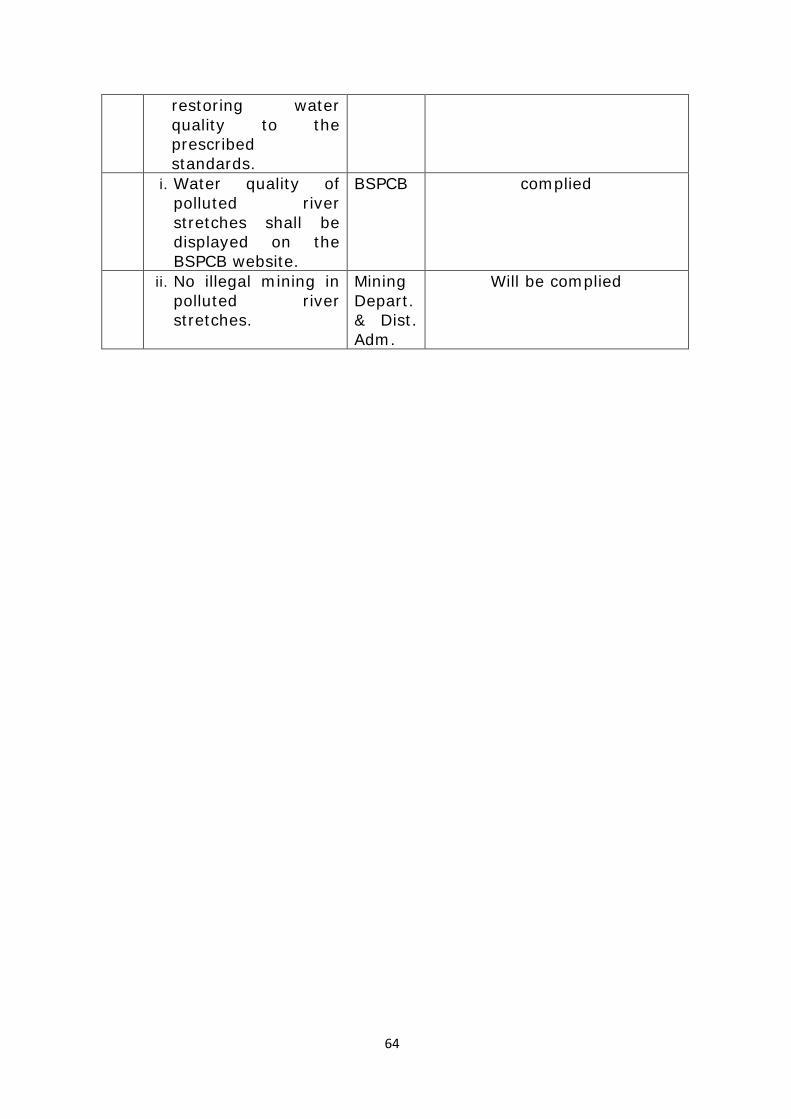
64
restoring water quality to the prescribed standards.
i. Water quality of polluted river stretches shall be displayed on the BSPCB website.
BSPCB complied
ii. No illegal mining in polluted river stretches.
Mining Depart. & Dist. Adm.
Will be complied

65
Annexure-1
Water Quality status of River Ganga (2009-2018)
Sl. No
Year No. of sampling location
DO mg/L
BOD mg/L
Remarks
1. 2009-10 13 7.4 to 9.2 <3 DO & BOD conforms 2. 2010-11 13 7.0 to 9.1 <3 DO & BOD conforms 3. 2011-12 21 6.2 to 9.3 <3 DO & BOD conforms 4. 2012-13 21 6.4 to 8.6 <3 DO & BOD conforms 5. 2013-14 21 5.8 to 9.7 <3 DO & BOD conforms 6. 2014-15 21 6.9 to 9.8 <3 DO & BOD conforms 7. 2015-16 21 6.9 to
10.2 <3 DO & BOD conforms
8. 2016-17 21 2.6* to 9.6
<3* The value of BOD was observed >3mg/L at 04 locations/towns viz. Patna, Barahiya, Munger and Bhagalpur during October, 2016 and at 02 locations Simariya ghat, Mokama (Station code-1815) 4.1 mg/L & Barahiya (Station code-3123) during January, 2017.
9. 2017-18 31 5.0 to 11.0
<3 DO & BOD conforms
10 2018-19 33

66
Annexure-2 Year Wise Water Quality Monitoring Data of River Ganga
Water Quality Status of River Ganga during the Year (2010-2011)
Sl.No
Sampling Station
pH
D.O mg/L
B.O.D mg/L
T.C MPN/100mL
F.C MPN/100mL
1. Ganga at Chausa Buxar
Minimum 7.24 8.8 2.6 3000 1300 Maximum 8.58 9.1 2.9 16000 5000 Average 7.95 8.58 2.76 5750 2383
2. Ganga at Ramrekha ghat Buxar
Minimum 6.92 7.8 2.9 16000 3000 Maximum 8.52 9.0 3.0 24000 16000 Average 7.88 8.43 2.95 22000 8083
3. Ganga at Kurji (U/S Patna)
Minimum 8.11 7.7 2.6 2400 1300 Maximum 8.62 8.9 2.8 9000 5000 Average 8.31 8.57 2.74 4216 2075
4. Ganga at Darbhangaghat, Patna
Minimum 7.84 7.5 2.8 9000 3000 Maximum 8.34 9.1 3.0 24000 16000 Average 8.21 8.4 2.9 22083 8083
5. Ganga at Gaighat (D/S Patna)
Minimum 7.62 7.7 2.8 9000 2400 Maximum 8.28 8.8 3.0 24000 16000 Average 8.16 8.38 2.89 15583 5700
6. Ganga at Kewalaghat, Fatuha.
Minimum 7.51 7.6 2.6 2200 1100 Maximum 8.32 8.9 2.8 9000 5000 Average 8.16 8.48 2.73 4958 2250
7. Ganga at U/S Mokama
Minimum 7.14 7.8 2.7 2200 1100 Maximum 8.25 8.8 2.8 9000 5000 Average 7.95 8.3 2.75 4309 2136
8. Ganga at D/S Mokama
Minimum 7.60 7.0 2.9 9000 2200 Maximum 8.11 8.6 3.0 24000 16000 Average 7.91 8.04 2.92 16273 6473
9. Ganga at Munger
Minimum 7.81 8.0 2.6 2400 1300 Maximum 8.22 8.9 2.8 5000 2400 Average 7.98 8.32 2.76 3560 1540
10. Ganga at Sultanganj
Minimum 7.38 7.1 2.6 2200 1100 Maximum 8.20 8.9 2.8 9000 5000 Average 7.88 8.2 2.74 4690 2260
11. Ganga at Bhagalpur
Minimum 7.61 8.0 2.8 2800 1700 Maximum 8.56 8.9 2.9 16000 5000 Average 7.90 8.5 2.8 7466 2800
12. Ganga at Kahalgaon
Minimum 7.71 7.4 2.7 3000 1300 Maximum 8.67 8.9 2.9 16000 5000 Average 7.96 8.27 2.8 7500 3000
13. Ganga at Confluence of Sone River, Doriganj, Chapra.
Minimum 7.68 7.4 2.8 2400 1100 Maximum 8.75 8.9 2.8 5000 2200 Average 8.27 8.4 2.8 3533 1566
Water Quality Status of River Ganga during the Year (2011-2012)
Sl.No
Sampling Station
pH
D.O mg/L
B.O.D mg/L
T.C MPN/100mL
F.C MPN/100mL
1. Ganga at Chausa Buxar
Minimum 7.1 7.8 2.6 2800 1100 Maximum 8.52 9.2 2.8 16000 9000 Average 8.1 8.5 2.7 5900 2733
2. Ganga at Ramrekha ghat
Minimum 7.14 7.8 2.6 16000 5000 Maximum 8.58 9.0 3.0 24000 9000

67
Buxar Average 8.12 8.4 2.9 22667 7000 3. Ganga at D/S
Buxar near Ganga Bridge.
Minimum 7.37 8.3 2.6 3000 1700 Maximum 8.2 9.1 2.9 9000 3000 Average 7.79 8.8 2.7 7000 2566
4. Ganga at Danapur near Pipapul
Minimum 8.12 8.6 2.4 2800 1100 Maximum 8.53 8.8 2.7 3500 1700 Average 8.25 8.6 2.5 3100 1366
5. Ganga at Kurji U/S Patna.
Minimum 7.8 8.0 2.6 2400 1100 Maximum 8.62 8.9 2.8 16000 5000 Average 8.19 8.5 2.7 5966 2383
6. Ganga at Darbhanga ghat, Patna.
Minimum 7.86 7.9 2.8 16000 5000 Maximum 8.64 8.7 3.0 24000 9000 Average 8.31 8.4 2.9 22666 8333
7. Ganga at Gaighat D/S Patna.
Minimum 8.02 7.8 2.7 9000 3000 Maximum 8.68 8.7 3.0 24000 9000 Average 8.27 8.4 2.9 17500 5167
8. Ganga at Malsalami, Patna City.
Minimum 8.12 8.5 2.8 2800 1100 Maximum 8.48 8.8 2.9 5000 3000 Average 8.26 8.6 2.8 3600 1800
9. Ganga at Kewalaghat, Fatuha.
Minimum 8.14 8.0 2.4 2200 800 Maximum 8.75 8.8 2.9 16000 5000 Average 8.3 8.4 2.7 5875 2175
10. Ganga at the Confluence of Sone River at Doriganj, Chapra.
Minimum 7.11 7.8 2.6 2200 1100 Maximum 8.62 9.3 2.8 5000 3000 Average 7.85 8.4 2.7 3783 1716
11. Ganga at U/S Mokama
Minimum 7.8 7.1 2.4 2200 800 Maximum 8.2 8.6 2.8 16000 5000 Average 8.04 8.06 2.68 5518 2109
12. Ganga at D/S Mokama
Minimum 7.62 6.8 2.9 8000 2100 Maximum 8.21 8.8 3.0 24000 9000 Average 7.95 7.9 3.0 21090 6736
13. Ganga at Barh Minimum 7.8 7.8 2.4 2400 1100 Maximum 8.0 8.6 2.6 - - Average 7.9 8.2 2.5 - -
14. Ganga at U/S Munger (Near Intake well of Ganga)
Minimum 7.7 7.6 2.4 2800 1100 Maximum 8.1 8.6 2.7 2800 1300 Average 7.9 8.2 2.5 2800 1233
15. Ganga at D/S Munger.
Minimum 7.6 6.2 2.4 2200 800 Maximum 8.11 8.6 2.9 9000 5000 Average 8.65 7.9 2.7 4425 1942
16. Ganga at U/S Bhagalpur
Minimum 7.7 7.6 2.7 5000 1700 Maximum - - - - - Average - - - - -
17. Ganga at Bhagalpur.
Minimum 7.7 6.2 2.6 2200 1700 Maximum 8.2 8.7 2.9 24000 9000 Average 7.9 7.8 2.8 9020 1710
18. Ganga at U/S Sultanganj
Minimum 7.8 7.6 2.2 2200 800 Maximum 8.1 8.6 2.5 3000 1700 Average 8.0 8.2 2.3 2666 1133
19. Ganga at Sultanganj.
Minimum 7.61 6.4 2.6 2200 500 Maximum 8.1 8.7 2.8 9000 5000 Average 7.9 7.9 2.7 3654 1972
20. Ganga at Barahia.
Minimum 7.7 7.6 2.7 2800 1300 Maximum - - - - - Average - - - - -
21. Ganga at Kahalgaon.
Minimum 7.7 7.8 2.7 2200 700 Maximum 8.2 8.7 2.9 24000 9000 Average 7.9 8.0 2.8 9583 3012

68
Water Quality Status of River Ganga during the Year (2012-2013)
Sl.No
Sampling Station
pH
D.O mg/L
B.O.D mg/L
T.C MPN/100mL
F.C MPN/100mL
1. Ganga at Buxar (Chausa)
Minimum 7.8 7.6 2.6 2800 1100 Maximum 8.52 8.6 2.8 16000 5000 Average 8.16 8.06 2.67 6240 2480
2. Ganga at Ramrekha ghat Buxar
Minimum 7.16 7.4 2.8 9000 3000 Maximum 8.39 8.4 2.9 24000 9000 Average 7.98 7.92 2.85 17100 5800
3. Ganga at D/S Buxar near Ganga Rd. Bridge.
Minimum 7.87 7.5 2.6 3000 1700 Maximum 8.47 8.4 2.9 24000 9000 Average 8.16 8.04 2.74 9200 3750
4. Ganga at Danapur near Pipapul
Minimum 7.45 7.9 2.4 2400 1100 Maximum 8.28 8.7 2.8 24000 9000 Average 8.07 8.30 2.58 6100 2590
5. Ganga at Kurji U/S Patna.
Minimum 7.77 7.9 2.4 2400 1300 Maximum 8.38 8.8 2.8 16000 9000 Average 8.05 8.3 2.6 5600 2600
6. Ganga at Darbhanga ghat, Patna.
Minimum 7.68 7.8 2.6 9000 3000 Maximum 8.28 8.7 2.9 24000 16000 Average 7.96 8.2 2.7 20454 7818
7. Ganga at Gaighat D/S Patna.
Minimum 7.58 7.8 2.6 9000 3000 Maximum 8.21 8.7 2.9 24000 9000 Average 7.96 8.2 2.7 14909 5363
8. Ganga at Malsalami, Patna City.
Minimum 7.84 7.8 2.0 2800 1100 Maximum 8.26 8.8 2.8 28000 5000 Average 7.97 8.2 2.5 8038 2200
9. Ganga at Kewalaghat, Fatuha.
Minimum 7.82 7.8 2.4 2200 1100 Maximum 8.26 8.7 2.7 9000 3000 Average 8.02 8.2 2.57 4545 1963
10. Ganga at the Confluence of Sone River at Doriganj, Chapra.
Minimum 7.56 7.8 2.1 2400 170 Maximum 8.36 9.3 2.8 9000 3000 Average 7.99 8.4 2.6 4141 1580
11. Ganga at U/S Mokama
Minimum 7.8 6.8 2.2 2200 1100 Maximum 8.2 8.8 2.7 16000 5000 Average 8.0 8.1 2.5 5260 1950
12. Ganga at D/S Mokama
Minimum 7.8 6.6 2.4 5000 1700 Maximum 8.1 8.6 3.0 24000 9000 Average 7.95 7.9 2.7 18636 6336
13. Ganga at Barh Minimum 7.9 7.8 2.2 1700 700 Maximum 8.1 8.8 2.7 5000 3000 Average 8.05 8.36 2.4 3642 1828
14. Ganga at U/S Munger (Near Intake well of Ganga)
Minimum 7.8 7.6 2.2 2400 1100 Maximum 8.1 8.6 2.7 9000 3000 Average 7.9 8.1 2.4 3960 1590
15. Ganga at D/S Munger.
Minimum 7.8 7.5 2.4 3000 1300 Maximum 8.0 8.5 2.7 9000 5000 Average 7.9 8.06 2.5 4166 2133
16. Ganga at Bhagalpur D/S ( Ganga Bridge)
Minimum 7.8 6.4 2.4 5000 2400 Maximum 7.9 8.4 2.8 24000 9000 Average 7.85 7.8 2.6 9500 4540
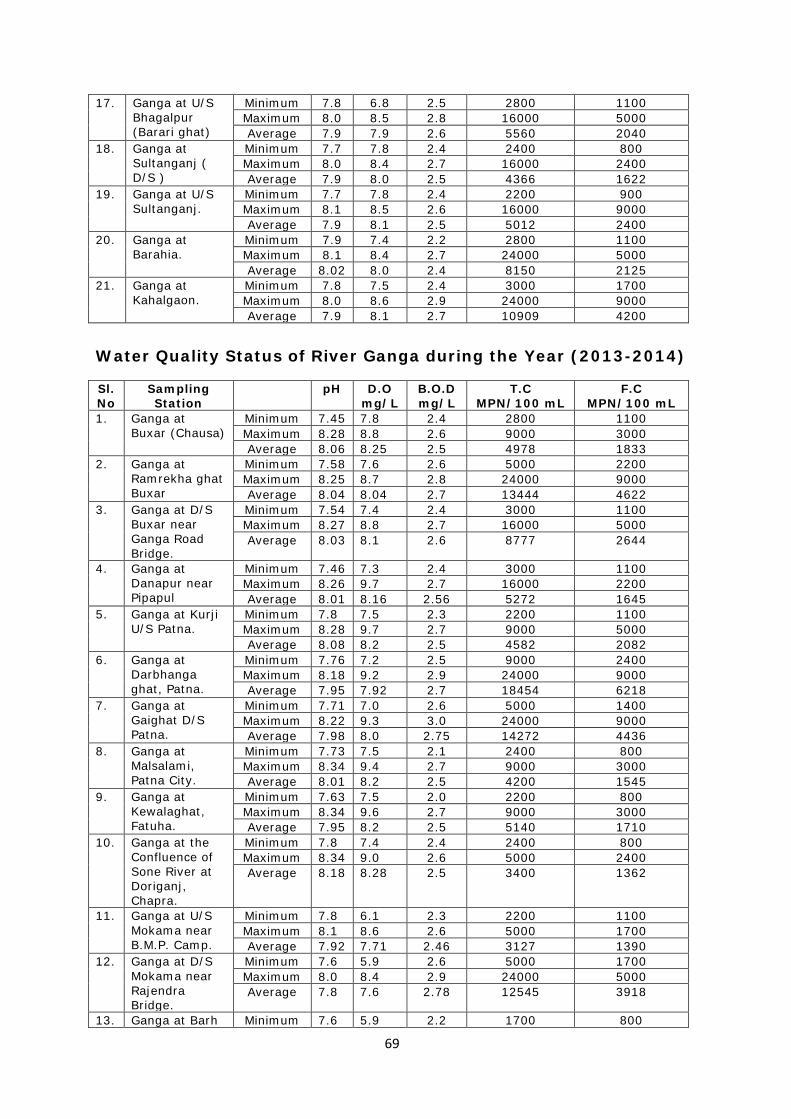
69
17. Ganga at U/S Bhagalpur (Barari ghat)
Minimum 7.8 6.8 2.5 2800 1100 Maximum 8.0 8.5 2.8 16000 5000 Average 7.9 7.9 2.6 5560 2040
18. Ganga at Sultanganj ( D/S )
Minimum 7.7 7.8 2.4 2400 800 Maximum 8.0 8.4 2.7 16000 2400 Average 7.9 8.0 2.5 4366 1622
19. Ganga at U/S Sultanganj.
Minimum 7.7 7.8 2.4 2200 900 Maximum 8.1 8.5 2.6 16000 9000 Average 7.9 8.1 2.5 5012 2400
20. Ganga at Barahia.
Minimum 7.9 7.4 2.2 2800 1100 Maximum 8.1 8.4 2.7 24000 5000 Average 8.02 8.0 2.4 8150 2125
21. Ganga at Kahalgaon.
Minimum 7.8 7.5 2.4 3000 1700 Maximum 8.0 8.6 2.9 24000 9000 Average 7.9 8.1 2.7 10909 4200
Water Quality Status of River Ganga during the Year (2013-2014)
Sl.No
Sampling Station
pH
D.O mg/L
B.O.D mg/L
T.C MPN/100 mL
F.C MPN/100 mL
1. Ganga at Buxar (Chausa)
Minimum 7.45 7.8 2.4 2800 1100 Maximum 8.28 8.8 2.6 9000 3000 Average 8.06 8.25 2.5 4978 1833
2. Ganga at Ramrekha ghat Buxar
Minimum 7.58 7.6 2.6 5000 2200 Maximum 8.25 8.7 2.8 24000 9000 Average 8.04 8.04 2.7 13444 4622
3. Ganga at D/S Buxar near Ganga Road Bridge.
Minimum 7.54 7.4 2.4 3000 1100 Maximum 8.27 8.8 2.7 16000 5000 Average 8.03 8.1 2.6 8777 2644
4. Ganga at Danapur near Pipapul
Minimum 7.46 7.3 2.4 3000 1100 Maximum 8.26 9.7 2.7 16000 2200 Average 8.01 8.16 2.56 5272 1645
5. Ganga at Kurji U/S Patna.
Minimum 7.8 7.5 2.3 2200 1100 Maximum 8.28 9.7 2.7 9000 5000 Average 8.08 8.2 2.5 4582 2082
6. Ganga at Darbhanga ghat, Patna.
Minimum 7.76 7.2 2.5 9000 2400 Maximum 8.18 9.2 2.9 24000 9000 Average 7.95 7.92 2.7 18454 6218
7. Ganga at Gaighat D/S Patna.
Minimum 7.71 7.0 2.6 5000 1400 Maximum 8.22 9.3 3.0 24000 9000 Average 7.98 8.0 2.75 14272 4436
8. Ganga at Malsalami, Patna City.
Minimum 7.73 7.5 2.1 2400 800 Maximum 8.34 9.4 2.7 9000 3000 Average 8.01 8.2 2.5 4200 1545
9. Ganga at Kewalaghat, Fatuha.
Minimum 7.63 7.5 2.0 2200 800 Maximum 8.34 9.6 2.7 9000 3000 Average 7.95 8.2 2.5 5140 1710
10. Ganga at the Confluence of Sone River at Doriganj, Chapra.
Minimum 7.8 7.4 2.4 2400 800 Maximum 8.34 9.0 2.6 5000 2400 Average 8.18 8.28 2.5 3400 1362
11. Ganga at U/S Mokama near B.M.P. Camp.
Minimum 7.8 6.1 2.3 2200 1100 Maximum 8.1 8.6 2.6 5000 1700 Average 7.92 7.71 2.46 3127 1390
12. Ganga at D/S Mokama near Rajendra Bridge.
Minimum 7.6 5.9 2.6 5000 1700 Maximum 8.0 8.4 2.9 24000 5000 Average 7.8 7.6 2.78 12545 3918
13. Ganga at Barh Minimum 7.6 5.9 2.2 1700 800

70
Maximum 8.1 8.6 2.5 3500 1400 Average 7.9 7.7 2.4 2633 1116
14. Ganga at U/S Munger (Near Steamer Ghat.
Minimum 7.8 6.1 2.2 1700 700 Maximum 8.1 8.5 2.6 5000 1700 Average 7.9 7.6 2.4 2675 1125
15. Ganga at D/S Munger near Kasth Harni Ghat.
Minimum 7.6 5.8 2.4 2200 1100 Maximum 8.0 7.8 2.7 5000 3000 Average 7.8 7.4 2.5 3745 1554
16. Ganga at Bhagalpur D/S ( Ganga Bridge)
Minimum 7.7 5.9 2.4 3000 1300 Maximum 8.0 8.5 2.8 9000 3000 Average 7.8 7.5 2.6 6500 2392
17. Ganga at U/S Bhagalpur (Barari ghat)
Minimum 7.7 6.0 2.4 2400 800 Maximum 8.0 8.5 2.7 5000 1700 Average 7.9 7.7 2.5 3066 1242
18. Ganga at Sultanganj ( D/S )
Minimum 7.7 5.9 2.4 2200 800 Maximum 8.0 8.5 2.7 5000 1700 Average 7.8 7.5 2.5 3100 1400
19. Ganga at U/S Sultanganj.
Minimum 7.6 6.0 2.3 2200 800 Maximum 8.0 8.6 2.6 3500 2200 Average 7.8 7.7 2.4 2642 1283
20. Ganga at Barahia.
Minimum 7.6 6.0 2.0 2200 800 Maximum 8.1 8.5 2.6 3000 1700 Average 7.88 7.4 2.4 2700 1150
21. Ganga at Kahalgaon near Jahaj ghat.
Minimum 7.8 6.0 2.5 5000 1400 Maximum 8.1 8.6 2.9 9000 3000 Average 7.94 7.7 2.7 7000 2642
Water Quality Status of River Ganga during the Year (2014-2015)
Sl.No
Sampling Station
pH
D.O mg/L
B.O.D mg/L
T.C MPN/100mL
F.C MPN/100mL
1. Ganga at Chausa (Mahdaba Ghat) Buxar
Minimum 7.80 7.8 2.3 2400 800 Maximum 9.27 9.8 2.8 4600 1500 Average 8.45 8.56 2.4 3066 1140
2. Ganga at Ramrekha ghat Buxar
Minimum 7.6 7.6 2.6 9000 500 Maximum 9.28 9.0 2.8 16000 5400 Average 8.40 8.18 2.7 10016 3216
3. Ganga at D/S Buxar near Ganga Bridge.
Minimum 7.6 7.8 2.4 2400 430 Maximum 9.25 9.6 2.7 9200 2400 Average 8.46 8.4 2.5 5016 1805
4. Ganga at Danapur near Pipapul
Minimum 7.78 7.2 2.0 1700 500 Maximum 9.21 9.4 2.6 3500 1700 Average 8.34 8.2 2.2 2545 1070
5. Ganga at U/S Patna, Kurji
Minimum 7.68 7.4 2.0 2200 700 Maximum 9.15 9.3 2.5 5400 2400 Average 8.27 8.1 2.3 3490 1609
6. Ganga at Darbhanga ghat, Patna.
Minimum 7.56 7.1 2.4 16000 5000 Maximum 9.08 8.8 2.9 24000 9200 Average 8.09 7.8 2.7 21090 7254
7. Ganga at D/S Patna, Gaighat
Minimum 7.64 7.0 2.5 9000 1400 Maximum 9.16 9.0 2.8 24000 9000 Average 8.19 7.9 2.6 12563 4200
8. Ganga at Malsalami,
Minimum 7.55 7.2 2.2 2200 800 Maximum 9.17 9.3 2.6 16000 3500

71
Patna City. Average 8.16 8.05 2.3 5000 1810 9. Ganga at the
Confluence of Sone River at Doriganj, Chapra.
Minimum 7.80 7.6 2.0 2800 700 Maximum 8.31 8.4 2.7 9200 3500 Average 8.09 8.04 2.4 4200 1580
10. Ganga at Kewalaghat, Fatuha.
Minimum 7.71 7.0 2.0 2200 800 Maximum 9.11 9.2 2.5 9000 3000 Average 8.18 8.1 2.2 4982 1836
11. Ganga at U/S Mokama near B.M.P. Camp.
Minimum 7.8 7.5 2.0 1700 790 Maximum 8.2 8.6 2.5 5000 2400 Average 8.0 7.9 2.2 2400 1141
12. Ganga at D/S Mokama near Rajendra Bridge.
Minimum 7.7 7.2 2.2 2800 920 Maximum 8.1 8.4 2.8 16000 5000 Average 7.8 7.8 2.5 9430 2742
13. Ganga at Barh Minimum 7.8 7.5 2.0 1400 900 Maximum 8.0 8.0 2.4 3000 1700 Average 7.9 7.7 2.1 2666 1173
14. Ganga at D/S Munger near Kastharani Ghat.
Minimum 7.7 7.4 2.1 2400 1100 Maximum 8.0 8.5 2.5 9000 3000 Average 7.9 7.8 2.3 4612 1712
15. Ganga at U/S Munger near Steamer Ghat
Minimum 7.8 7.6 2.0 1700 790 Maximum 8.0 8.5 2.5 3000 1300 Average 7.9 7.9 2.0 2342 940
16. Ganga at D/S Bhagalpur, near Ganga Bridge.
Minimum 7.6 7.5 2.1 3000 1400 Maximum 8.1 8.4 2.7 24000 9200 Average 7.8 7.8 2.5 9488 3333
17. Ganga at U/S Bhagalpur near Barari Ghat.
Minimum 7.8 7.6 2.0 1700 800 Maximum 8.1 8.5 2.6 5400 2200 Average 7.9 7.9 2.3 2850 1320
18. Ganga at D/S Sultanganj
Minimum 7.6 7.5 2.0 2200 940 Maximum 7.9 8.2 2.7 5400 2400 Average 7.8 7.8 2.4 4162 1655
19. Ganga at U/S Sultanganj.
Minimum 7.8 7.5 2.0 2400 790 Maximum 8.0 8.5 2.6 3500 1700 Average 7.9 7.9 2.2 2971 1197
20. Ganga at Barahiaya.
Minimum 7.7 6.9 2.0 1700 700 Maximum 8.1 8.6 2.6 3500 1400 Average 7.9 7.7 2.2 2712 1073
21. Ganga at Kahalgaon near Jahaj Ghat.
Minimum 7.8 7.6 2.4 5000 1300 Maximum 8.2 8.6 2.8 16000 5000 Average 7.9 7.9 2.6 8511 2522
Water Quality Status of River Ganga during the Year (2015-2016)
Sl.No
Sampling Station
pH
D.O mg/L
B.O.D mg/L
T.C MPN/100mL
F.C MPN/100mL
1. Ganga at Chausa (Mahdaba Ghat) Buxar
Minimum 7.76 7.9 2.2 3000 1100 Maximum 8.54 10.2 2.5 9000 1700 Average 8.24 8.7 2.38 4000 1625
2. Ganga at Ramrekha ghat Buxar
Minimum 8.0 7.7 2.7 9000 3000 Maximum 8.61 9.8 2.9 24000 9000 Average 8.24 8.5 2.8 14375 4750
3. Ganga at D/S Buxar near Ganga Bridge.
Minimum 7.99 7.8 2.5 5000 1300 Maximum 8.54 9.8 2.7 16000 5000 Average 8.20 8.47 2.6 8375 2375

72
4. Ganga at Danapur near Pipapul
Minimum 7.52 7.6 2.0 1700 700 Maximum 9.15 8.8 2.5 5000 1700 Average 8.49 8.24 2.24 2527 1072
5. Ganga at U/S Patna, Kurji
Minimum 7.86 7.4 2.0 2200 800 Maximum 9.06 8.6 2.6 9000 3000 Average 8.51 8.25 2.35 3500 1509
6. Ganga at Darbhanga ghat, Patna.
Minimum 7.61 7.4 2.7 9000 2800 Maximum 8.78 8.4 3.0 24000 16000 Average 8.28 7.8 2.8 22636 9709
7. Ganga at D/S Patna, Gaighat
Minimum 7.89 6.9 2.6 5000 1700 Maximum 8.86 8.6 2.8 24000 9000 Average 8.46 7.9 2.7 15545 4400
8. Ganga at Malsalami, Patna City.
Minimum 7.80 7.4 2.0 2400 800 Maximum 9.16 8.5 2.7 9000 3000 Average 8.36 7.9 2.4 4181 1618
9. Ganga at the Confluence of Sone River at Doriganj, Chapra.
Minimum 7.93 7.9 2.2 1100 500 Maximum 8.49 8.7 2.8 9000 3000 Average 8.30 8.32 2.5 3828 1357
10. Ganga at Kewalaghat, Fatuha.
Minimum 7.66 7.0 2.1 2400 800 Maximum 8.87 8.6 2.6 16000 5000 Average 8.49 7.9 2.4 4618 1754
11. Ganga at U/S Mokama near B.M.P. Camp.
Minimum 7.7 7.0 2.0 1700 800 Maximum 8.6 9.8 2.5 5000 1700 Average 8.0 7.9 2.25 2754 1136
12. Ganga at D/S Mokama near Rajendra Bridge.
Minimum 7.6 7.5 2.5 1700 800 Maximum 8.0 9.6 2.8 24000 9000 Average 7.8 7.9 2.7 9154 3190
13. Ganga at Barh Minimum 7.9 7.8 2.0 1300 700 Maximum 8.1 9.8 2.6 9000 1700 Average 8.03 8.07 2.3 3380 1160
14. Ganga at D/S Munger near Kastharani Ghat.
Minimum 7.6 7.5 2.2 1700 500 Maximum 8.0 9.7 2.7 16000 5000 Average 7.84 8.07 2.5 4590 1582
15. Ganga at U/S Munger near Steamer Ghat
Minimum 7.8 7.6 2.0 1300 500 Maximum 8.0 9.8 2.4 5000 1700 Average 7.9 8.17 2.15 2990 1010
16.
Ganga at D/S Bhagalpur, near Ganga Bridge.
Minimum 7.5 7.5 2.4 2400 800 Maximum 8.1 9.4 2.7 16000 5000 Average 7.85 8.05 2.57 8127 2518
17. Ganga at U/S Bhagalpur near Barari Ghat.
Minimum 7.8 7.6 2.0 1700 800 Maximum 8.1 9.6 2.5 9000 2400 Average 7.9 8.17 2.3 3518 1390
18. Ganga at D/S Sultanganj
Minimum 7.6 7.5 2.4 2200 900 Maximum 8.0 9.4 2.6 9000 3000 Average 7.8 8.08 2.5 4318 1481
19. Ganga at U/S Sultanganj.
Minimum 7.7 7.6 2.0 110 500 Maximum 8.1 9.6 2.6 5000 1400 Average 7.9 8.14 2.2 2309 863
20. Ganga at Barahiaya.
Minimum 7.8 7.7 1.8 1700 700 Maximum 8.0 8.2 2.5 3000 1700 Average 7.9 8.0 2.15 2600 1066
21. Ganga at Kahalgaon near Jahaj Ghat.
Minimum 7.9 7.6 2.0 3000 1300 Maximum 8.1 9.6 2.8 16000 5000 Average 8.01 8.2 2.5 6900 2260

73
Water Quality Status of River Ganga during the Year (2016-2017)
Sl.No
Sampling Station
pH
D.O mg/L
B.O.D mg/L
T.C MPN/100mL
F.C MPN/100mL
1. Ganga at Chausa (Mahdaba Ghat) Buxar
Minimum 7.46 6.0 1.3 2600 900 Maximum 8.33 9.2 2.9 5000 2600 Average 7.88 7.29 2.31 3550 1520
2. Ganga at Ramrekha ghat Buxar
Minimum 7.36 5.5 0.8 3000 1100 Maximum 8.30 9.1 2.7 5000 2600 Average 7.71 7.9 2.4 3850 1770
3. Ganga at D/S Buxar near Ganga Bridge.
Minimum 7.49 5.2 0.5 3000 400 Maximum 8.27 9.0 2.9 5000 2600 Average 7.78 8.05 2.35 3430 1420
4. Ganga at Danapur near Pipapul
Minimum 7.14 2.6 1.7 2200 700 Maximum 8.38 9.2 4.5 8000 2200 Average 7.78 7.38 2.7 3808 1600
5. Ganga at U/S Patna, Kurji
Minimum 7.24 3.5 1.8 3000 1300 Maximum 8.46 9.0 4.5 4800 2600 Average 7.8 7.52 2.7 3630 1723
6. Ganga at Darbhanga ghat, Patna.
Minimum 7.14 3.4 2.2 3000 900 Maximum 8.84 9.2 7.2 4800 2300 Average 7.75 7.4 3.0 3715 1761
7. Ganga at D/S Patna, Gaighat
Minimum 7.22 3.5 2.3 2200 800 Maximum 8.60 8.7 2.8 5000 2300 Average 7.73 7.4 2.7 3723 1800
8. Ganga at Malsalami, Patna City.
Minimum 7.29 3.5 2.2 3100 1200 Maximum 8.48 9.0 7.2 5000 3100 Average 7.74 7.5 2.9 4021 1764
9. Ganga at Kewalaghat, Fatuha.
Minimum 7.23 3.5 2.0 2800 900 Maximum 8.35 9.2 4.5 5000 2600 Average 7.76 7.32 2.7 3842 1700
10. Ganga at the Confluence of Sone River at Doriganj, Chapra.
Minimum 7.65 7.0 1.7 2100 1100 Maximum 8.4 9.6 2.8 4800 1800 Average 7.89 8.2 2.4 3183 1475
11. Ganga at U/S Mokama.
Minimum 7.9 7.6 1.0 2200 800 Maximum 8.1 9.2 2.8 5000 2200 Average 8.0 8.0 2.3 3100 1333
12. Ganga at D/S Mokama near Rajendra Bridge (Simaria Ghat)
Minimum 7.46 6.2 2.1 2400 900 Maximum 8.0 8.9 4.1 5000 2200 Average 7.84 7.76 2.6 3633 1508
13. Ganga at Barh Minimum 7.8 7.6 1.1 2600 1100 Maximum 8.1 9.3 2.9 5000 2700 Average 7.9 8.05 2.4 3891 1816
14. Ganga at D/S Munger near Kastharani Ghat.
Minimum 7.6 6.4 2.1 3000 1100 Maximum 7.9 9.0 7.4 8000 2600 Average 7.7 7.7 3.2 4535 1721
15. Ganga at U/S Munger near Steamer Ghat
Minimum 7.8 7.1 2.0 3000 700 Maximum 8.1 9.2 7.2 5000 2300 Average 7.9 7.9 3.2 3777 1677
16.
Ganga at D/S Bhagalpur, near Ganga
Minimum 7.6 6.8 1.9 3800 800 Maximum 7.9 9.1 7.4 5000 2600 Average 7.8 7.7 2.9 4371 1900
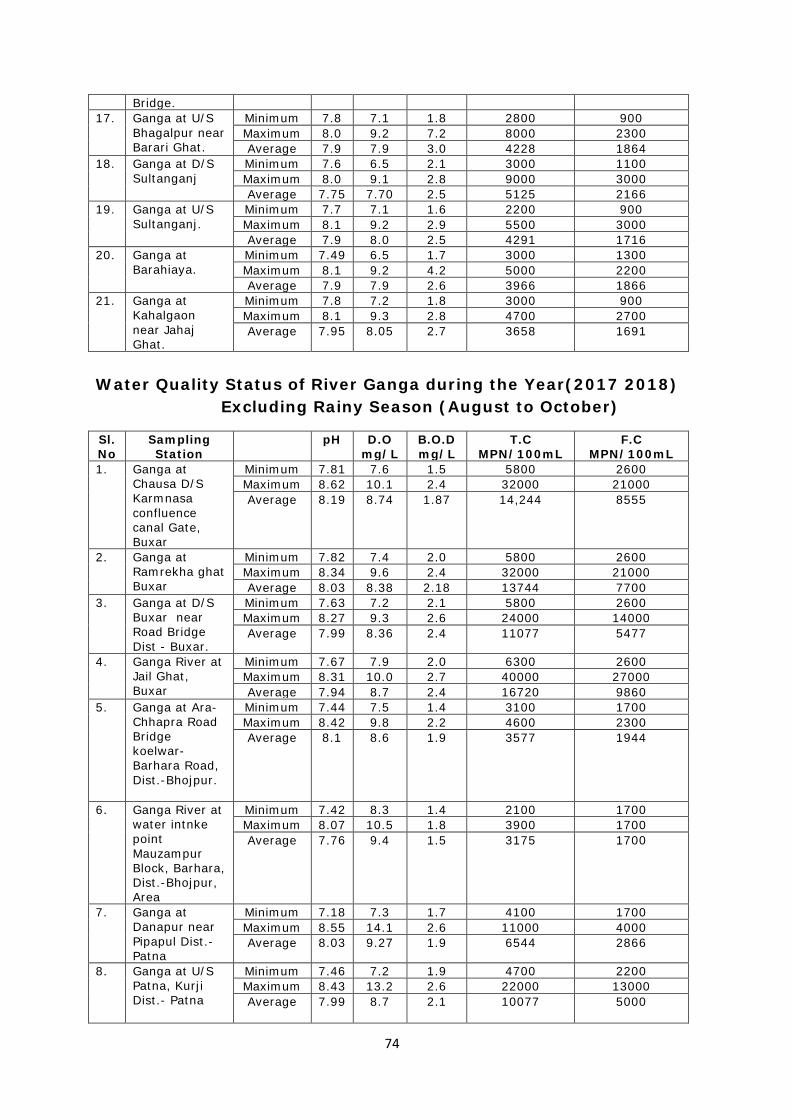
74
Bridge. 17. Ganga at U/S
Bhagalpur near Barari Ghat.
Minimum 7.8 7.1 1.8 2800 900 Maximum 8.0 9.2 7.2 8000 2300 Average 7.9 7.9 3.0 4228 1864
18. Ganga at D/S Sultanganj
Minimum 7.6 6.5 2.1 3000 1100 Maximum 8.0 9.1 2.8 9000 3000 Average 7.75 7.70 2.5 5125 2166
19. Ganga at U/S Sultanganj.
Minimum 7.7 7.1 1.6 2200 900 Maximum 8.1 9.2 2.9 5500 3000 Average 7.9 8.0 2.5 4291 1716
20. Ganga at Barahiaya.
Minimum 7.49 6.5 1.7 3000 1300 Maximum 8.1 9.2 4.2 5000 2200 Average 7.9 7.9 2.6 3966 1866
21. Ganga at Kahalgaon near Jahaj Ghat.
Minimum 7.8 7.2 1.8 3000 900 Maximum 8.1 9.3 2.8 4700 2700 Average 7.95 8.05 2.7 3658 1691
Water Quality Status of River Ganga during the Year(2017 2018) Excluding Rainy Season (August to October)
Sl.No
Sampling Station
pH
D.O mg/L
B.O.D mg/L
T.C MPN/100mL
F.C MPN/100mL
1. Ganga at Chausa D/S Karmnasa confluence canal Gate, Buxar
Minimum 7.81 7.6 1.5 5800 2600 Maximum 8.62 10.1 2.4 32000 21000 Average 8.19 8.74 1.87 14,244 8555
2. Ganga at Ramrekha ghat Buxar
Minimum 7.82 7.4 2.0 5800 2600 Maximum 8.34 9.6 2.4 32000 21000 Average 8.03 8.38 2.18 13744 7700
3. Ganga at D/S Buxar near Road Bridge Dist - Buxar.
Minimum 7.63 7.2 2.1 5800 2600 Maximum 8.27 9.3 2.6 24000 14000 Average 7.99 8.36 2.4 11077 5477
4. Ganga River at Jail Ghat, Buxar
Minimum 7.67 7.9 2.0 6300 2600 Maximum 8.31 10.0 2.7 40000 27000 Average 7.94 8.7 2.4 16720 9860
5. Ganga at Ara-Chhapra Road Bridge koelwar-Barhara Road, Dist.-Bhojpur.
Minimum 7.44 7.5 1.4 3100 1700 Maximum 8.42 9.8 2.2 4600 2300 Average 8.1 8.6 1.9 3577 1944
6. Ganga River at water intnke point Mauzampur Block, Barhara, Dist.-Bhojpur, Area
Minimum 7.42 8.3 1.4 2100 1700 Maximum 8.07 10.5 1.8 3900 1700 Average 7.76 9.4 1.5 3175 1700
7. Ganga at Danapur near Pipapul Dist.- Patna
Minimum 7.18 7.3 1.7 4100 1700 Maximum 8.55 14.1 2.6 11000 4000 Average 8.03 9.27 1.9 6544 2866
8. Ganga at U/S Patna, Kurji Dist.- Patna
Minimum 7.46 7.2 1.9 4700 2200 Maximum 8.43 13.2 2.6 22000 13000 Average 7.99 8.7 2.1 10077 5000

75
9. Ganga River at Gulabi Ghat, Patna.
Minimum 7.1 7.4 2.5 11000 4000 Maximum 7.82 13.0 2.8 92000 26000 Average 7.6 9.1 2.6 34000 13020
10. Ganga at Gandhighat, NIT, Patna
Minimum 7.69 6.5 2.4 4600 2100 Maximum 8.44 13.0 2.9 28000 17000 Average 7.92 8.4 2.6 13100 6311
11. Ganga at D/S Patna, Gaighat Dist.-Patna.
Minimum 7.01 7.0 1.9 3400 1700 Maximum 8.74 11.7 2.8 32000 17000 Average 7.86 8.3 2.5 15244 7222
12. Ganga at Malsalami, Patna City Dist.-Patna.
Minimum 7.52 6.2 1.6 3100 2100 Maximum 8.70 10.5 2.7 1,70,000 34000 Average 8.04 8.4 2.3 26944 4677
13. Ganga Before Confluence of punpun River at Triveni Ghat Fatuha, Patna Dist.- Patna.
Minimum 7.52 6.0 2.0 8400 4000 Maximum 8.60 9.5 2.6 32000 21000 Average 7.95 8.02 2.3 17533 9611
14. Ganga at Kewala ghat, Fatuha Dist.-Patna.
Minimum 7.34 6.0 1.7 4000 1700 Maximum 8.80 11.2 2.8 15000 11000 Average 7.9 8.2 2.3 7833 4111
15. Ganga at U/S Mokama, Mahadeo Asthan Dist.-Patna
Minimum 7.37 7.5 1.8 3300 1700 Maximum 8.24 9.8 2.7 32000 21000 Average 7.78 8.5 2.1 8277 4555
16.
Ganga at D/S Mokama near Rajendra Bridge, Simaria Ghat Patna.
Minimum 7.42 6.4 2.2 5800 2600 Maximum 8.05 10.2 2.8 40000 27000 Average 7.72 8.2 2.6 13122 6788
17. Ganga at Barh Dist.-Patna. (Uma Nath Ghat)
Minimum 7.14 7.2 1.8 3400 1700 Maximum 8.30 11.2 2.5 14000 6100 Average 7.68 8.5 2.2 6022 2922
18. Ganga U/S of NTPC water intake point, Barh Dist- Patna
Minimum 7.32 7.4 1.6 3100 2100 Maximum 8.47 10.0 2.6 23000 13000 Average 7.83 8.5 2.0 6711 3666
19. Ganga D/S of NTPC water intake point, Barh Dist.-Patna
Minimum 7.43 7.5 1.8 3400 1700 Maximum 8.13 11.0 2.6 26000 17000 Average 7.75 8.5 2.1 7700 4233
20. Ganga at Barahiya, Nepaly Tola, Maranchi Dist.- Lakhisarai.
Minimum 7.40 6.9 2.0 3600 1700 Maximum 7.94 9.8 2.6 38000 26000 Average 7.62 8.2 2.4 10075 5825
21. Ganga at U/S Munger near Kasth harini ghat, Dist.- Munger.
Minimum 7.21 7.2 1.6 3400 1700 Maximum 8.0 9.6 2.5 79000 27000 Average 7.69 8.2 2.0 21533 9911
22. Ganga at D/S Munger near Crematorium Ghat Dist.- Munger.
Minimum 7.6 5.8 1.7 4000 2100 Maximum 8.02 9.9 2.6 92000 27000 Average 7.81 8.0 2.0 31811 12544
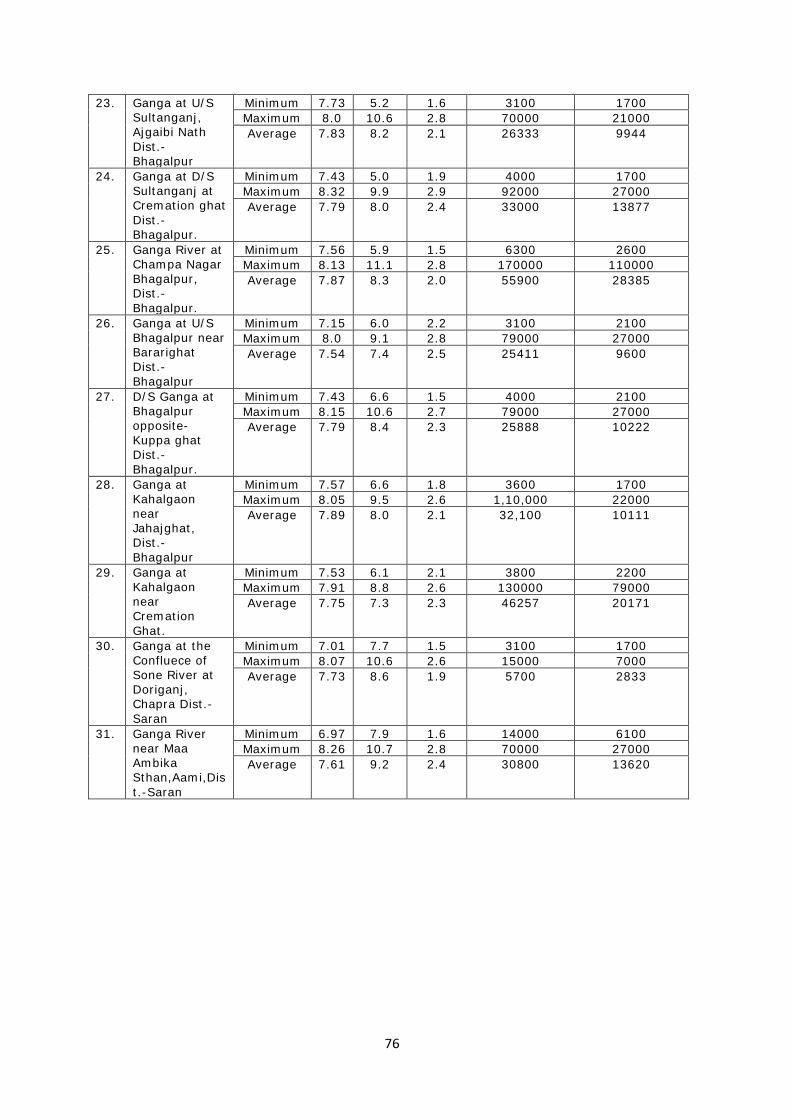
76
23. Ganga at U/S Sultanganj, Ajgaibi Nath Dist.- Bhagalpur
Minimum 7.73 5.2 1.6 3100 1700 Maximum 8.0 10.6 2.8 70000 21000 Average 7.83 8.2 2.1 26333 9944
24. Ganga at D/S Sultanganj at Cremation ghat Dist.-Bhagalpur.
Minimum 7.43 5.0 1.9 4000 1700 Maximum 8.32 9.9 2.9 92000 27000 Average 7.79 8.0 2.4 33000 13877
25. Ganga River at Champa Nagar Bhagalpur, Dist.- Bhagalpur.
Minimum 7.56 5.9 1.5 6300 2600 Maximum 8.13 11.1 2.8 170000 110000 Average 7.87 8.3 2.0 55900 28385
26. Ganga at U/S Bhagalpur near Bararighat Dist.- Bhagalpur
Minimum 7.15 6.0 2.2 3100 2100 Maximum 8.0 9.1 2.8 79000 27000 Average 7.54 7.4 2.5 25411 9600
27. D/S Ganga at Bhagalpur opposite-Kuppa ghat Dist.- Bhagalpur.
Minimum 7.43 6.6 1.5 4000 2100 Maximum 8.15 10.6 2.7 79000 27000 Average 7.79 8.4 2.3 25888 10222
28. Ganga at Kahalgaon near Jahajghat, Dist.- Bhagalpur
Minimum 7.57 6.6 1.8 3600 1700 Maximum 8.05 9.5 2.6 1,10,000 22000 Average 7.89 8.0 2.1 32,100 10111
29. Ganga at Kahalgaon near Cremation Ghat.
Minimum 7.53 6.1 2.1 3800 2200 Maximum 7.91 8.8 2.6 130000 79000 Average 7.75 7.3 2.3 46257 20171
30. Ganga at the Confluece of Sone River at Doriganj, Chapra Dist.- Saran
Minimum 7.01 7.7 1.5 3100 1700 Maximum 8.07 10.6 2.6 15000 7000 Average 7.73 8.6 1.9 5700 2833
31. Ganga River near Maa Ambika Sthan,Aami,Dist.-Saran
Minimum 6.97 7.9 1.6 14000 6100 Maximum 8.26 10.7 2.8 70000 27000 Average 7.61 9.2 2.4 30800 13620

77
Annexure-3 Year wise Water Quality Monitoring Data of
Other Polluted River Stretches Water Quality Status of Parmar River at Jogbani during the Year (2013-2014 to 2017-18.)
Year
pH
D.O. mg/L
B.O.D. mg/L
T.C. MPN/100mL
F.C. MPN/100mL
2013-14 Minimum 7.5 6.1 2.5 2200 1100 Maximum 7.8 7.6 2.7 5000 2200 Average 7.6 6.8 2.6 3200 1344
2014-15 Minimum 6.6 6.4 2.0 2200 800 Maximum 7.7 7.8 2.7 5400 2400 Average 7.4 7.1 2.3 3214 1242
2015-16 Minimum 7.3 6.4 2.0 2800 900 Maximum 7.6 7.8 2.6 9000 3000 Average 7.47 7.2 2.5 4380 1610
2016-17 Minimum 6.6 4.2 1.2 3000 700 Maximum 8.09 8.6 3.6 7000 2300 Average 7.41 6.85 2.5 4258 1741
2017-18 Minimum 7.32 6.4 1.6 3100 2100 Maximum 8.08 8.4 2.9 70000 21000 Average 7.66 7.6 2.5 12175 4425
Water Quality Status of Sirsia River at Raxaul (Near Custom Office) during the Year (2013-2014 to 2017-18.)
Year
pH
D.O. mg/L
B.O.D. mg/L
T.C. MPN/100mL
F.C. MPN/100mL
2013-14 Minimum 7.68 0.0 2.9 16000 3000 Maximum 8.10 6.0 15 24000 9000 Average 7.69 4.2 7.0 17600 5400
2014-15 Minimum 6.88 0.0 3.0 16000 5000 Maximum 7.66 4.8 14.0 24000 5000 Average 7.33 4.1 10.0 18666 5000
2015-16 Minimum 7.16 0.0 1.8 9000 500
Maximum 8.24 8.2 18 24000 3000 Average 7.84 4.51 6.98 16285 1757
2016-17 Minimum 6.99 Nil 7.0 4100 2000 Maximum 7.79 2.5 12.0 9000 5000 Average 7.35 0.20 9.03 6425 3075
2017-18 Minimum 6.90 0.0 8.0 5600 2600 Maximum 8.01 2.1 15.0 15000 7000 Average 7.36 0.26 11.6 7912 3537
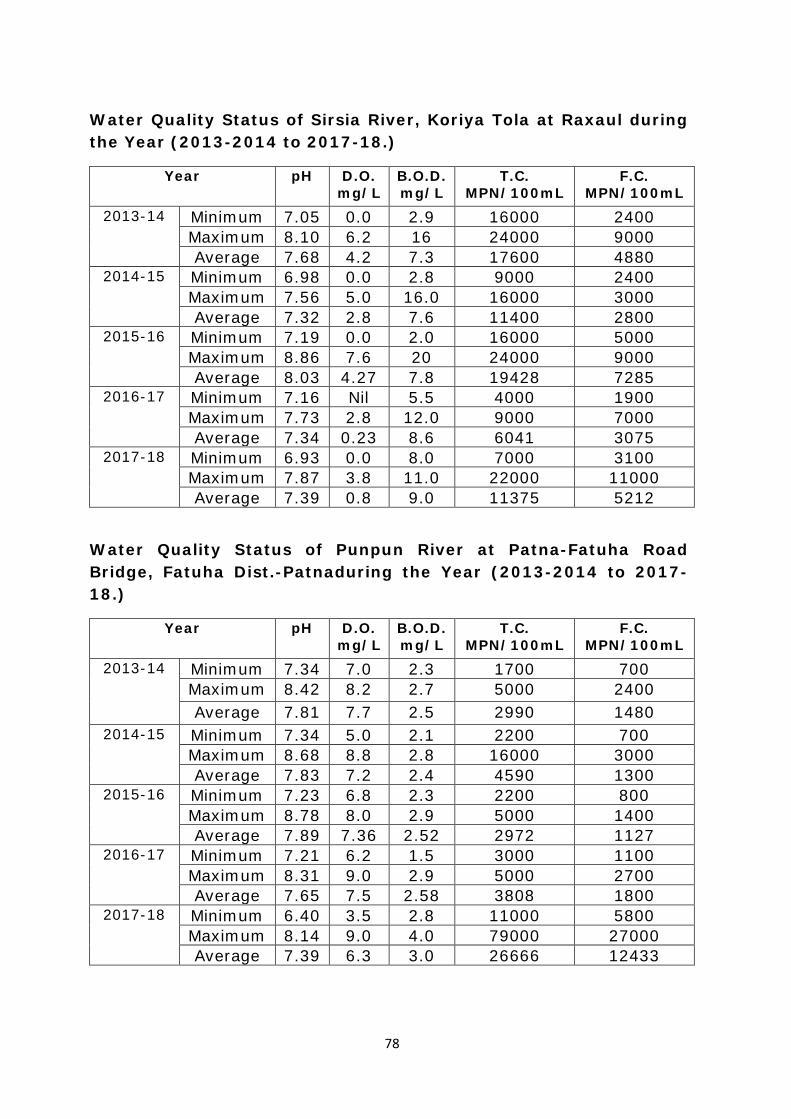
78
Water Quality Status of Sirsia River, Koriya Tola at Raxaul during the Year (2013-2014 to 2017-18.)
Year
pH
D.O. mg/L
B.O.D. mg/L
T.C. MPN/100mL
F.C. MPN/100mL
2013-14 Minimum 7.05 0.0 2.9 16000 2400 Maximum 8.10 6.2 16 24000 9000 Average 7.68 4.2 7.3 17600 4880
2014-15 Minimum 6.98 0.0 2.8 9000 2400 Maximum 7.56 5.0 16.0 16000 3000 Average 7.32 2.8 7.6 11400 2800
2015-16 Minimum 7.19 0.0 2.0 16000 5000 Maximum 8.86 7.6 20 24000 9000 Average 8.03 4.27 7.8 19428 7285
2016-17 Minimum 7.16 Nil 5.5 4000 1900 Maximum 7.73 2.8 12.0 9000 7000 Average 7.34 0.23 8.6 6041 3075
2017-18 Minimum 6.93 0.0 8.0 7000 3100 Maximum 7.87 3.8 11.0 22000 11000 Average 7.39 0.8 9.0 11375 5212
Water Quality Status of Punpun River at Patna-Fatuha Road Bridge, Fatuha Dist.-Patnaduring the Year (2013-2014 to 2017-18.)
Year
pH
D.O. mg/L
B.O.D. mg/L
T.C. MPN/100mL
F.C. MPN/100mL
2013-14 Minimum 7.34 7.0 2.3 1700 700 Maximum 8.42 8.2 2.7 5000 2400 Average 7.81 7.7 2.5 2990 1480
2014-15 Minimum 7.34 5.0 2.1 2200 700 Maximum 8.68 8.8 2.8 16000 3000 Average 7.83 7.2 2.4 4590 1300
2015-16 Minimum 7.23 6.8 2.3 2200 800 Maximum 8.78 8.0 2.9 5000 1400 Average 7.89 7.36 2.52 2972 1127
2016-17 Minimum 7.21 6.2 1.5 3000 1100 Maximum 8.31 9.0 2.9 5000 2700 Average 7.65 7.5 2.58 3808 1800
2017-18 Minimum 6.40 3.5 2.8 11000 5800 Maximum 8.14 9.0 4.0 79000 27000 Average 7.39 6.3 3.0 26666 12433

79
Water Quality Status of Punpun River at Punpun near Railway Bridge during the Year (2013-2014 to 2017-18.)
Water Quality Status of Punpun River at Kinzer near Road Bridge during the Year (2013-2014 to 2017-18.)
Year
pH
D.O. mg/L
B.O.D. mg/L
T.C. MPN/100mL
F.C. MPN/100mL
2013-14 Minimum 7.8 7.1 2.0 1300 500 Maximum 8.29 8.6 2.4 2200 800 Average 7.93 7.7 2.3 1640 700
2014-15 Minimum 7.82 7.7 2.0 1300 500 Maximum 8.39 8.2 2.1 2200 700 Average 8.01 7.8 2.05 1650 600
2015-16 Minimum 7.12 6.9 1.4 1300 500 Maximum 8.67 8.1 2.2 3000 1700 Average 8.19 7.6 1.9 1971 971
2016-17 Minimum 7.24 6.5 1.8 3300 1100 Maximum 8.45 10.0 3.0 7000 2200 Average 7.78 8.2 2.6 4416 1733
2017-18 Minimum 7.51 6.6 1.5 4600 2100 Maximum 8.63 15.0 2.7 110000 22000 Average 7.99 8.9 2.3 37277 9333
Year
pH
D.O. mg/L
B.O.D. mg/L
T.C. MPN/100mL
F.C. MPN/100mL
2013-14 Minimum 7.57 7.0 2.0 1400 500 Maximum 8.29 8.5 2.6 2200 900 Average 7.87 7.6 2.3 1680 640
2014-15 Minimum 7.76 7.6 2.0 1700 700 Maximum 8.27 8.1 2.3 2800 790 Average 7.99 7.8 2.1 2300 760
2015-16 Minimum 7.0 7.2 2.0 1700 700 Maximum 8.68 8.2 2.5 9000 2200 Average 8.14 7.6 2.15 3088 1000
2016-17 Minimum 7.14 6.8 2.0 2200 1400 Maximum 8.64 9.6 3.3 7000 3000 Average 7.73 8.23 2.67 4675 2041
2017-18 Minimum 7.38 6.2 2.1 3300 1700 Maximum 8.47 12.1 2.9 130000 79000 Average 7.88 8.2 2.6 30077 15100
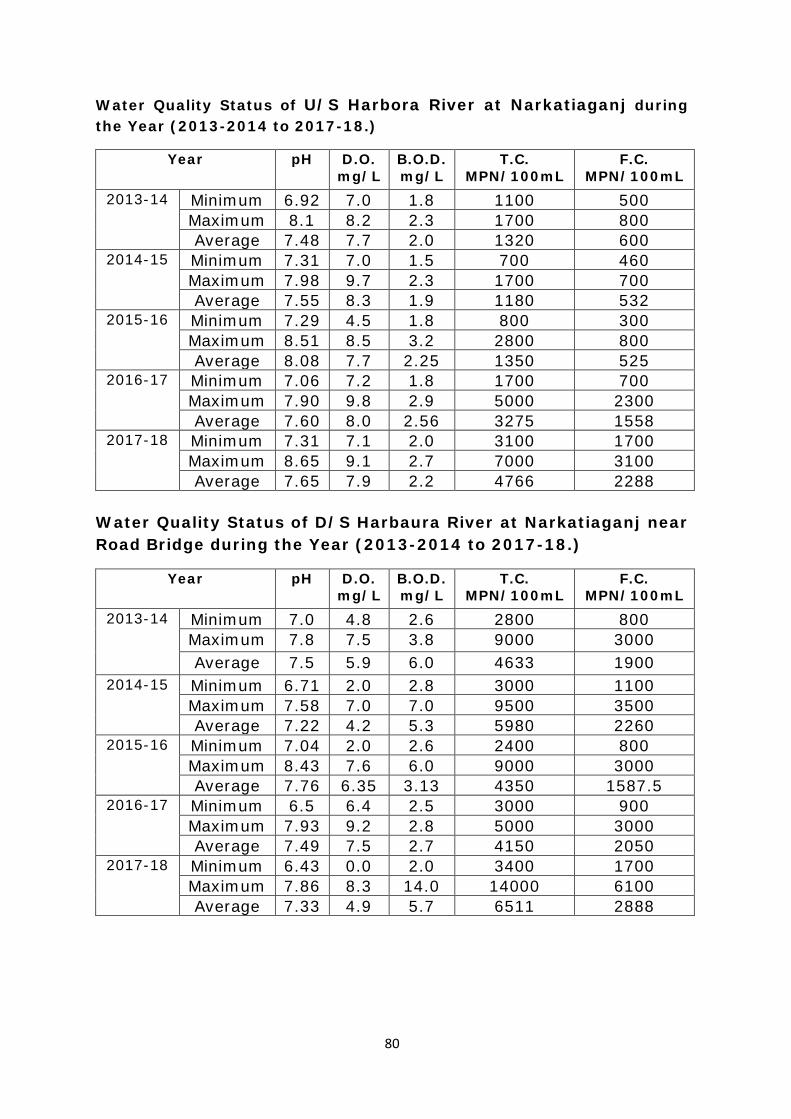
80
Water Quality Status of U/S Harbora River at Narkatiaganj during the Year (2013-2014 to 2017-18.)
Year
pH
D.O. mg/L
B.O.D. mg/L
T.C. MPN/100mL
F.C. MPN/100mL
2013-14 Minimum 6.92 7.0 1.8 1100 500 Maximum 8.1 8.2 2.3 1700 800 Average 7.48 7.7 2.0 1320 600
2014-15 Minimum 7.31 7.0 1.5 700 460 Maximum 7.98 9.7 2.3 1700 700 Average 7.55 8.3 1.9 1180 532
2015-16 Minimum 7.29 4.5 1.8 800 300 Maximum 8.51 8.5 3.2 2800 800 Average 8.08 7.7 2.25 1350 525
2016-17 Minimum 7.06 7.2 1.8 1700 700 Maximum 7.90 9.8 2.9 5000 2300 Average 7.60 8.0 2.56 3275 1558
2017-18 Minimum 7.31 7.1 2.0 3100 1700 Maximum 8.65 9.1 2.7 7000 3100 Average 7.65 7.9 2.2 4766 2288
Water Quality Status of D/S Harbaura River at Narkatiaganj near Road Bridge during the Year (2013-2014 to 2017-18.)
Year
pH
D.O. mg/L
B.O.D. mg/L
T.C. MPN/100mL
F.C. MPN/100mL
2013-14 Minimum 7.0 4.8 2.6 2800 800 Maximum 7.8 7.5 3.8 9000 3000 Average 7.5 5.9 6.0 4633 1900
2014-15 Minimum 6.71 2.0 2.8 3000 1100 Maximum 7.58 7.0 7.0 9500 3500 Average 7.22 4.2 5.3 5980 2260
2015-16 Minimum 7.04 2.0 2.6 2400 800 Maximum 8.43 7.6 6.0 9000 3000 Average 7.76 6.35 3.13 4350 1587.5
2016-17 Minimum 6.5 6.4 2.5 3000 900 Maximum 7.93 9.2 2.8 5000 3000 Average 7.49 7.5 2.7 4150 2050
2017-18 Minimum 6.43 0.0 2.0 3400 1700 Maximum 7.86 8.3 14.0 14000 6100 Average 7.33 4.9 5.7 6511 2888

81
Water Quality Status of U/S Ramrekha River at Harinagar during the Year (2013-2014 to 2017-18.)
Year
pH
D.O. mg/L
B.O.D. mg/L
T.C. MPN/100mL
F.C. MPN/100mL
2013-14 Minimum 7.09 5.5 2.0 1100 500 Maximum 7.92 8.0 3.7 2200 900 Average 7.51 7.2 2.4 1383 600
2014-15 Minimum 6.89 0.5 2.4 1300 500 Maximum 7.75 5.7 12.0 9000 2400 Average 7.33 3.8 5.8 3800 1438
2015-16 Minimum 7.09 5.9 2.0 2200 700 Maximum 8.18 8.4 3.6 3000 1100 Average 7.53 7.35 2.35 2475 850
2016-17 Minimum 7.09 6.9 1.8 3000 1100 Maximum 7.94 8.0 2.8 4700 2600 Average 7.43 7.5 2.5 3666 1833
2017-18 Minimum 6.58 3.6 1.9 3100 1700 Maximum 7.68 8.0 5.0 7000 3300 Average 7.14 6.1 2.9 4455 2266
Water Quality Status of D/S Ramrekha River at Harinagar during the Year (2013-2014 to 2017-18.)
Year
pH
D.O. mg/L
B.O.D. mg/L
T.C. MPN/100mL
F.C. MPN/100mL
2013-14 Minimum 6.80 0.0 2.7 5000 1300 Maximum 8.12 7.3 12 24000 5000 Average 7.34 4.15 6.0 10666 3100
2014-15 Minimum 6.51 0.0 2.9 9200 3000 Maximum 7.46 6.7 10.0 24000 9000 Average 6.85 2.8 7.6 16240 5180
2015-16 Minimum 6.88 2.0 2.5 5000 1700 Maximum 8.43 7.5 6.4 16000 5000 Average 7.57 6.28 3.1 9250 3025
2016-17 Minimum 6.9 6.4 2.0 3000 900 Maximum 7.85 7.6 2.8 5000 2300 Average 7.40 7.05 2.6 4216 1866
2017-18 Minimum 6.59 3.0 2.7 3400 1700 Maximum 7.78 7.3 5.0 11000 4000 Average 7.08 5.6 3.3 5500 2522
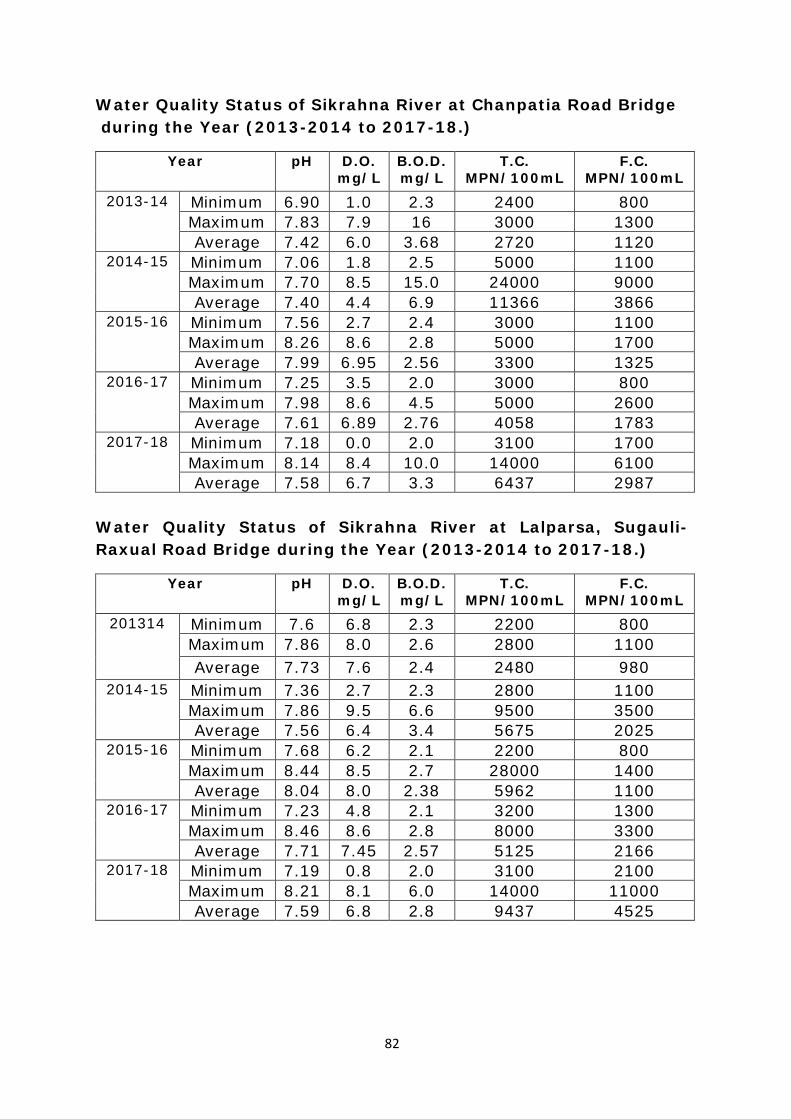
82
Water Quality Status of Sikrahna River at Chanpatia Road Bridge during the Year (2013-2014 to 2017-18.)
Year
pH
D.O. mg/L
B.O.D. mg/L
T.C. MPN/100mL
F.C. MPN/100mL
2013-14 Minimum 6.90 1.0 2.3 2400 800 Maximum 7.83 7.9 16 3000 1300 Average 7.42 6.0 3.68 2720 1120
2014-15 Minimum 7.06 1.8 2.5 5000 1100 Maximum 7.70 8.5 15.0 24000 9000 Average 7.40 4.4 6.9 11366 3866
2015-16 Minimum 7.56 2.7 2.4 3000 1100 Maximum 8.26 8.6 2.8 5000 1700 Average 7.99 6.95 2.56 3300 1325
2016-17 Minimum 7.25 3.5 2.0 3000 800 Maximum 7.98 8.6 4.5 5000 2600 Average 7.61 6.89 2.76 4058 1783
2017-18 Minimum 7.18 0.0 2.0 3100 1700 Maximum 8.14 8.4 10.0 14000 6100 Average 7.58 6.7 3.3 6437 2987
Water Quality Status of Sikrahna River at Lalparsa, Sugauli-Raxual Road Bridge during the Year (2013-2014 to 2017-18.)
Year
pH
D.O. mg/L
B.O.D. mg/L
T.C. MPN/100mL
F.C. MPN/100mL
201314 Minimum 7.6 6.8 2.3 2200 800 Maximum 7.86 8.0 2.6 2800 1100 Average 7.73 7.6 2.4 2480 980
2014-15 Minimum 7.36 2.7 2.3 2800 1100 Maximum 7.86 9.5 6.6 9500 3500 Average 7.56 6.4 3.4 5675 2025
2015-16 Minimum 7.68 6.2 2.1 2200 800 Maximum 8.44 8.5 2.7 28000 1400 Average 8.04 8.0 2.38 5962 1100
2016-17 Minimum 7.23 4.8 2.1 3200 1300 Maximum 8.46 8.6 2.8 8000 3300 Average 7.71 7.45 2.57 5125 2166
2017-18 Minimum 7.19 0.8 2.0 3100 2100 Maximum 8.21 8.1 6.0 14000 11000 Average 7.59 6.8 2.8 9437 4525

83
Water Quality Status of Sikrahna River at Lauriya-Harinagar Road Bridge during the Year (2013-2014 to 2017-18.)
Year
pH
D.O. mg/L
B.O.D. mg/L
T.C. MPN/100mL
F.C. MPN/100mL
2013-14 Minimum 6.63 0.0 2.4 2200 800 Maximum 7.80 8.0 110 16000 5000 Average 7.28 4.36 38 7366 2033
2014-15 Minimum 6.76 0.0 2.0 1700 800 Maximum 8.48 7.2 30.0 16000 5000 Average 7.38 5.1 9.8 6600 2088
2015-16 Minimum 6.89 6.0 2.0 2200 800 Maximum 8.33 8.6 2.7 5000 2400 Average 7.76 7.51 2.35 3587 1500
2016-17 Minimum 7.23 4.6 2.1 3000 800 Maximum 7.77 8.5 3.0 5000 2700 Average 7.57 7.56 2.7 4200 1841
2017-18 Minimum 5.81 0.0 2.0 4400 2100 Maximum 8.03 9.2 14.8 11000 4000 Average 7.48 6.8 3.8 6600 2888
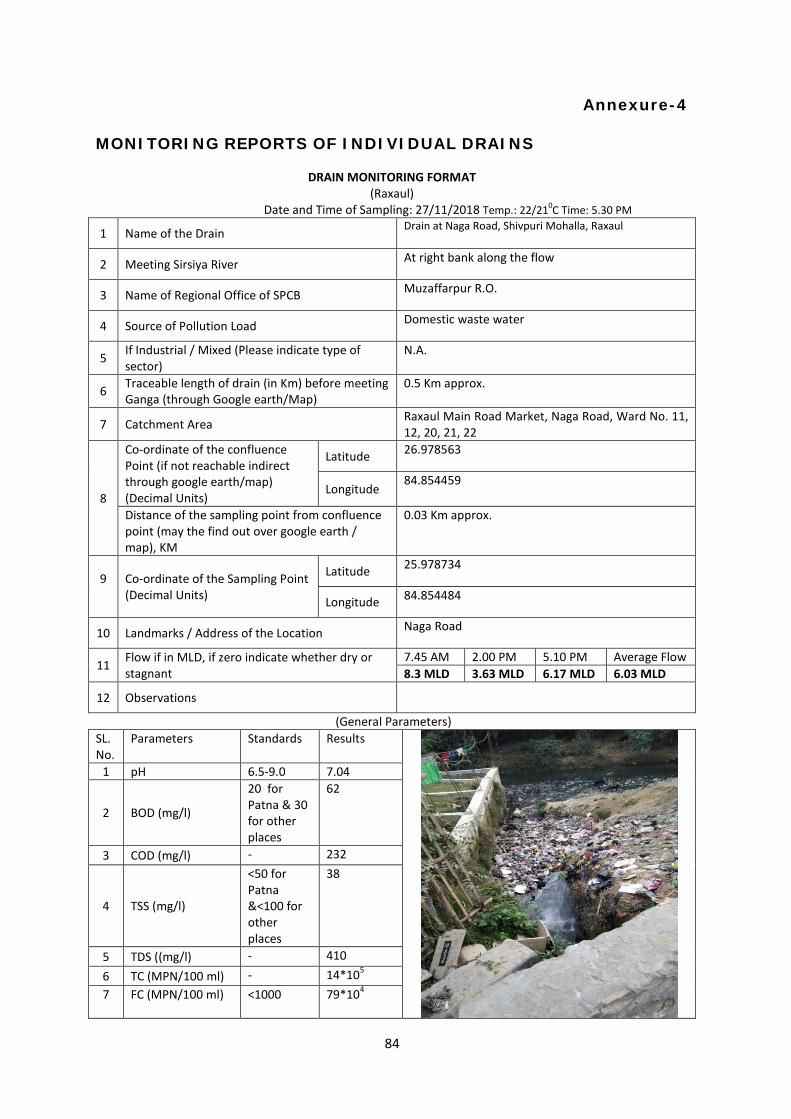
84
Annexure-4
MONITORING REPORTS OF INDIVIDUAL DRAINS
DRAIN MONITORING FORMAT (Raxaul)
Date and Time of Sampling: 27/11/2018 Temp.: 22/210C Time: 5.30 PM
1 Name of the Drain Drain at Naga Road, Shivpuri Mohalla, Raxaul
2 Meeting Sirsiya River At right bank along the flow
3 Name of Regional Office of SPCB Muzaffarpur R.O.
4 Source of Pollution Load Domestic waste water
5 If Industrial / Mixed (Please indicate type of sector)
N.A.
6 Traceable length of drain (in Km) before meeting Ganga (through Google earth/Map)
0.5 Km approx.
7 Catchment Area Raxaul Main Road Market, Naga Road, Ward No. 11, 12, 20, 21, 22
8
Co-ordinate of the confluence Point (if not reachable indirect through google earth/map) (Decimal Units)
Latitude 26.978563
Longitude 84.854459
Distance of the sampling point from confluence point (may the find out over google earth / map), KM
0.03 Km approx.
9
Co-ordinate of the Sampling Point (Decimal Units)
Latitude 25.978734
Longitude 84.854484
10 Landmarks / Address of the Location Naga Road
11 Flow if in MLD, if zero indicate whether dry or stagnant
7.45 AM 2.00 PM 5.10 PM Average Flow 8.3 MLD 3.63 MLD 6.17 MLD 6.03 MLD
12 Observations
(General Parameters) SL. No.
Parameters Standards Results
1 pH 6.5-9.0 7.04
2 BOD (mg/l)
20 for Patna & 30 for other places
62
3 COD (mg/l) - 232
4 TSS (mg/l)
<50 for Patna &<100 for other places
38
5 TDS ((mg/l) - 410 6 TC (MPN/100 ml) - 14*105 7 FC (MPN/100 ml) <1000 79*104

85
DRAIN MONITORING FORMAT (Raxaul)
Date and Time of Sampling: 17.11.2018 Temp.: 22/200C Time: 4.50 PM
1 Name of the Drain Drain at ChhatiayaGhat, near Railway Bridge, Raxaul
2 Meeting Sirsiya River At right bank along the flow
3 Name of Regional Office of SPCB Muzaffarpur R.O.
4 Source of Pollution Load Domestic waste water
5 If Industrial / Mixed (Please indicate type of sector)
N.A.
6 Traceable length of drain (in Km) before meeting Ganga (through Google earth/Map)
0.5 Km approx.
7 Catchment Area Ward NO. 6, 9, 10, 11, 12, 13, 14, 15, Railway Colony
8
Co-ordinate of the confluence Point (if not reachable indirect through google earth/map) (Decimal Units)
Latitude 26.983423
Longitude 84.857462
Distance of the sampling point from confluence point (may the find out over google earth / map), KM
0.02 Km Apporx.
9
Co-ordinate of the Sampling Point (Decimal Units)
Latitude 26.983490
Longitude 84.857309
10 Landmarks / Address of the Location ChhathiyaGhat, near Railway Bridge
11 Flow if in MLD, if zero indicate whether dry or stagnant
8.15 AM 1.30 PM 4.40 PM Average Flow 3.43 MLD 2.6 MLD 3.27 MLD 3.1 MLD
12 Observations
(General Parameters) SL. No.
Parameters Standards Results
1 pH 6.5-9.0 7.25
2 BOD (mg/l)
20 for Patna & 30 for other places
9.0
3 COD (mg/l) - 44.0
4 TSS (mg/l)
<50 for Patna &<100 for other places
36
5 TDS ((mg/l) - 356 6 TC (MPN/100 ml) - 17*105 7 FC (MPN/100 ml) <1000 11*105
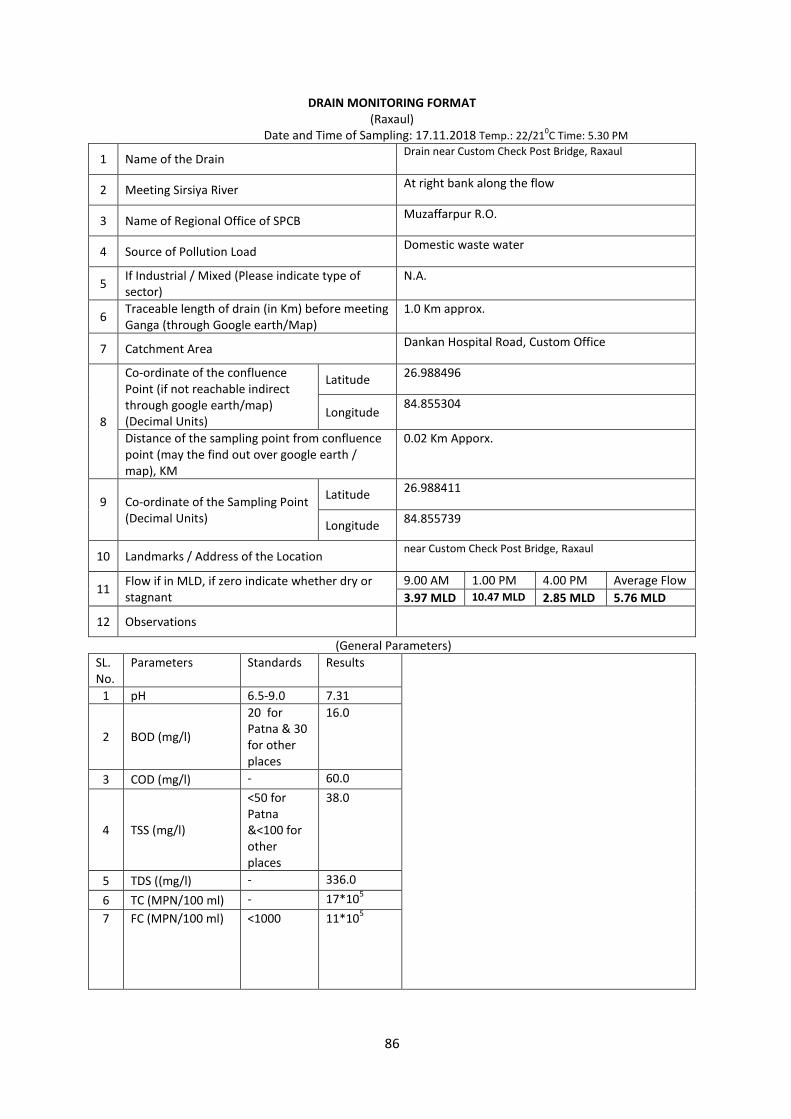
86
DRAIN MONITORING FORMAT (Raxaul)
Date and Time of Sampling: 17.11.2018 Temp.: 22/210C Time: 5.30 PM
1 Name of the Drain Drain near Custom Check Post Bridge, Raxaul
2 Meeting Sirsiya River At right bank along the flow
3 Name of Regional Office of SPCB Muzaffarpur R.O.
4 Source of Pollution Load Domestic waste water
5 If Industrial / Mixed (Please indicate type of sector)
N.A.
6 Traceable length of drain (in Km) before meeting Ganga (through Google earth/Map)
1.0 Km approx.
7 Catchment Area Dankan Hospital Road, Custom Office
8
Co-ordinate of the confluence Point (if not reachable indirect through google earth/map) (Decimal Units)
Latitude 26.988496
Longitude 84.855304
Distance of the sampling point from confluence point (may the find out over google earth / map), KM
0.02 Km Apporx.
9
Co-ordinate of the Sampling Point (Decimal Units)
Latitude 26.988411
Longitude 84.855739
10 Landmarks / Address of the Location near Custom Check Post Bridge, Raxaul
11 Flow if in MLD, if zero indicate whether dry or stagnant
9.00 AM 1.00 PM 4.00 PM Average Flow 3.97 MLD 10.47 MLD 2.85 MLD 5.76 MLD
12 Observations
(General Parameters) SL. No.
Parameters Standards Results
1 pH 6.5-9.0 7.31
2 BOD (mg/l)
20 for Patna & 30 for other places
16.0
3 COD (mg/l) - 60.0
4 TSS (mg/l)
<50 for Patna &<100 for other places
38.0
5 TDS ((mg/l) - 336.0 6 TC (MPN/100 ml) - 17*105 7 FC (MPN/100 ml) <1000 11*105
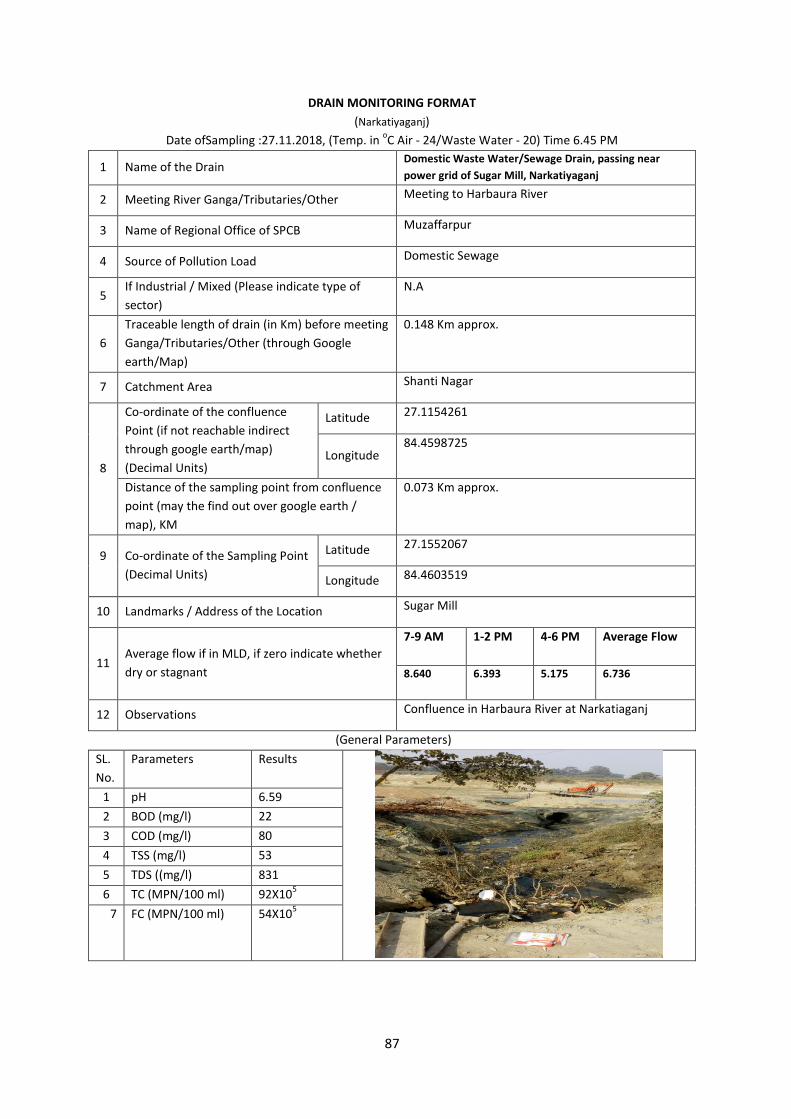
87
DRAIN MONITORING FORMAT (Narkatiyaganj)
Date ofSampling :27.11.2018, (Temp. in oC Air - 24/Waste Water - 20) Time 6.45 PM
1 Name of the Drain Domestic Waste Water/Sewage Drain, passing near power grid of Sugar Mill, Narkatiyaganj
2 Meeting River Ganga/Tributaries/Other Meeting to Harbaura River
3 Name of Regional Office of SPCB Muzaffarpur
4 Source of Pollution Load Domestic Sewage
5 If Industrial / Mixed (Please indicate type of sector)
N.A
6 Traceable length of drain (in Km) before meeting Ganga/Tributaries/Other (through Google earth/Map)
0.148 Km approx.
7 Catchment Area Shanti Nagar
8
Co-ordinate of the confluence Point (if not reachable indirect through google earth/map) (Decimal Units)
Latitude 27.1154261
Longitude 84.4598725
Distance of the sampling point from confluence point (may the find out over google earth / map), KM
0.073 Km approx.
9
Co-ordinate of the Sampling Point (Decimal Units)
Latitude 27.1552067
Longitude 84.4603519
10 Landmarks / Address of the Location Sugar Mill
11 Average flow if in MLD, if zero indicate whether dry or stagnant
7-9 AM 1-2 PM 4-6 PM
Average Flow
8.640 6.393 5.175 6.736
12 Observations Confluence in Harbaura River at Narkatiaganj
(General Parameters) SL. No.
Parameters Results
1 pH 6.59 2 BOD (mg/l) 22 3 COD (mg/l) 80 4 TSS (mg/l) 53 5 TDS ((mg/l) 831 6 TC (MPN/100 ml) 92X105
7 FC (MPN/100 ml) 54X105

88
DRAIN MONITORING FORMAT (Narkatiyaganj)
Date ofSampling :27.11.2018, (Temp. in oC Air - 24/Waste Water - 18) Time 7.00 PM
1 Name of the Drain Dhum Nagar Mandir Drain, Narkatiyaganj
2 Meeting River Ganga/Tributaries/Other Meeting to Harbaura River
3 Name of Regional Office of SPCB Muzaffarpur
4 Source of Pollution Load Domestic Sewage
5 If Industrial / Mixed (Please indicate type of sector)
NA
6 Traceable length of drain (in Km) before meeting Ganga/Tributaries/Other (through Google earth/Map)
0.617 Km approx.
7 Catchment Area Railway, Kusthashram
8
Co-ordinate of the confluence Point (if not reachable indirect through google earth/map) (Decimal Units)
Latitude 27.1062219
Longitude 84.4551662
Distance of the sampling point from confluence point (may the find out over google earth / map), KM
0.040 Km approx.
9
Co-ordinate of the Sampling Point (Decimal Units)
Latitude 27.1061822
Longitude 84.4555129
10 Landmarks / Address of the Location Railway line
11 Average flow if in MLD, if zero indicate whether dry or stagnant
7-9 AM 1-2 PM 4-6 PM
Average Flow
5.356 3.801 3.490 4.215
12 Observations Confluence in Harbaura River at Narkatiaganj
(General Parameters) SL. No.
Parameters Results
1 pH 6.59 2 BOD (mg/l) 38 3 COD (mg/l) 148 4 TSS (mg/l) 78 5 TDS ((mg/l) 1106 6 TC (MPN/100 ml) 17X105
7 FC (MPN/100 ml) 11X105

89
DRAIN MONITORING FORMAT (Narkatiyaganj)
Date ofSampling :27.11.2018, (Temp. in oC Air - 23/Waste Water - 17) Time 7.15 PM
1 Name of the Drain Nehar, Near Hardiya, Narkatiyaganj
2 Meeting River Ganga/Tributaries/Other No Meeting to any river
3 Name of Regional Office of SPCB Muzaffarpur
4 Source of Pollution Load Domestic Sewage
5 If Industrial / Mixed (Please indicate type of sector)
NA
6 Traceable length of drain (in Km) before meeting Ganga/Tributaries/Other (through Google earth/Map)
16 Km approx.
7 Catchment Area Prakash Nagar, Hardiya
8
Co-ordinate of the confluence Point (if not reachable indirect through google earth/map) (Decimal Units)
Latitude 27.1057850
Longitude 84.4571430
Distance of the sampling point from confluence point (may the find out over google earth / map), KM
0.565 Km approx.
9
Co-ordinate of the Sampling Point (Decimal Units)
Latitude 27.0968594
Longitude 84.4588666
10 Landmarks / Address of the Location ManavSevaSansthan
11 Average flow if in MLD, if zero indicate whether dry or stagnant
7-9 AM 1-2 PM 4-6 PM Average Flow
3.991 3.715 3.214 3.640
12 Observations Low Lying Area and Found Dry after 3.5 KM
(General Parameters) SL. No.
Parameters Results
1 pH 6.62 2 BOD (mg/l) 24 3 COD (mg/l) 84 4 TSS (mg/l) 26 5 TDS ((mg/l) 358 6 TC (MPN/100 ml) 14X105
7 FC (MPN/100 ml) 79X104

90
DRAIN MONITORING FORMAT (Ramnagar)
Date ofSampling :28.11.2018, (Temp. in oC Air - 22/Waste Water - 18) Time 6.00 PM
1 Name of the Drain Mukhya Bazar, Near Fish Market, Nagar Panchyat Road, Harinagar, Ramnagar
2 Meeting River Ganga/Tributaries/Other Meeting to Ramrekha River
3 Name of Regional Office of SPCB Muzaffarpur
4 Source of Pollution Load Domestic Sewage
5 If Industrial / Mixed (Please indicate type of sector)
NA
6 Traceable length of drain (in Km) before meeting Ganga/Tributaries/Other (through Google earth/Map)
0.235 Km approx.
7 Catchment Area Fish marker, Nagar Panchayat Road
8
Co-ordinate of the confluence Point (if not reachable indirect through google earth/map) (Decimal Units)
Latitude 27.1649890
Longitude 84.3265244
Distance of the sampling point from confluence point (may the find out over google earth / map), KM
0.144 Km approx.
9
Co-ordinate of the Sampling Point (Decimal Units)
Latitude 27.1651730
Longitude 84.3274743
10 Landmarks / Address of the Location Near Nagar Panchayat Office
11 Average flow if in MLD, if zero indicate whether dry or stagnant
7-9 AM 1-2 PM 4-6 PM Average Flow 12.441 11.923 7.862 10.743
12 Observations Confluence in Ramrekha River Hari Nagar
(General Parameters) SL. No.
Parameters Results
1 pH 6.08 2 BOD (mg/l) 115 3 COD (mg/l) 372 4 TSS (mg/l) 54 5 TDS ((mg/l) 672 6 TC (MPN/100 ml) 92X105
7 FC (MPN/100 ml) 54X105
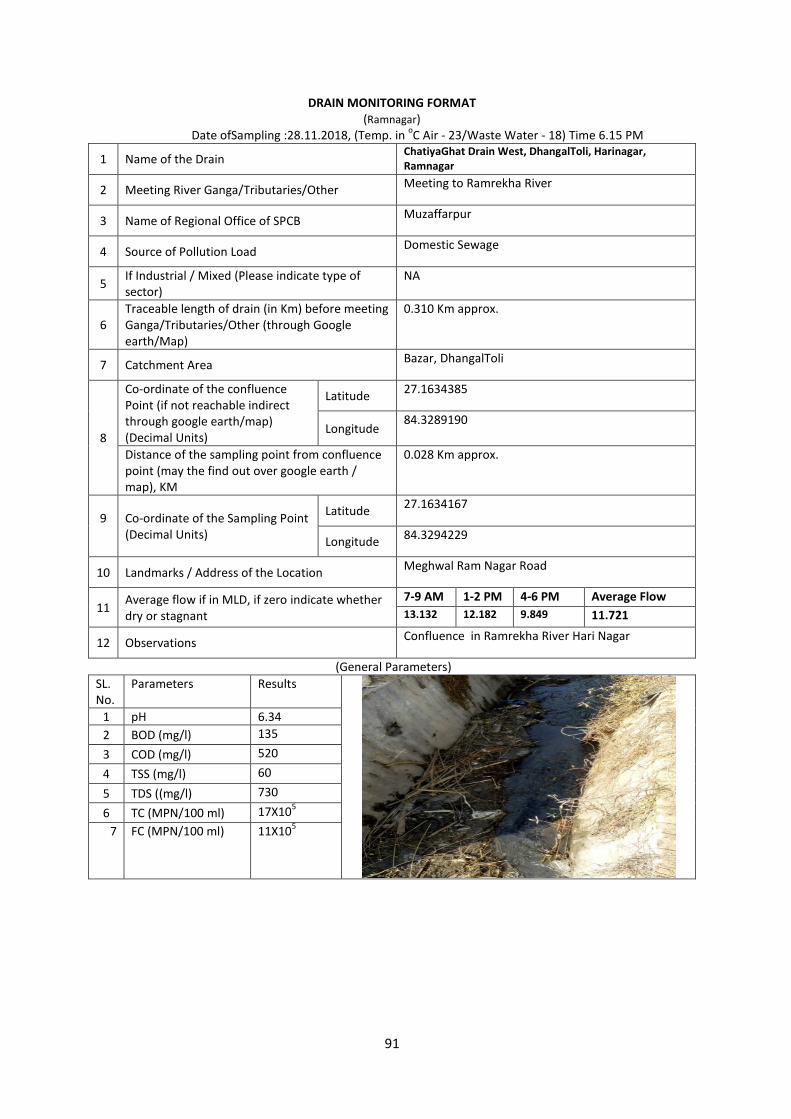
91
DRAIN MONITORING FORMAT (Ramnagar)
Date ofSampling :28.11.2018, (Temp. in oC Air - 23/Waste Water - 18) Time 6.15 PM
1 Name of the Drain ChatiyaGhat Drain West, DhangalToli, Harinagar, Ramnagar
2 Meeting River Ganga/Tributaries/Other Meeting to Ramrekha River
3 Name of Regional Office of SPCB Muzaffarpur
4 Source of Pollution Load Domestic Sewage
5 If Industrial / Mixed (Please indicate type of sector)
NA
6 Traceable length of drain (in Km) before meeting Ganga/Tributaries/Other (through Google earth/Map)
0.310 Km approx.
7 Catchment Area Bazar, DhangalToli
8
Co-ordinate of the confluence Point (if not reachable indirect through google earth/map) (Decimal Units)
Latitude 27.1634385
Longitude 84.3289190
Distance of the sampling point from confluence point (may the find out over google earth / map), KM
0.028 Km approx.
9
Co-ordinate of the Sampling Point (Decimal Units)
Latitude 27.1634167
Longitude 84.3294229
10 Landmarks / Address of the Location Meghwal Ram Nagar Road
11 Average flow if in MLD, if zero indicate whether dry or stagnant
7-9 AM 1-2 PM 4-6 PM Average Flow 13.132 12.182 9.849 11.721
12 Observations Confluence in Ramrekha River Hari Nagar
(General Parameters) SL. No.
Parameters Results
1 pH 6.34 2 BOD (mg/l) 135 3 COD (mg/l) 520 4 TSS (mg/l) 60 5 TDS ((mg/l) 730 6 TC (MPN/100 ml) 17X105
7 FC (MPN/100 ml) 11X105

92
DRAIN MONITORING FORMAT (Ramnagar)
Date ofSampling :28.11.2018, (Temp. in oC Air - 23/Waste Water - 17) Time 6.30 PM
1 Name of the Drain Chatiya Ghat Drain East, Kathawa Pull, Harinagar, Ramnagar
2 Meeting River Ganga/Tributaries/Other Meeting to Ramrekha River
3 Name of Regional Office of SPCB Muzaffarpur
4 Source of Pollution Load Domestic Sewage
5 If Industrial / Mixed (Please indicate type of sector)
NA
6 Traceable length of drain (in Km) before meeting Ganga/Tributaries/Other (through Google earth/Map)
0.062 Km approx.
7 Catchment Area KathwaPul, ChatiyaGhat Bazar
8
Co-ordinate of the confluence Point (if not reachable indirect through google earth/map) (Decimal Units)
Latitude 27.1634987
Longitude 84.3284550
Distance of the sampling point from confluence point (may the find out over google earth / map), KM
0.020 Km approx.
9
Co-ordinate of the Sampling Point (Decimal Units)
Latitude 27.1634080
Longitude 84.3284727
10 Landmarks / Address of the Location MeghawarRemrekha Road, Kathwapul
11 Average flow if in MLD, if zero indicate whether dry or stagnant
7-9 AM 1-2 PM 4-6 PM Average Flow 1.296 1.036 0.864 1.065
12 Observations Confluence in Ramrekha River Hari Nagar
(General Parameters) SL. No.
Parameters Results
1 pH 6.69 2 BOD (mg/l) 42 3 COD (mg/l) 160 4 TSS (mg/l) 116 5 TDS ((mg/l) 3592 6 TC (MPN/100 ml) 17X105
7 FC (MPN/100 ml) 11X105

93
DRAIN MONITORING FORMAT (Ramnagar)
Date ofSampling :28.11.2018, (Temp. in oC Air - 24/Waste Water - 19) Time 6.45 PM
1 Name of the Drain Railly Bazar Drain, , Harinagar, Ramnagar
2 Meeting River Ganga/Tributaries/Other Meeting to Ramrekha River
3 Name of Regional Office of SPCB Muzaffarpur
4 Source of Pollution Load Domestic Sewage
5 If Industrial / Mixed (Please indicate type of sector)
NA
6 Traceable length of drain (in Km) before meeting Ganga/Tributaries/Other (through Google earth/Map)
0.244 Km approx.
7 Catchment Area Aryan Nagar, Raily Bazar, Main Road
8
Co-ordinate of the confluence Point (if not reachable indirect through google earth/map) (Decimal Units)
Latitude 27.1587440
Longitude 84.03306443
Distance of the sampling point from confluence point (may the find out over google earth / map), KM
0.160 Km approx.
9
Co-ordinate of the Sampling Point (Decimal Units)
Latitude 27.1591873
Longitude 84.3300968
10 Landmarks / Address of the Location Slum Area Raily Bazar
11 Average flow if in MLD, if zero indicate whether dry or stagnant
7-9 AM 1-2 PM 4-6 PM Average Flow 1.123 0.864 0.691 0.892
12 Observations Confluence in Ramrekha River Hari Nagar
(General Parameters) SL. No.
Parameters Results
1 pH 5.63 2 BOD (mg/l) 28 3 COD (mg/l) 108 4 TSS (mg/l) 22 5 TDS ((mg/l) 262 6 TC (MPN/100 ml) 17X105
7 FC (MPN/100 ml) 11X105

94
DRAIN MONITORING FORMAT (Ramnagar)
Date ofSampling :28.11.2018, (Temp. in oC Air - 22/Waste Water - 19) Time 7.00 PM
1 Name of the Drain Sugar Mill Officers Quarter Drain, Pachurkha, Harinagar, Ramnagar
2 Meeting River Ganga/Tributaries/Other Meeting to Ramrekha River
3 Name of Regional Office of SPCB Muzaffarpur
4 Source of Pollution Load Domestic Sewage
5 If Industrial / Mixed (Please indicate type of sector)
N.A
6 Traceable length of drain (in Km) before meeting Ganga/Tributaries/Other (through Google earth/Map)
0.157 Km approx.
7 Catchment Area Panchurkha, Mill Quarter, Hari Nagar
8
Co-ordinate of the confluence Point (if not reachable indirect through google earth/map) (Decimal Units)
Latitude 27.1514496
Longitude 84.3310205
Distance of the sampling point from confluence point (may the find out over google earth / map), KM
0.045 Km approx.
9
Co-ordinate of the Sampling Point (Decimal Units)
Latitude 27.1517368
Longitude 84.3314161
10 Landmarks / Address of the Location Behind Harinagar Sugar Mill
11 Average flow if in MLD, if zero indicate whether dry or stagnant
7-9 AM 1-2 PM 4-6 PM Average Flow 4.060 3.283 3.049 3.464
12 Observations Confluence in Ramrekha River Hari Nagar
(General Parameters) SL. No.
Parameters Results
1 pH 6.81 2 BOD (mg/l) 24 3 COD (mg/l) 108 4 TSS (mg/l) 46 5 TDS ((mg/l) 578 6 TC (MPN/100 ml) 17X105
7 FC (MPN/100 ml) 11X105

95
DRAIN MONITORING FORMAT (Jogbani)
Date and Time of Sampling: 17.01.2019 Temp.: 22/200C Time: 4.10 PM
1 Name of the Drain Khajurbari Drain, Ward No. 6, Jogbani, Araria
2 Meeting River No. Discharge in low lying area.
3 Name of Regional Office of SPCB Purnea R.O.
4 Source of Pollution Load Domestic Waste Water
5 If Industrial / Mixed (Please indicate type of sector)
N.A.
6 Traceable length of drain (in Km) before meeting Ganga (through Google earth/Map)
0.4 Km approximately
7 Catchment Area Ward No. 5, 6
8
Co-ordinate of the confluence Point (if not reachable indirect through google earth/map) (Decimal Units)
Latitude 26.39909
Longitude 87.25501
Distance of the sampling point from confluence point (may the find out over google earth / map), KM
0.01 km
9
Co-ordinate of the Sampling Point (Decimal Units)
Latitude 26.39909
Longitude 87.25501
10 Landmarks / Address of the Location Near Khajurbari Masjid
11 Flow if in MLD, if zero indicate whether dry or stagnant
8.00 AM 1.00 PM 4.00 PM Average Flow 3.11 MLD 2.76 MLD 3.02 MLD 2.96 MLD
12 Observations Sewage discharge in low lying area
(General Parameters) SL. No.
Parameters Standards Results
1 pH 6.5-9.0 7.32
2 BOD (mg/l)
20 for Patna & 30 for other places
3 COD (mg/l) -
4 TSS (mg/l)
<50 for Patna &<100 for other places
5 TDS ((mg/l) - 6 TC (MPN/100 ml) - 7 FC (MPN/100 ml) <1000
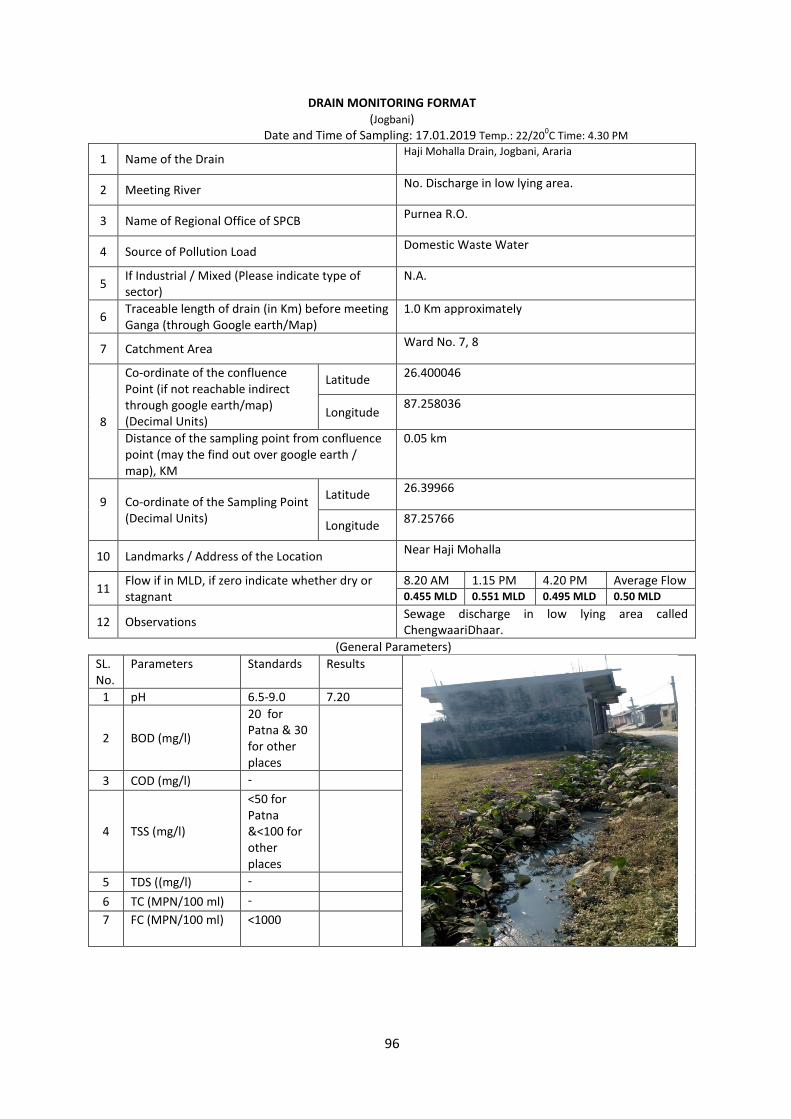
96
DRAIN MONITORING FORMAT (Jogbani)
Date and Time of Sampling: 17.01.2019 Temp.: 22/200C Time: 4.30 PM
1 Name of the Drain Haji Mohalla Drain, Jogbani, Araria
2 Meeting River No. Discharge in low lying area.
3 Name of Regional Office of SPCB Purnea R.O.
4 Source of Pollution Load Domestic Waste Water
5 If Industrial / Mixed (Please indicate type of sector)
N.A.
6 Traceable length of drain (in Km) before meeting Ganga (through Google earth/Map)
1.0 Km approximately
7 Catchment Area Ward No. 7, 8
8
Co-ordinate of the confluence Point (if not reachable indirect through google earth/map) (Decimal Units)
Latitude 26.400046
Longitude 87.258036
Distance of the sampling point from confluence point (may the find out over google earth / map), KM
0.05 km
9
Co-ordinate of the Sampling Point (Decimal Units)
Latitude 26.39966
Longitude 87.25766
10 Landmarks / Address of the Location Near Haji Mohalla
11 Flow if in MLD, if zero indicate whether dry or stagnant
8.20 AM 1.15 PM 4.20 PM Average Flow 0.455 MLD 0.551 MLD 0.495 MLD 0.50 MLD
12 Observations Sewage discharge in low lying area called ChengwaariDhaar.
(General Parameters) SL. No.
Parameters Standards Results
1 pH 6.5-9.0 7.20
2 BOD (mg/l)
20 for Patna & 30 for other places
3 COD (mg/l) -
4 TSS (mg/l)
<50 for Patna &<100 for other places
5 TDS ((mg/l) - 6 TC (MPN/100 ml) - 7 FC (MPN/100 ml) <1000

97
DRAIN MONITORING FORMAT (Jogbani)
Date and Time of Sampling: 17.01.2019 Temp.: 22/200C Time: 4.55 PM
1 Name of the Drain Idgah Chowk Drain, Ward No. 11, Jogbani, Araria
2 Meeting River No. Discharge in low lying area.
3 Name of Regional Office of SPCB Purnea R.O.
4 Source of Pollution Load Domestic Waste Water
5 If Industrial / Mixed (Please indicate type of sector)
N.A.
6 Traceable length of drain (in Km) before meeting Ganga (through Google earth/Map)
0.5 Km approximately
7 Catchment Area Ward No. 11, Jogbani Market
8
Co-ordinate of the confluence Point (if not reachable indirect through google earth/map) (Decimal Units)
Latitude 26.398263
Longitude 87.265387
Distance of the sampling point from confluence point (may the find out over google earth / map), KM
9
Co-ordinate of the Sampling Point (Decimal Units)
Latitude 26.398263
Longitude 87.265387
10 Landmarks / Address of the Location Near Idgah
11 Flow if in MLD, if zero indicate whether dry or stagnant
8.50 AM 1.40 PM 4.45 PM Average Flow 0.75 MLD 0.693 MLD 0.664 MLD 0.704 MLD
12 Observations Sewage discharge in low lying area.
(General Parameters) SL. No.
Parameters Standards Results
1 pH 6.5-9.0 7.42
2 BOD (mg/l)
20 for Patna & 30 for other places
3 COD (mg/l) -
4 TSS (mg/l)
<50 for Patna &<100 for other places
5 TDS ((mg/l) - 6 TC (MPN/100 ml) - 7 FC (MPN/100 ml) <1000

98
DRAIN MONITORING FORMAT (Jogbani)
Date and Time of Sampling: 17.01.2019 Temp.: 21/200C Time: 5.50 PM
1 Name of the Drain Islampur Drain, Ward No. 17, Jogbani, Araria
2 Meeting River No. Discharge in low lying area.
3 Name of Regional Office of SPCB Purnea R.O.
4 Source of Pollution Load Domestic Waste Water
5 If Industrial / Mixed (Please indicate type of sector)
N.A.
6 Traceable length of drain (in Km) before meeting Ganga (through Google earth/Map)
1.5 Km approximately
7 Catchment Area Ward No. 13, 14, 16, 17
8
Co-ordinate of the confluence Point (if not reachable indirect through google earth/map) (Decimal Units)
Latitude 26.387700
Longitude 87.264033
Distance of the sampling point from confluence point (may the find out over google earth / map), KM
0.3 Km. approx.
9
Co-ordinate of the Sampling Point (Decimal Units)
Latitude 26.39029
Longitude 87.26535
10 Landmarks / Address of the Location Near Indian Check Post (under construction)
11 Flow if in MLD, if zero indicate whether dry or stagnant
9.15 AM 2.00 PM 5.30 PM Average Flow 1.208 MLD 1.517 MLD 1.462 MLD 1.395 MLD
12 Observations Sewage discharge in low lying area.
(General Parameters) SL. No.
Parameters Standards Results
1 pH 6.5-9.0 7.28
2 BOD (mg/l)
20 for Patna & 30 for other places
3 COD (mg/l) -
4 TSS (mg/l)
<50 for Patna &<100 for other places
5 TDS ((mg/l) - 6 TC (MPN/100 ml) - 7 FC (MPN/100 ml) <1000

99
DRAIN MONITORING FORMAT (Fatuha)
Date of Sampling : 27.11.2018
1 Name of the Drain Kali GhatSamaspur, Fatuha, Patna
2 Meeting Ganga Meeting Ganga on right bank
3 Name of Regional Office of SPCB Regional office, Patna
4 Source of Pollution Load Domestic -sewage
5 If Industrial / Mixed (Please indicate type of sector)
Not Applicable (NA)
6 Traceable length of drain (in Km) before meeting Ganga (through Google earth/Map)
21 m
7 Catchment Area Samaspur
8
Co-ordinate of the confluence Point (if not reachable indirect through google earth/map) (Decimal Units)
Latitude 25.517221
Longitude 85.300431
Distance of the sampling point from confluence point (may the find out over google earth / map), KM
9
Co-ordinate of the Sampling Point (Decimal Units)
Latitude 25.517150
Longitude 85.300337
10 Landmarks / Address of the Location Millennium School
11 Average flow if in MLD, if zero indicate whether dry or stagnant
0.72 MLD
12 Observations
SN Time Flow rate (MLD) 1. 08:40am 0.84 2. 12:10pm 0.72 3. 02:40pm 0.46
(General Parameters) SL. No.
Parameters Results
1 pH 5.70 2 BOD (mg/l) 17 3 COD (mg/l) 64 4 TSS (mg/l) 80 5 TDS ((mg/l) 1326 6 TC (MPN/100 ml) 92x 105 7 FC (MPN/100 ml) 54x 105

100
DRAIN MONITORING FORMAT (Fatuha)
Date of Sampling : 27.11.2018
1 Name of the Drain Makhsudpur Drain, East of BindeshwariGhat, Fatuha, Patna
2 Meeting Ganga Meeting Ganga on right bank
3 Name of Regional Office of SPCB Regional office, Patna
4 Source of Pollution Load Domestic -sewage
5 If Industrial / Mixed (Please indicate type of sector)
Not Applicable (NA)
6 Traceable length of drain (in Km) before meeting Ganga (through Google earth/Map)
21 m
7 Catchment Area BindeshwariGhat
8
Co-ordinate of the confluence Point (if not reachable indirect through google earth/map) (Decimal Units)
Latitude 25.509425
Longitude 85.324231
Distance of the sampling point from confluence point (may the find out over google earth / map), KM
9
Co-ordinate of the Sampling Point (Decimal Units)
Latitude 25.509222
Longitude 85.324139
10 Landmarks / Address of the Location MahavirSthan, Ward no. 23
11 Average flow if in MLD, if zero indicate whether dry or stagnant
0.37 MLD
12 Observations
SN Time Flow rate (MLD) 1. 09:10am 0.46 2. 12:25pm 0.25 3. 02:55pm 0.42
(General Parameters) SL. No.
Parameters Results
1 pH 5.65
2 BOD (mg/l) 52
3 COD (mg/l) 176
4 TSS (mg/l) 54
5 TDS ((mg/l) 548
6 TC (MPN/100 ml) 14x 105
7 FC (MPN/100 ml) 79x 105

101
DRAIN MONITORING FORMAT (Fatuha)
Date of Sampling : 27.11.2018
1 Name of the Drain Makhsudpur Drain, West of BindeshwariGhat, Fatuha, Patna
2 Meeting Ganga Meeting Ganga on right bank
3 Name of Regional Office of SPCB Regional office, Patna
4 Source of Pollution Load Domestic -sewage
5 If Industrial / Mixed (Please indicate type of sector)
Not Applicable (NA)
6 Traceable length of drain (in Km) before meeting Ganga (through Google earth/Map)
24 m
7 Catchment Area BindeshwariGhat
8
Co-ordinate of the confluence Point (if not reachable indirect through google earth/map) (Decimal Units)
Latitude 25.509439
Longitude 85.323937
Distance of the sampling point from confluence point (may the find out over google earth / map), KM
9
Co-ordinate of the Sampling Point (Decimal Units)
Latitude 25.509286
Longitude 85.323822
10 Landmarks / Address of the Location MahavirSthan, Ward no. 23
11 Average flow if in MLD, if zero indicate whether dry or stagnant
0.10 MLD
12 Observations
SN Time Flow rate (MLD) 1. 09:25am 1.28 2. 12:50pm 0.83 3. 03:10pm 1.21
(General Parameters) SL. No.
Parameters Results
1 pH 5.82 2 BOD (mg/l) 46 3 COD (mg/l) 164 4 TSS (mg/l) 88 5 TDS ((mg/l) 1180 6 TC (MPN/100 ml) 14x 105 7 FC (MPN/100 ml) 79x 105

102
DRAIN MONITORING FORMAT (Fatuha)
Date of Sampling : 27.11.2018
1 Name of the Drain KataiyaGhat Drain, Fatuha, Patna
2 Meeting Ganga Meeting Ganga on right bank
3 Name of Regional Office of SPCB Regional office, Patna
4 Source of Pollution Load Domestic -sewage
5 If Industrial / Mixed (Please indicate type of sector)
Not Applicable (NA)
6 Traceable length of drain (in Km) before meeting Ganga (through Google earth/Map)
14 m
7 Catchment Area Dariyapur, Fatuha
8
Co-ordinate of the confluence Point (if not reachable indirect through google earth/map) (Decimal Units)
Latitude 25.511272
Longitude 85.308228
Distance of the sampling point from confluence point (may the find out over google earth / map), KM
9
Co-ordinate of the Sampling Point (Decimal Units)
Latitude 25.511067
Longitude 85.308391
10 Landmarks / Address of the Location
11 Average flow if in MLD, if zero indicate whether dry or stagnant
0.64 MLD
12 Observations
SN Time Flow rate (MLD) 1. 09:50am 0.81 2. 01:15pm 0.35 3. 03:30pm 0.78
(General Parameters) SL. No.
Parameters Results
1 pH 5.80 2 BOD (mg/l) 50 3 COD (mg/l) 168 4 TSS (mg/l) 56 5 TDS ((mg/l) 666 6 TC (MPN/100 ml) 17x 105 7 FC (MPN/100 ml) 11x 105

103
DRAIN MONITORING FORMAT (Fatuha)
Date of Sampling : 27.11.2018
1 Name of the Drain DevantiGhat Drain, Fatuha, Patna
2 Meeting Ganga Meeting Ganga on right bank
3 Name of Regional Office of SPCB Regional office, Patna
4 Source of Pollution Load Domestic -sewage
5 If Industrial / Mixed (Please indicate type of sector)
Not Applicable (NA)
6 Traceable length of drain (in Km) before meeting Ganga (through Google earth/Map)
13 m
7 Catchment Area SonakothiMohallah
8
Co-ordinate of the confluence Point (if not reachable indirect through google earth/map) (Decimal Units)
Latitude 25.511723
Longitude 85.306409
Distance of the sampling point from confluence point (may the find out over google earth / map), KM
9
Co-ordinate of the Sampling Point (Decimal Units)
Latitude 25.511626
Longitude 85.306275
10 Landmarks / Address of the Location
11 Average flow if in MLD, if zero indicate whether dry or stagnant
2.30 MLD
12 Observations
SN Time Flow rate (MLD) 1. 10:20am 2.57 2. 01:30pm 1.82 3. 03:35pm 2.34
(General Parameters) SL. No.
Parameters Results
1 pH 6.77
2 BOD (mg/l) 19
3 COD (mg/l) 68
4 TSS (mg/l) 272
5 TDS ((mg/l) 4318
6 TC (MPN/100 ml) 17x 105
7 FC (MPN/100 ml) 11x 105

104
DRAIN MONITORING FORMAT (Fatuha)
Date of Sampling : 27.11.2018
1 Name of the Drain MastanaGhat Drain, Fatuha, Patna
2 Meeting Ganga Meeting Ganga on right bank
3 Name of Regional Office of SPCB Regional office, Patna
4 Source of Pollution Load Domestic -sewage
5 If Industrial / Mixed (Please indicate type of sector)
Not Applicable (NA)
6 Traceable length of drain (in Km) before meeting Ganga (through Google earth/Map)
14 m
7 Catchment Area
8
Co-ordinate of the confluence Point (if not reachable indirect through google earth/map) (Decimal Units)
Latitude 25.512659
Longitude 85.304754
Distance of the sampling point from confluence point (may the find out over google earth / map), KM
9
Co-ordinate of the Sampling Point (Decimal Units)
Latitude 25.512443
Longitude 85.304605
10 Landmarks / Address of the Location RamjankiMandir, Ward no. 14
11 Average flow if in MLD, if zero indicate whether dry or stagnant
1.14 MLD
12 Observations
SN Time Flow rate (MLD) 1. 10:45am 1.28 2. 01:50pm 0.94 3. 04:15pm 1.20
(General Parameters) SL. No.
Parameters Results
1 pH 5.94
2 BOD (mg/l) 42
3 COD (mg/l) 160
4 TSS (mg/l) 96
5 TDS ((mg/l) 1430
6 TC (MPN/100 ml) 14x 105
7 FC (MPN/100 ml) 9x 10⁴
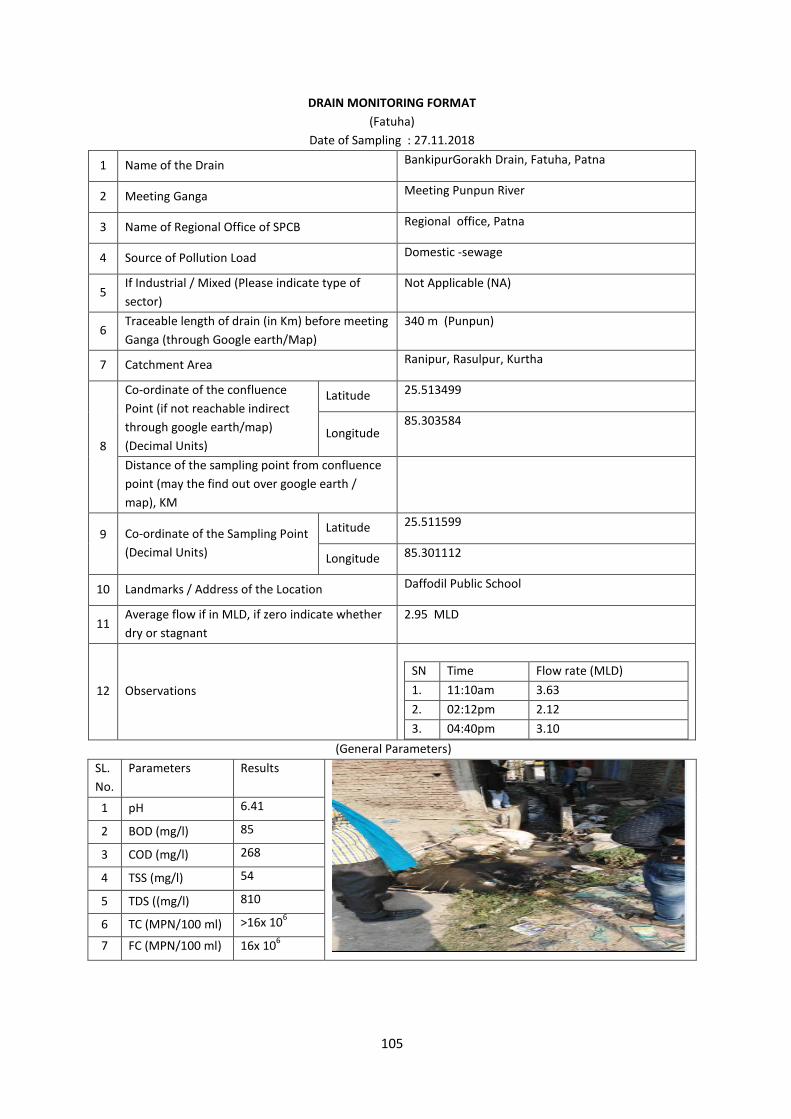
105
DRAIN MONITORING FORMAT (Fatuha)
Date of Sampling : 27.11.2018
1 Name of the Drain BankipurGorakh Drain, Fatuha, Patna
2 Meeting Ganga Meeting Punpun River
3 Name of Regional Office of SPCB Regional office, Patna
4 Source of Pollution Load Domestic -sewage
5 If Industrial / Mixed (Please indicate type of sector)
Not Applicable (NA)
6 Traceable length of drain (in Km) before meeting Ganga (through Google earth/Map)
340 m (Punpun)
7 Catchment Area Ranipur, Rasulpur, Kurtha
8
Co-ordinate of the confluence Point (if not reachable indirect through google earth/map) (Decimal Units)
Latitude 25.513499
Longitude 85.303584
Distance of the sampling point from confluence point (may the find out over google earth / map), KM
9
Co-ordinate of the Sampling Point (Decimal Units)
Latitude 25.511599
Longitude 85.301112
10 Landmarks / Address of the Location Daffodil Public School
11 Average flow if in MLD, if zero indicate whether dry or stagnant
2.95 MLD
12 Observations
SN Time Flow rate (MLD) 1. 11:10am 3.63 2. 02:12pm 2.12 3. 04:40pm 3.10
(General Parameters) SL. No.
Parameters Results
1 pH 6.41
2 BOD (mg/l) 85
3 COD (mg/l) 268
4 TSS (mg/l) 54
5 TDS ((mg/l) 810
6 TC (MPN/100 ml) >16x 106
7 FC (MPN/100 ml) 16x 106
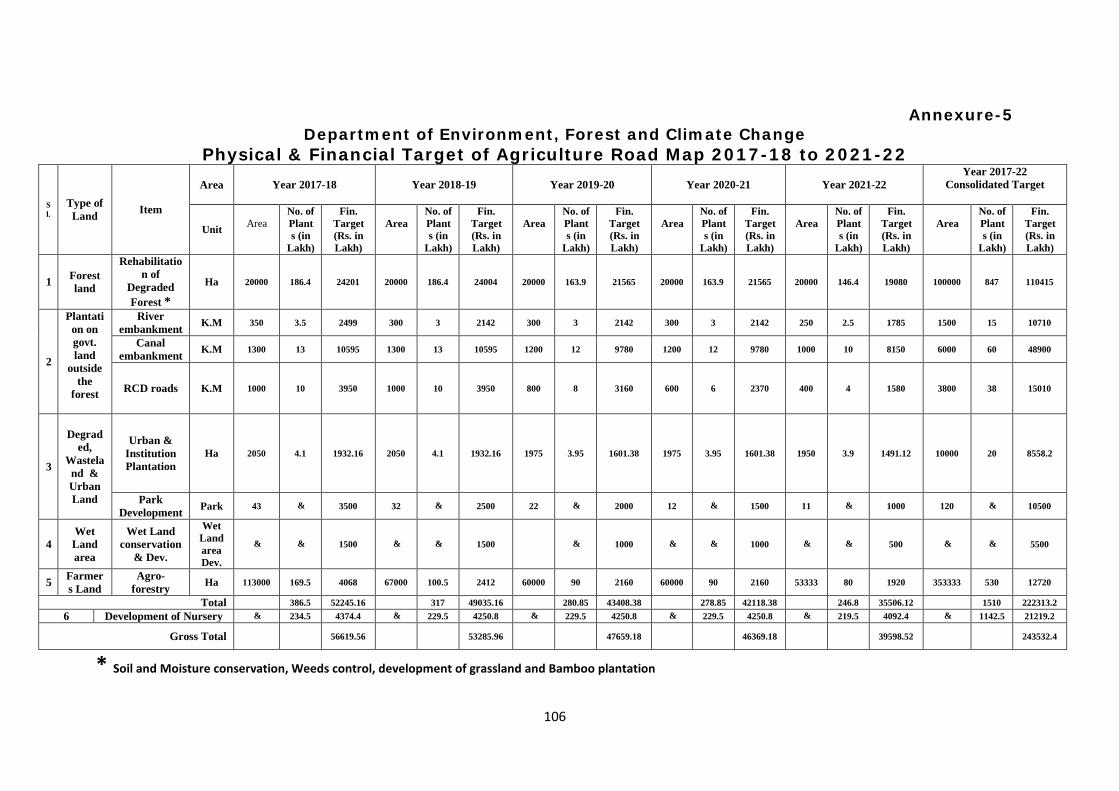
106
Annexure-5 Department of Environment, Forest and Climate Change
Physical & Financial Target of Agriculture Road Map 2017-18 to 2021-22
S l.
Type of Land Item
Area Year 2017-18 Year 2018-19 Year 2019-20 Year 2020-21 Year 2021-22 Year 2017-22
Consolidated Target
Unit Area
No. of Plants (in
Lakh)
Fin. Target (Rs. in Lakh)
Area
No. of Plants (in
Lakh)
Fin. Target (Rs. in Lakh)
Area
No. of Plants (in
Lakh)
Fin. Target (Rs. in Lakh)
Area
No. of Plants (in
Lakh)
Fin. Target (Rs. in Lakh)
Area
No. of Plants (in
Lakh)
Fin. Target (Rs. in Lakh)
Area
No. of Plants (in
Lakh)
Fin. Target (Rs. in Lakh)
1 Forest land
Rehabilitation of
Degraded Forest *
Ha 20000 186.4 24201 20000 186.4 24004 20000 163.9 21565 20000 163.9 21565 20000 146.4 19080 100000 847 110415
2
Plantation on govt. land
outside the
forest
River embankment K.M 350 3.5 2499 300 3 2142 300 3 2142 300 3 2142 250 2.5 1785 1500 15 10710
Canal embankment K.M 1300 13 10595 1300 13 10595 1200 12 9780 1200 12 9780 1000 10 8150 6000 60 48900
RCD roads K.M 1000 10 3950 1000 10 3950 800 8 3160 600 6 2370 400 4 1580 3800 38 15010
3
Degraded,
Wasteland & Urban Land
Urban & Institution Plantation
Ha 2050 4.1 1932.16 2050 4.1 1932.16 1975 3.95 1601.38 1975 3.95 1601.38 1950 3.9 1491.12 10000 20 8558.2
Park Development Park 43 & 3500 32 & 2500 22 & 2000 12 & 1500 11 & 1000 120 & 10500
4 Wet Land area
Wet Land conservation
& Dev.
Wet Land area Dev.
& & 1500 & & 1500 & 1000 & & 1000 & & 500 & & 5500
5 Farmers Land
Agro-forestry Ha 113000 169.5 4068 67000 100.5 2412 60000 90 2160 60000 90 2160 53333 80 1920 353333 530 12720
Total 386.5 52245.16 317 49035.16 280.85 43408.38 278.85 42118.38 246.8 35506.12 1510 222313.2 6 Development of Nursery & 234.5 4374.4 & 229.5 4250.8 & 229.5 4250.8 & 229.5 4250.8 & 219.5 4092.4 & 1142.5 21219.2
Gross Total 56619.56 53285.96 47659.18 46369.18 39598.52 243532.4
* Soil and Moisture conservation, Weeds control, development of grassland and Bamboo plantation
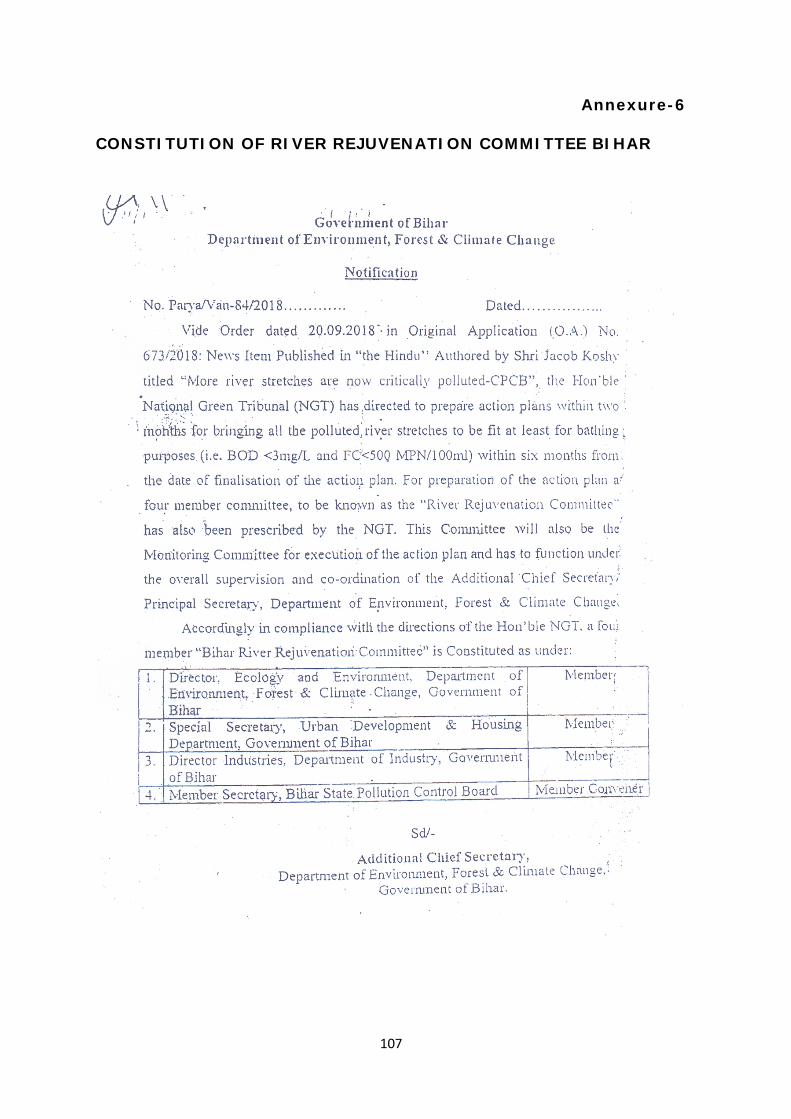
107
Annexure-6
CONSTITUTION OF RIVER REJUVENATION COMMITTEE BIHAR

108


