Department of Geosciences Comparison of regional emission inventories for CityZen 1st annual meeting, Vienna, September 28- 29, 2009 Presenter: Øivind Hodnebrog Participants: Frode Stordal, Øystein Hov, Ivar S.A. Isaksen Section for Meteorology and oceanography Department of Geosciences University of Oslo
Transcript
Department of Geosciences
Comparison of regional emission inventories for CityZen
Ivar S.A. IsaksenSection for Meteorology and oceanographyDepartment of GeosciencesUniversity of Oslo
Department of Geosciences
Emission inventories
• RETRO– 0.5° x 0.5° resolution, global coverage
• INERIS/EMEP– 0.1° x 0.1° resolution, cover Europe
• EMEP/TNO– 0.1° x 0.1° resolution, cover Europe
• NAEI– UK National Atmospheric Emissions Inventory (www.naei.org.uk)– 1 km x 1 km resolution, cover United Kingdom
• LANUV– Landesamt für Natur, Umwelt und Verbraucherschutz NRW– 1 km x 1 km resolution, cover North Rhine-Westphalia (incl. Ruhr)
European emissions (Mt/year), 2005
CO NOX * VOC SOX **
INERIS/EMEP 47.43 19.01 13.38 18.58
EMEP/TNO 49.09 19.25 13.50 19.01
* NOX emissions are given as Mt (NO2) / year** SOX emissions are given as Mt (SO2) / year
INERIS/EMEP EMEP/TNO
UK emissions (Mt/year), 2005
* NOX emissions are given as Mt (NO2) / year** SOX emissions are given as Mt (SO2) / year
INERIS/EMEP EMEP/TNO
NAEI
CO NOX * VOC SOX **
INERIS/EMEP 2.41 1.59 0.89 0.73
EMEP/TNO 2.35 1.68 0.95 0.76
NAEI 2.38 1.51 0.92 0.68
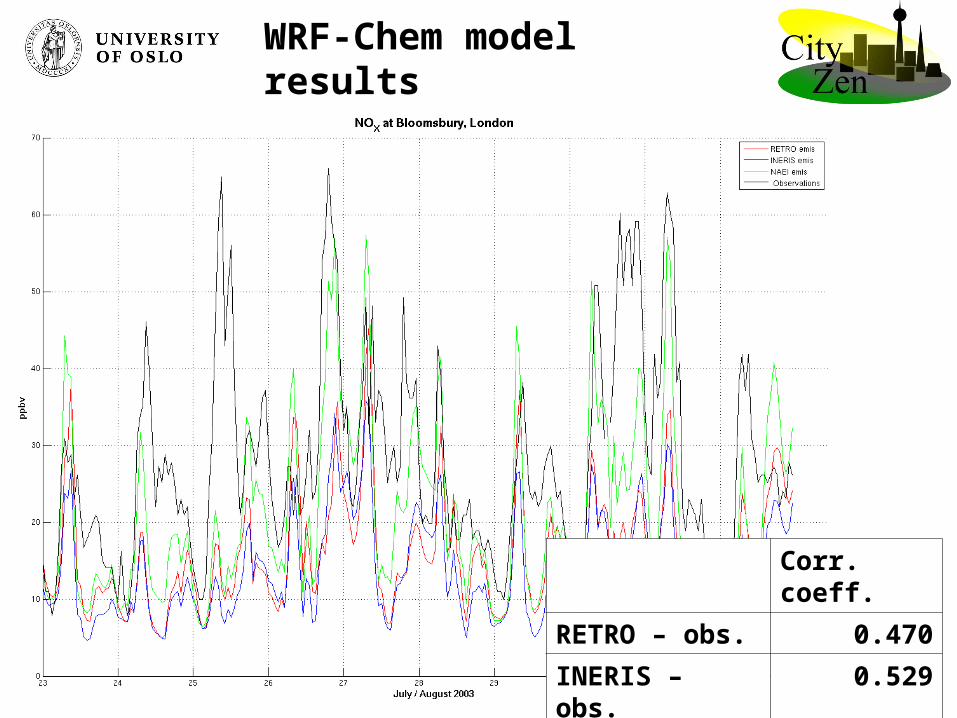
London emissions (kt/year), 2005
* NOX emissions are given as kt (NO2) / year** SOX emissions are given as kt (SO2) / year
CO NOX * VOC SOX **
INERIS/EMEP 136.6 80.2 53.8 13.5
EMEP/TNO 295.6 180.5 116.6 33.5
NAEI 236.2 128.3 84.1 15.9
INERIS/EMEP EMEP/TNO
NAEI
North Rhine-Westphalia emissions (kt/year), 2005
CO NOX * VOC SOX **
INERIS/EMEP 903.4 224.4 222.8 144.9
EMEP/TNO 1094.8 381.0 247.4 205.8
LANUV x 1288.3 381.0 175.5 -
* NOX emissions are given as kt (NO2) / year** SOX emissions are given as kt (SO2) / yearx SNAP sectors 5, 6, 9, 10, 11 are not incl., and emissions are mixed from year 2000, 2004, and 2007.