34
Department of Higher Education and Training Community colleges funding requirements Presentation to the Commission of Inquiry into Higher Education and Training 26 October 2016

Department of Higher Education and Training
Community colleges funding requirements
Presentation to the Commission of Inquiry into Higher Education and Training
26 October 2016

Presentation outline
1) Government policy and legislative position
2) The context: the Department’s position
3) The extent of the demand for community education and
training opportunities: Permutations
4) Policy response to the demand for CET opportunities
5) Current institutional landscape
6) Sector under-funding: Historical and Current
7) Effects of current and historical under-funding
8) Funding requirements to enable compliance with policy and
Constitutional obligations
2

Government policy and legislative position
1) Constitution of the Republic of South Africa, 1996
2) National Development Plan: Vision 2030
3) White Paper on Post-School Education and Training, 2013
4) Medium Term Strategic Framework, 2009-2014, 2014-2019
5) National Policy on Community Education and Training
Colleges, 2015
6) General and Further Education and Training Quality
Assurance Act, 2001
7) National Qualifications Framework Act, 2008
8) National Norms and Standards for Funding CET Colleges3
3
• The issue of fee-free higher education and training cannot be considered
outside of the wider context of funding for the education system as a
whole, and the Post-School Education and Training (PSET) system
specifically
• The Department of Basic Education provides for education through
schooling
• The Department’s remit is to provide education and training for anyone
out of school who requires it
• The PSET system must provide for school leaving youth (entering the
Higher Education and Technical and Vocational Education and Training
sector) as well as out of school youth who dropped out before Grade 9
and adults (the Community Education and Training sector)
4
The Context

The Right to Education
The Department derives its mandate from Section 29 of the the Constitution:
(1) Everyone has a right –
(a) to a basic education, including adult basic education, and
(b) further education, which the state, through reasonable measures,
must make progressively available and accessible.
(2) Everyone has the right to receive education in the official language or
languages of their choice in public educational institutions where that
education is reasonably practicable. In order to ensure effective access
to, and implementation of this right, the state must consider all
reasonable educational alternatives, including single medium institutions,
taking into account –
(a) equity,
(b) practicability, and
(c) the need to redress the results of past racially-discriminatory laws
and practices
5
Extent of the demand for community education and
training opportunities: GHS
6
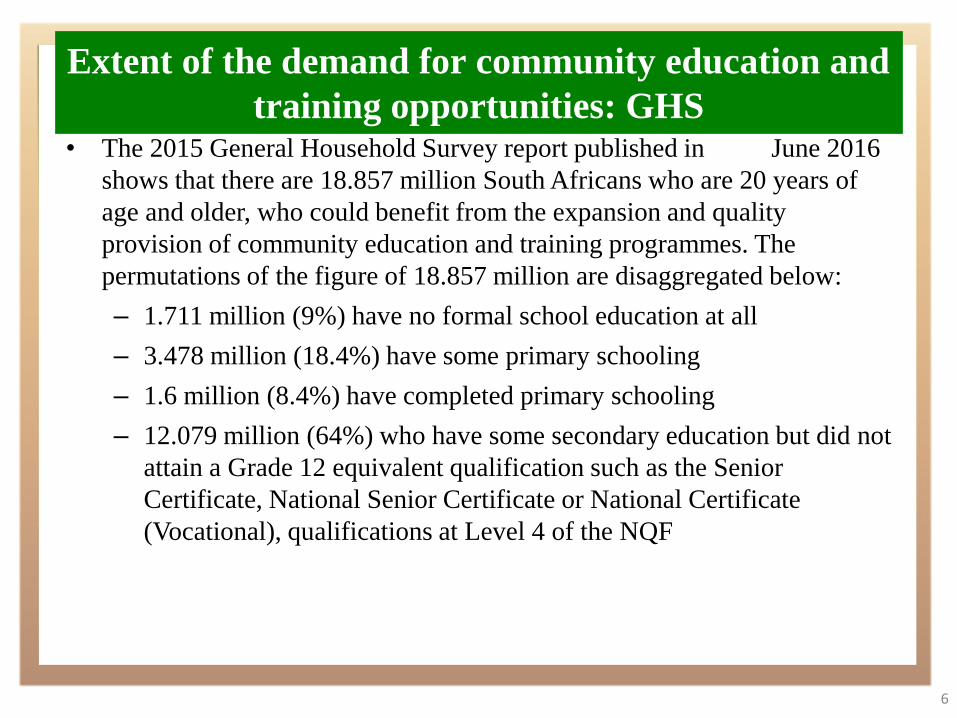
• The 2015 General Household Survey report published in June 2016
shows that there are 18.857 million South Africans who are 20 years of
age and older, who could benefit from the expansion and quality
provision of community education and training programmes. The
permutations of the figure of 18.857 million are disaggregated below:
– 1.711 million (9%) have no formal school education at all
– 3.478 million (18.4%) have some primary schooling
– 1.6 million (8.4%) have completed primary schooling
– 12.079 million (64%) who have some secondary education but did not
attain a Grade 12 equivalent qualification such as the Senior
Certificate, National Senior Certificate or National Certificate
(Vocational), qualifications at Level 4 of the NQF

Background & Context: GHS 2015Extent of the demand for community education and
training opportunities: NEETS, (2016 LFS, Q2)
7
Education level 15-24 yrs. 25-34 yrs. 35-64 yrs. Total
No schooling 37,744 61,334 600,266 699,344
Primary or less 351,345 437,612 1 833,145 2 622,103
Secondary education less than
grade 12 1 499,052 2 313,378 2 828,821 6 641,251
Grade 12 1 145,042 1 291,622 1 352,378 3 789,043
Grade 12 with
Certificate/Diploma 97,026 172,076 209,094 478,196
Degree 56,626 111,749 188,916 357,290
Other and Unspecified 30,576 39,563 94,476 164,615
Total 3 217,412 4 427,334 7 107,096 14 751,842

8
• 18 million potential learners should be served by the Community College
system
• The National Policy on Community Education and Training Colleges
calls for pilots to establish effective model(s) for CET college system;
specifically for the management and governance model, the nature of
programmes, student support systems, staffing and employment of
personnel in the college and how colleges should be funded
• It is envisaged that the pilot process will provide lessons in the scaling up
the establishment of Community Colleges in district municipalities
Policy response to the demand for CET
opportunities

Background & Context: GHS 2015
1) In terms notices published in Government Gazette No.
38570 of 16 March 2015 the following Community
Colleges were established:
Current institutional landscape
Name Notice No.
LP Community Education and Training College 213
EC Community Education and Training College 214
WC Community Education and Training College 215
KZN Community Education and Training College 216
NW Community Education and Training College 217
NC Community Education and Training College 218
FS Community Education and Training College 219
GP Community Education and Training College 220
MP Community Education and Training College 221
9

Background & Context: GHS 2015
1) In terms notices published in Government Gazette No. 38674 of
7 April 2015 the former PALCs were merged into the new CET
College per province as indicated in the Table below:
Current institutional landscape
Name CLCs Notice
LP Community Education and Training College 779 298
EC Community Education and Training College 304 300
WC Community Education and Training College 254 305
KZN Community Education and Training College 1097 299
NW Community Education and Training College 148 303
NC Community Education and Training College 191 297
FS Community Education and Training College 204 301
GP Community Education and Training College 47 302
MP Community Education and Training College 252 304
327610

Extent of the demand for community education and
training opportunities
11
• In terms of the NDP enrolments in CET colleges are targeted to reach 1
million by 2030
• Funding requirements to enable this include paying attention to the
unfunded current enrolment, the quality of provision, as well as projected
enrolment costs to meet the MTEF enrolment target of 398 439 in 2019
(increasing from 310 000 in 2016)
• The main objective is to effectively respond to the educational needs of
those who never completed or attended school

Extent of the demand for community education and
training opportunities
12
• The CET sector also needs to offer the second chance provision for adults
and youths who do not hold a senior certificate through the newly
developed National Senior Certificate for Adults – the roll out of this
requires a further R1.3 billion
• Adequately funding the CET sector at this moment in time, to meet the
constitutional obligation to provide adult basic education as a
fundamental right, will require approximately R46.210 billion additional
funding over the MTEF

Sector under-funding: Historical/Provincial
13
Categories 2012/13 2013/14 2014/15 2015/16
R’000 R’000 R’000 R’000
Compensation of
Employees (Salary
and related Expenses)
1 443 627 1 432 442 1 472 237 1 776 894
Goods and Services 75 785 94 815 103 493 113 967
Machinery and
Equipment 1 170 6 060 6 148 3 074
Transfers and Subsidies 46 456 50 329 52 547 92 470
Total 1 569 054 1 584 239 1 635 019 1 986 405
% Baseline Growth
rate year-on-year
0.97% 3.21% 21.49%
Sector under-funding: Historical/Provincial
14
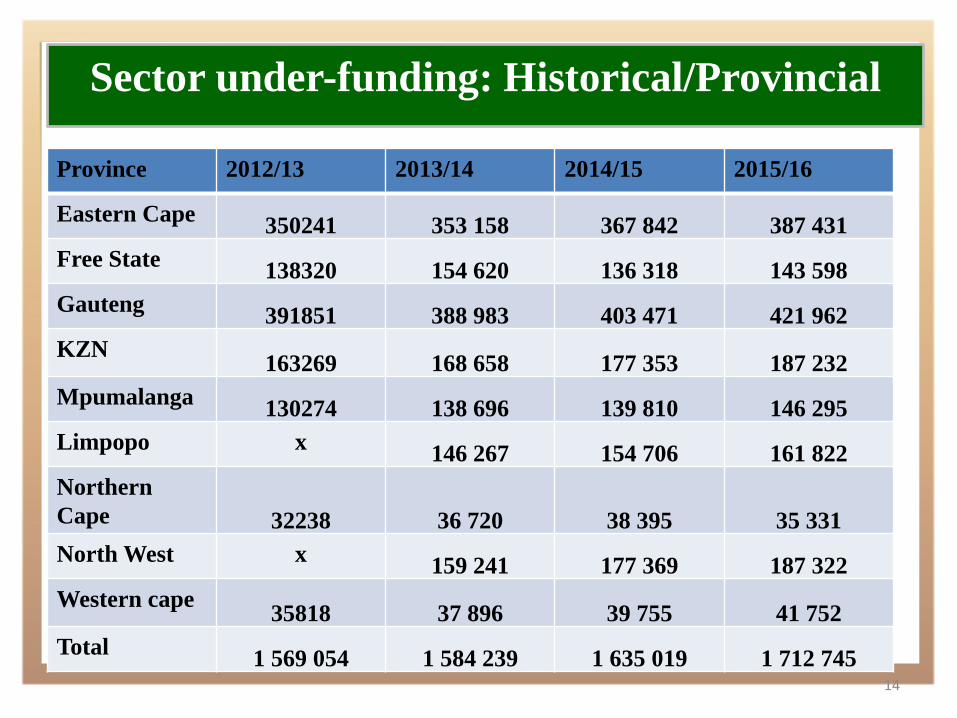
Province 2012/13 2013/14 2014/15 2015/16
Eastern Cape350241 353 158 367 842 387 431
Free State138320 154 620 136 318 143 598
Gauteng391851 388 983 403 471 421 962
KZN163269 168 658 177 353 187 232
Mpumalanga130274 138 696 139 810 146 295
Limpopo x146 267 154 706 161 822
Northern
Cape 32238 36 720 38 395 35 331
North West x159 241 177 369 187 322
Western cape35818 37 896 39 755 41 752
Total1 569 054 1 584 239 1 635 019 1 712 745

Programme
Adjusted Appropriation
R’000
Medium-Term Expenditure EstimateR’000
2015/16 2016/17 2017/18 2018/19
Administration 366 083 373 667 399 272 427 166
Planning, Policy and Strategy 58 260 71 545 76 447 81 825
University Education 32 892 002 39 531 603 41 944 120 44 319 940
Technical and Vocational Education and Training
6 843 005 6 917 191 7 414 233 7 865 692
Skills Development 206 474 224 534 244 716 260 567
Community Education and Training
1 563 512 2 069 739 2 237 311 2 379 637
Subtotal 41 929 336 49 188 279 52 316 099 55 334 827
Direct charge against the National Revenue Fund
15 800 000 17 639 595 19 687 116 22 057 492
Total 57 729 336 66 827 874 72 003 215 77 392 319
CET Sector funding: Current
15

Economic Classification
Adjusted Appropriation
R’000
Medium-Term Expenditure EstimateR’000
2015/16 2016/17 2017/18 2018/19
Compensation of Employees 7 236 153 7 839 886 8 429 841 8 961 753
Goods and Services 369 368 375 270 423 969 447 901
Transfers and subsidies 34 313 284 40 965 418 43 453 062 45 915 703
National Student Financial Aid Scheme 6 448 551 11 392 674 10 143 091 10 578 549
Public entities (SAQA, CHE, QCTO) 117 424 120 961 139 806 147 915
SETA transfers (DHET’s contribution) 139 717 102 420 119 260 126 176
Universities 26 286 077 27 964 818 31 606 841 33 534 871
TVET colleges (Subsidies) 1 214 740 1 274 848 1 328 096 1 405 498
Community Education Training Centers 92 470 98 202 103 898 109 924
Higher Education South Africa for HEAIDS project 7 761 8 172 8 581 9 079
Commonwealth of Learning and IBSA 3 951 3 323 3 489 3 691
Other (Leave gratuity) 2 593 - - -
Payments for capital assets 10531 7 705 9 227 9 470
Subtotal 41 929 336 49 188 279 52 316 099 55 334 827
Direct charge against the National Revenue Fund 15 800 000 17 639 595 19 687 116 22 057 492
Total 57 729 336 66 827 874 72 003 215 77 392 319
CET Subsystem underfunding: MTEF Allocation
1616
17
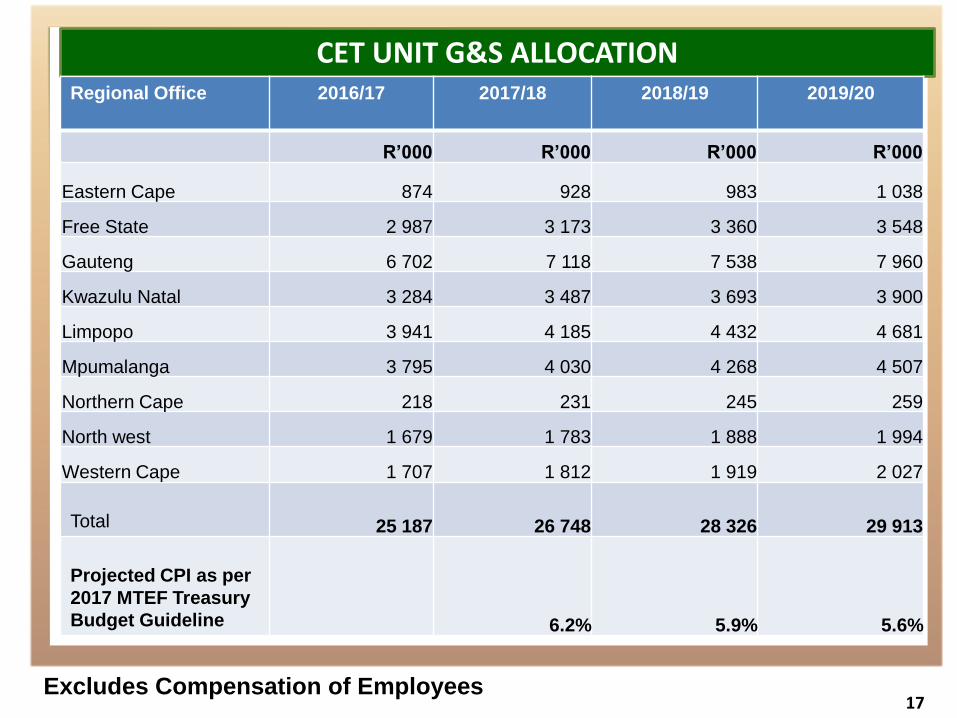
CET UNIT G&S ALLOCATION
Excludes Compensation of Employees
Regional Office 2016/17 2017/18 2018/19 2019/20
R’000 R’000 R’000 R’000
Eastern Cape 874 928 983 1 038
Free State 2 987 3 173 3 360 3 548
Gauteng 6 702 7 118 7 538 7 960
Kwazulu Natal 3 284 3 487 3 693 3 900
Limpopo 3 941 4 185 4 432 4 681
Mpumalanga 3 795 4 030 4 268 4 507
Northern Cape 218 231 245 259
North west 1 679 1 783 1 888 1 994
Western Cape 1 707 1 812 1 919 2 027
Total 25 187 26 748 28 326 29 913
Projected CPI as per
2017 MTEF Treasury
Budget Guideline 6.2% 5.9% 5.6%

18
CET COLLEGE 2016/17 2017/18 2018/19 2019/20
Eastern Cape 809 859 909 960
Free State 704 748 792 837
Gauteng 8 558 9 088 9 624 10 163
KwaZulu-Natal 574 610 646 682
Limpopo 1 799 1 910 2 023 2 136
Mpumalanga 1 416 1 503 1 592 1 681
Northern Cape 255 271 287 303
North West 1 613 1 713 1 814 1 915
Western 1 641 1 742 1 845 1 949
TOTAL 17 368 18 444 19 533 20 626
Projected CPI as per 2017
MTEF Treasury Budget
Guideline 6.2% 5.9% 5.6%
CET COLLEGE BUDGET ALLOCATION: OPERATIONAL COSTS
Excludes Compensation of Employees

19
CET COLLEGE 2016/17 2017/18 2018/19 2018/19
Eastern Cape 6,996 7,401 7,831 7,831
Free State 4,530 4,793 5,071 5,071
Gauteng 28,718 30,384 32,146 32,146
KwaZulu-Natal 8,127 8,599 9,098 9,098
Limpopo 12,963 13,715 14,510 14,510
Mpumalanga 13,038 13,794 14,594 14,594
Northern Cape 1,863 1,971 2,085 2,085
North West 13,550 14,336 15,167 15,167
Western Cape 8,416 8,904 9,421 9,421
TOTAL 98,202 103,898 109,924 116,080
Projected CPI as per 2017
MTEF Treasury Budget
Guideline 6.2% 5.9% 5.6%
CLC BUDGET ALLOCATION: TRANSFER AND SUBSIDIES

Effects of neglect : Historical and current under-funding
1. Unaffordability of salaries for lecturers
2. Lack of appropriate CET College institutional infrastructure
3. Standardisation of the lecturer conditions of service
4. Inadequate learning and teaching material
5. Unaffordable time on teaching and learning
6. Lack of tools, equipment, suitable furniture to support
teaching and learning
7. Lack of diversity of programme offerings/lack responsiveness
8. Lack of human resource at college, region (CET) and national
(Programme 6) to support the CET College system
9. Lack of capacity to manage and administer CET examination
20

Background & Context: GHS 2015
1) The National Development Plan (NDP) target 1.0
million CET students by 2030.
2) Current enrolment target (2016/17) is: 310 000 in the
APP aligned to NDP target
3) Projected increase over 2017 MTEF is 8.7% per
annum
4) Additional Projected Funding Shortfall required for the
increase in CET enrolment is as follows:
Projected increase in headcount enrolment in CET
Colleges
21

Background & Context: GHS 2015
1. Estimated Shortfall is based on projected NDP
Targets to reach 1 million students in CET Colleges.
2. Estimated average programme cost of R38 043 per
student.
3. Estimated programme Cost in CET Colleges is
equated to the cheapest TVET Colleges NCV
Programme (Office Administration).
Principal assumptions:
Estimated Programme Funding Shortfall: CET
Colleges: 2017 MTEF
22

Background & Context: GHS 2015
1) Estimated programme costs is projected to increase at the
rate of projected CPI as follows:
a) 2017/18: 6.2%
b) 2018/19: 5.9%
c) 2019/20: 5.6%
2) However the enrolment is projected to grow at 8.7% which
is 2.5% above projected CPI rate.
Principal assumptions:
Estimated Programme Funding Shortfall: CET
Colleges: 2017 MTEF
23

Background & Context: GHS 2015Estimated programme funding shortfall: 2017
MTEF in line with 2030 NDP target
24
Categories Baseline: 2016/17
2017/18 2018/19 2019/20
Estimated target 310 000 337 051 366 462 398 439
R’000 R’000 R’000 R’000
Total Estimated Programme Funding Costs Required
11 146 829 12 822 432 14 749 914 16 999 211
Programme Funding Baseline Available (incl. CoE for Lecturers)
2 028 110 2 153 853 2 280 930 2 417 786
Total Estimated Shortfall (9 118 719) (10 668 579) (12 468 984) (14 581 425)

Background & Context: GHS 2015Estimated programme funding shortfall: 2017
MTEF: National Senior Certificate (Adults)
25
Categories Baseline: 2016/17
2017/18 2018/19 2019/20
Estimated target 10 000 10 000 1000
R’000 R’000 R’000
Total Estimated Programme Funding Costs Required
380 430 402 500 425 440
Programme Funding Baseline Available (incl. CoE for Lecturers)
0 0 0
Total Estimated Shortfall (380 430) (402 500) (425 440)

Background & Context: GHS 2015Estimated programme funding shortfall: 2017
MTEF: Piloting the Community Colleges
26
Categories Baseline: 2016/17
2017/18 2018/19 2019/20
Estimated target 9 9 9
R’000 R’000 R’000
Total Estimated Programme Funding Costs Required
105 415 110 684 116 217
Programme Funding Baseline Available (incl. CoE for Lecturers)
0 0 0
Total Estimated Shortfall (105 415) (110 684) (116217)
Background & Context: GHS 2015
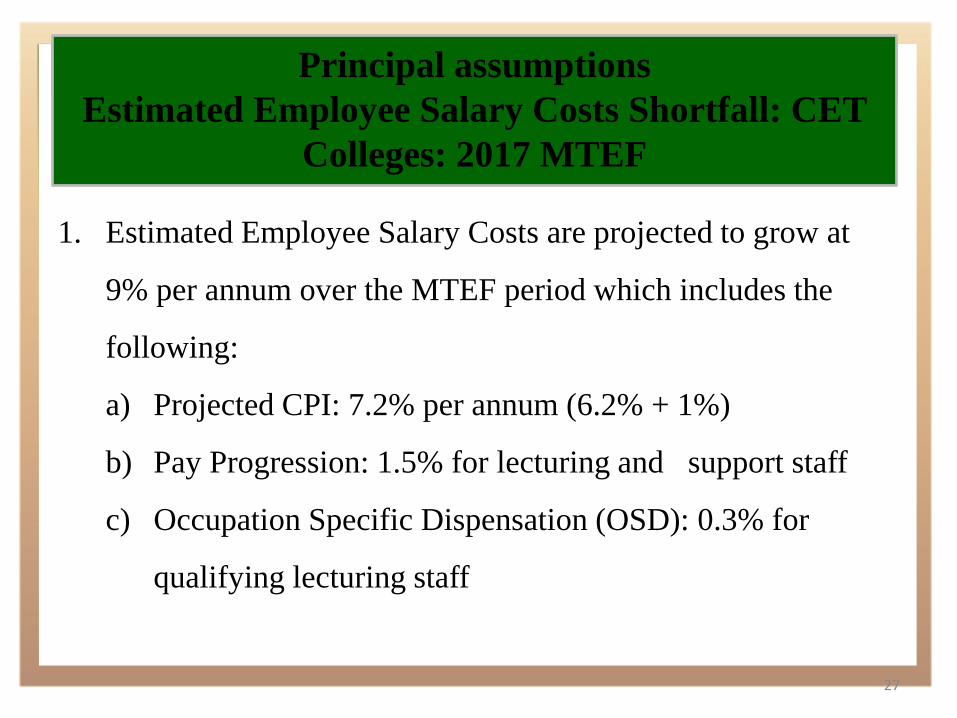
1. Estimated Employee Salary Costs are projected to grow at
9% per annum over the MTEF period which includes the
following:
a) Projected CPI: 7.2% per annum (6.2% + 1%)
b) Pay Progression: 1.5% for lecturing and support staff
c) Occupation Specific Dispensation (OSD): 0.3% for
qualifying lecturing staff
Principal assumptions
Estimated Employee Salary Costs Shortfall: CET
Colleges: 2017 MTEF
27
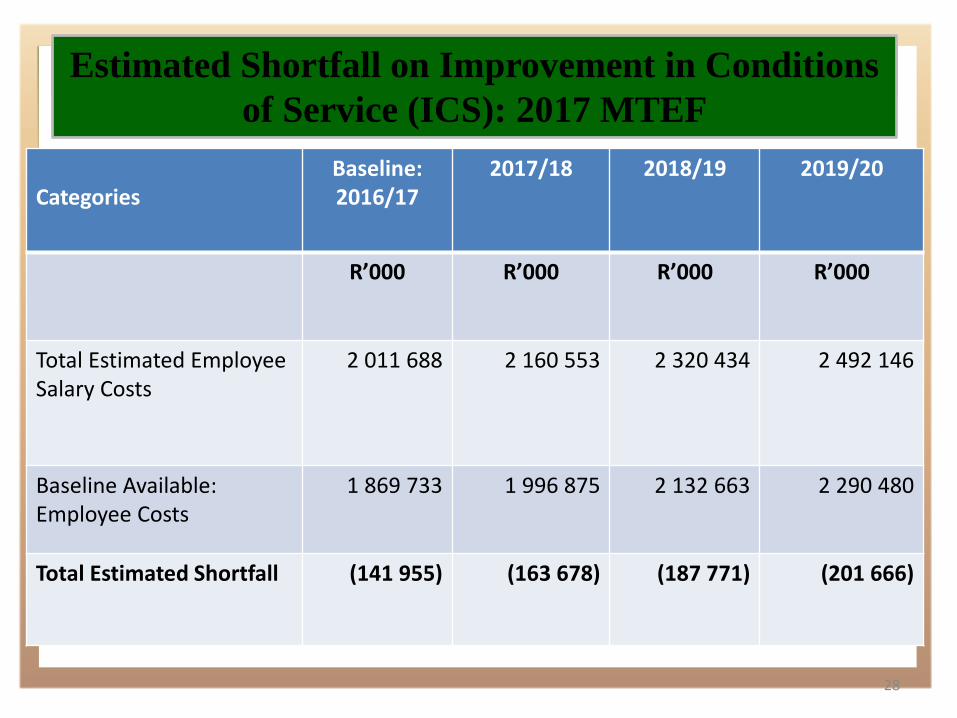
Background & Context: GHS 2015Estimated Shortfall on Improvement in Conditions
of Service (ICS): 2017 MTEF
28
CategoriesBaseline: 2016/17
2017/18 2018/19 2019/20
R’000 R’000 R’000 R’000
Total Estimated Employee Salary Costs
2 011 688 2 160 553 2 320 434 2 492 146
Baseline Available: Employee Costs
1 869 733 1 996 875 2 132 663 2 290 480
Total Estimated Shortfall (141 955) (163 678) (187 771) (201 666)

Background & Context: GHS 2015
1. Two cycle for the GETC and 1 for NASCA
2. Setting
3. Marking
4. Production
5. Monitoring and Support
6. SBA Monitoring and Moderation
7. Subsistence and Travel Allowances, Overtime costs for
National, Regional officials
8. Increase in enrolments
9. Examination Equipment and Maintenance
Principal Cost drivers
Estimated NASCA & GETC Examination Costs 2017 MTEF
29

Background & Context: GHS 2015Estimated Funding Shortfall for Examination Costs
including GETC and NASCA:2017 MTEF
30
Categories Baseline:
2016/17
2017/18 2018/19 2019/20
R’000 R’000 R’000 R’000
Estimated Budget
required
565 081 643 064 734 018 840 380
Baseline Budget
Available
83 639 88 824 93 065 99 332
Estimated
Funding Shortfall
(481 442) (554 240) (639 953) (741 048)

Background & Context: GHS 2015
1) Estimated infrastructure maintenance backlog cost is calculated
at 10% of the total estimated costs for delivery of programmes
2) Estimated Refurbishment Cost is in line with available
infrastructure but customized to the needs of the CET Colleges
3) Estimated Rental Cost is charged at 350 square meters at R120
per square meter per month
Principal assumptions:
Estimated Infrastructure Costs: 2017 MTEF
31

Background & Context: GHS 2015Estimated Funding Shortfall for Infrastructure
Costs for CET Colleges:2017 MTEF
32
Categories Baseline:
2016/17
2017/18 2018/19 2019/20
R’000 R’000 R’000 R’000
Maintenance Backlog
(For Community Learning
Centres) 1 114 682 1 282 243 1 474 991 1 693 506
Refurbishment (For the 9
CET Colleges) 840 892 945 998
Lease Rental (For 9 CET
Colleges) 4 536 4 817 5 101 5 387
Total Estimated
Infrastructure Costs 1 120 058 1 287 952 1 481 037 1 699 891

Background & Context: GHS 2015Estimated CET sector funding shortfall for 2017
MTEF: Summary
33
Categories 2016/17 2017/18 2018/19 2019/20 Total Over 2017 MTEF
R’000 R’000 R’000 R’000 R’000
CET System
expansion and
quality
improvement
9 118 719 10 662 579 12 468 984 14 581 425 37 712 988
NASCA 0 380 430 402 500 425 440 1 208 370
CET Pilots 0 105 415 110 684 116 217 332 316
Improvement of
conditions of
service
141 955 163 678 187 771 201 666 553 115
Examinations 481 442 554 240 639 953 741 048 1 935 241
Infrastructure 1 120 058 1 287 952 1 481 037 1 699 891 4 468 880
Total 10 862 174 13 154 294 15 290 929 17 765 687 46 210 910

Thank You
34


