Introduction The primary purpose of the study reported here was to carry out whole-rock major and trace-element geochemical analyses of a suite of previously unanalysed samples from the Thomas Creek intrusive complex and the adjacent andesitic lava sequence, and present the new results together with previous analyses (Table 1). Some first-pass interpretation of the geochemistry is presented. However, placing the new geochemistry in the context of a detailed paragenetic and alteration study (similar to that of Reid, 2001) is beyond the scope of this report. The new analyses were based on existing samples lodged in the Mineral Resources Tasmania rock/core store, and had two main sources: 0 Diamond-drill core from the more recent phases of company mineral exploration of the Thomas Creek prospect (these samples are all from the intrusive complex); 0 Surface rock samples collected in the late 1980s during the then Tasmania Department of Mines, Point Hibbs 1:50 000 scale geological mapping project (these samples are largely from the andesitic lava sequence, but include two samples of diorite from the intrusive complex). Representative photomicrographs of the analysed samples are shown in Figure 1. Geological setting The Thomas Creek intrusive complex is a component of the Noddy Creek Volcanics, a 50 km long north-south belt of intermediate to acid volcanic, volcaniclastic and intrusive rocks which extends somewhat discontinuously from just south of Asbestos Point on the southern shore of Macquarie Harbour, to south of High Rocky Point on the southwest coast (Brown, 1988; Brown et al., 1991; McClenaghan and Findlay, 1993). The most volumetrically significant components are in the northern 20 km of the belt (fig. 2). The Noddy Creek Volcanics belt lies some 10–15 km west of the main axis of the economically important Middle Cambrian Mount Read Volcanics belt, but is believed to be related to it. This is based on major and trace element geochemistry (McClenaghan and Findlay, 1993) and a U-Pb SHRIMP radiometric age of 502.8 ± 4.4 Ma (middle Middle Cambrian) obtained from igneous zircon in a felsic intrusive rock in the Timbertops area (fig. 2) (Black et al., 1997). The main focus of this report is the study of an oval-shaped dioritic intrusive complex (the Thomas Creek intrusive complex) which occurs near the southern end of the area of more substantial units in Tasmanian Geological Survey Record 2005/06 1 New whole-rock geochemical analyses of the Middle Cambrian Thomas Creek intrusive complex and associated lavas of the Noddy Creek Volcanics, western Tasmania R. Reid, M. P. McClenaghan and D. B. Seymour DEPARTMENT of INFRASTRUCTURE, ENERGY and RESOURCES Tasmania Mineral Resources Tasmania Tasmanian Geological Survey Record 2005/06 Abstract Geochemical analyses (major and trace elements) of volcanic and igneous intrusive rocks from the Thomas Creek intrusive complex and its surrounds show that the rocks are a comagmatic suite of andesite and rhyodacite-dacite, correlating with previously recognised suites I and III of the Mt Read Volcanics. Pearce Element Ratio (PER) analysis indicates a primary geochemical variation due to igneous fractionation of clinopyroxene and plagioclase, with clinopyroxene crystallisation dominant early in the process. Hydrothermal alteration effects involved formation of K-feldspar, muscovite and chlorite, with associated loss of Na and Ca and gain of K. Separate but parallel K enrichment trends suggest that K metasomatism occurred in two phases, affecting rocks at different stages of fractionation. A possible explanation for this is a link between alteration (and mineralisation) and periodic pressure release at the top of the intrusion.
Transcript
Introduction
The primary purpose of the study reported here was to
carry out whole-rock major and trace-element
geochemical analyses of a suite of previously
unanalysed samples from the Thomas Creek intrusive
complex and the adjacent andesitic lava sequence, and
present the new results together with previous
analyses (Table 1). Some first-pass interpretation of the
geochemistry is presented. However, placing the new
geochemistry in the context of a detailed paragenetic
and alteration study (similar to that of Reid, 2001) is
beyond the scope of this report. The new analyses were
based on existing samples lodged in the Mineral
Resources Tasmania rock/core store, and had two
main sources:
0 Diamond-drill core from the more recent phases of
company mineral exploration of the Thomas Creek
prospect (these samples are all from the intrusive
complex);
0 Surface rock samples collected in the late 1980s
during the then Tasmania Department of Mines,
Point Hibbs 1:50 000 scale geological mapping
project (these samples are largely from the andesitic
lava sequence, but include two samples of diorite
from the intrusive complex).
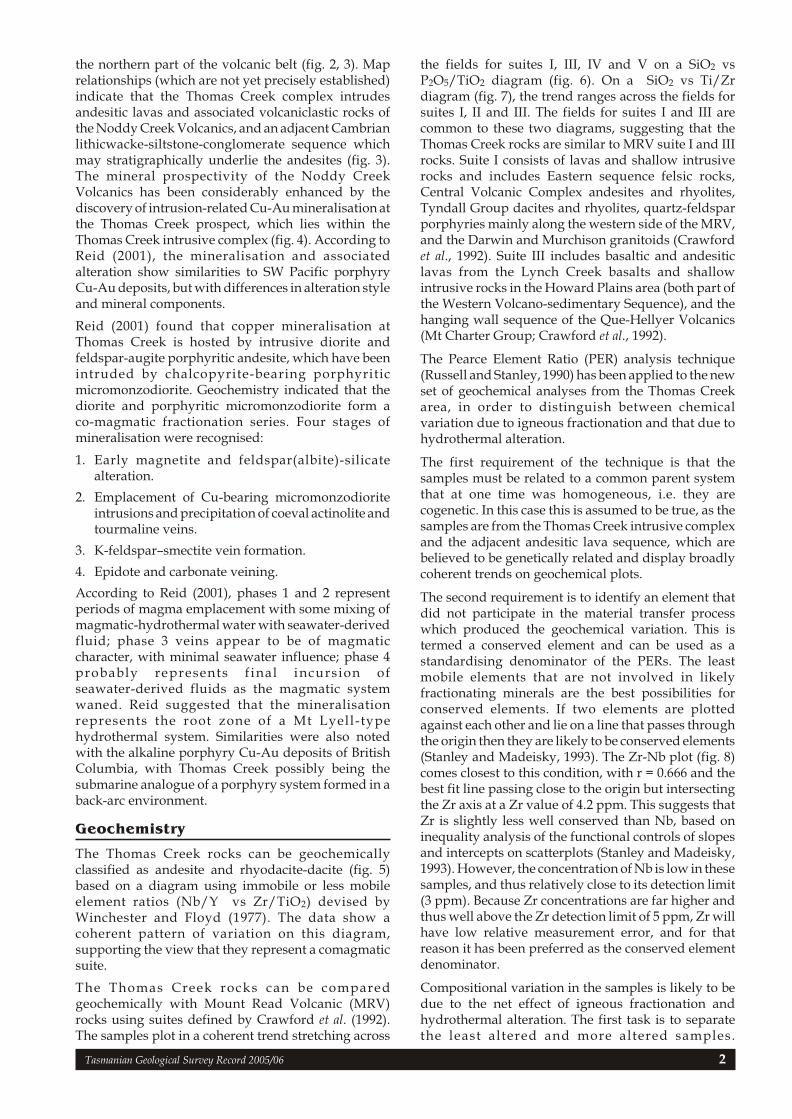
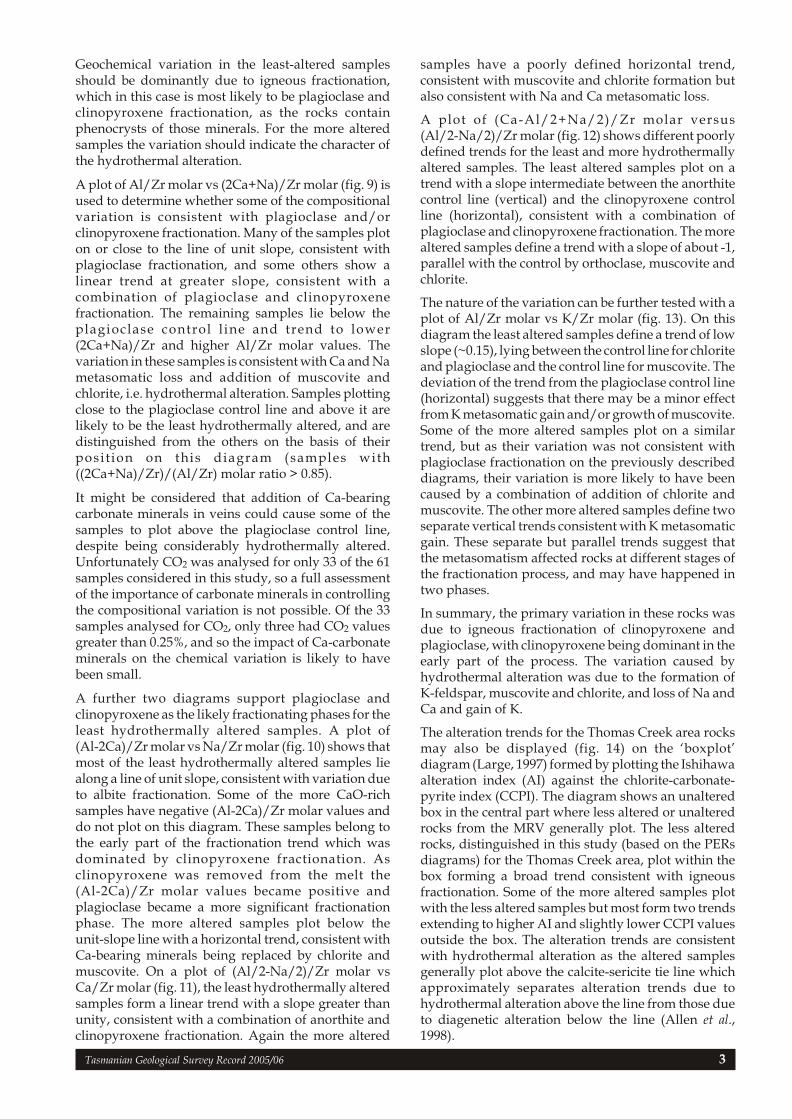
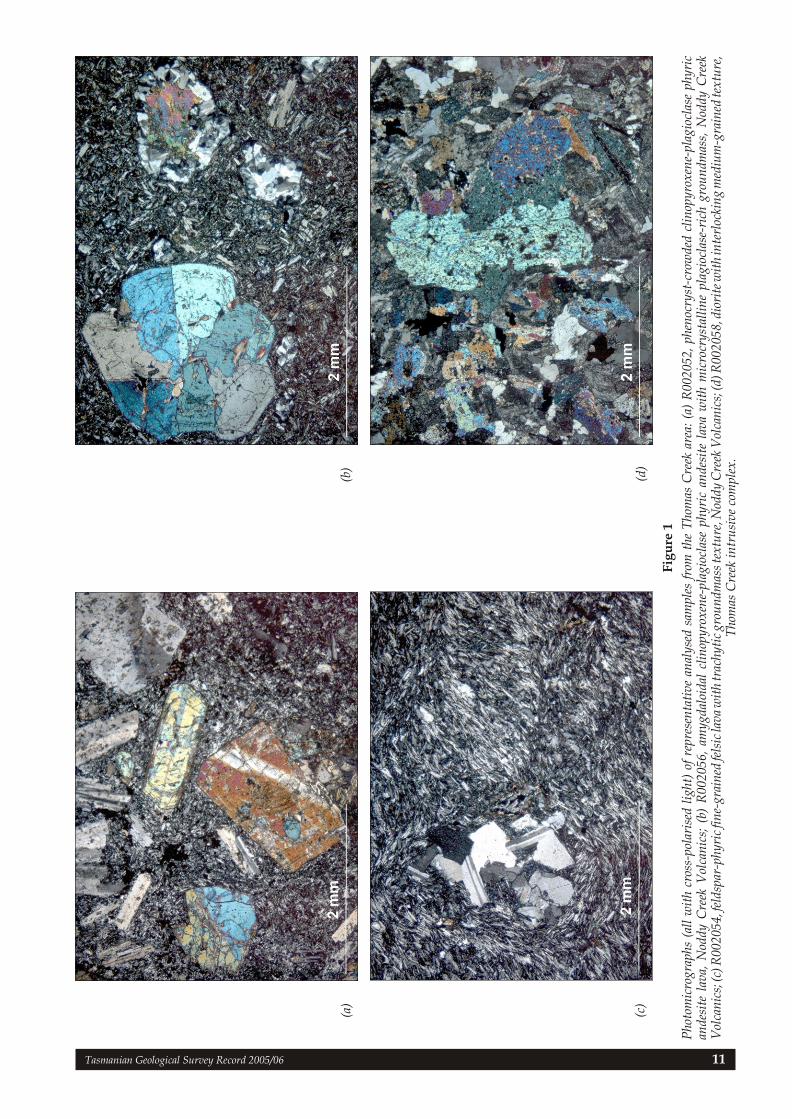
Representative photomicrographs of the analysedsamples are shown in Figure 1.
Geological setting
The Thomas Creek intrusive complex is a componentof the Noddy Creek Volcanics, a 50 km longnorth-south belt of intermediate to acid volcanic,volcaniclastic and intrusive rocks which extendssomewhat discontinuously from just south of Asbestos Point on the southern shore of Macquarie Harbour, tosouth of High Rocky Point on the southwest coast(Brown, 1988; Brown et al., 1991; McClenaghan andFindlay, 1993). The most volumetrically significantcomponents are in the northern 20 km of the belt(fig. 2). The Noddy Creek Volcanics belt lies some10–15 km west of the main axis of the economicallyimportant Middle Cambrian Mount Read Volcanicsbelt, but is believed to be related to it. This is based onmajor and trace element geochemistry (McClenaghanand Findlay, 1993) and a U-Pb SHRIMP radiometricage of 502.8 ± 4.4 Ma (middle Middle Cambrian)obtained from igneous zircon in a felsic intrusive rockin the Timbertops area (fig. 2) (Black et al., 1997).
The main focus of this report is the study of anoval-shaped dioritic intrusive complex (the ThomasCreek intrusive complex) which occurs near thesouthern end of the area of more substantial units in
Tasmanian Geological Survey Record 2005/06 1
New whole-rock geochemical analyses of theMiddle Cambrian Thomas Creek intrusive
complex and associated lavas of the NoddyCreek Volcanics, western Tasmania
R. Reid, M. P. McClenaghan and D. B. Seymour
DEPARTMENT ofINFRASTRUCTURE,
ENERGY and RESOURCES
Tasmania
Mineral Resources Tasmania
Tasmanian Geological Survey
Record 2005/06
Abstract
Geochemical analyses (major and trace elements) of volcanic and igneous intrusive rocks from the ThomasCreek intrusive complex and its surrounds show that the rocks are a comagmatic suite of andesite andrhyodacite-dacite, correlating with previously recognised suites I and III of the Mt Read Volcanics. PearceElement Ratio (PER) analysis indicates a primary geochemical variation due to igneous fractionation ofclinopyroxene and plagioclase, with clinopyroxene crystallisation dominant early in the process.Hydrothermal alteration effects involved formation of K-feldspar, muscovite and chlorite, with associatedloss of Na and Ca and gain of K. Separate but parallel K enrichment trends suggest that K metasomatismoccurred in two phases, affecting rocks at different stages of fractionation. A possible explanation for this is alink between alteration (and mineralisation) and periodic pressure release at the top of the intrusion.
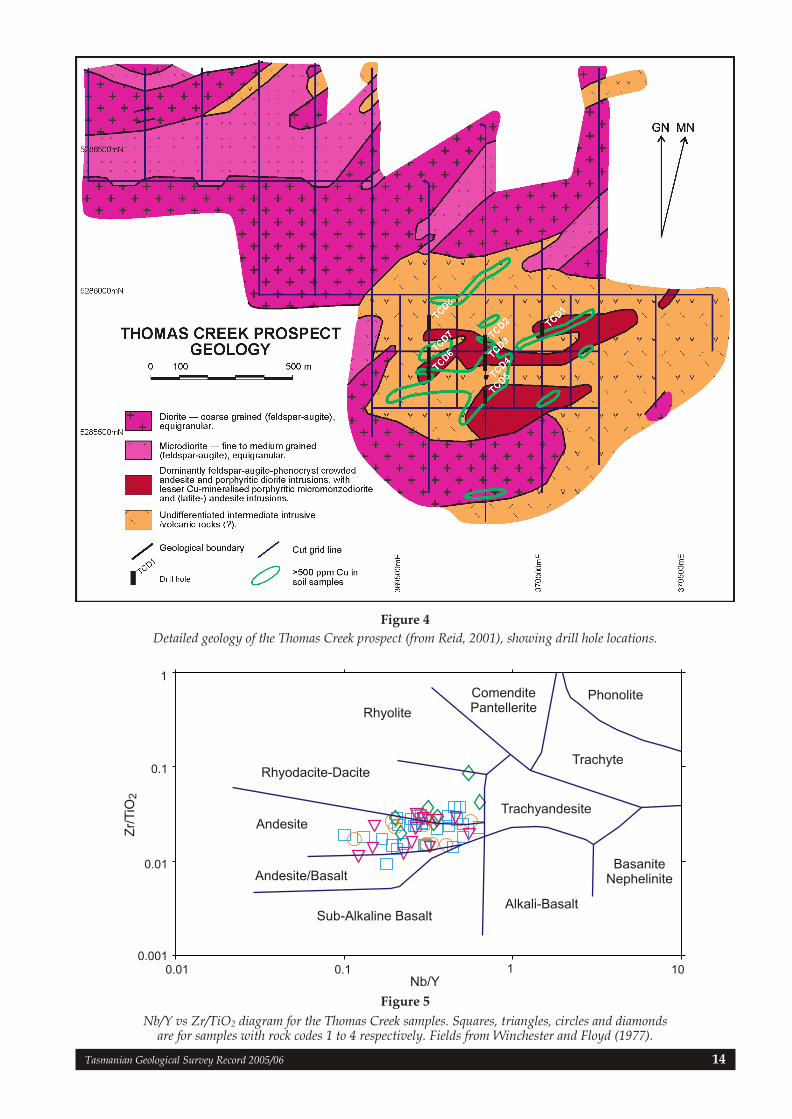
the northern part of the volcanic belt (fig. 2, 3). Maprelationships (which are not yet precisely established)indicate that the Thomas Creek complex intrudesandesitic lavas and associated volcaniclastic rocks ofthe Noddy Creek Volcanics, and an adjacent Cambrian lithicwacke-siltstone-conglomerate sequence whichmay stratigraphically underlie the andesites (fig. 3).The mineral prospectivity of the Noddy CreekVolcanics has been considerably enhanced by thediscovery of intrusion-related Cu-Au mineralisation at the Thomas Creek prospect, which lies within theThomas Creek intrusive complex (fig. 4). According toReid (2001), the mineralisation and associatedalteration show similarities to SW Pacific porphyryCu-Au deposits, but with differences in alteration style and mineral components.
Reid (2001) found that copper mineralisation atThomas Creek is hosted by intrusive diorite andfeldspar-augite porphyritic andesite, which have beenintruded by chalcopyrite-bearing porphyriticmicromonzodiorite. Geochemistry indicated that thediorite and porphyritic micromonzodiorite form aco-magmatic fractionation series. Four stages ofmineralisation were recognised:
1. Early magnetite and feldspar(albite)-silicatealteration.
2. Emplacement of Cu-bearing micromonzodioriteintrusions and precipitation of coeval actinolite and tourmaline veins.
3. K-feldspar–smectite vein formation.
4. Epidote and carbonate veining.
According to Reid (2001), phases 1 and 2 representperiods of magma emplacement with some mixing ofmagmatic-hydrothermal water with seawater-derived fluid; phase 3 veins appear to be of magmaticcharacter, with minimal seawater influence; phase 4probably represents f inal incursion ofseawater-derived fluids as the magmatic systemwaned. Reid suggested that the mineralisationrepresents the root zone of a Mt Lyell-typehydrothermal system. Similarities were also notedwith the alkaline porphyry Cu-Au deposits of BritishColumbia, with Thomas Creek possibly being thesubmarine analogue of a porphyry system formed in aback-arc environment.
Geochemistry
The Thomas Creek rocks can be geochemicallyclassified as andesite and rhyodacite-dacite (fig. 5)based on a diagram using immobile or less mobileelement ratios (Nb/Y vs Zr/TiO2) devised byWinchester and Floyd (1977). The data show acoherent pattern of variation on this diagram,supporting the view that they represent a comagmaticsuite.
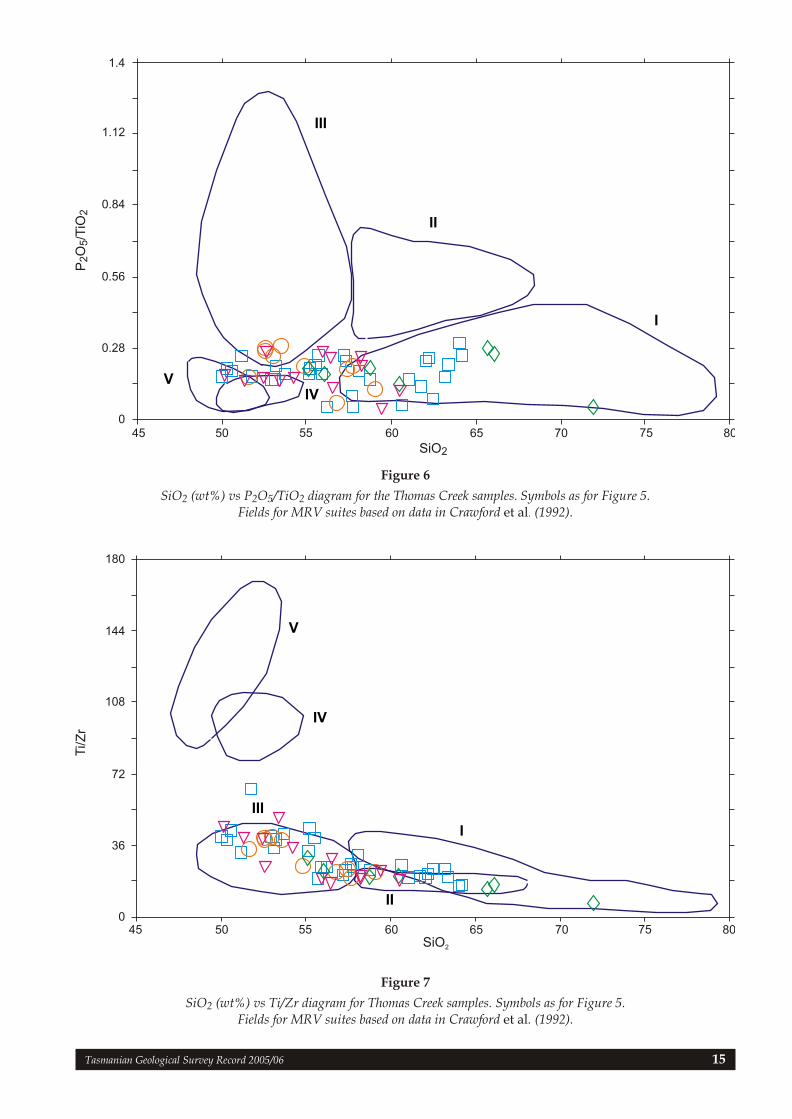
The Thomas Creek rocks can be comparedgeochemically with Mount Read Volcanic (MRV)rocks using suites defined by Crawford et al. (1992).The samples plot in a coherent trend stretching across
the fields for suites I, III, IV and V on a SiO2 vsP2O5/TiO2 diagram (fig. 6). On a SiO2 vs Ti/Zrdiagram (fig. 7), the trend ranges across the fields forsuites I, II and III. The fields for suites I and III arecommon to these two diagrams, suggesting that theThomas Creek rocks are similar to MRV suite I and IIIrocks. Suite I consists of lavas and shallow intrusiverocks and includes Eastern sequence felsic rocks,Central Volcanic Complex andesites and rhyolites,Tyndall Group dacites and rhyolites, quartz-feldsparporphyries mainly along the western side of the MRV,and the Darwin and Murchison granitoids (Crawfordet al., 1992). Suite III includes basaltic and andesiticlavas from the Lynch Creek basalts and shallowintrusive rocks in the Howard Plains area (both part ofthe Western Volcano-sedimentary Sequence), and thehanging wall sequence of the Que-Hellyer Volcanics(Mt Charter Group; Crawford et al., 1992).
The Pearce Element Ratio (PER) analysis technique(Russell and Stanley, 1990) has been applied to the new set of geochemical analyses from the Thomas Creekarea, in order to distinguish between chemicalvariation due to igneous fractionation and that due tohydrothermal alteration.
The first requirement of the technique is that thesamples must be related to a common parent systemthat at one time was homogeneous, i.e. they arecogenetic. In this case this is assumed to be true, as thesamples are from the Thomas Creek intrusive complexand the adjacent andesitic lava sequence, which arebelieved to be genetically related and display broadlycoherent trends on geochemical plots.
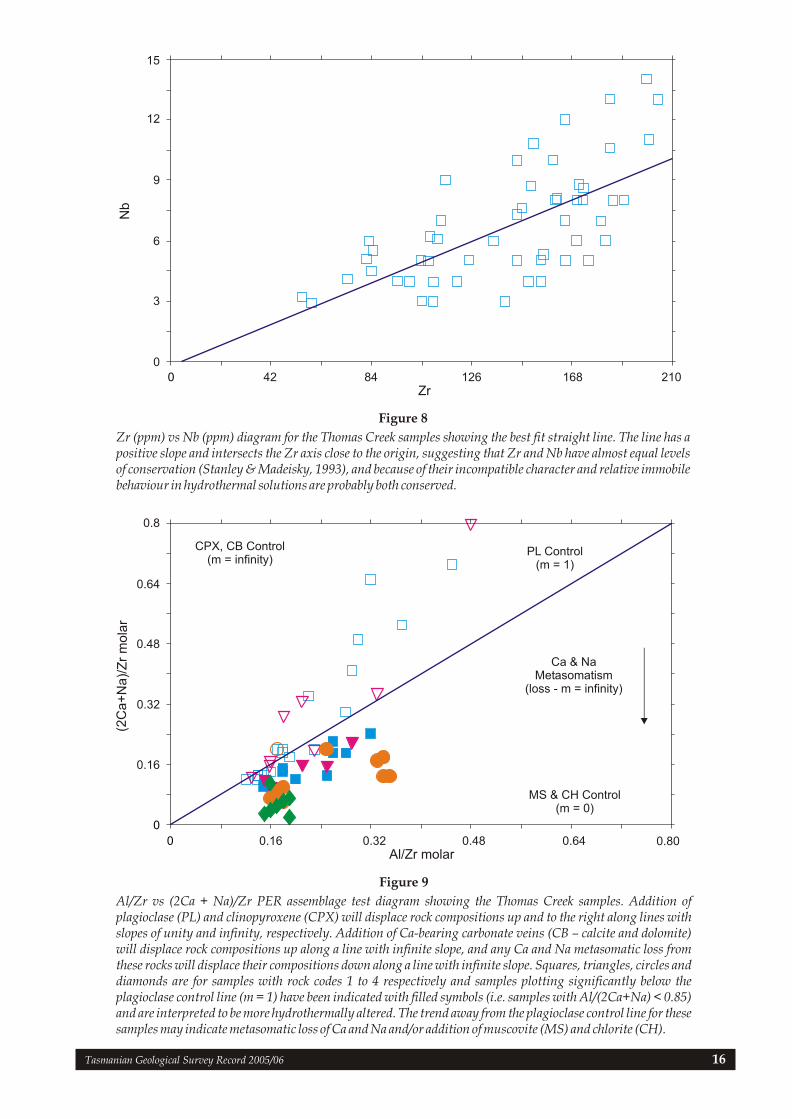
The second requirement is to identify an element thatdid not participate in the material transfer processwhich produced the geochemical variation. This istermed a conserved element and can be used as astandardising denominator of the PERs. The leastmobile elements that are not involved in likelyfractionating minerals are the best possibilities forconserved elements. If two elements are plottedagainst each other and lie on a line that passes throughthe origin then they are likely to be conserved elements (Stanley and Madeisky, 1993). The Zr-Nb plot (fig. 8)comes closest to this condition, with r = 0.666 and thebest fit line passing close to the origin but intersectingthe Zr axis at a Zr value of 4.2 ppm. This suggests thatZr is slightly less well conserved than Nb, based oninequality analysis of the functional controls of slopesand intercepts on scatterplots (Stanley and Madeisky,1993). However, the concentration of Nb is low in these samples, and thus relatively close to its detection limit(3 ppm). Because Zr concentrations are far higher andthus well above the Zr detection limit of 5 ppm, Zr willhave low relative measurement error, and for thatreason it has been preferred as the conserved elementdenominator.
Compositional variation in the samples is likely to bedue to the net effect of igneous fractionation andhydrothermal alteration. The first task is to separatethe least altered and more altered samples.
Tasmanian Geological Survey Record 2005/06 2
Geochemical variation in the least-altered samplesshould be dominantly due to igneous fractionation,which in this case is most likely to be plagioclase andclinopyroxene fractionation, as the rocks containphenocrysts of those minerals. For the more alteredsamples the variation should indicate the character ofthe hydrothermal alteration.
A plot of Al/Zr molar vs (2Ca+Na)/Zr molar (fig. 9) isused to determine whether some of the compositionalvariation is consistent with plagioclase and/orclinopyroxene fractionation. Many of the samples ploton or close to the line of unit slope, consistent withplagioclase fractionation, and some others show alinear trend at greater slope, consistent with acombination of plagioclase and clinopyroxenefractionation. The remaining samples lie below theplagioclase control l ine and trend to lower(2Ca+Na)/Zr and higher Al/Zr molar values. Thevariation in these samples is consistent with Ca and Na metasomatic loss and addition of muscovite andchlorite, i.e. hydrothermal alteration. Samples plottingclose to the plagioclase control line and above it arelikely to be the least hydrothermally altered, and aredistinguished from the others on the basis of theirposition on this diagram (samples with((2Ca+Na)/Zr)/(Al/Zr) molar ratio > 0.85).
It might be considered that addition of Ca-bearingcarbonate minerals in veins could cause some of thesamples to plot above the plagioclase control line,despite being considerably hydrothermally altered.Unfortunately CO2 was analysed for only 33 of the 61samples considered in this study, so a full assessmentof the importance of carbonate minerals in controllingthe compositional variation is not possible. Of the 33samples analysed for CO2, only three had CO2 valuesgreater than 0.25%, and so the impact of Ca-carbonateminerals on the chemical variation is likely to havebeen small.
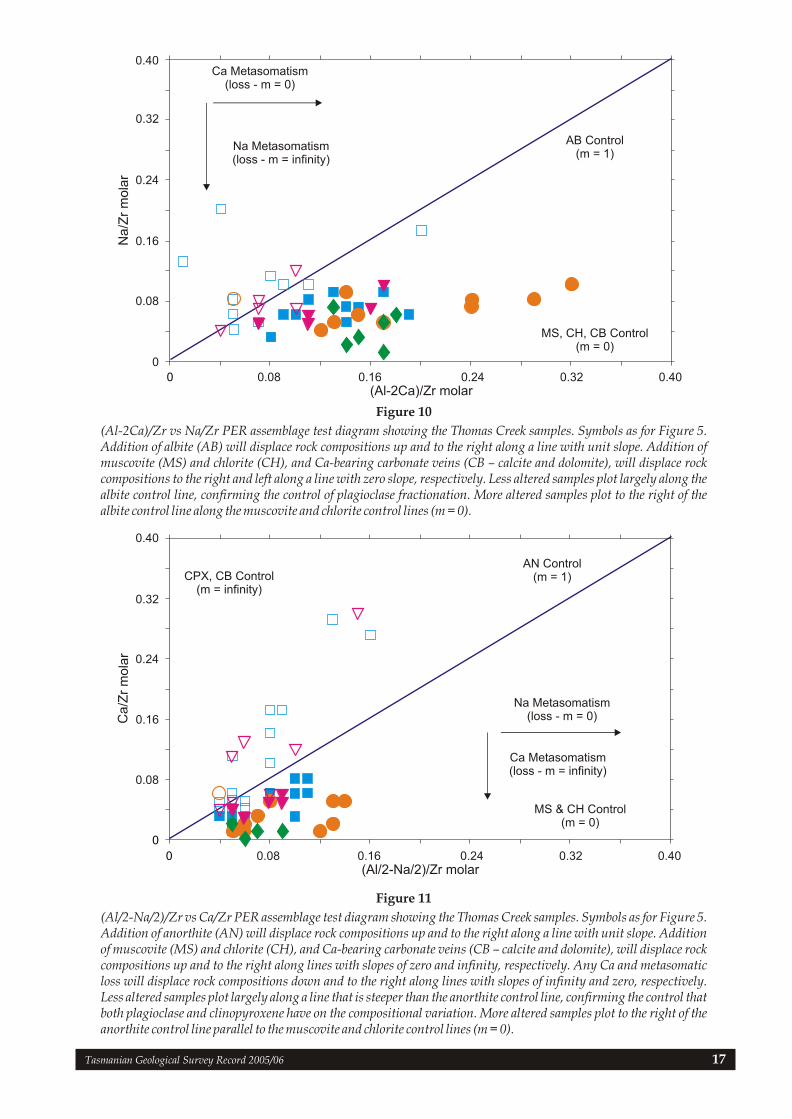
A further two diagrams support plagioclase andclinopyroxene as the likely fractionating phases for theleast hydrothermally altered samples. A plot of(Al-2Ca)/Zr molar vs Na/Zr molar (fig. 10) shows that most of the least hydrothermally altered samples liealong a line of unit slope, consistent with variation dueto albite fractionation. Some of the more CaO-richsamples have negative (Al-2Ca)/Zr molar values anddo not plot on this diagram. These samples belong tothe early part of the fractionation trend which wasdominated by clinopyroxene fractionation. Asclinopyroxene was removed from the melt the(Al-2Ca)/Zr molar values became positive andplagioclase became a more significant fractionationphase. The more altered samples plot below theunit-slope line with a horizontal trend, consistent withCa-bearing minerals being replaced by chlorite andmuscovite. On a plot of (Al/2-Na/2)/Zr molar vsCa/Zr molar (fig. 11), the least hydrothermally alteredsamples form a linear trend with a slope greater thanunity, consistent with a combination of anorthite andclinopyroxene fractionation. Again the more altered
samples have a poorly defined horizontal trend,consistent with muscovite and chlorite formation butalso consistent with Na and Ca metasomatic loss.
A plot of (Ca-Al/2+Na/2)/Zr molar versus(Al/2-Na/2)/Zr molar (fig. 12) shows different poorlydefined trends for the least and more hydrothermallyaltered samples. The least altered samples plot on atrend with a slope intermediate between the anorthitecontrol line (vertical) and the clinopyroxene controlline (horizontal), consistent with a combination ofplagioclase and clinopyroxene fractionation. The more altered samples define a trend with a slope of about -1,parallel with the control by orthoclase, muscovite andchlorite.
The nature of the variation can be further tested with aplot of Al/Zr molar vs K/Zr molar (fig. 13). On thisdiagram the least altered samples define a trend of lowslope (~0.15), lying between the control line for chlorite and plagioclase and the control line for muscovite. Thedeviation of the trend from the plagioclase control line(horizontal) suggests that there may be a minor effectfrom K metasomatic gain and/or growth of muscovite. Some of the more altered samples plot on a similartrend, but as their variation was not consistent withplagioclase fractionation on the previously describeddiagrams, their variation is more likely to have beencaused by a combination of addition of chlorite andmuscovite. The other more altered samples define twoseparate vertical trends consistent with K metasomaticgain. These separate but parallel trends suggest thatthe metasomatism affected rocks at different stages ofthe fractionation process, and may have happened intwo phases.
In summary, the primary variation in these rocks wasdue to igneous fractionation of clinopyroxene andplagioclase, with clinopyroxene being dominant in theearly part of the process. The variation caused byhydrothermal alteration was due to the formation ofK-feldspar, muscovite and chlorite, and loss of Na andCa and gain of K.
The alteration trends for the Thomas Creek area rocksmay also be displayed (fig. 14) on the ‘boxplot’diagram (Large, 1997) formed by plotting the Ishihawa alteration index (AI) against the chlorite-carbonate-pyrite index (CCPI). The diagram shows an unalteredbox in the central part where less altered or unalteredrocks from the MRV generally plot. The less alteredrocks, distinguished in this study (based on the PERsdiagrams) for the Thomas Creek area, plot within thebox forming a broad trend consistent with igneousfractionation. Some of the more altered samples plotwith the less altered samples but most form two trendsextending to higher AI and slightly lower CCPI valuesoutside the box. The alteration trends are consistentwith hydrothermal alteration as the altered samplesgenerally plot above the calcite-sericite tie line whichapproximately separates alteration trends due tohydrothermal alteration above the line from those dueto diagenetic alteration below the line (Allen et al.,1998).
Tasmanian Geological Survey Record 2005/06 3
Conclusions
This study has shown that the Thomas Creek rocks can
be geochemically classified as andesite and
rhyodacite-dacite, and that they represent a
comagmatic suite. Immobile element ratios indicate
that they correlate geochemically with suites I and III
of the Mt Read Volcanics, using the definitions of
Crawford et al. (1992).
Pearce Element Ratio (PER) analysis applied to the
Thomas Creek samples indicates a primary
geochemical variation due to igneous fractionation of
clinopyroxene and plagioclase, with clinopyroxene
crystallisation dominant in the early part of the
process.
PER analysis also indicates hydrothermal alteration
effects, involving the formation of K-feldspar,
muscovite and chlorite, and the loss of Na and Ca and
gain of K. Separate but parallel alteration trends of K
enrichment on some geochemical plots suggest that K
metasomatism affected rocks at different stages of
fractionation, and so may have occurred in two phases.
One possible explanation is a link between alteration
(and mineralisation) and periodic pressure release at
the top of the intrusion.
Because this study is based only on overall
geochemical trends in the analysed samples, it does
not represent a test of the detailed paragenetic/
mineralisation model of Reid (2001). The new
geochemical data would provide a basis for further
such detailed research.
Acknowledgements
Dr Jafar Taheri and Dr Geoff Green are thanked for
reviewing the manuscript.
References
ALLEN, R. L.; GIFKINS, C. C.; LARGE, R. R.; HERRMANN, W.1998. Discrimination of diagenetic, hydrothermal andmetamorphic alteration. Report AMIRA/ARC Project P4391:73–78.
BLACK, L. P.; SEYMOUR, D. B.; CORBETT, K. D.; COX, S. E.;STREIT, J. E.; BOTTRILL, R. S.; CALVER, C. R.; EVERARD, J. L.;GREEN, G. R.; MCCLENAGHAN, M. P.; PEMBERTON, J.;TAHERI, J.; TURNER, N. J. 1997. Dating Tasmania’s oldestgeological events. Record Australian Geological SurveyOrganisation 1997/15.
BROWN, A. V. 1988. Geological Atlas 1:50 000 series. Sheet 78(7912S). Montgomery. Department of Mines Tasmania.
BROWN, A. V.; FINDLAY, R. H.; MCCLENAGHAN, M. P.;SEYMOUR, D. B. 1991. Synopsis of the regional geology ofthe Macquarie Harbour, Point Hibbs and Montgomery1:50 000 map sheets. Report Department of Resources andEnergy Tasmania 1991/21.
CORBETT, K. D. 2002. Bedrock geological map of the ElliottBay–Macquarie Harbour area, south-west Tasmania. MineralResources Tasmania.
CRAWFORD, A. J.; CORBETT, K. D.; EVERARD, J. L. 1992.Geochemistry of the Cambrian volcanic-hosted massivesulphide-rich Mount Read Volcanics, Tasmania, and some tectonic implications. Economic Geology 87:597–619.
LARGE, R. R. 1997. The Hercules-Mt Read traverse:Relationships between volcanic mineralogy, alterationand geochemistry. Report AMIRA/ARC Project P4393:153–233.
MCCLENAGHAN, M. P.; FINDLAY, R. H. 1993. GeologicalAtlas 1:50 000 series. Sheet 64 (7913S). Macquarie Harbour. Explanatory Report Geological Survey Tasmania.
REID, R. 2001. Cambrian intrusion-related copper mineralisationat the Thomas Creek prospect, southwestern Tasmania. M.Econ. Geology thesis, University of Tasmania, Hobart.
RUSSELL, J. K.; STANLEY, C. R. (ed.). 1990. Theory andapplication of Pearce Element Ratios to geochemical dataanalysis. Short Course Notes Geological Association of Canada8.
SEYMOUR, D. B.; GREEN, D. 2001. Digital Geological Atlas1:25 000 scale series. Sheet 3628. Hibbs. Mineral ResourcesTasmania.
STANLEY, C. R.; MADEISKY, H. E. 1993. Pearce Element RatioAnalysis: Applications in lithogeochemical exploration.Short Course Notes Mineral Deposit Research Unit, Universityof British Columbia 8.
WINCHESTER, J. A.; FLOYD, P. A. 1977. Geochemicaldiscrimination of different magma series and theirdifferentiation products using immobile elements.Chemical Geology 20:325-343.
[2 November 2005]
Tasmanian Geological Survey Record 2005/06 4
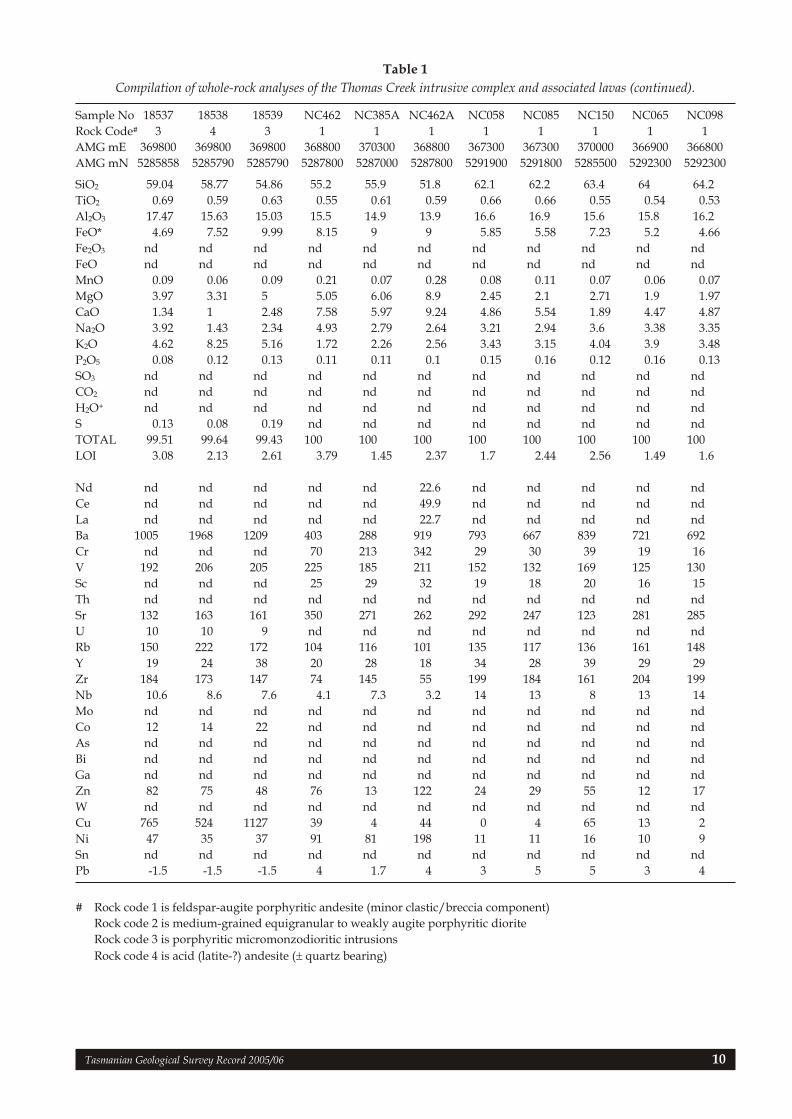
Table 1
Compilation of whole-rock analyses of the Thomas Creek intrusive complex and associated lavas.
Geology of the Noddy Creek Volcanics in the Thomas Creek–Timbertops Creek area after Seymour and Green (2001), showingrelationships between the Thomas Creek intrusive complex, adjacent andesitic lava-volcaniclastic sequence,
Detailed geology of the Thomas Creek prospect (from Reid, 2001), showing drill hole locations.
Figure 5
Nb/Y vs Zr/TiO2 diagram for the Thomas Creek samples. Squares, triangles, circles and diamondsare for samples with rock codes 1 to 4 respectively. Fields from Winchester and Floyd (1977).
Tasmanian Geological Survey Record 2005/06 14
0.01
Zr/
TiO
2
1
0.1
0.01
0.001
Nb/Y0.1 1 10
Phonolite
Trachyte
Rhyolite
Andesite
Rhyodacite-Dacite
Andesite/Basalt
Sub-Alkaline BasaltAlkali-Basalt
Trachyandesite
BasaniteNephelinite
ComenditePantellerite
Tasmanian Geological Survey Record 2005/06 15
I
V
IV
I
II
III
V
SiO2
45 50 55 60 65 70 75 80
Ti/Z
r
180
144
108
72
36
0
SiO2
45 50 55 60 65 70 75 80
1.4
1.12
0.84
0.56
0.28
0
PO
/TiO
25
2
IV
III
II
Figure 6
SiO (wt%) vs P O /TiO diagram for the Thomas Creek samples. Symbols as for Figure 5.2 2 5 2
Fields for MRV suites based on data in Crawford et al. (1992).
Figure 7
SiO (wt%) vs Ti/Zr diagram for Thomas Creek samples. Symbols as for Figure 5.2
Fields for MRV suites based on data in Crawford et al. (1992).
Tasmanian Geological Survey Record 2005/06 16
Figure 8
Zr (ppm) vs Nb (ppm) diagram for the Thomas Creek samples showing the best fit straight line. The line has a positive slope and intersects the Zr axis close to the origin, suggesting that Zr and Nb have almost equal levels of conservation (Stanley & Madeisky, 1993), and because of their incompatible character and relative immobile behaviour in hydrothermal solutions are probably both conserved.
Figure 9
Al/Zr vs (2Ca + Na)/Zr PER assemblage test diagram showing the Thomas Creek samples. Addition of plagioclase (PL) and clinopyroxene (CPX) will displace rock compositions up and to the right along lines with slopes of unity and infinity, respectively. Addition of Ca-bearing carbonate veins (CB – calcite and dolomite) will displace rock compositions up along a line with infinite slope, and any Ca and Na metasomatic loss from these rocks will displace their compositions down along a line with infinite slope. Squares, triangles, circles and diamonds are for samples with rock codes 1 to 4 respectively and samples plotting significantly below the plagioclase control line (m = 1) have been indicated with filled symbols (i.e. samples with Al/(2Ca+Na) < 0.85) and are interpreted to be more hydrothermally altered. The trend away from the plagioclase control line for these samples may indicate metasomatic loss of Ca and Na and/or addition of muscovite (MS) and chlorite (CH).
Ca & NaMetasomatism
(loss - m = infinity)
PL Control(m = 1)
MS & CH Control(m = 0)
CPX, CB Control(m = infinity)
0.16 0.32 0.48 0.64 0.80
42 84 168 210
15
12
9
6
3
0
0.8
0.64
0.48
0.32
0.16
Nb
0Zr
0
(2C
a+
Na
)/Z
r m
ola
r
0Al/Zr molar
126
Tasmanian Geological Survey Record 2005/06 17
Ca Metasomatism(loss - m = infinity)
MS & CH Control(m = 0)
Na Metasomatism(loss - m = 0)
CPX, CB Control(m = infinity)
AN Control(m = 1)
Na
/Zr
mo
lar
Ca Metasomatism(loss - m = 0)
Na Metasomatism(loss - m = infinity)
MS, CH, CB Control(m = 0)
0.08 0.16 0.32 0.400(Al-2Ca)/Zr molar
0.24
0.40
0.32
0.24
0.16
0.08
0
0.08 0.16 0.32 0.400(Al/2-Na/2)/Zr molar
0.24
0.40
0.32
0.24
0.16
0.08
0
Ca
/Zr
mo
lar
AB Control(m = 1)
Figure 10
(Al-2Ca)/Zr vs Na/Zr PER assemblage test diagram showing the Thomas Creek samples. Symbols as for Figure 5. Addition of albite (AB) will displace rock compositions up and to the right along a line with unit slope. Addition of muscovite (MS) and chlorite (CH), and Ca-bearing carbonate veins (CB – calcite and dolomite), will displace rock compositions to the right and left along a line with zero slope, respectively. Less altered samples plot largely along the albite control line, confirming the control of plagioclase fractionation. More altered samples plot to the right of the albite control line along the muscovite and chlorite control lines (m = 0).
Figure 11
(Al/2-Na/2)/Zr vs Ca/Zr PER assemblage test diagram showing the Thomas Creek samples. Symbols as for Figure 5. Addition of anorthite (AN) will displace rock compositions up and to the right along a line with unit slope. Addition of muscovite (MS) and chlorite (CH), and Ca-bearing carbonate veins (CB – calcite and dolomite), will displace rock compositions up and to the right along lines with slopes of zero and infinity, respectively. Any Ca and metasomatic loss will displace rock compositions down and to the right along lines with slopes of infinity and zero, respectively. Less altered samples plot largely along a line that is steeper than the anorthite control line, confirming the control that both plagioclase and clinopyroxene have on the compositional variation. More altered samples plot to the right of the anorthite control line parallel to the muscovite and chlorite control lines (m = 0).
Tasmanian Geological Survey Record 2005/06 18
Al/Zr molar
(Al/2
-Na
/2)/
Zr
mo
lar
(Ca-Al/2+Na/2)/Zr molar
OR Control(m = 1)
MS Control(m = 0.33)
CH, PL Control(m = 0)
K Metasomatism(gain - m = infinity)
AN Control(m = infinity)
CPX, CB Control(m = 0)
OR, MS, CH Control(m = -1)
Na Metasomatism(loss - m = -1)
0.2
0.16
0.12
0.08
0.04
0
-0.12 -4.00 0.12 0.20 4.00
0.25
0.20
0.15
0.10
0.05
0
K/Z
r m
ola
r
0.1 0.2 0.4 0.50 0.3
Figure 12
(Ca-Al/2+Na/2)/Zr vs (Al/2-Na/2)/Zr PER assemblage test diagram showing the Thomas Creek samples. Symbols as for Figure 5. Addition of anorthite (AN) and clinopyroxene (CPX) will displace rock compositions up and to the right along lines with slopes of infinity and zero, respectively. The less altered samples plot on a trend intermediate between these two lines indicating fractionation by anorthite and clinopyroxene. Addition of orthoclase (OR), muscovite (MS) and chlorite (CH) will displace rock compositions up and to the left on a line of negative unit slope. The more altered samples lie on trend with the same slope consistent with the addition of those minerals. This trend is also consistent with Na metasomatic loss.
Figure 13
Al/Zr vs K/Zr PER assemblage test diagram showing the Thomas Creek samples. Symbols as for Figure 5. Addition of orthoclase (OR) will displace rock compositions along lines of unit slope, and addition of chlorite (CH) and plagioclase (PL) will displace rock compositions along a line of zero slope. Addition of muscovite (MS) will displace rock compositions up and to the right along a line of slope 1/3. K metasomatic gain will displace rock compositions up the diagram with a slope of infinity.
Tasmanian Geological Survey Record 2005/06 19
sericite
20 40 60 80 100AI
00
20
40
60
80
100
CC
PI
chlorite
Figure 14
Thomas Creek area rocks displayed on the ‘boxplot’ diagram (Large, 1997) formed by plotting the Ishihawa alteration index (AI) (100(K O+MgO)/(K O+MgO+Na O+CaO) against the 2 2 2
chlorite-carbonate-pyrite index (CCPI) (100(MgO+FeO)/(MgO+FeO+Na O+K O).2 2Symbols as for Figure 5.