23
Department of Juvenile Justice Overview Senate Finance Committee Public Safety Subcommittee January 23, 2015

Department of Juvenile Justice Overview
Senate Finance CommitteePublic Safety Subcommittee
January 23, 2015

2
DJJ Budget Overview
Agenda
DJJ’s Prior Budgetary Reductions DJJ’s October 2014 Budgetary Actions Juvenile Justice Trends Current Facilities & Juvenile Correctional
Center (JCC) Population Future Initiatives & Needs

3
Prior DJJ Budget Reductions
Significant Reductions Taken in Last Two Budgets ($26 Million and 482 Positions).
Facility Closures/Downsizing – 3 JCCs – Culpeper, Hanover, Oak Ridge
(moved to Beaumont)– 2 halfway houses – Reception and Diagnostic Center (RDC)
relocated and downsized.

4
Prior DJJ Budget Reductions
DJJ’s Division of Education
Since the merger in FY2013, DJJ’s Division of Education’s general fund budget has been reduced from $20.7 million to $12 million.
In addition, DJJ’s Division of Education’s number of funded positions for education staff has been reduced from 218 to 125.
5
October 2014 Budget Reductions
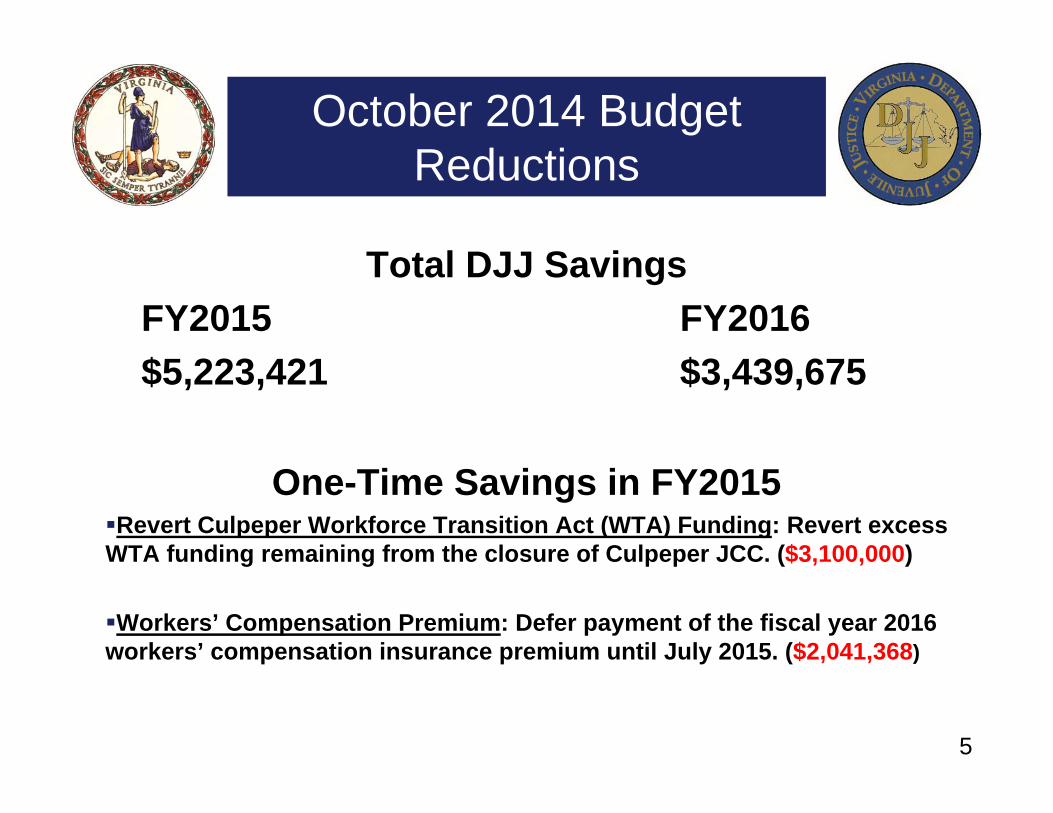
Total DJJ Savings FY2015 FY2016$5,223,421 $3,439,675
One-Time Savings in FY2015Revert Culpeper Workforce Transition Act (WTA) Funding: Revert excess WTA funding remaining from the closure of Culpeper JCC. ($3,100,000)
Workers’ Compensation Premium: Defer payment of the fiscal year 2016 workers’ compensation insurance premium until July 2015. ($2,041,368)

6
October 2014 Budget Reductions
FY2015 & FY2016 Savings
Reduce Employee Tuition Reimbursement Benefits: Reduce employee tuition reimbursement benefits in year one. Eliminate the benefit entirely in year 2. (FY15 $24,053)(FY16 $40,000)
Eliminate Agency Leadership Summit: Eliminate the annual agency-wide strategic planning leadership summit. (FY15 $48,000)(FY16 $48,000)
Reduce Employee Recognition: Reduce employee premiums such as recognition gifts and bonuses. (FY15 $10,000)(FY16 $65,860)
7
October 2014 Budget Reductions
FY2016 Savings
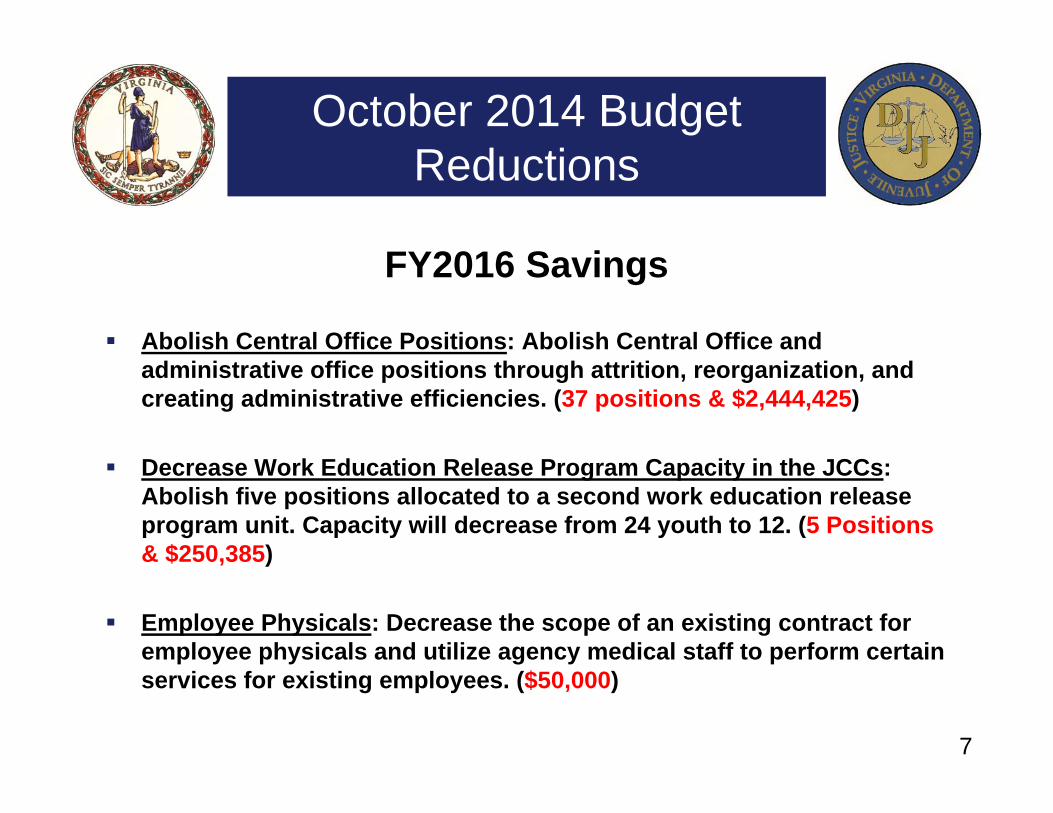
Abolish Central Office Positions: Abolish Central Office and administrative office positions through attrition, reorganization, and creating administrative efficiencies. (37 positions & $2,444,425)
Decrease Work Education Release Program Capacity in the JCCs: Abolish five positions allocated to a second work education release program unit. Capacity will decrease from 24 youth to 12. (5 Positions & $250,385)
Employee Physicals: Decrease the scope of an existing contract for employee physicals and utilize agency medical staff to perform certain services for existing employees. ($50,000)

8
October 2014 Budget Reductions
FY2016 Only Savings
Reduce Costs of Drug Testing: Reduce costs of drug testing by limiting the scope of tests run to the most common drugs, when appropriate. ($40,000)
Reduce Travel Costs: Reduce agency-wide travel costs through multiple strategies, such as teleconferencing, reliance on agency-owned vehicles, and severely limiting training-related travel. ($397,983)
Decrease Rent Costs: Relocate some agency units located in Central Office to existing space at Virginia Public Safety Training Center in order to reduce building rent costs. ($103,022)
9
FY15 Operating Budget
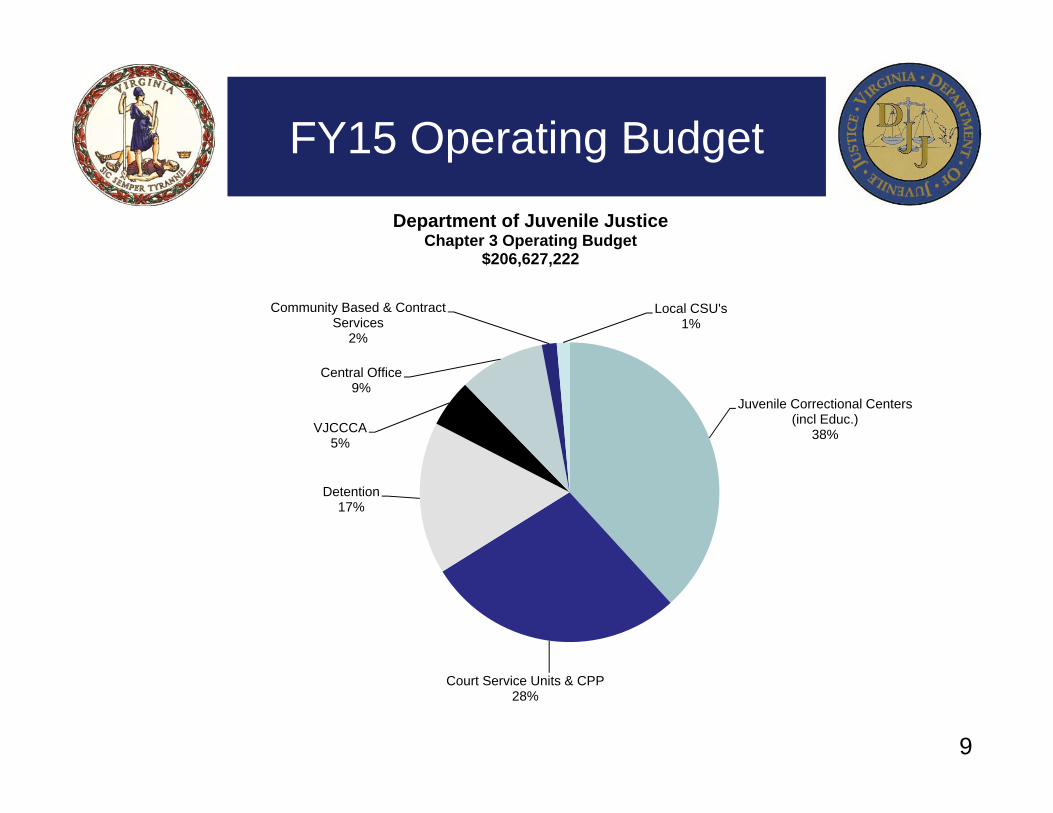
Juvenile Correctional Centers (incl Educ.)
38%
Court Service Units & CPP28%
Detention17%
VJCCCA5%
Central Office9%
Community Based & Contract Services
2%
Local CSU's1%
Department of Juvenile JusticeChapter 3 Operating Budget
$206,627,222

10
Cost Per Direct Care Bed (FY 2014)
*All direct-care related expenses are included. Expenditures for facilities that do not house residents are excluded (VPSTC, Barrett JCC, and Natural Bridge JCC). *Decimal values of ADPs are used in per capita calculations. Therefore, dividing the expenditures by the rounded ADP presented in the table will not equal the exact per capita cost. *The halfway houses were closed to juveniles in December 2013, and the CPPs opened beginning in May 2014.
11
Juvenile Correctional Center Trending
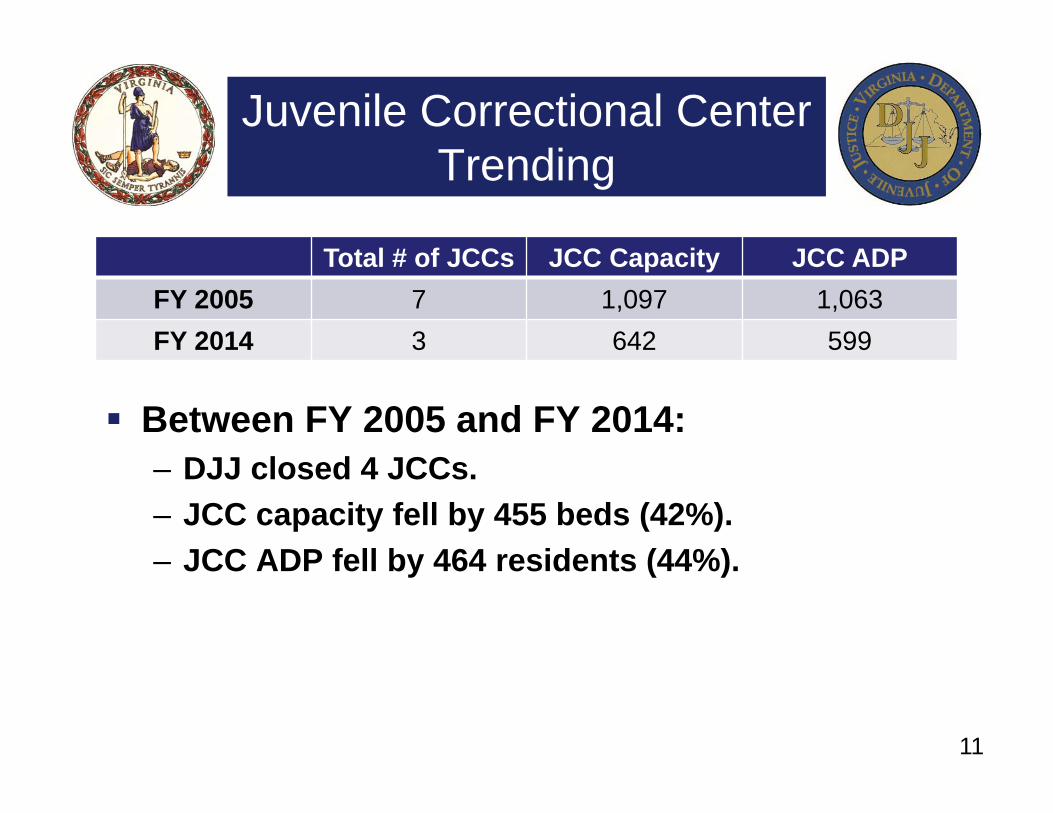
Total # of JCCs JCC Capacity JCC ADPFY 2005 7 1,097 1,063FY 2014 3 642 599
Between FY 2005 and FY 2014:– DJJ closed 4 JCCs.– JCC capacity fell by 455 beds (42%).– JCC ADP fell by 464 residents (44%).

12
Current Facilities
13
DJJ Population Trends
Juvenile Intakes
JCC & Juvenile Detention Centers (Detention) Average Daily Population (ADP)
Total Juveniles Supervised by DJJ

14
Juvenile Intakes
67,780 67,771 66,452 64,356 63,551
56,658 53,170 51,757
46,220 43,754
‐
10,000
20,000
30,000
40,000
50,000
60,000
70,000
80,000
2005 2006 2007 2008 2009 2010 2011 2012 2013 2014
Juvenile Intake Cases
•Intakes have decreased by 24,026 cases since FY 2005 (35%).

15
JCC & Detention Average Daily Population (ADP)
•The JCC ADP has decreased by 431 residents since FY 2005 (42%).•The Detention ADP has decreased by 294 juveniles since FY 2005 (29%).
1028 1022 1001943
872
858816
757
693597
1,029 1,074 1,058
1,011 941
804 757 749
726 734
0
200
400
600
800
1000
1200
JCC & Detention Average Daily Population
JCC ADP Detention ADP

16
Admissions & Forecast

17
Total Juveniles Supervised by DJJ
There were an average of 5,941 juveniles per day under DJJ supervision (diversion, probation, direct care, or parole) in FY 2014.*– 5,060 on active probation supervision– 597 in direct care– 284 on active parole supervision
Decrease of 38% from FY 2005 (average of 9,548 juveniles per day under DJJ supervision)

18
Most Serious Committing Offense by Severity (FY 2014)
Commitments (determinate and indeterminate) for:– Any felony: 85.3%– Felonies against persons: 48.8%– Non-person felony offenses: 36.5%– Misdemeanor offenses: 11.4%– Any non-person offense: 45.2%– Violations of parole: 3.3%
Indeterminate Commitments: – Any felony: 81.6%– Felonies against persons: 39.1%– Non-person felony offenses: 42.5%– Misdemeanor offenses: 14.3%– Any non-person offense: 53.4%– Violations of parole: 4.1%
* Detention Assessment Instrument Categories Used for Subdivision of Offense Types

19
Previous TraumaEducational Challenges
Mental Health Needs
65% - parent criminal activity 50% - parent death or abandonment 21% - family domestic violence
Average of 2.6 grade levels behind 43% designated as special education 80% had substantial school attendance problems in the
community
97% of juveniles admitted to RDC had significant symptoms of at least one mental health disorder.

20
Recidivism
12-Month Rates
Probation Placements– Rearrest: 37%– Reconviction: 24%
Direct Care Releases– Rearrest: 48%– Reconviction: 37%– Reincarceration: 18%
Sample = FY 2011
36-Month Rates
Probation Placements– Rearrest: 62%– Reconviction: 48%
Direct Care Releases– Rearrest: 79%– Reconviction: 70%– Reincarceration: 47%
Sample =FY 2009

21
Prison Rape Elimination Act (PREA)
Staffing Ratios (Effective Date: October 1, 2017. – Each secure juvenile facility shall maintain
staff ratios of a minimum of 1:8 during resident waking hours and 1:16 during resident sleeping hours
– 2014 Appropriation Act added 72 juvenile correctional officer positions in FY2016 to meet the new PREA standards

22
Future Needs &DJJ Initiatives
1. Budget Preservation2. JCC Reform3. Restore Effective Continuum of Care4. Reentry Planning & Practice5. Evidence Based Practices and D3
– Fidelity to Risk Assessment Instruments and Practice
– Family Engagement– Evidence Based Interventions

Questions?


